Embed Size (px)
Citation preview
Excellence by Design
“We Manufacture Materials That Make
the World
GREENER – STRONGER – SMARTER”
Purpose
World Non-Ferrous Conference – Mumbai
Organized by MTLEXS
08th September 2017Mr. J.C. Laddha
CEO (Copper Business)Hindalco Industries Limited
Turnover: $17 bn
EBITDA: $2 bn
Market Cap: $6.5 bn
Asset Base: $ 13.3 bn
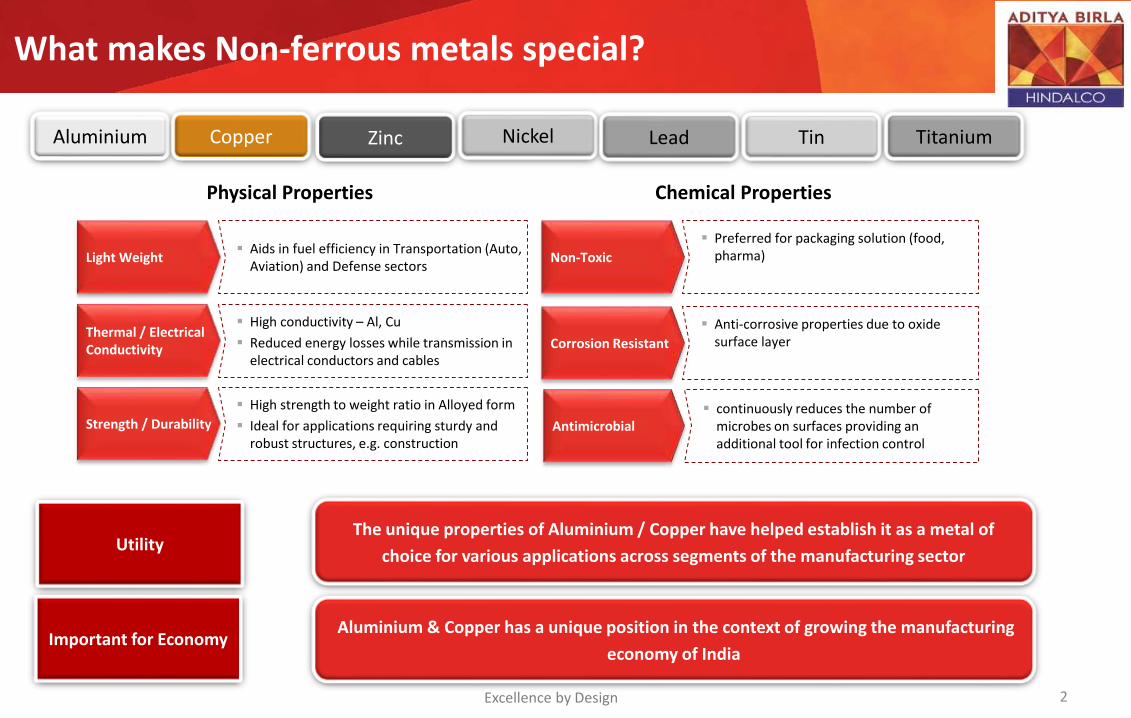
What makes Non-ferrous metals special?
2
Utility
Aluminium & Copper has a unique position in the context of growing the manufacturing
economy of IndiaImportant for Economy
The unique properties of Aluminium / Copper have helped establish it as a metal of
choice for various applications across segments of the manufacturing sector
Light Weight Aids in fuel efficiency in Transportation (Auto,
Aviation) and Defense sectors
Corrosion Resistant
Anti-corrosive properties due to oxide surface layer
Thermal / Electrical Conductivity
High conductivity – Al, Cu
Reduced energy losses while transmission in electrical conductors and cables
Strength / Durability
High strength to weight ratio in Alloyed form
Ideal for applications requiring sturdy and robust structures, e.g. construction
Antimicrobial continuously reduces the number of
microbes on surfaces providing an additional tool for infection control
Non-Toxic
Preferred for packaging solution (food, pharma)
Physical Properties Chemical Properties
Excellence by Design
Aluminium Copper Zinc Nickel Lead Tin Titanium
0
5
10
Ch
ina
Ch
ile
Jap
an
USA
Ru
ssia
DR
Co
ngo
Ind
ia
Sou
th K
ore
a
Ger
man
y
Po
lan
d
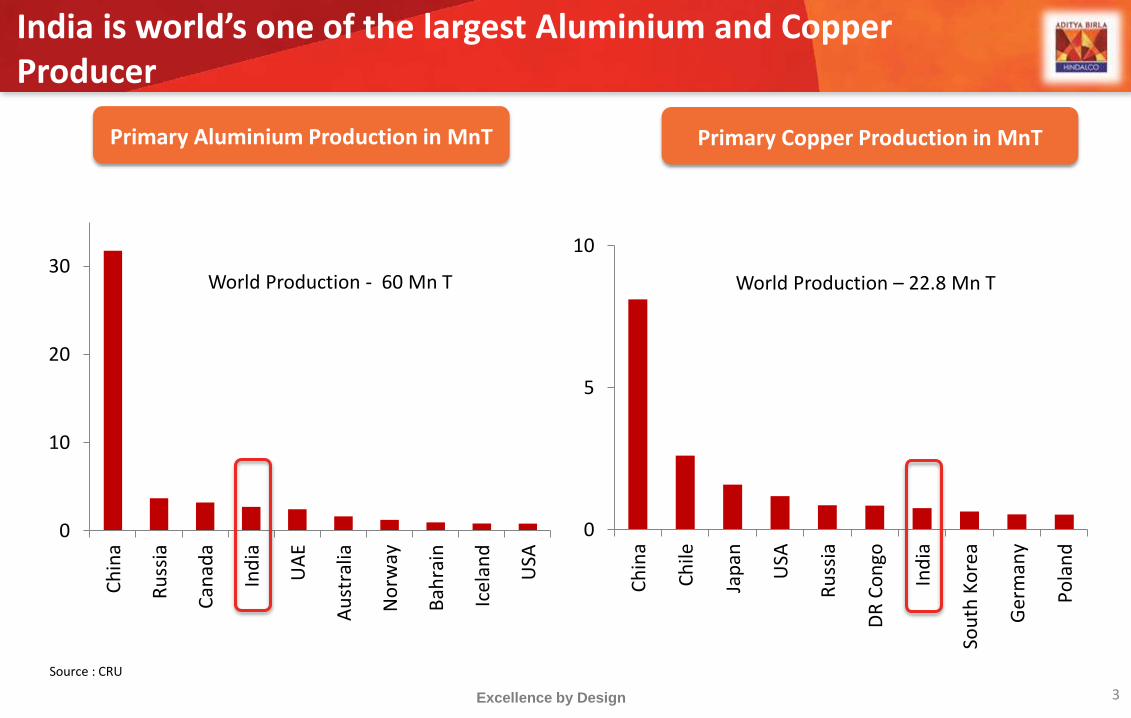
India is world’s one of the largest Aluminium and Copper Producer
3Excellence by Design
Primary Aluminium Production in MnT
0
10
20
30
Ch
ina
Ru
ssia
Can
ada
Ind
ia
UA
E
Au
stra
lia
No
rway
Bah
rain
Icel
and
USA
Primary Copper Production in MnT
World Production - 60 Mn T World Production – 22.8 Mn T
Source : CRU
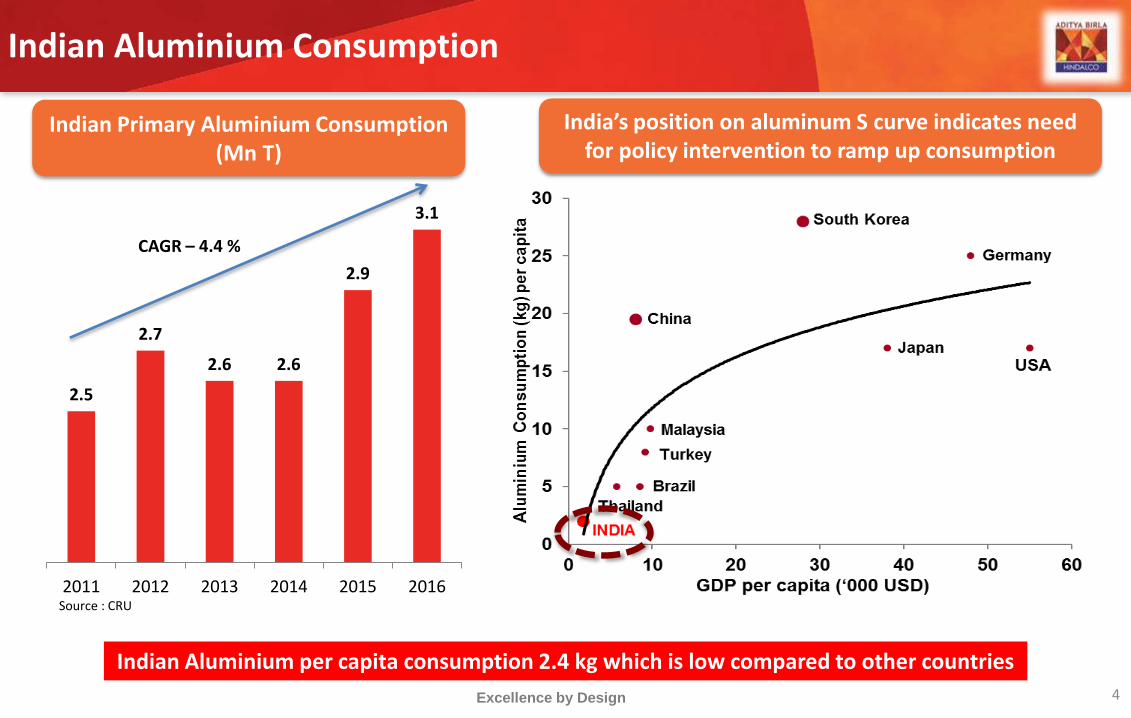
Indian Aluminium Consumption
4
India’s position on aluminum S curve indicates need for policy intervention to ramp up consumption
Excellence by Design
Source : CRU
Indian Primary Aluminium Consumption (Mn T)
2.5
2.7
2.6 2.6
2.9
3.1
2011 2012 2013 2014 2015 2016
CAGR – 4.4 %
Indian Aluminium per capita consumption 2.4 kg which is low compared to other countries
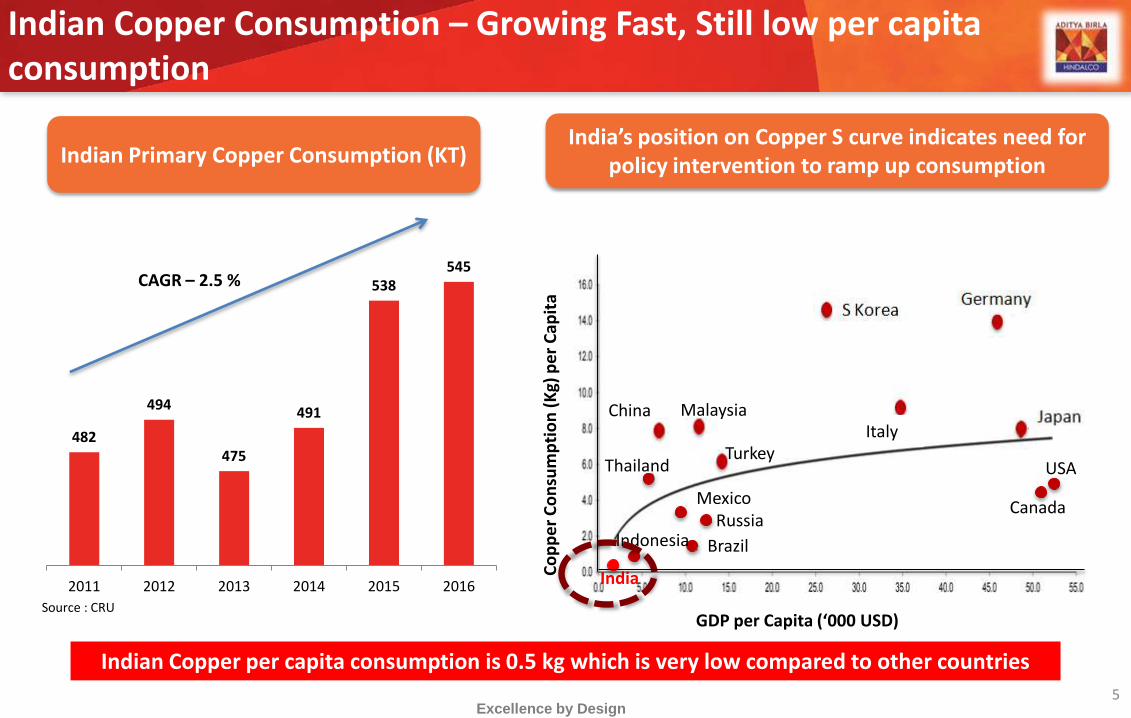
Indian Copper Consumption – Growing Fast, Still low per capita consumption
5
Indian Primary Copper Consumption (KT) India’s position on Copper S curve indicates need for
policy intervention to ramp up consumption
Co
pp
er
Co
nsu
mp
tio
n (
Kg)
pe
r C
apit
a
Italy
Canada
USA
Russia
Brazil
Mexico
Indonesia
India
Thailand
China Malaysia
Turkey
GDP per Capita (‘000 USD)
482
494
475
491
538545
2011 2012 2013 2014 2015 2016
Excellence by Design
Source : CRU
CAGR – 2.5 %
Indian Copper per capita consumption is 0.5 kg which is very low compared to other countries
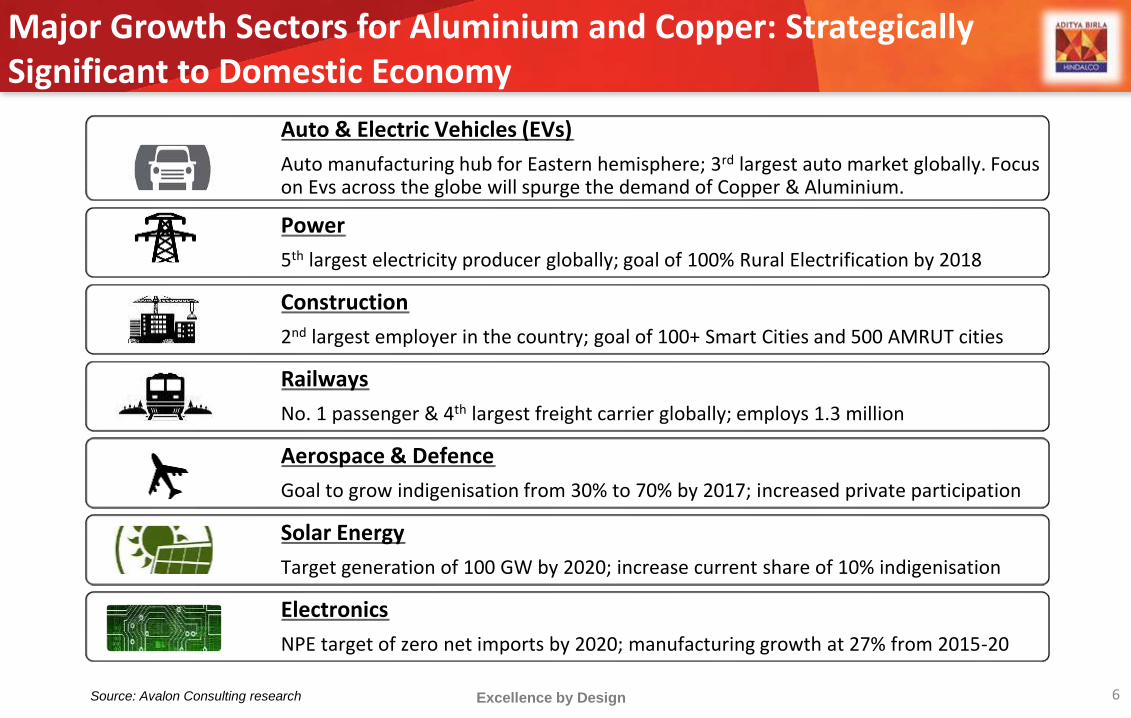
Major Growth Sectors for Aluminium and Copper: Strategically Significant to Domestic Economy
6Source: Avalon Consulting research
Auto & Electric Vehicles (EVs)
Auto manufacturing hub for Eastern hemisphere; 3rd largest auto market globally. Focus on Evs across the globe will spurge the demand of Copper & Aluminium.
Power
5th largest electricity producer globally; goal of 100% Rural Electrification by 2018
Construction
2nd largest employer in the country; goal of 100+ Smart Cities and 500 AMRUT cities
Railways
No. 1 passenger & 4th largest freight carrier globally; employs 1.3 million
Aerospace & Defence
Goal to grow indigenisation from 30% to 70% by 2017; increased private participation
Solar Energy
Target generation of 100 GW by 2020; increase current share of 10% indigenisation
Electronics
NPE target of zero net imports by 2020; manufacturing growth at 27% from 2015-20
Excellence by Design
Excellence by Design7
Development of Aluminium Industry in
China- A Unique Case Study
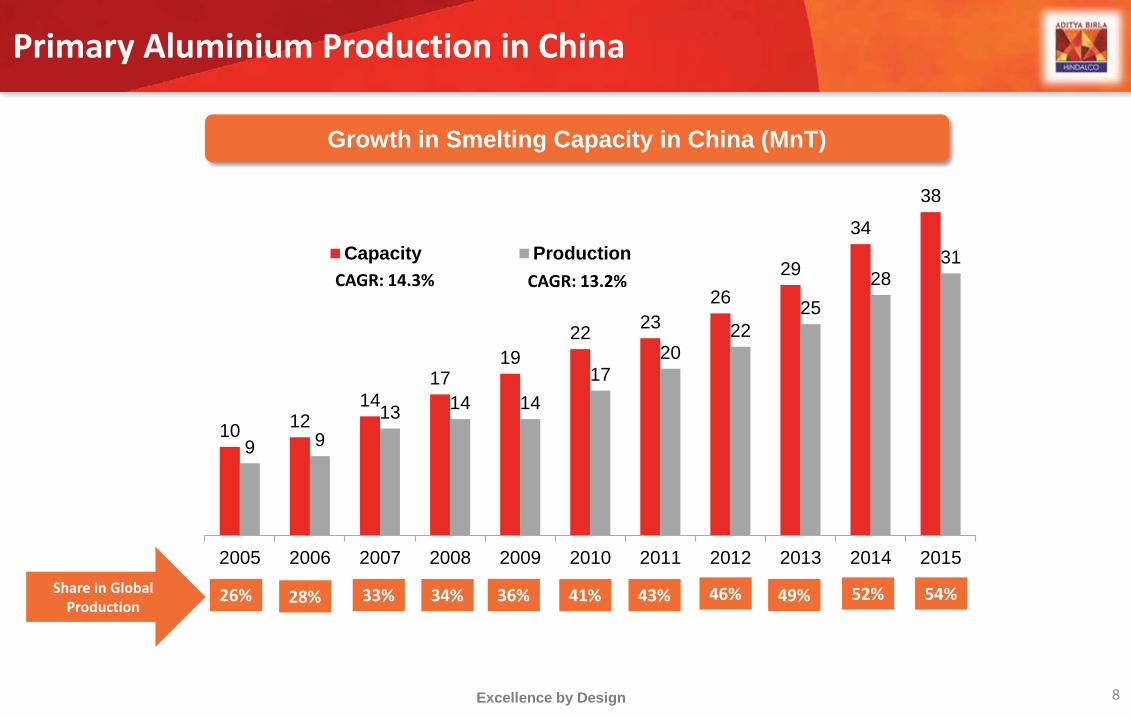
Primary Aluminium Production in China
8Excellence by Design
1012
14
1719
2223
26
29
34
38
9 9
1314 14
1720
22
25
2831
2005 2006 2007 2008 2009 2010 2011 2012 2013 2014 2015
Capacity Production
Growth in Smelting Capacity in China (MnT)
Share in Global Production
54%52%49%46%43%36%34%33%28%26% 41%
CAGR: 14.3% CAGR: 13.2%
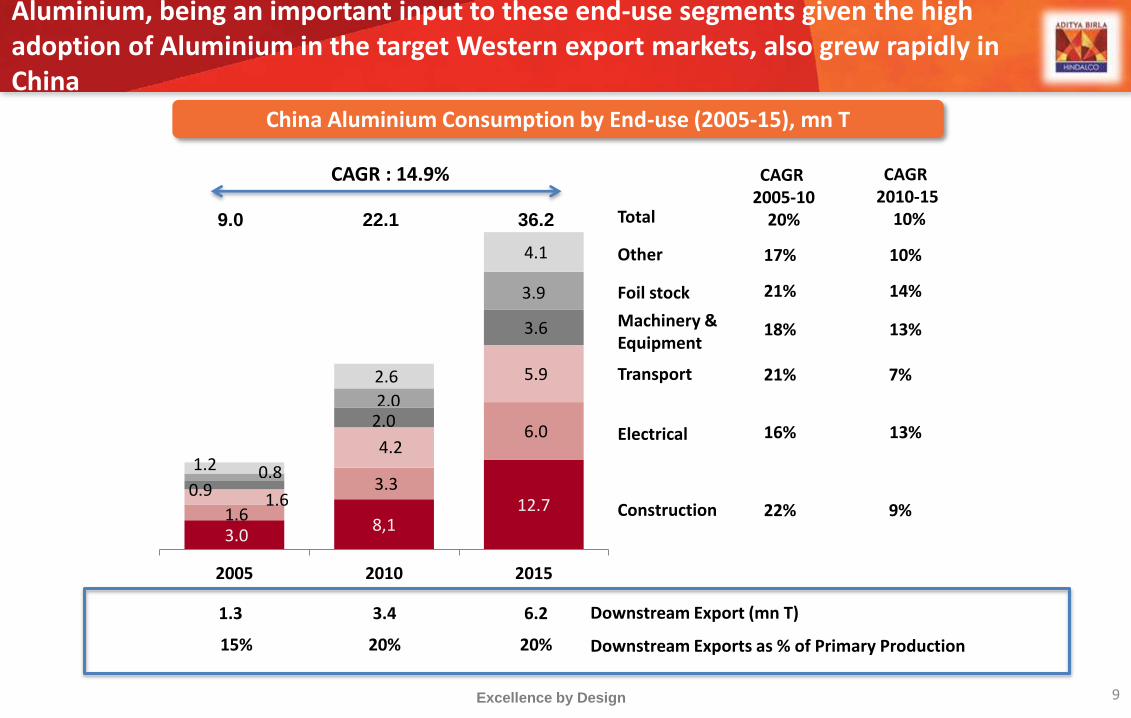
Aluminium, being an important input to these end-use segments given the high adoption of Aluminium in the target Western export markets, also grew rapidly in China
9Excellence by Design
China Aluminium Consumption by End-use (2005-15), mn T
3.0 8,1
12.71.6
3.3
6.0
1.6
4.2
5.9
0.9
2.0
3.6
0.8
2.0
3.9
1.2
2.6
4.1
2005 2010 2015
Construction
Electrical
Transport
Foil stock
Other
CAGR2005-10
20%
CAGR 2010-15
10%9.0 22.1 36.2
Machinery & Equipment
Total
17%
21%
18%
21%
16%
22%
10%
14%
13%
7%
13%
9%
15% 20% 20% Downstream Exports as % of Primary Production
Downstream Export (mn T)1.3 3.4 6.2
CAGR : 14.9%
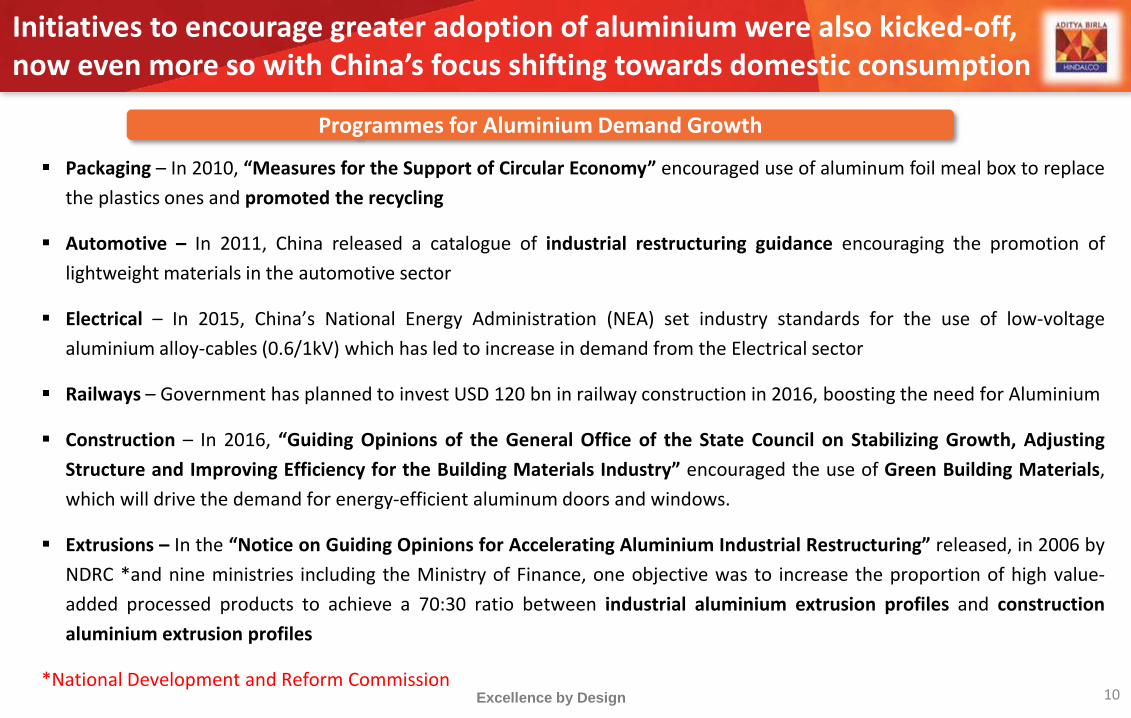
Initiatives to encourage greater adoption of aluminium were also kicked-off, now even more so with China’s focus shifting towards domestic consumption
10Excellence by Design
Packaging – In 2010, “Measures for the Support of Circular Economy” encouraged use of aluminum foil meal box to replace
the plastics ones and promoted the recycling
Automotive – In 2011, China released a catalogue of industrial restructuring guidance encouraging the promotion of
lightweight materials in the automotive sector
Electrical – In 2015, China’s National Energy Administration (NEA) set industry standards for the use of low-voltage
aluminium alloy-cables (0.6/1kV) which has led to increase in demand from the Electrical sector
Railways – Government has planned to invest USD 120 bn in railway construction in 2016, boosting the need for Aluminium
Construction – In 2016, “Guiding Opinions of the General Office of the State Council on Stabilizing Growth, Adjusting
Structure and Improving Efficiency for the Building Materials Industry” encouraged the use of Green Building Materials,
which will drive the demand for energy-efficient aluminum doors and windows.
Extrusions – In the “Notice on Guiding Opinions for Accelerating Aluminium Industrial Restructuring” released, in 2006 by
NDRC *and nine ministries including the Ministry of Finance, one objective was to increase the proportion of high value-
added processed products to achieve a 70:30 ratio between industrial aluminium extrusion profiles and construction
aluminium extrusion profiles
*National Development and Reform Commission
Programmes for Aluminium Demand Growth
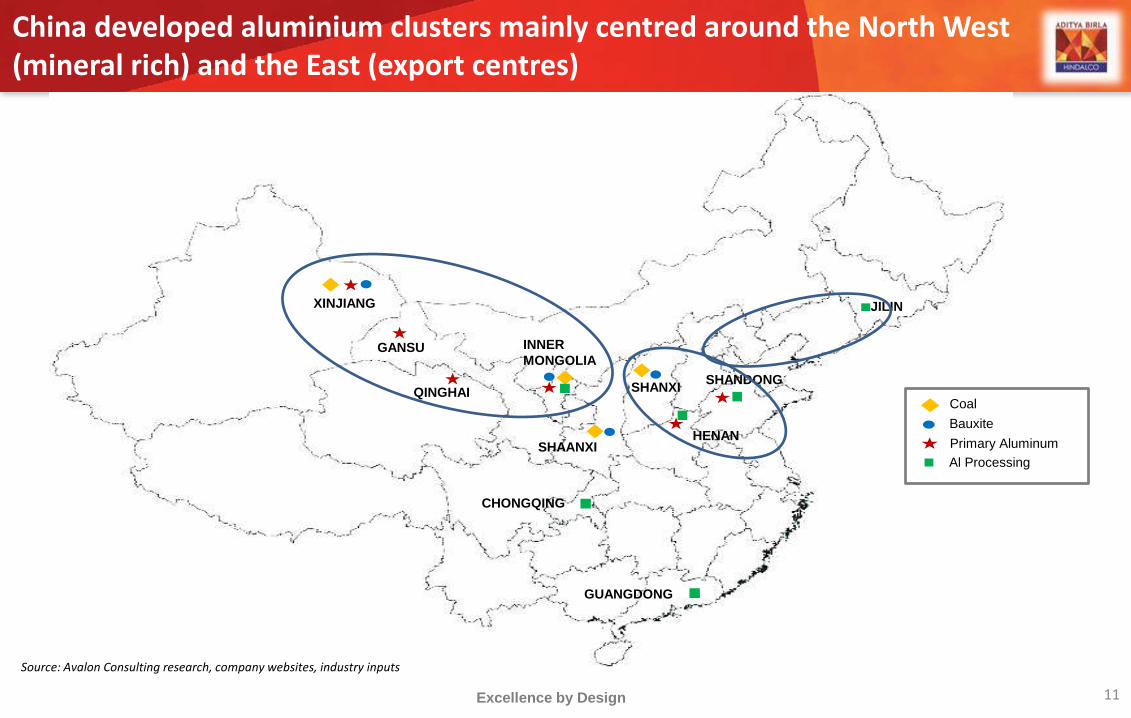
China developed aluminium clusters mainly centred around the North West (mineral rich) and the East (export centres)
11Excellence by Design
XINJIANG
INNER
MONGOLIA
SHANXI
SHAANXI
SHANDONG
HENAN
GANSU
QINGHAI
CHONGQING
GUANGDONG
JILIN
Coal
Primary Aluminum
Bauxite
Al Processing
Source: Avalon Consulting research, company websites, industry inputs
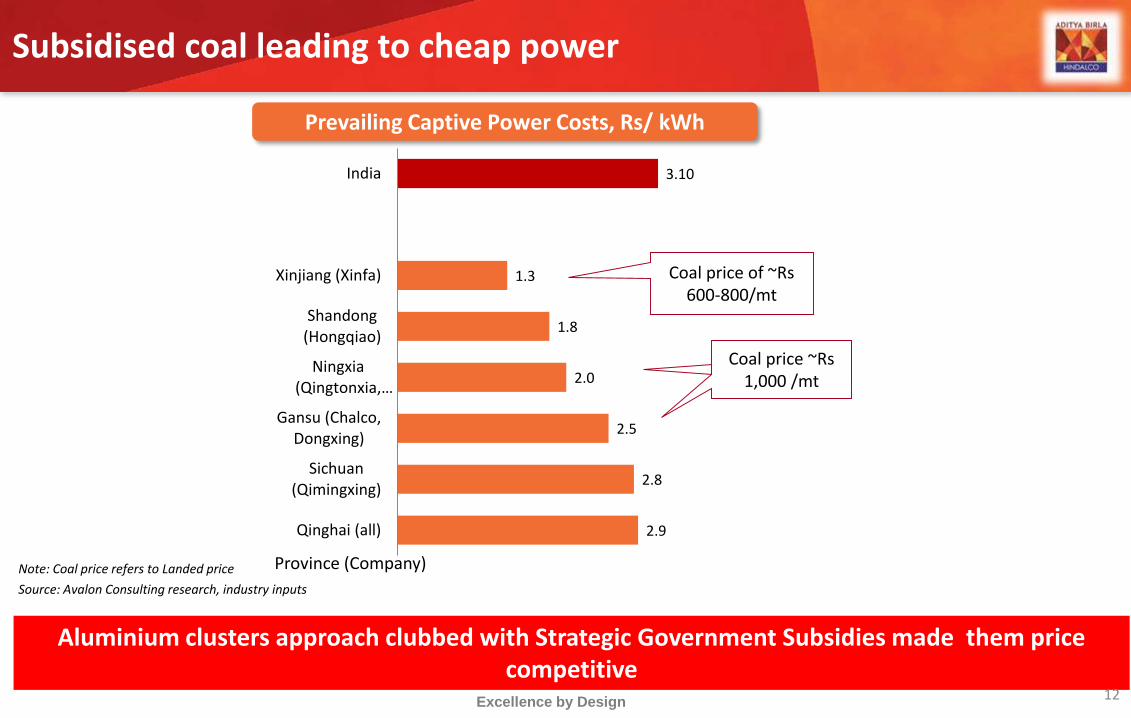
Aluminium clusters approach clubbed with Strategic Government Subsidies made them price competitive
Subsidised coal leading to cheap power
12Excellence by Design
2.9
2.8
2.5
2.0
1.8
1.3
3.10
Qinghai (all)
Sichuan(Qimingxing)
Gansu (Chalco,Dongxing)
Ningxia(Qingtonxia,…
Shandong(Hongqiao)
Xinjiang (Xinfa)
India
Prevailing Captive Power Costs, Rs/ kWh
Province (Company)
Source: Avalon Consulting research, industry inputs
Coal price of ~Rs 600-800/mt
Coal price ~RMB 100/mtCoal price ~Rs
1,000 /mt
Note: Coal price refers to Landed price
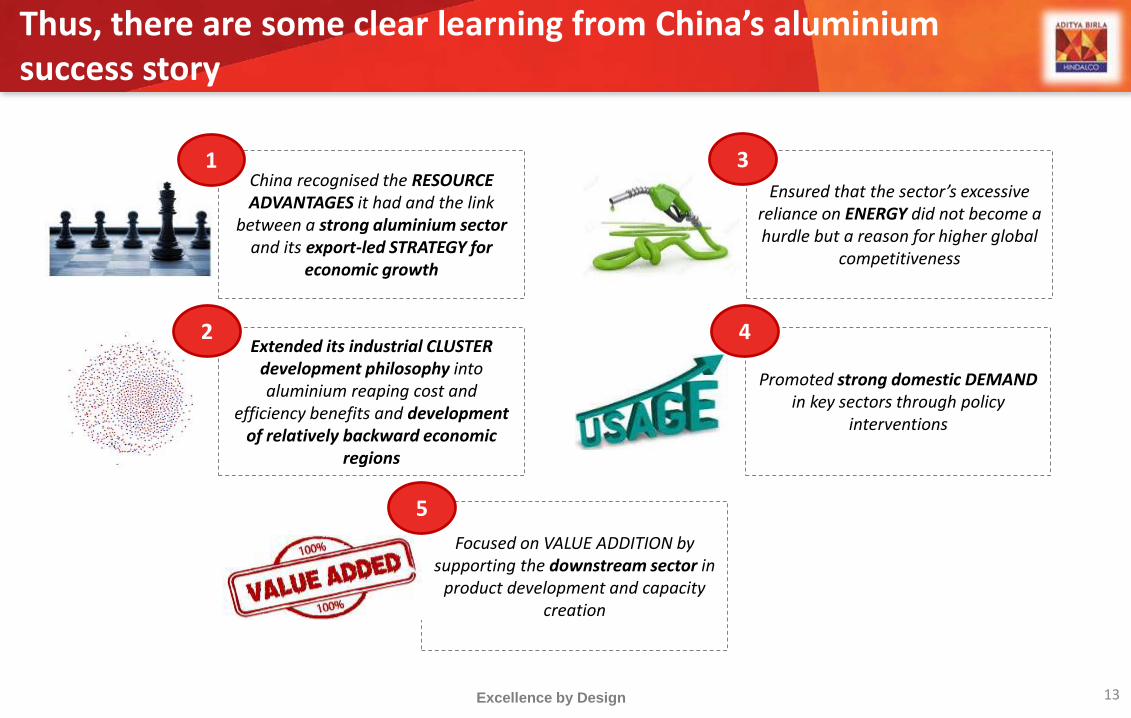
Thus, there are some clear learning from China’s aluminium success story
13Excellence by Design
Ensured that the sector’s excessive reliance on ENERGY did not become a hurdle but a reason for higher global
competitiveness
China recognised the RESOURCE ADVANTAGES it had and the link
between a strong aluminium sector and its export-led STRATEGY for
economic growth
Extended its industrial CLUSTER development philosophy into aluminium reaping cost and
efficiency benefits and development of relatively backward economic
regions
Promoted strong domestic DEMAND in key sectors through policy
interventions
Focused on VALUE ADDITION by supporting the downstream sector in
product development and capacity creation
1
2
3
4
5
Excellence by Design 14
How can we grow the
Indian Aluminium / Copper Industry
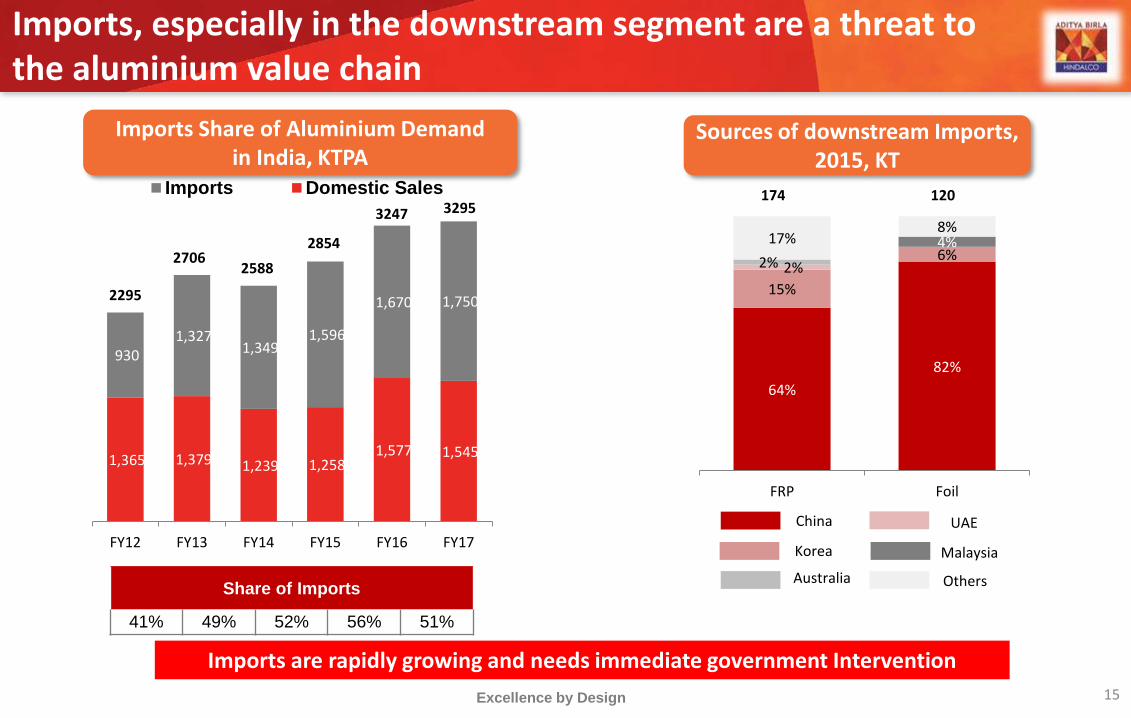
Imports, especially in the downstream segment are a threat to the aluminium value chain
15Excellence by Design
Imports Share of Aluminium Demand in India, KTPA
1,365 1,379 1,239 1,258 1,577 1,545
930 1,327
1,349 1,596
1,670 1,750
FY12 FY13 FY14 FY15 FY16 FY17
Imports Domestic Sales
Share of Imports
41% 49% 52% 56% 51%
Sources of downstream Imports, 2015, KT
64%
82%
15%
6%2%
4%
2%
17%8%
FRP Foil
120174
UAE
Korea
Australia
Malaysia
China
Others
Imports are rapidly growing and needs immediate government Intervention
2295
27062588
2854
3247 3295
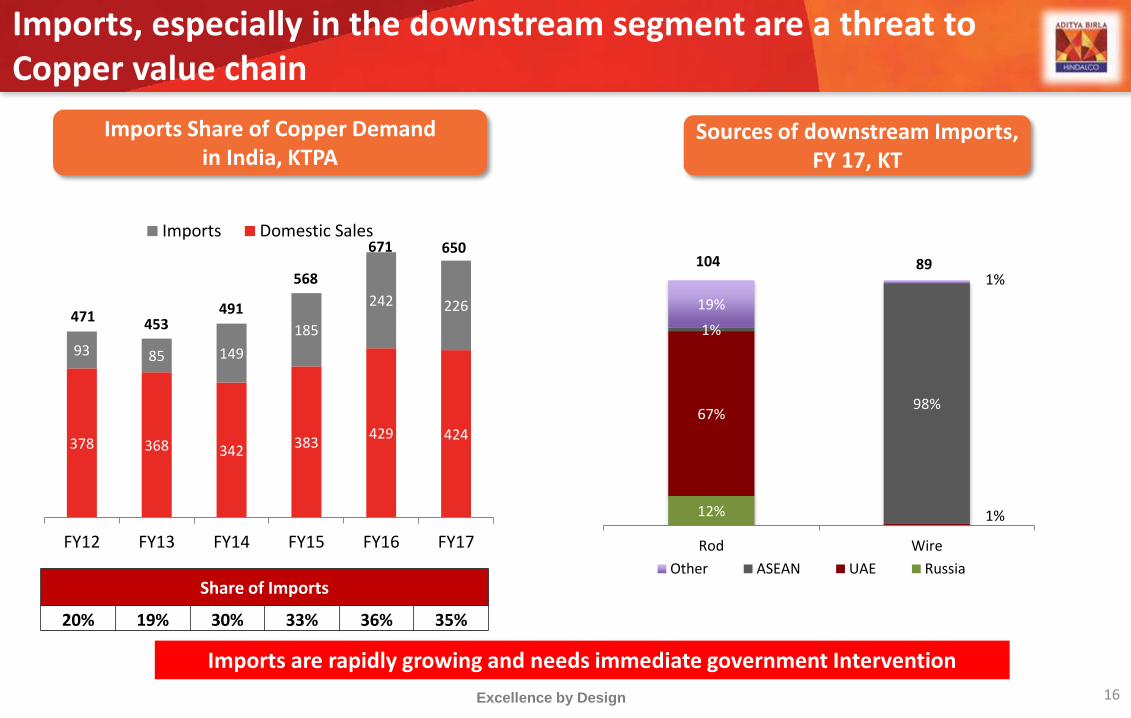
16Excellence by Design
378 368 342383
429 424
93 85 149
185
242 226
FY12 FY13 FY14 FY15 FY16 FY17
Imports Domestic Sales
Share of Imports
20% 19% 30% 33% 36% 35%
Imports Share of Copper Demand in India, KTPA
Sources of downstream Imports, FY 17, KT
Imports, especially in the downstream segment are a threat to Copper value chain
Imports are rapidly growing and needs immediate government Intervention
471 453491
568
671 650
12%
67%
1%
1%
98%
19%
1%
Rod Wire
Other ASEAN UAE Russia
104 89
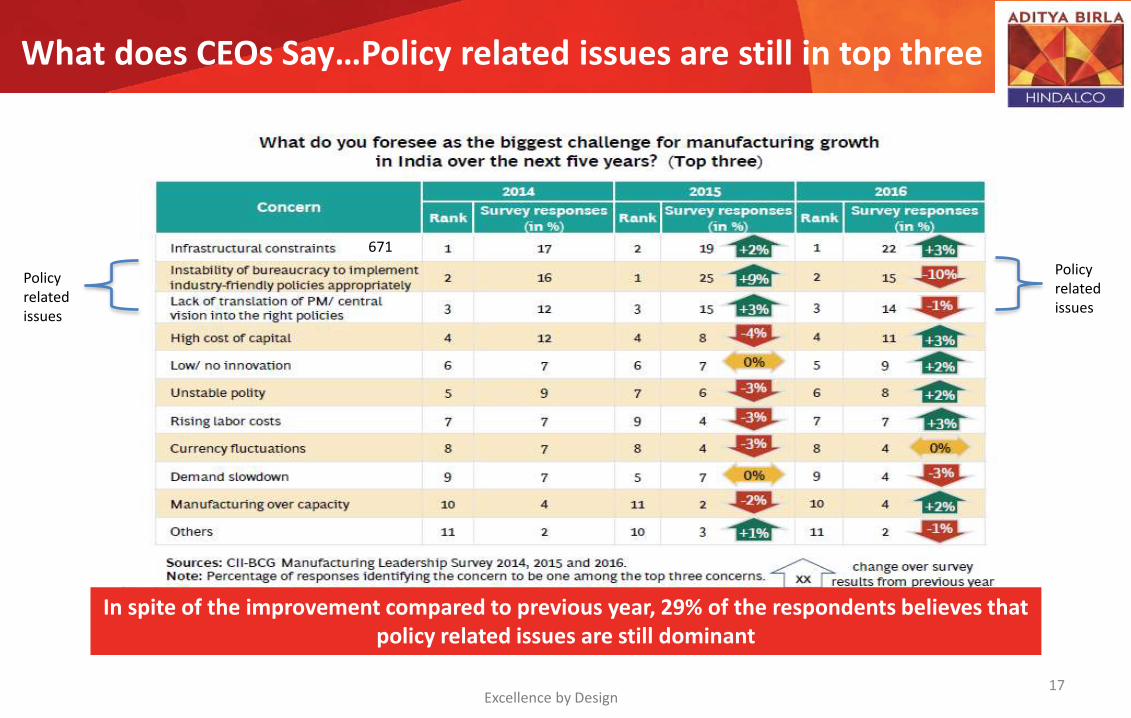
What does CEOs Say…Policy related issues are still in top three
17
In spite of the improvement compared to previous year, 29% of the respondents believes that policy related issues are still dominant
Policy related issues
Policy related issues
Excellence by Design
671
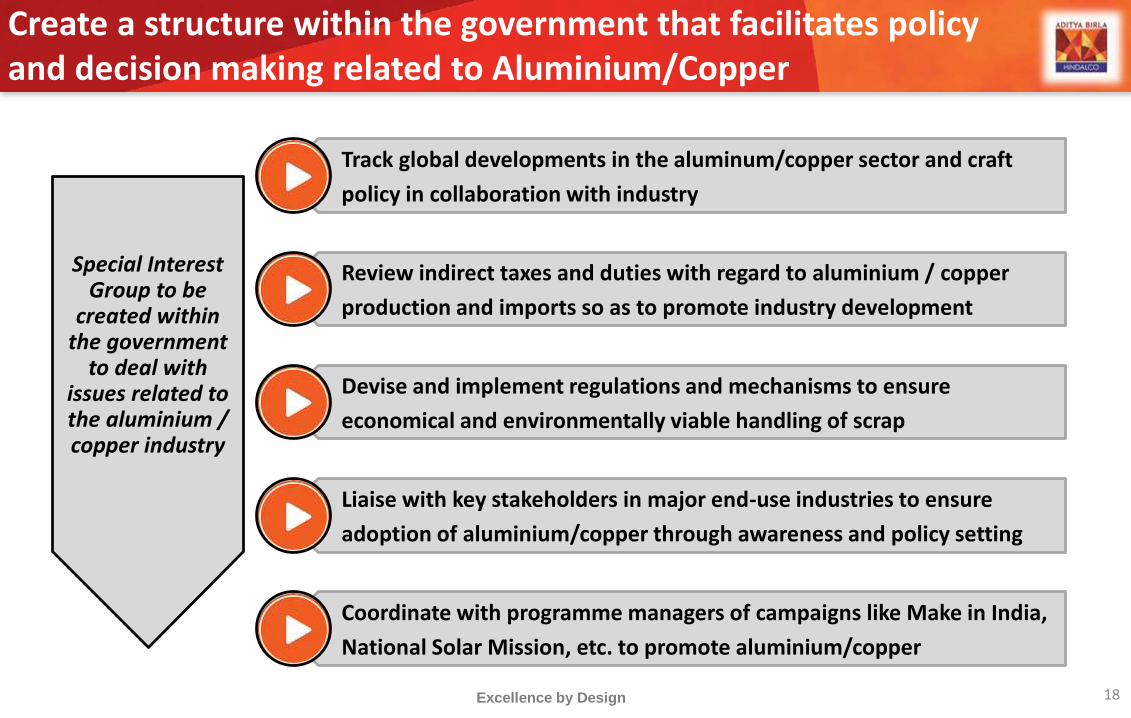
Create a structure within the government that facilitates policy and decision making related to Aluminium/Copper
18Excellence by Design
Special Interest Group to be
created within the government
to deal with issues related to the aluminium / copper industry
Track global developments in the aluminum/copper sector and craft
policy in collaboration with industry
Review indirect taxes and duties with regard to aluminium / copper
production and imports so as to promote industry development
Devise and implement regulations and mechanisms to ensure
economical and environmentally viable handling of scrap
Liaise with key stakeholders in major end-use industries to ensure
adoption of aluminium/copper through awareness and policy setting
Coordinate with programme managers of campaigns like Make in India,
National Solar Mission, etc. to promote aluminium/copper
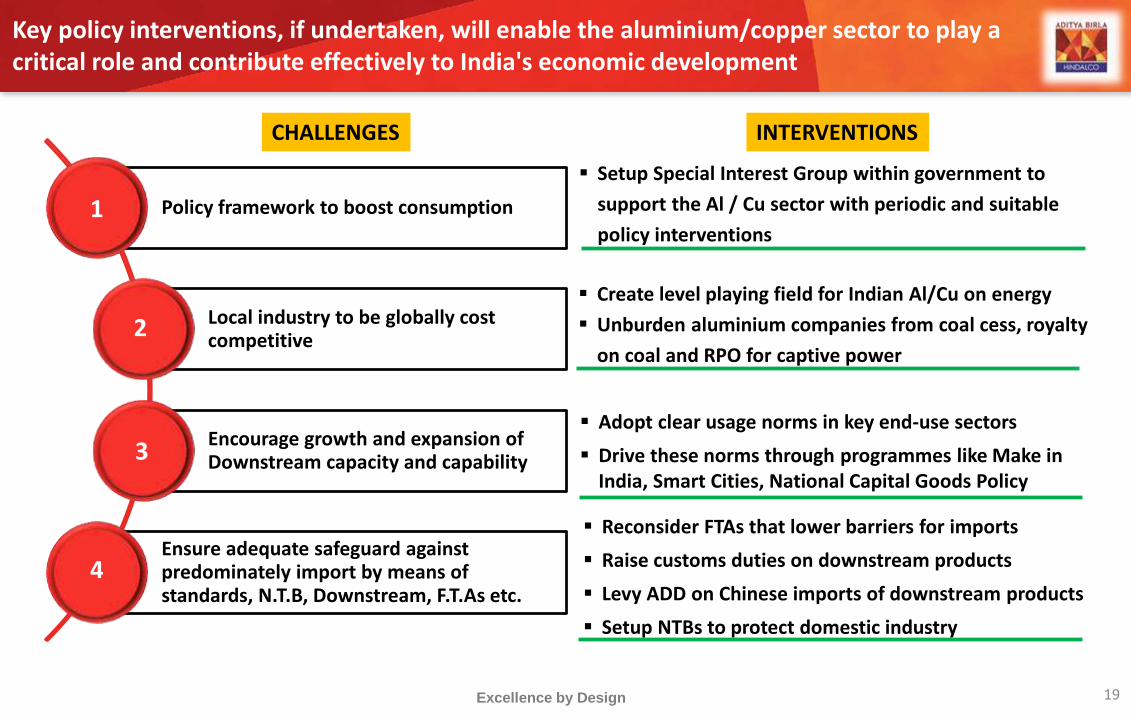
Key policy interventions, if undertaken, will enable the aluminium/copper sector to play a critical role and contribute effectively to India's economic development
19Excellence by Design
Policy framework to boost consumption
Local industry to be globally cost competitive
Encourage growth and expansion of Downstream capacity and capability
Ensure adequate safeguard against predominately import by means of standards, N.T.B, Downstream, F.T.As etc.
1
2
3
4
Setup Special Interest Group within government to
support the Al / Cu sector with periodic and suitable
policy interventions
Create level playing field for Indian Al/Cu on energy
Unburden aluminium companies from coal cess, royalty
on coal and RPO for captive power
CHALLENGES INTERVENTIONS
Adopt clear usage norms in key end-use sectors
Drive these norms through programmes like Make in India, Smart Cities, National Capital Goods Policy
Reconsider FTAs that lower barriers for imports
Raise customs duties on downstream products
Levy ADD on Chinese imports of downstream products
Setup NTBs to protect domestic industry
Excellence by Design20
Thank You