Embed Size (px)
Citation preview

££
£
£$$$
¥€ €€ £
££
£
$$$ ¥ €€
€€£
££
£$$$
$
£££
£
$$$ ¥€
£
£
£
$
$
$££
£
£
$
$
$¥
€
££$ $
¥€€
€
€£ £
£
£
$ $
$
¥€€
$
£££
$$$ £
££
£$$$
¥
€
£
£$
££ $ ¥€€€€ £
££ £$
$
¥€
€$
£
£
€
£
£ £
$
$
$ ¥€€€€ ££
£
$$
$¥
€
€
$
£
£
£$ $
¥
£ £
££
$ $$
¥
€
£
£ £ $¥€€
€€
£
££
£
$
$$ ¥€ €$
£
£
£$$
¥ ££
£
$$
¥€
£$£€£ £
£$ $¥
€€
£$
££$
£
$$
£$
€££
£
$$
¥€
¥$£
££
€
$
£
$¥
$
££€
$€
£ £
$$
€
¥$£ $£
£€
$
£
€£ £€
€£$
€ ££ £$
$
¥€
¥
$£$
££€$£ €
£
¥
€£€
£
£
$
€
¥
$
£
$£€
$€
££
££
€ ££
$
£
$€
€
2015
INTERNATIONALINVESTMENT ATLAS
A Cushman & Wakefield Capital Markets Research Publication
1
International Investment Atlas 2015
INTRODUCTION
Welcome to the Cushman & Wakefield International Investment Atlas publication. This report has been prepared by Cushman & Wakefield to provide an overview of the world’s key commercial real estate investment markets in 2014 and an indication of performance in 2015.
The report Overview discusses the main areas of activity, highlighting the size and status of each and giving a flavour for the real estate sectors, also including a brief exploration on where each is heading.
This overview is supplemented by three Regional Market Profiles for the Americas, Asia Pacific and EMEA, all of which include page by page country overviews, totalling 59 across the globe. New this year, we have also highlighted the primary trends and performance indicators for each global region and presented these in a visual page for quick reference.
All sections of the report and a list of global capital market contacts are free to download at our dedicated report website: investmentatlas.cushwake.com
CONTENTS
Rebalancing the Market 2
A Summary of 2014 3
Regional Trends 4
The Investors 4
Investment Targets 5
Macro Position 7
Asia Pacific 9
EMEA 10
Latin America 11
North America 12
Outlook and Strategy 13
Moving up the Risk Curve 14
Global Investment Volumes 16
Global Yields 18
Research Services and About the Report 19
Capital Markets Services 20
Global Capital Markets Contacts 21
Regional Market Profiles Summary 23
About Cushman & Wakefield 24
FOLLOW US
@CushwakeInsight
CushwakeInsight
Cushman & Wakefield Company Page
View more research reports: cushmanwakefield.com/research-and-insight
2
International Investment Atlas 2015
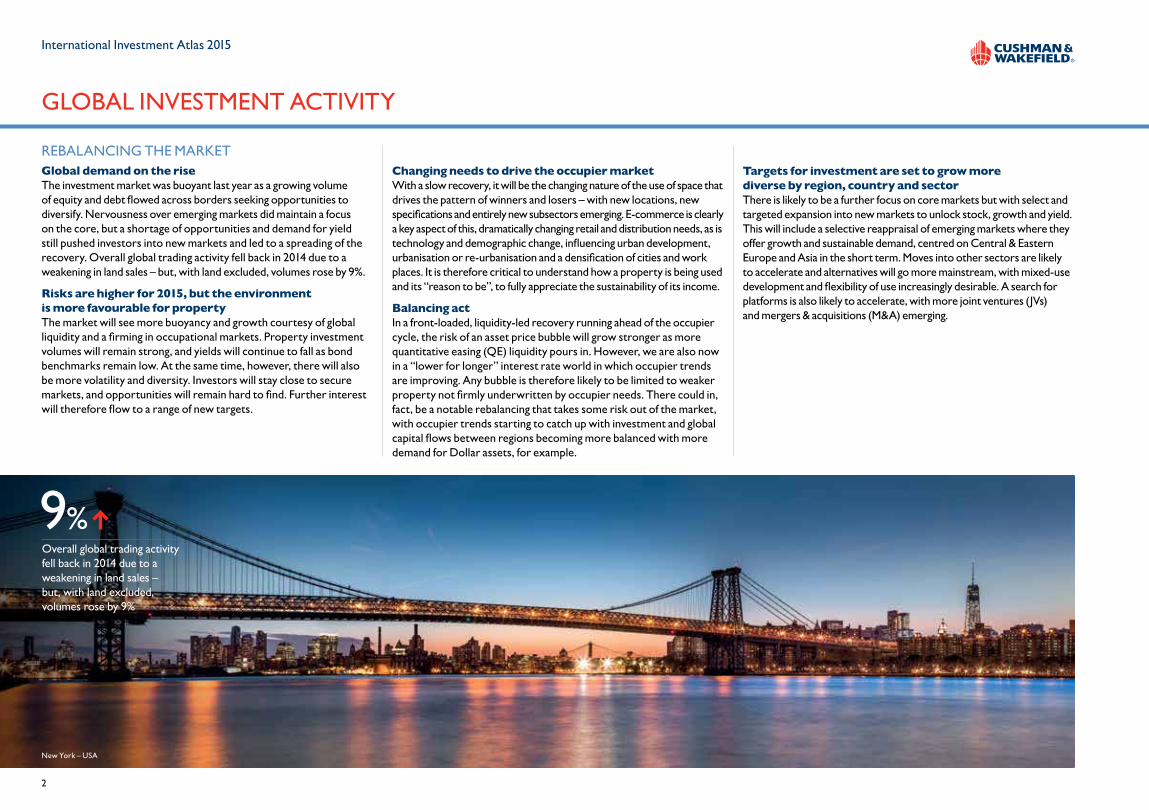
REBALANCING THE MARKETGlobal demand on the riseThe investment market was buoyant last year as a growing volume of equity and debt flowed across borders seeking opportunities to diversify. Nervousness over emerging markets did maintain a focus on the core, but a shortage of opportunities and demand for yield still pushed investors into new markets and led to a spreading of the recovery. Overall global trading activity fell back in 2014 due to a weakening in land sales – but, with land excluded, volumes rose by 9%.
Risks are higher for 2015, but the environment is more favourable for property The market will see more buoyancy and growth courtesy of global liquidity and a firming in occupational markets. Property investment volumes will remain strong, and yields will continue to fall as bond benchmarks remain low. At the same time, however, there will also be more volatility and diversity. Investors will stay close to secure markets, and opportunities will remain hard to find. Further interest will therefore flow to a range of new targets.
Changing needs to drive the occupier marketWith a slow recovery, it will be the changing nature of the use of space that drives the pattern of winners and losers – with new locations, new specifications and entirely new subsectors emerging. E-commerce is clearly a key aspect of this, dramatically changing retail and distribution needs, as is technology and demographic change, influencing urban development, urbanisation or re-urbanisation and a densification of cities and work places. It is therefore critical to understand how a property is being used and its “reason to be”, to fully appreciate the sustainability of its income.
Balancing actIn a front-loaded, liquidity-led recovery running ahead of the occupier cycle, the risk of an asset price bubble will grow stronger as more quantitative easing (QE) liquidity pours in. However, we are also now in a “lower for longer” interest rate world in which occupier trends are improving. Any bubble is therefore likely to be limited to weaker property not firmly underwritten by occupier needs. There could in, fact, be a notable rebalancing that takes some risk out of the market, with occupier trends starting to catch up with investment and global capital flows between regions becoming more balanced with more demand for Dollar assets, for example.
Targets for investment are set to grow more diverse by region, country and sector There is likely to be a further focus on core markets but with select and targeted expansion into new markets to unlock stock, growth and yield. This will include a selective reappraisal of emerging markets where they offer growth and sustainable demand, centred on Central & Eastern Europe and Asia in the short term. Moves into other sectors are likely to accelerate and alternatives will go more mainstream, with mixed-use development and flexibility of use increasingly desirable. A search for platforms is also likely to accelerate, with more joint ventures (JVs) and mergers & acquisitions (M&A) emerging.
GLOBAL INVESTMENT ACTIVITY
Overall global trading activity fell back in 2014 due to a weakening in land sales – but, with land excluded, volumes rose by 9%
9%
New York – USA
3
International Investment Atlas 2015
A SUMMARY OF 2014
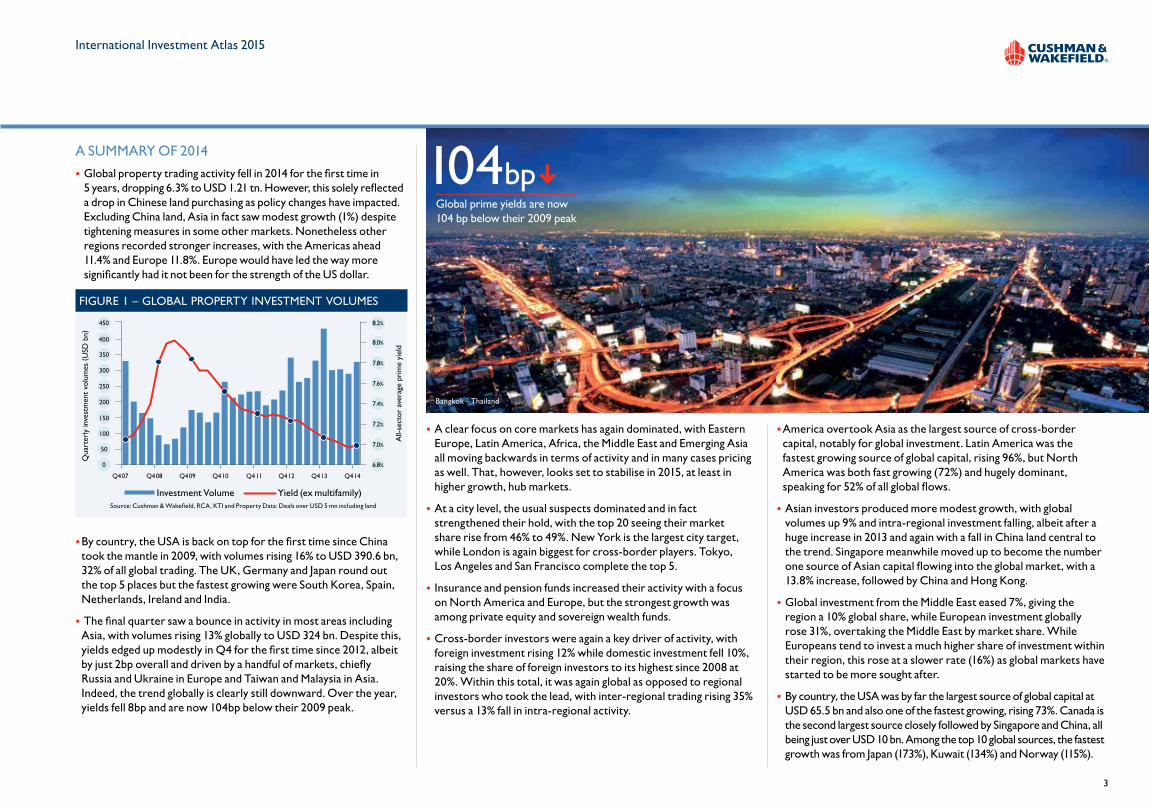
• Global property trading activity fell in 2014 for the first time in 5 years, dropping 6.3% to USD 1.21 tn. However, this solely reflected a drop in Chinese land purchasing as policy changes have impacted. Excluding China land, Asia in fact saw modest growth (1%) despite tightening measures in some other markets. Nonetheless other regions recorded stronger increases, with the Americas ahead 11.4% and Europe 11.8%. Europe would have led the way more significantly had it not been for the strength of the US dollar.
• By country, the USA is back on top for the first time since China took the mantle in 2009, with volumes rising 16% to USD 390.6 bn, 32% of all global trading. The UK, Germany and Japan round out the top 5 places but the fastest growing were South Korea, Spain, Netherlands, Ireland and India.
• The final quarter saw a bounce in activity in most areas including Asia, with volumes rising 13% globally to USD 324 bn. Despite this, yields edged up modestly in Q4 for the first time since 2012, albeit by just 2bp overall and driven by a handful of markets, chiefly Russia and Ukraine in Europe and Taiwan and Malaysia in Asia. Indeed, the trend globally is clearly still downward. Over the year, yields fell 8bp and are now 104bp below their 2009 peak.
FIGURE 1 – GLOBAL PROPERTY INVESTMENT VOLUMES
0
50
100
200
400
450
300
150
250
350
6.8%
7.0%
7.2%
7.4%
7.6%
8.2%
8.0%
7.8%
Q4 07 Q4 08 Q4 09 Q4 10 Q4 11 Q4 12
Qua
rter
ly in
vest
men
t vo
lum
es (
USD
bn)
All-
sect
or a
vera
ge p
rim
e yi
eld
Q4 13 Q4 14
Source: Cushman & Wakefield, RCA, KTI and Property Data: Deals over USD 5 mn including land
Investment Volume Yield (ex multifamily)
Global prime yields are now 104 bp below their 2009 peak
104bp
Bangkok – Thailand
• A clear focus on core markets has again dominated, with Eastern Europe, Latin America, Africa, the Middle East and Emerging Asia all moving backwards in terms of activity and in many cases pricing as well. That, however, looks set to stabilise in 2015, at least in higher growth, hub markets.
• At a city level, the usual suspects dominated and in fact strengthened their hold, with the top 20 seeing their market share rise from 46% to 49%. New York is the largest city target, while London is again biggest for cross-border players. Tokyo, Los Angeles and San Francisco complete the top 5.
• Insurance and pension funds increased their activity with a focus on North America and Europe, but the strongest growth was among private equity and sovereign wealth funds.
• Cross-border investors were again a key driver of activity, with foreign investment rising 12% while domestic investment fell 10%, raising the share of foreign investors to its highest since 2008 at 20%. Within this total, it was again global as opposed to regional investors who took the lead, with inter-regional trading rising 35% versus a 13% fall in intra-regional activity.
• America overtook Asia as the largest source of cross-border capital, notably for global investment. Latin America was the fastest growing source of global capital, rising 96%, but North America was both fast growing (72%) and hugely dominant, speaking for 52% of all global flows.
• Asian investors produced more modest growth, with global volumes up 9% and intra-regional investment falling, albeit after a huge increase in 2013 and again with a fall in China land central to the trend. Singapore meanwhile moved up to become the number one source of Asian capital flowing into the global market, with a 13.8% increase, followed by China and Hong Kong.
• Global investment from the Middle East eased 7%, giving the region a 10% global share, while European investment globally rose 31%, overtaking the Middle East by market share. While Europeans tend to invest a much higher share of investment within their region, this rose at a slower rate (16%) as global markets have started to be more sought after.
• By country, the USA was by far the largest source of global capital at USD 65.5 bn and also one of the fastest growing, rising 73%. Canada is the second largest source closely followed by Singapore and China, all being just over USD 10 bn. Among the top 10 global sources, the fastest growth was from Japan (173%), Kuwait (134%) and Norway (115%).
4
International Investment Atlas 2015
REGIONAL TRENDS
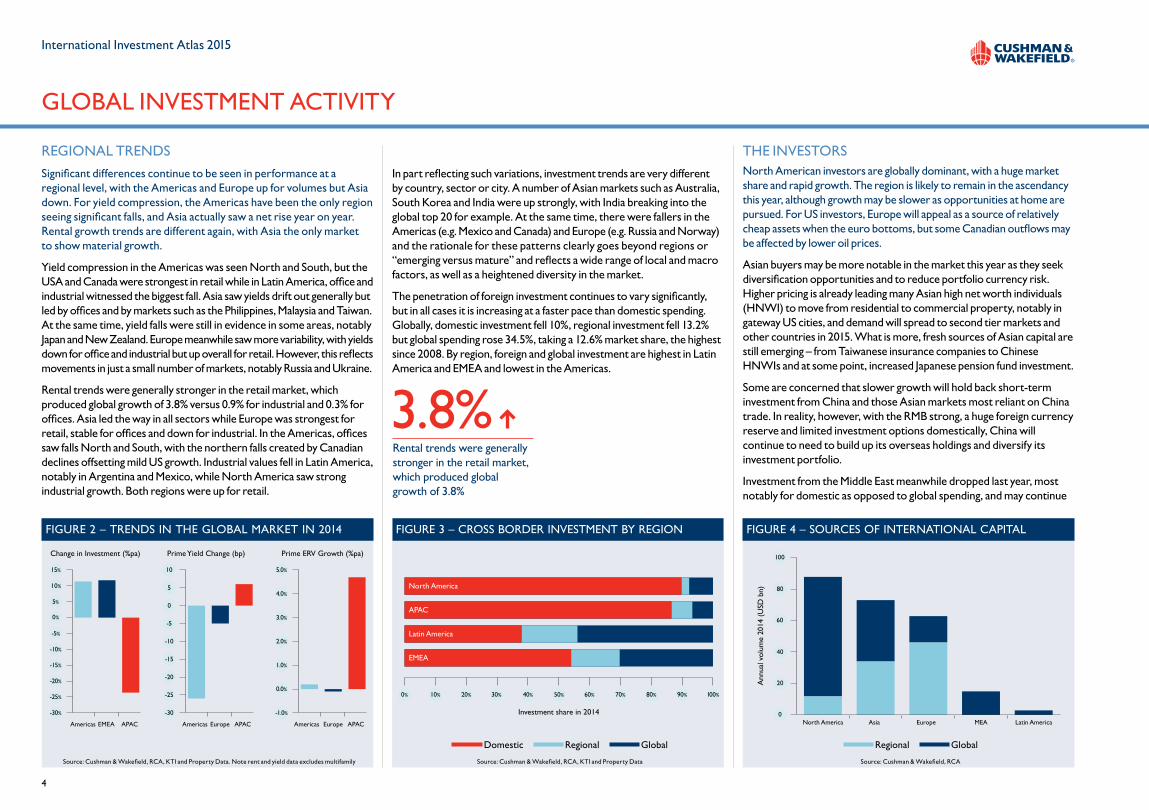
Significant differences continue to be seen in performance at a regional level, with the Americas and Europe up for volumes but Asia down. For yield compression, the Americas have been the only region seeing significant falls, and Asia actually saw a net rise year on year. Rental growth trends are different again, with Asia the only market to show material growth.
Yield compression in the Americas was seen North and South, but the USA and Canada were strongest in retail while in Latin America, office and industrial witnessed the biggest fall. Asia saw yields drift out generally but led by offices and by markets such as the Philippines, Malaysia and Taiwan. At the same time, yield falls were still in evidence in some areas, notably Japan and New Zealand. Europe meanwhile saw more variability, with yields down for office and industrial but up overall for retail. However, this reflects movements in just a small number of markets, notably Russia and Ukraine.
Rental trends were generally stronger in the retail market, which produced global growth of 3.8% versus 0.9% for industrial and 0.3% for offices. Asia led the way in all sectors while Europe was strongest for retail, stable for offices and down for industrial. In the Americas, offices saw falls North and South, with the northern falls created by Canadian declines offsetting mild US growth. Industrial values fell in Latin America, notably in Argentina and Mexico, while North America saw strong industrial growth. Both regions were up for retail.
In part reflecting such variations, investment trends are very different by country, sector or city. A number of Asian markets such as Australia, South Korea and India were up strongly, with India breaking into the global top 20 for example. At the same time, there were fallers in the Americas (e.g. Mexico and Canada) and Europe (e.g. Russia and Norway) and the rationale for these patterns clearly goes beyond regions or “emerging versus mature” and reflects a wide range of local and macro factors, as well as a heightened diversity in the market.
The penetration of foreign investment continues to vary significantly, but in all cases it is increasing at a faster pace than domestic spending. Globally, domestic investment fell 10%, regional investment fell 13.2% but global spending rose 34.5%, taking a 12.6% market share, the highest since 2008. By region, foreign and global investment are highest in Latin America and EMEA and lowest in the Americas.
THE INVESTORSNorth American investors are globally dominant, with a huge market share and rapid growth. The region is likely to remain in the ascendancy this year, although growth may be slower as opportunities at home are pursued. For US investors, Europe will appeal as a source of relatively cheap assets when the euro bottoms, but some Canadian outflows may be affected by lower oil prices.
Asian buyers may be more notable in the market this year as they seek diversification opportunities and to reduce portfolio currency risk. Higher pricing is already leading many Asian high net worth individuals (HNWI) to move from residential to commercial property, notably in gateway US cities, and demand will spread to second tier markets and other countries in 2015. What is more, fresh sources of Asian capital are still emerging – from Taiwanese insurance companies to Chinese HNWIs and at some point, increased Japanese pension fund investment.
Some are concerned that slower growth will hold back short-term investment from China and those Asian markets most reliant on China trade. In reality, however, with the RMB strong, a huge foreign currency reserve and limited investment options domestically, China will continue to need to build up its overseas holdings and diversify its investment portfolio.
Investment from the Middle East meanwhile dropped last year, most notably for domestic as opposed to global spending, and may continue
GLOBAL INVESTMENT ACTIVITY
FIGURE 4 – SOURCES OF INTERNATIONAL CAPITAL
North America Asia Europe MEA Latin America
Ann
ual v
olum
e 20
14 (
USD
bn)
0
20
40
60
80
100
Source: Cushman & Wakefield, RCA
Regional Global
FIGURE 2 – TRENDS IN THE GLOBAL MARKET IN 2014
Americas EMEA APAC Americas Europe APAC Americas Europe APAC
Change in Investment (%pa) Prime Yield Change (bp) Prime ERV Growth (%pa)
-30%
-15%
-20%
-25%
-10%
-5%
0%
15%
10%
5%
-30
-25
-20
-15
10
5
-10
-5
0
5.0%
4.0%
3.0%
2.0%
1.0%
0.0%
-1.0%
Source: Cushman & Wakefield, RCA, KTI and Property Data. Note rent and yield data excludes multifamily
FIGURE 3 – CROSS BORDER INVESTMENT BY REGION
North America
APAC
Latin America
EMEA
Investment share in 2014
10% 20% 30% 40% 50% 60% 70% 80% 90% 100%0%
Source: Cushman & Wakefield, RCA, KTI and Property Data
Domestic Regional Global
3.8%Rental trends were generally stronger in the retail market, which produced global growth of 3.8%
5
International Investment Atlas 2015
to proceed at a slower pace in the short-term as the fall in oil prices hits revenues and diverts investment into home markets. Not all investors or countries will be affected however. Qatar strongly increased its investment in 2014 for example, and some funds will clearly remain very active.
Europe’s presence as a global player is set to increase. Global as opposed to regional investment is already the fastest growing segment of cross-border investment and driven in particular by German interest, this will grow further in 2015. German funds are well established on the global stage but have been less prevalent in recent years as the strong relative performance of Germany itself, fund problems for some and a slowdown in capital inflows all held them back. That, however, is now changing with inflows increasing strongly and a growing trend again towards international investment reflecting higher projected growth as well as the greater choice available in the global market. In addition, a push for diversification is also apparent with some funds looking to reduce their dependency on any one market or economy.
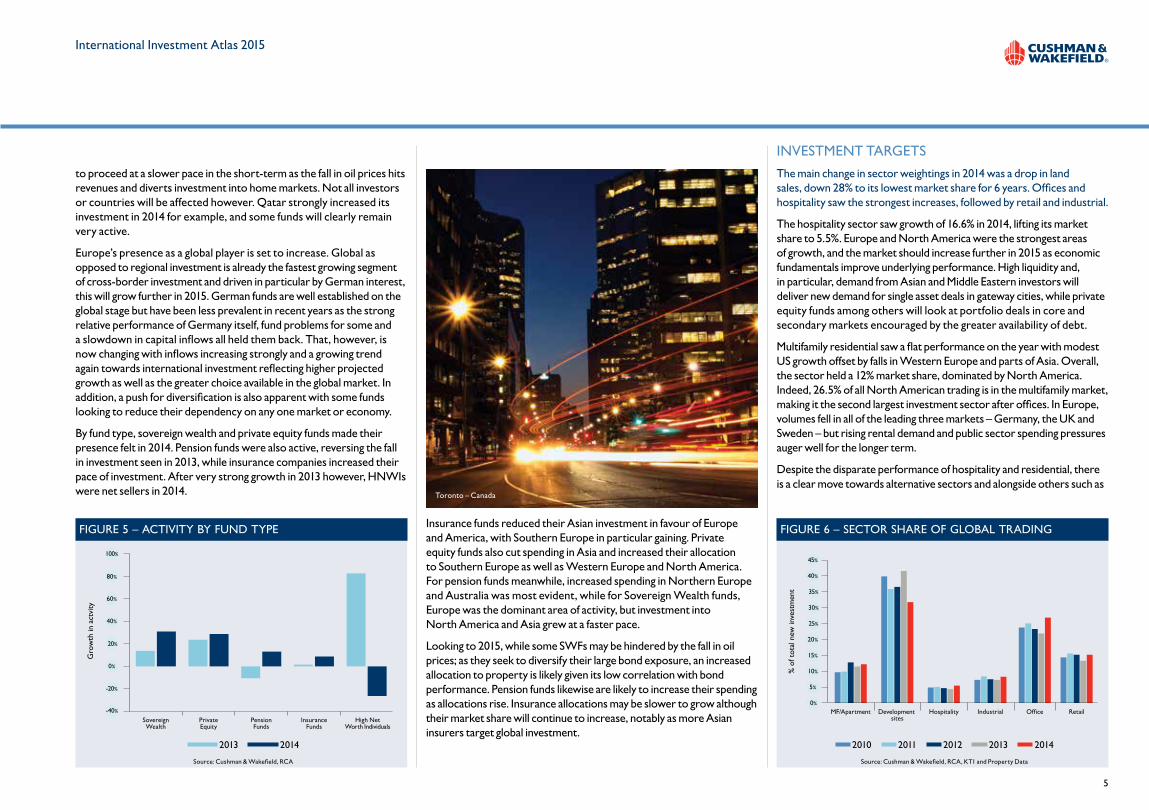
By fund type, sovereign wealth and private equity funds made their presence felt in 2014. Pension funds were also active, reversing the fall in investment seen in 2013, while insurance companies increased their pace of investment. After very strong growth in 2013 however, HNWIs were net sellers in 2014.
Insurance funds reduced their Asian investment in favour of Europe and America, with Southern Europe in particular gaining. Private equity funds also cut spending in Asia and increased their allocation to Southern Europe as well as Western Europe and North America. For pension funds meanwhile, increased spending in Northern Europe and Australia was most evident, while for Sovereign Wealth funds, Europe was the dominant area of activity, but investment into North America and Asia grew at a faster pace.
Looking to 2015, while some SWFs may be hindered by the fall in oil prices; as they seek to diversify their large bond exposure, an increased allocation to property is likely given its low correlation with bond performance. Pension funds likewise are likely to increase their spending as allocations rise. Insurance allocations may be slower to grow although their market share will continue to increase, notably as more Asian insurers target global investment.
INVESTMENT TARGETS
The main change in sector weightings in 2014 was a drop in land sales, down 28% to its lowest market share for 6 years. Offices and hospitality saw the strongest increases, followed by retail and industrial.
The hospitality sector saw growth of 16.6% in 2014, lifting its market share to 5.5%. Europe and North America were the strongest areas of growth, and the market should increase further in 2015 as economic fundamentals improve underlying performance. High liquidity and, in particular, demand from Asian and Middle Eastern investors will deliver new demand for single asset deals in gateway cities, while private equity funds among others will look at portfolio deals in core and secondary markets encouraged by the greater availability of debt.
Multifamily residential saw a flat performance on the year with modest US growth offset by falls in Western Europe and parts of Asia. Overall, the sector held a 12% market share, dominated by North America. Indeed, 26.5% of all North American trading is in the multifamily market, making it the second largest investment sector after offices. In Europe, volumes fell in all of the leading three markets – Germany, the UK and Sweden – but rising rental demand and public sector spending pressures auger well for the longer term.
Despite the disparate performance of hospitality and residential, there is a clear move towards alternative sectors and alongside others such as
FIGURE 6 – SECTOR SHARE OF GLOBAL TRADING
% o
f tot
al n
ew in
vest
men
t
MF/Apartment Development sites
Hospitality Industrial RetailOffice0%
15%
10%
5%
20%
25%
30%
45%
40%
35%
Source: Cushman & Wakefield, RCA, KT1 and Property Data
2010 2011 2012 2013 2014
FIGURE 5 – ACTIVITY BY FUND TYPE
SovereignWealth
PrivateEquity
PensionFunds
InsuranceFunds
High NetWorth Individuals
Gro
wth
in a
ctvi
ty
-20%
-40%
0%
20%
40%
100%
80%
60%
Source: Cushman & Wakefield, RCA
2013 2014
Toronto – Canada
6
International Investment Atlas 2015
healthcare, they will become increasingly mainstream in the years ahead with a focus on core as well as emerging markets.
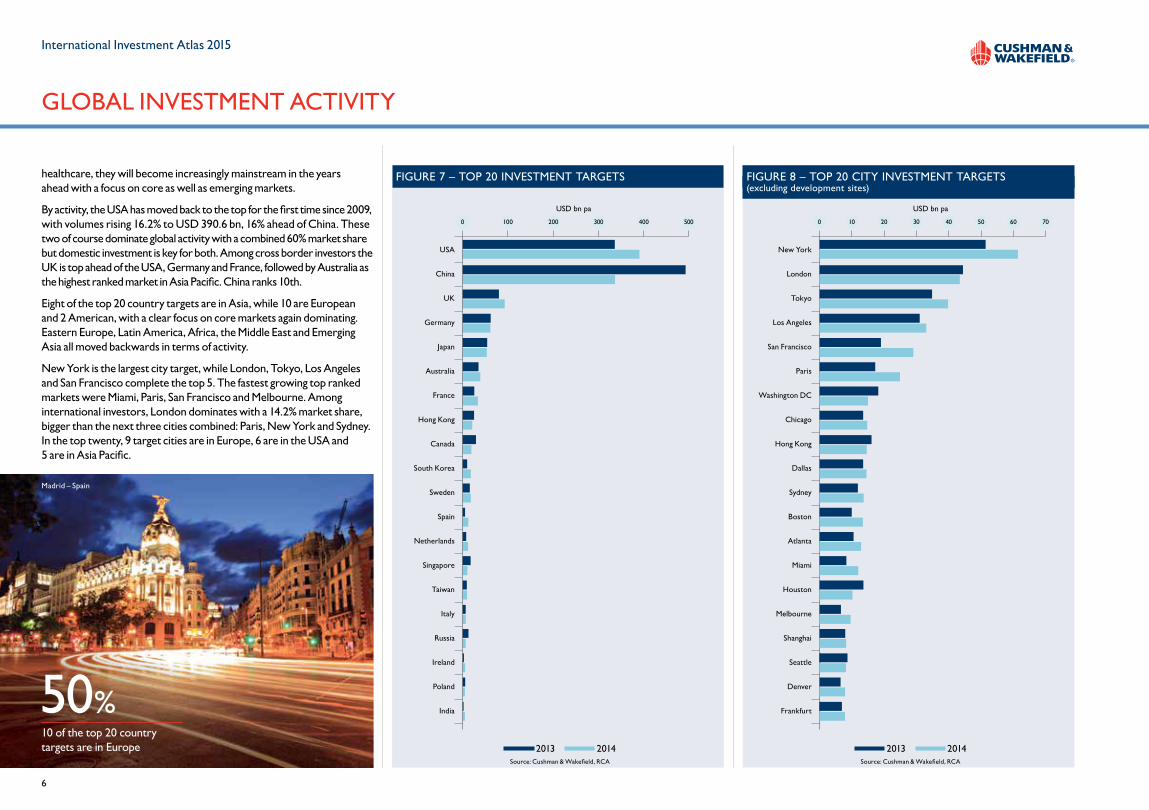
By activity, the USA has moved back to the top for the first time since 2009, with volumes rising 16.2% to USD 390.6 bn, 16% ahead of China. These two of course dominate global activity with a combined 60% market share but domestic investment is key for both. Among cross border investors the UK is top ahead of the USA, Germany and France, followed by Australia as the highest ranked market in Asia Pacific. China ranks 10th.
Eight of the top 20 country targets are in Asia, while 10 are European and 2 American, with a clear focus on core markets again dominating. Eastern Europe, Latin America, Africa, the Middle East and Emerging Asia all moved backwards in terms of activity.
New York is the largest city target, while London, Tokyo, Los Angeles and San Francisco complete the top 5. The fastest growing top ranked markets were Miami, Paris, San Francisco and Melbourne. Among international investors, London dominates with a 14.2% market share, bigger than the next three cities combined: Paris, New York and Sydney. In the top twenty, 9 target cities are in Europe, 6 are in the USA and 5 are in Asia Pacific.
GLOBAL INVESTMENT ACTIVITY
FIGURE 7 – TOP 20 INVESTMENT TARGETS
USD bn pa
USA
China
UK
Germany
Japan
Australia
France
Hong Kong
Canada
South Korea
Sweden
Spain
Netherlands
Singapore
Taiwan
Italy
Russia
Ireland
Poland
India
1000 200 500400300
Source: Cushman & Wakefield, RCA
2013 2014
FIGURE 8 – TOP 20 CITY INVESTMENT TARGETS(excluding development sites)
USD bn pa
New York
London
Tokyo
Los Angeles
San Francisco
Paris
Washington DC
Chicago
Hong Kong
Dallas
Sydney
Boston
Atlanta
Miami
Houston
Melbourne
Shanghai
Seattle
Denver
Frankfurt
100 20 7060504030
Source: Cushman & Wakefield, RCA
2013 2014
10 of the top 20 country targets are in Europe
50%
Madrid – Spain
7
International Investment Atlas 2015
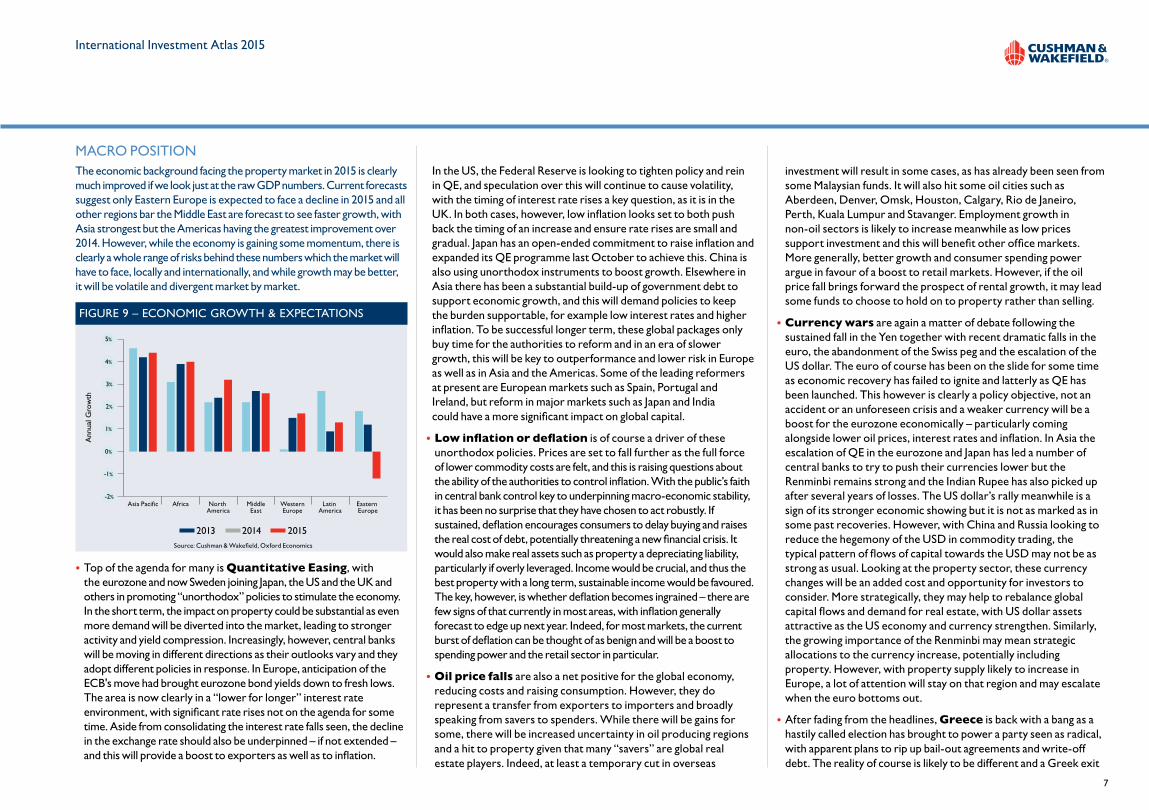
MACRO POSITIONThe economic background facing the property market in 2015 is clearly much improved if we look just at the raw GDP numbers. Current forecasts suggest only Eastern Europe is expected to face a decline in 2015 and all other regions bar the Middle East are forecast to see faster growth, with Asia strongest but the Americas having the greatest improvement over 2014. However, while the economy is gaining some momentum, there is clearly a whole range of risks behind these numbers which the market will have to face, locally and internationally, and while growth may be better, it will be volatile and divergent market by market.
• Top of the agenda for many is Quantitative Easing, with the eurozone and now Sweden joining Japan, the US and the UK and others in promoting “unorthodox” policies to stimulate the economy. In the short term, the impact on property could be substantial as even more demand will be diverted into the market, leading to stronger activity and yield compression. Increasingly, however, central banks will be moving in different directions as their outlooks vary and they adopt different policies in response. In Europe, anticipation of the ECB's move had brought eurozone bond yields down to fresh lows. The area is now clearly in a “lower for longer” interest rate environment, with significant rate rises not on the agenda for some time. Aside from consolidating the interest rate falls seen, the decline in the exchange rate should also be underpinned – if not extended – and this will provide a boost to exporters as well as to inflation.
• In the US, the Federal Reserve is looking to tighten policy and rein in QE, and speculation over this will continue to cause volatility, with the timing of interest rate rises a key question, as it is in the UK. In both cases, however, low inflation looks set to both push back the timing of an increase and ensure rate rises are small and gradual. Japan has an open-ended commitment to raise inflation and expanded its QE programme last October to achieve this. China is also using unorthodox instruments to boost growth. Elsewhere in Asia there has been a substantial build-up of government debt to support economic growth, and this will demand policies to keep the burden supportable, for example low interest rates and higher inflation. To be successful longer term, these global packages only buy time for the authorities to reform and in an era of slower growth, this will be key to outperformance and lower risk in Europe as well as in Asia and the Americas. Some of the leading reformers at present are European markets such as Spain, Portugal and Ireland, but reform in major markets such as Japan and India could have a more significant impact on global capital.
• Low inflation or deflation is of course a driver of these unorthodox policies. Prices are set to fall further as the full force of lower commodity costs are felt, and this is raising questions about the ability of the authorities to control inflation. With the public’s faith in central bank control key to underpinning macro-economic stability, it has been no surprise that they have chosen to act robustly. If sustained, deflation encourages consumers to delay buying and raises the real cost of debt, potentially threatening a new financial crisis. It would also make real assets such as property a depreciating liability, particularly if overly leveraged. Income would be crucial, and thus the best property with a long term, sustainable income would be favoured. The key, however, is whether deflation becomes ingrained – there are few signs of that currently in most areas, with inflation generally forecast to edge up next year. Indeed, for most markets, the current burst of deflation can be thought of as benign and will be a boost to spending power and the retail sector in particular.
• Oil price falls are also a net positive for the global economy, reducing costs and raising consumption. However, they do represent a transfer from exporters to importers and broadly speaking from savers to spenders. While there will be gains for some, there will be increased uncertainty in oil producing regions and a hit to property given that many “savers” are global real estate players. Indeed, at least a temporary cut in overseas
investment will result in some cases, as has already been seen from some Malaysian funds. It will also hit some oil cities such as Aberdeen, Denver, Omsk, Houston, Calgary, Rio de Janeiro, Perth, Kuala Lumpur and Stavanger. Employment growth in non-oil sectors is likely to increase meanwhile as low prices support investment and this will benefit other office markets. More generally, better growth and consumer spending power argue in favour of a boost to retail markets. However, if the oil price fall brings forward the prospect of rental growth, it may lead some funds to choose to hold on to property rather than selling.
• Currency wars are again a matter of debate following the sustained fall in the Yen together with recent dramatic falls in the euro, the abandonment of the Swiss peg and the escalation of the US dollar. The euro of course has been on the slide for some time as economic recovery has failed to ignite and latterly as QE has been launched. This however is clearly a policy objective, not an accident or an unforeseen crisis and a weaker currency will be a boost for the eurozone economically – particularly coming alongside lower oil prices, interest rates and inflation. In Asia the escalation of QE in the eurozone and Japan has led a number of central banks to try to push their currencies lower but the Renminbi remains strong and the Indian Rupee has also picked up after several years of losses. The US dollar’s rally meanwhile is a sign of its stronger economic showing but it is not as marked as in some past recoveries. However, with China and Russia looking to reduce the hegemony of the USD in commodity trading, the typical pattern of flows of capital towards the USD may not be as strong as usual. Looking at the property sector, these currency changes will be an added cost and opportunity for investors to consider. More strategically, they may help to rebalance global capital flows and demand for real estate, with US dollar assets attractive as the US economy and currency strengthen. Similarly, the growing importance of the Renminbi may mean strategic allocations to the currency increase, potentially including property. However, with property supply likely to increase in Europe, a lot of attention will stay on that region and may escalate when the euro bottoms out.
• After fading from the headlines, Greece is back with a bang as a hastily called election has brought to power a party seen as radical, with apparent plans to rip up bail-out agreements and write-off debt. The reality of course is likely to be different and a Greek exit
FIGURE 9 – ECONOMIC GROWTH & EXPECTATIONS
Ann
ual G
row
th
Asia Pacific Africa North America
MiddleEast
Latin America
Eastern Europe
WesternEurope
-2%
0%
-1%
1%
2%
5%
4%
3%
Source: Cushman & Wakefield, Oxford Economics
2013 2014 2015
8
International Investment Atlas 2015
from the euro still looks unlikely. Nonetheless, while brinkmanship will hopefully give way to negotiation, the need for Greece’s position to be reviewed is clear. Despite the progress made, the economy has only now started to stabilise, the debt burden is crippling and the need for deeper reform and debt relief is obvious. At the same time, the view that a potential Greek exit could be isolated within the eurozone could be wishful thinking. Firewalls exist, but the risk of political contagion is perhaps higher than ever with more extreme, anti-austerity parties emerging. Therefore, while this shouldn't spell the beginning of a new crisis, the risk can’t be entirely discounted, and a move to leave the eurozone, with subsequent devaluation and debt write-offs, would be an example carefully and perhaps jealously watched by some. More notably however, the election could prove to be a high watermark for austerity within Europe and could signal a more concerted effort to get growth and job creation up the agenda.
• Ukraine provides another challenge in Europe, particularly for those caught in a deteriorating cycle of violence. Implications are also being felt outside the country however: in Russia, neighbouring countries and the West as a whole. Both Ukraine and Russia face recession in 2015, and weaker demand in Russia is an added headwind for the rest of Europe. Of greater significance is the impact on stability as geopolitical wrangles escalate, centered on Ukraine of course but extending within the Eurasian Union area, promoted by Russia and beyond as destabilizing actions increase from all sides and a new cold war is mooted by some. Amidst such uncertainty, investment and occupier moves will continue to be impacted. However, Russia has been one of the region’s most dynamic emerging property markets and is underpinned by vast wealth and resources. What is more, a firming in oil prices would provide quick relief to the Russian authorities. Hence while the market and the region will remain off-bounds for many, it will see increased interest from risk takers ready to take advantage of opportunities when they sense the market is close to bottoming out, with re-financing needs perhaps likely to trigger such opportunities in the near term. Local investors, Asian and Middle Eastern players and investors already established in the market may be in the vanguard of any such move.
• Global cooperation has come under strain in recent years as financial pressures have mounted and popular support for globalization has been challenged. Strains over Ukraine have added to this while events in the Middle East and the spread of Ebola have also made global cooperation harder to achieve. This is one part of a more nationalistic mood which always grows in times of economic hardship but which could be a material threat to the increasingly global flow of capital in real estate. If “foreign ownership” is seen as a second class alternative to home-owned or, worse still, as part of the polarization
between rich and poor more generally, the risks involved in global investment will increase. To that end, the number of multinational agreements that could be reached this year could be an important step back towards greater cooperation. This includes the Transpacific Partnership agreement on trade between North America and Europe, the 5 yearly review of the nuclear non-proliferation treaty, the next UN meeting to update the Millennium Development goals and the next round of climate control talks, due in Paris.
GLOBAL INVESTMENT ACTIVITY
Shanghai – China
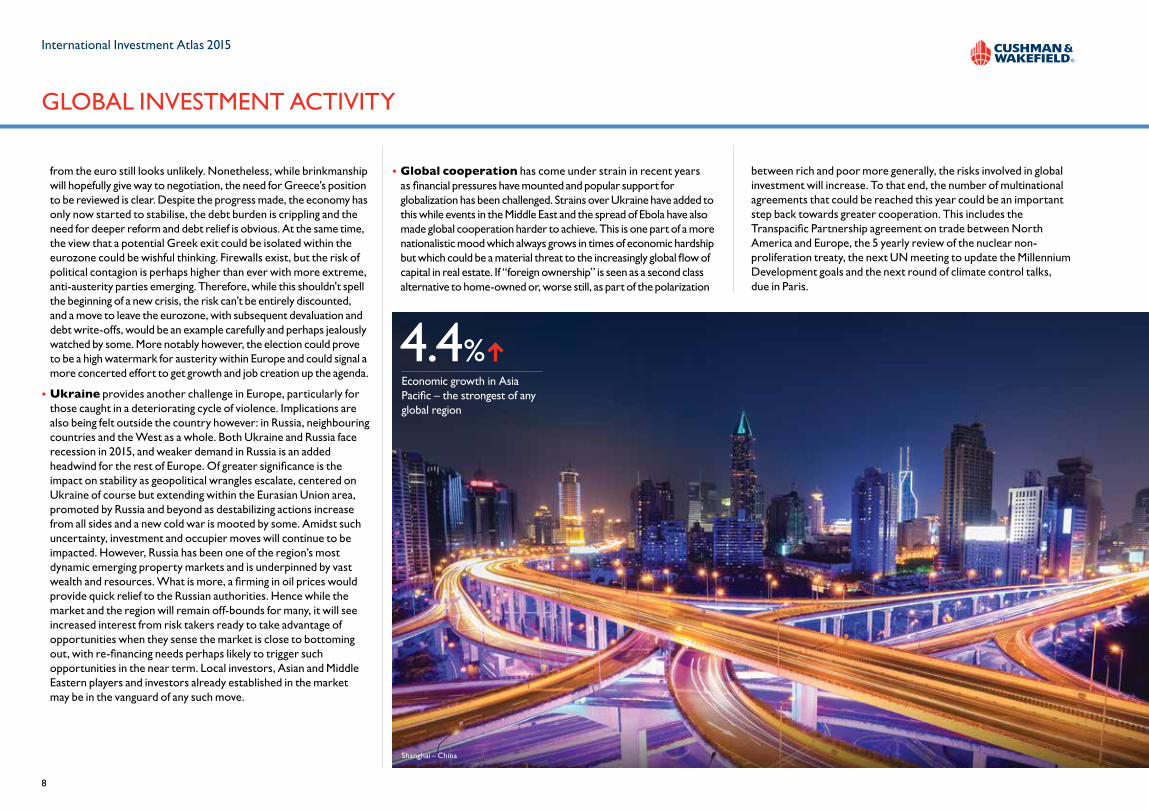
Economic growth in Asia Pacific – the strongest of any global region
4.4%
9
International Investment Atlas 2015
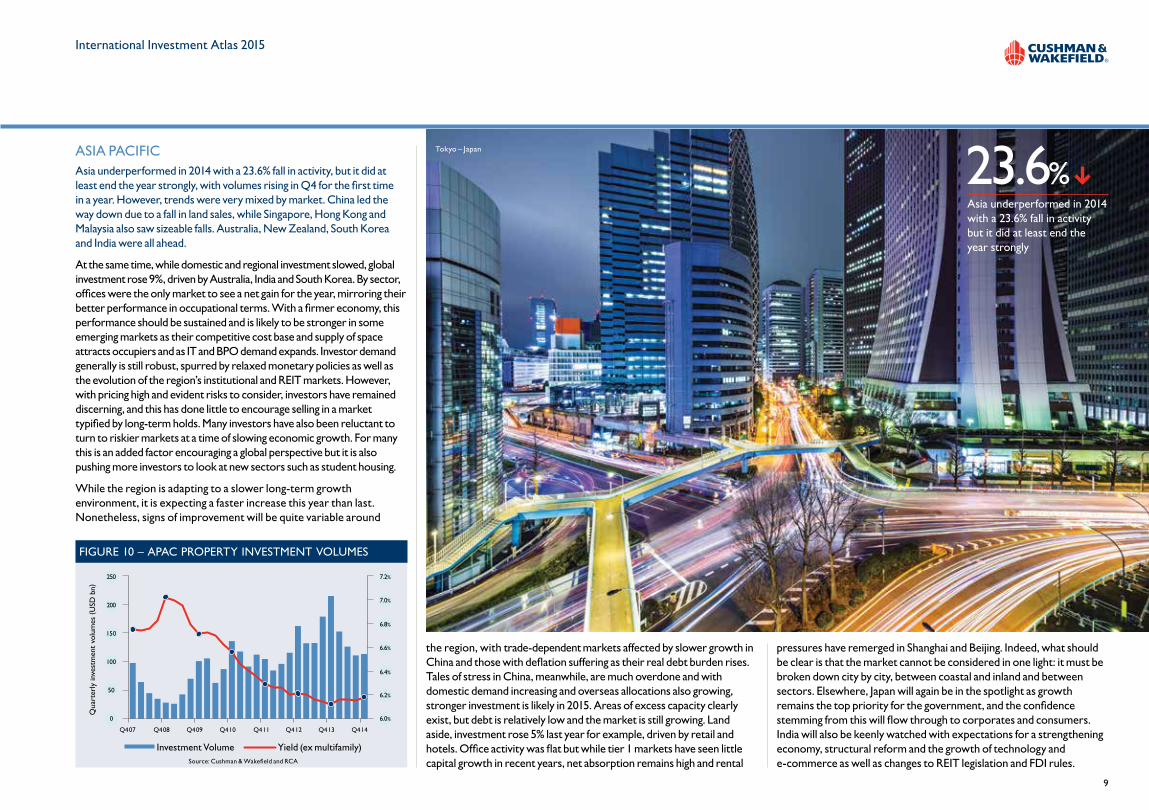
ASIA PACIFICAsia underperformed in 2014 with a 23.6% fall in activity, but it did at least end the year strongly, with volumes rising in Q4 for the first time in a year. However, trends were very mixed by market. China led the way down due to a fall in land sales, while Singapore, Hong Kong and Malaysia also saw sizeable falls. Australia, New Zealand, South Korea and India were all ahead.
At the same time, while domestic and regional investment slowed, global investment rose 9%, driven by Australia, India and South Korea. By sector, offices were the only market to see a net gain for the year, mirroring their better performance in occupational terms. With a firmer economy, this performance should be sustained and is likely to be stronger in some emerging markets as their competitive cost base and supply of space attracts occupiers and as IT and BPO demand expands. Investor demand generally is still robust, spurred by relaxed monetary policies as well as the evolution of the region’s institutional and REIT markets. However, with pricing high and evident risks to consider, investors have remained discerning, and this has done little to encourage selling in a market typified by long-term holds. Many investors have also been reluctant to turn to riskier markets at a time of slowing economic growth. For many this is an added factor encouraging a global perspective but it is also pushing more investors to look at new sectors such as student housing.
While the region is adapting to a slower long-term growth environment, it is expecting a faster increase this year than last. Nonetheless, signs of improvement will be quite variable around
the region, with trade-dependent markets affected by slower growth in China and those with deflation suffering as their real debt burden rises. Tales of stress in China, meanwhile, are much overdone and with domestic demand increasing and overseas allocations also growing, stronger investment is likely in 2015. Areas of excess capacity clearly exist, but debt is relatively low and the market is still growing. Land aside, investment rose 5% last year for example, driven by retail and hotels. Office activity was flat but while tier 1 markets have seen little capital growth in recent years, net absorption remains high and rental
pressures have remerged in Shanghai and Beijing. Indeed, what should be clear is that the market cannot be considered in one light: it must be broken down city by city, between coastal and inland and between sectors. Elsewhere, Japan will again be in the spotlight as growth remains the top priority for the government, and the confidence stemming from this will flow through to corporates and consumers. India will also be keenly watched with expectations for a strengthening economy, structural reform and the growth of technology and e-commerce as well as changes to REIT legislation and FDI rules.
FIGURE 10 – APAC PROPERTY INVESTMENT VOLUMES
0
50
100
150
200
250
6.0%
6.2%
6.4%
6.6%
7.2%
7.0%
6.8%
Q4 07 Q4 08 Q4 09 Q4 10 Q4 11 Q4 12
Qua
rter
ly in
vest
men
t vo
lum
es (
USD
bn)
Q4 13 Q4 14
Source: Cushman & Wakefield and RCA
Investment Volume Yield (ex multifamily)
23.6%Asia underperformed in 2014 with a 23.6% fall in activity but it did at least end the year strongly
Tokyo – Japan
International Investment Atlas 2015
EMEA
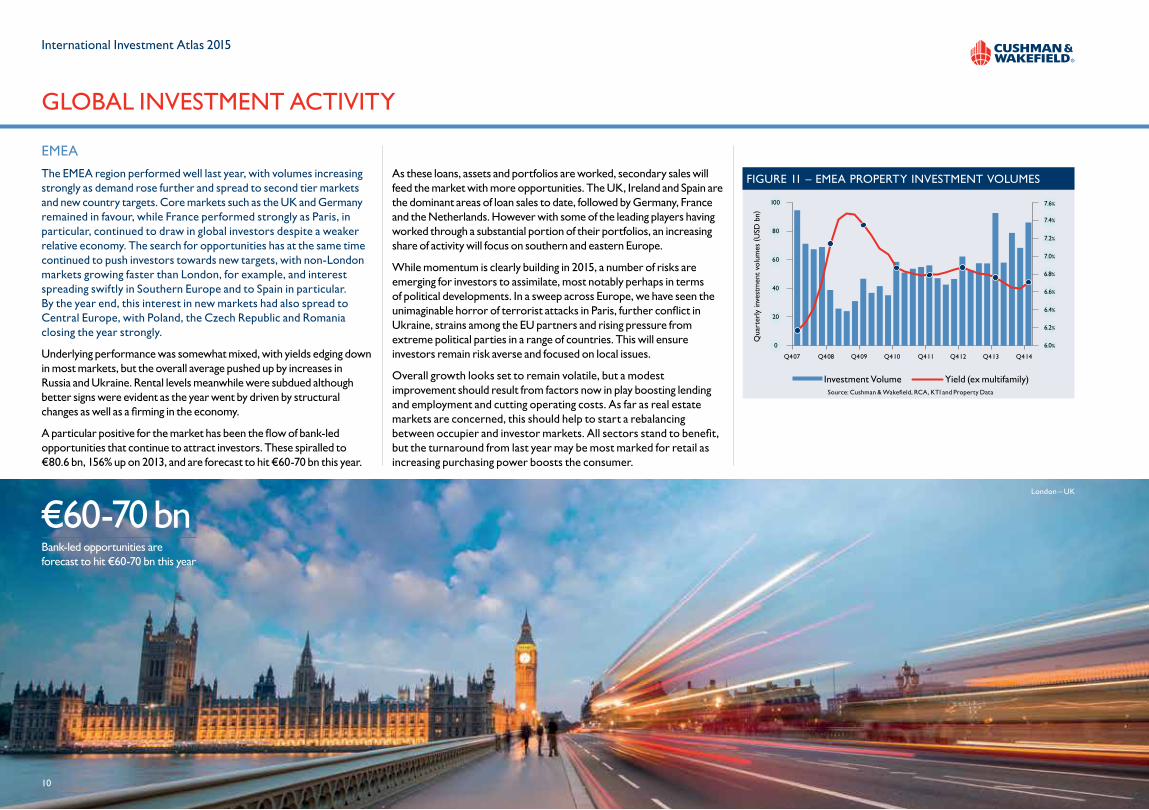
The EMEA region performed well last year, with volumes increasing strongly as demand rose further and spread to second tier markets and new country targets. Core markets such as the UK and Germany remained in favour, while France performed strongly as Paris, in particular, continued to draw in global investors despite a weaker relative economy. The search for opportunities has at the same time continued to push investors towards new targets, with non-London markets growing faster than London, for example, and interest spreading swiftly in Southern Europe and to Spain in particular. By the year end, this interest in new markets had also spread to Central Europe, with Poland, the Czech Republic and Romania closing the year strongly.
Underlying performance was somewhat mixed, with yields edging down in most markets, but the overall average pushed up by increases in Russia and Ukraine. Rental levels meanwhile were subdued although better signs were evident as the year went by driven by structural changes as well as a firming in the economy.
A particular positive for the market has been the flow of bank-led opportunities that continue to attract investors. These spiralled to €80.6 bn, 156% up on 2013, and are forecast to hit €60-70 bn this year.
As these loans, assets and portfolios are worked, secondary sales will feed the market with more opportunities. The UK, Ireland and Spain are the dominant areas of loan sales to date, followed by Germany, France and the Netherlands. However with some of the leading players having worked through a substantial portion of their portfolios, an increasing share of activity will focus on southern and eastern Europe.
While momentum is clearly building in 2015, a number of risks are emerging for investors to assimilate, most notably perhaps in terms of political developments. In a sweep across Europe, we have seen the unimaginable horror of terrorist attacks in Paris, further conflict in Ukraine, strains among the EU partners and rising pressure from extreme political parties in a range of countries. This will ensure investors remain risk averse and focused on local issues.
Overall growth looks set to remain volatile, but a modest improvement should result from factors now in play boosting lending and employment and cutting operating costs. As far as real estate markets are concerned, this should help to start a rebalancing between occupier and investor markets. All sectors stand to benefit, but the turnaround from last year may be most marked for retail as increasing purchasing power boosts the consumer.
GLOBAL INVESTMENT ACTIVITY
FIGURE 11 – EMEA PROPERTY INVESTMENT VOLUMES
0
20
40
60
80
100
6.0%
6.2%
6.4%
6.6%
7.6%
7.0%
6.8%
7.0%
6.8%
Q4 07 Q4 08 Q4 09 Q4 10 Q4 11 Q4 12
Qua
rter
ly in
vest
men
t vo
lum
es (
USD
bn)
Q4 13 Q4 14
7.2%
7.4%
Source: Cushman & Wakefield, RCA, KTI and Property Data
Investment Volume Yield (ex multifamily)
€60-70 bnBank-led opportunities are forecast to hit €60-70 bn this year
London – UK
10
11
International Investment Atlas 2015
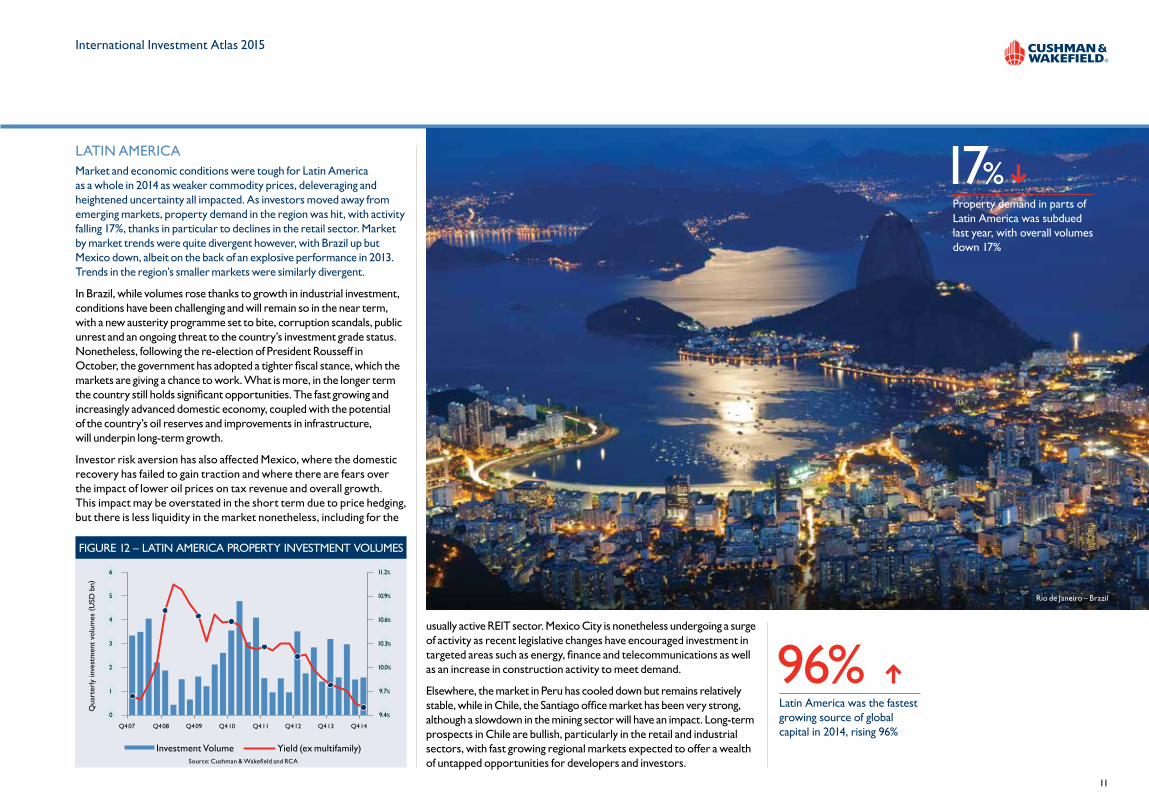
LATIN AMERICAMarket and economic conditions were tough for Latin America as a whole in 2014 as weaker commodity prices, deleveraging and heightened uncertainty all impacted. As investors moved away from emerging markets, property demand in the region was hit, with activity falling 17%, thanks in particular to declines in the retail sector. Market by market trends were quite divergent however, with Brazil up but Mexico down, albeit on the back of an explosive performance in 2013. Trends in the region’s smaller markets were similarly divergent.
In Brazil, while volumes rose thanks to growth in industrial investment, conditions have been challenging and will remain so in the near term, with a new austerity programme set to bite, corruption scandals, public unrest and an ongoing threat to the country’s investment grade status. Nonetheless, following the re-election of President Rousseff in October, the government has adopted a tighter fiscal stance, which the markets are giving a chance to work. What is more, in the longer term the country still holds significant opportunities. The fast growing and increasingly advanced domestic economy, coupled with the potential of the country’s oil reserves and improvements in infrastructure, will underpin long-term growth.
Investor risk aversion has also affected Mexico, where the domestic recovery has failed to gain traction and where there are fears over the impact of lower oil prices on tax revenue and overall growth. This impact may be overstated in the short term due to price hedging, but there is less liquidity in the market nonetheless, including for the
FIGURE 12 – LATIN AMERICA PROPERTY INVESTMENT VOLUMES
0
4
3
2
1
6
5
9.4%
9.7%
10.0%
11.2%
Q4 07 Q4 08 Q4 09 Q4 10 Q4 11 Q4 12
Qua
rter
ly in
vest
men
t vo
lum
es (
USD
bn)
Q4 13 Q4 14
10.6%
10.9%
10.3%
Source: Cushman & Wakefield and RCA
Investment Volume Yield (ex multifamily)
17%Property demand in parts of Latin America was subdued last year, with overall volumes down 17%
Rio de Janeiro – Brazil
usually active REIT sector. Mexico City is nonetheless undergoing a surge of activity as recent legislative changes have encouraged investment in targeted areas such as energy, finance and telecommunications as well as an increase in construction activity to meet demand.
Elsewhere, the market in Peru has cooled down but remains relatively stable, while in Chile, the Santiago office market has been very strong, although a slowdown in the mining sector will have an impact. Long-term prospects in Chile are bullish, particularly in the retail and industrial sectors, with fast growing regional markets expected to offer a wealth of untapped opportunities for developers and investors.
96%Latin America was the fastest growing source of global capital in 2014, rising 96%
12
International Investment Atlas 2015
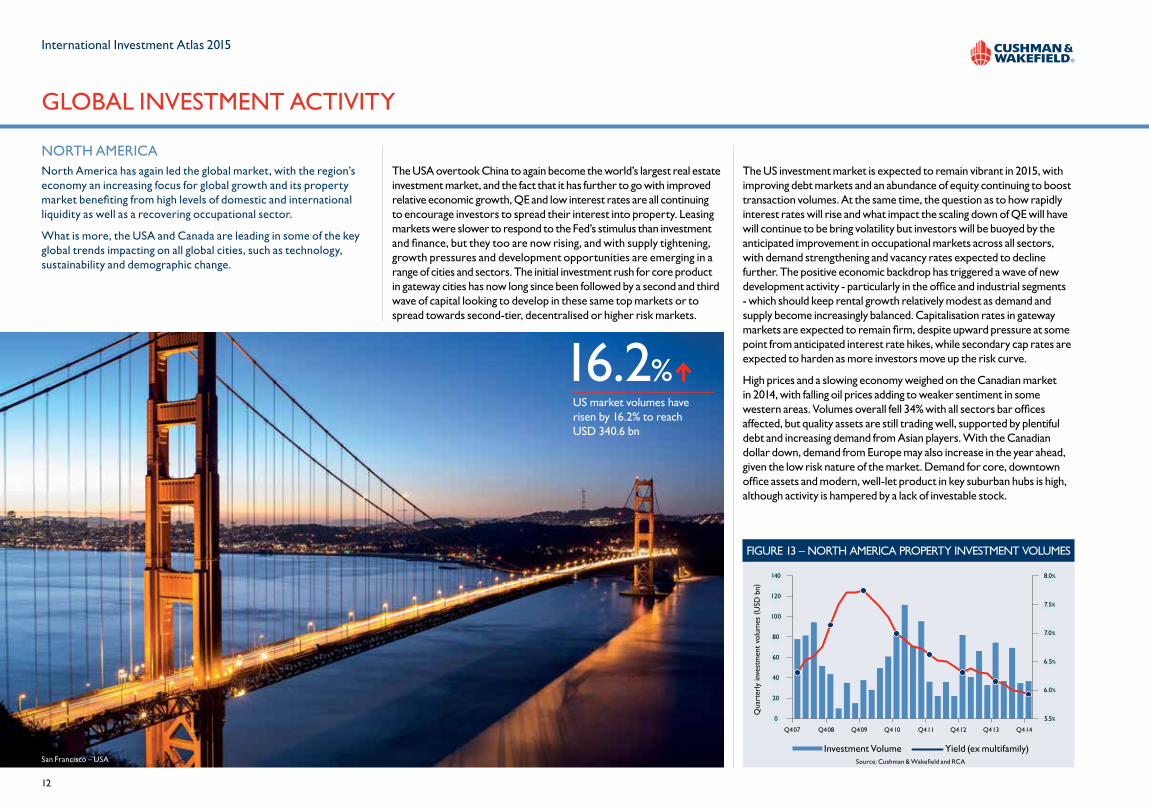
NORTH AMERICANorth America has again led the global market, with the region’s economy an increasing focus for global growth and its property market benefiting from high levels of domestic and international liquidity as well as a recovering occupational sector.
What is more, the USA and Canada are leading in some of the key global trends impacting on all global cities, such as technology, sustainability and demographic change.
The USA overtook China to again become the world’s largest real estate investment market, and the fact that it has further to go with improved relative economic growth, QE and low interest rates are all continuing to encourage investors to spread their interest into property. Leasing markets were slower to respond to the Fed’s stimulus than investment and finance, but they too are now rising, and with supply tightening, growth pressures and development opportunities are emerging in a range of cities and sectors. The initial investment rush for core product in gateway cities has now long since been followed by a second and third wave of capital looking to develop in these same top markets or to spread towards second-tier, decentralised or higher risk markets.
The US investment market is expected to remain vibrant in 2015, with improving debt markets and an abundance of equity continuing to boost transaction volumes. At the same time, the question as to how rapidly interest rates will rise and what impact the scaling down of QE will have will continue to be bring volatility but investors will be buoyed by the anticipated improvement in occupational markets across all sectors, with demand strengthening and vacancy rates expected to decline further. The positive economic backdrop has triggered a wave of new development activity - particularly in the office and industrial segments - which should keep rental growth relatively modest as demand and supply become increasingly balanced. Capitalisation rates in gateway markets are expected to remain firm, despite upward pressure at some point from anticipated interest rate hikes, while secondary cap rates are expected to harden as more investors move up the risk curve.
High prices and a slowing economy weighed on the Canadian market in 2014, with falling oil prices adding to weaker sentiment in some western areas. Volumes overall fell 34% with all sectors bar offices affected, but quality assets are still trading well, supported by plentiful debt and increasing demand from Asian players. With the Canadian dollar down, demand from Europe may also increase in the year ahead, given the low risk nature of the market. Demand for core, downtown office assets and modern, well-let product in key suburban hubs is high, although activity is hampered by a lack of investable stock.
GLOBAL INVESTMENT ACTIVITY
FIGURE 13 – NORTH AMERICA PROPERTY INVESTMENT VOLUMES
0
100
80
60
40
20
140
120
5.5%
8.0%
Q4 07 Q4 08 Q4 09 Q4 10 Q4 11 Q4 12
Qua
rter
ly in
vest
men
t vo
lum
es (
USD
bn)
Q4 13 Q4 14
7.0%
6.5%
6.0%
7.5%
Source: Cushman & Wakefield and RCA
Investment Volume Yield (ex multifamily)
US market volumes have risen by 16.2% to reach USD 340.6 bn
16.2%
San Francisco – USA
13
International Investment Atlas 2015
OUTLOOK & STRATEGYAn improved global economy will augur well for occupier markets and alongside a high level of liquidity in investment markets, this is a favourable environment for real estate performance in absolute and relative terms. The two provisos to this are firstly that real estate needs to have a sustainable income even in light of the many changes we are seeing in how buildings are being used. Secondly there are many risk factors in play in the macro environment which will have a very different impact market by market.
Demand is still increasing globally and allocations to real estate are likely to rise as global investors look ahead to a time when bond yields will rise and their performance will suffer as a result. What is more, the low volatility facets of property performance will also be appreciated by multi-asset investors given the sharp movements being seen in other asset classes.
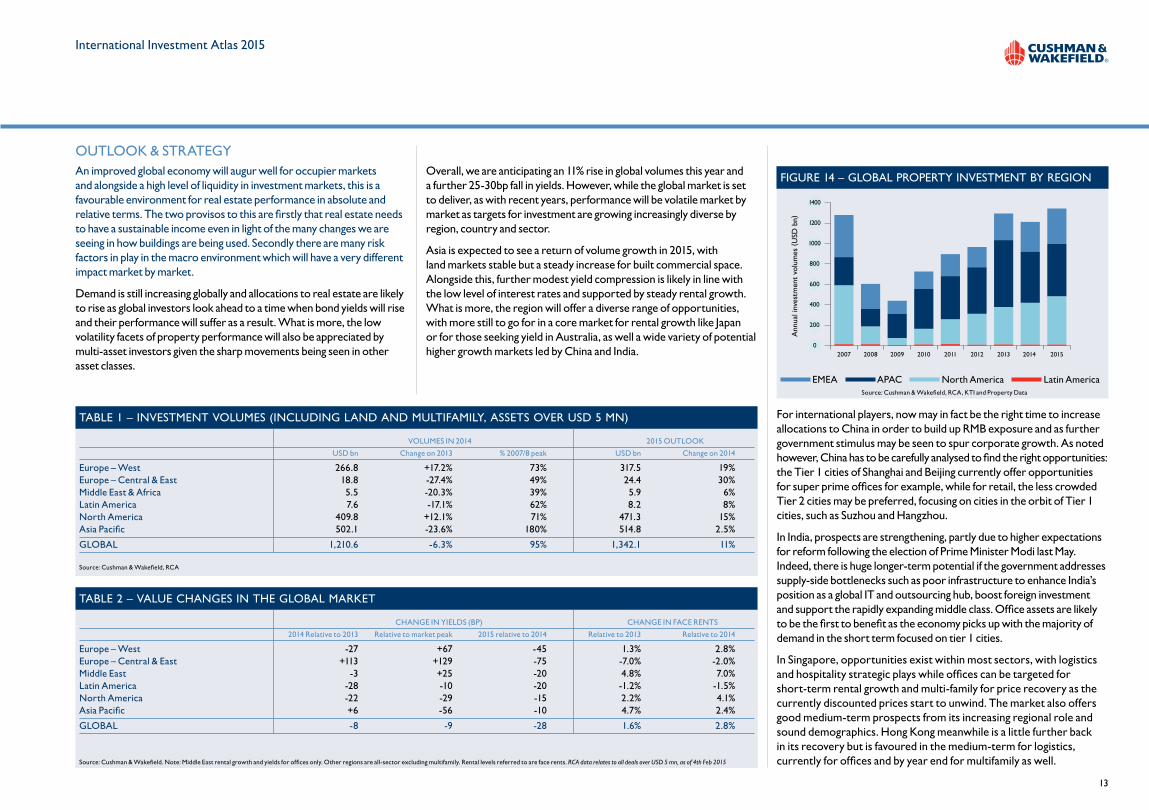
Overall, we are anticipating an 11% rise in global volumes this year and a further 25-30bp fall in yields. However, while the global market is set to deliver, as with recent years, performance will be volatile market by market as targets for investment are growing increasingly diverse by region, country and sector.
Asia is expected to see a return of volume growth in 2015, with land markets stable but a steady increase for built commercial space. Alongside this, further modest yield compression is likely in line with the low level of interest rates and supported by steady rental growth. What is more, the region will offer a diverse range of opportunities, with more still to go for in a core market for rental growth like Japan or for those seeking yield in Australia, as well a wide variety of potential higher growth markets led by China and India.
For international players, now may in fact be the right time to increase allocations to China in order to build up RMB exposure and as further government stimulus may be seen to spur corporate growth. As noted however, China has to be carefully analysed to find the right opportunities: the Tier 1 cities of Shanghai and Beijing currently offer opportunities for super prime offices for example, while for retail, the less crowded Tier 2 cities may be preferred, focusing on cities in the orbit of Tier 1 cities, such as Suzhou and Hangzhou.
In India, prospects are strengthening, partly due to higher expectations for reform following the election of Prime Minister Modi last May. Indeed, there is huge longer-term potential if the government addresses supply-side bottlenecks such as poor infrastructure to enhance India’s position as a global IT and outsourcing hub, boost foreign investment and support the rapidly expanding middle class. Office assets are likely to be the first to benefit as the economy picks up with the majority of demand in the short term focused on tier 1 cities.
In Singapore, opportunities exist within most sectors, with logistics and hospitality strategic plays while offices can be targeted for short-term rental growth and multi-family for price recovery as the currently discounted prices start to unwind. The market also offers good medium-term prospects from its increasing regional role and sound demographics. Hong Kong meanwhile is a little further back in its recovery but is favoured in the medium-term for logistics, currently for offices and by year end for multifamily as well.
TABLE 1 – INVESTMENT VOLUMES (INCLUDING LAND AND MULTIFAMILY, ASSETS OVER USD 5 MN) VOLUMES IN 2014 2015 OUTLOOK
USD bn Change on 2013 % 2007/8 peak USD bn Change on 2014
Europe – West 266.8 +17.2% 73% 317.5 19%Europe – Central & East 18.8 -27.4% 49% 24.4 30%Middle East & Africa 5.5 -20.3% 39% 5.9 6%Latin America 7.6 -17.1% 62% 8.2 8%North America 409.8 +12.1% 71% 471.3 15%Asia Pacific 502.1 -23.6% 180% 514.8 2.5%
GLOBAL 1,210.6 -6.3% 95% 1,342.1 11%
Source: Cushman & Wakefield, RCA
TABLE 2 – VALUE CHANGES IN THE GLOBAL MARKET CHANGE IN YIELDS (BP) CHANGE IN FACE RENTS
2014 Relative to 2013 Relative to market peak 2015 relative to 2014 Relative to 2013 Relative to 2014
Europe – West -27 +67 -45 1.3% 2.8%Europe – Central & East +113 +129 -75 -7.0% -2.0%Middle East -3 +25 -20 4.8% 7.0%Latin America -28 -10 -20 -1.2% -1.5%North America -22 -29 -15 2.2% 4.1%Asia Pacific +6 -56 -10 4.7% 2.4%
GLOBAL -8 -9 -28 1.6% 2.8%
Source: Cushman & Wakefield. Note: Middle East rental growth and yields for offices only. Other regions are all-sector excluding multifamily. Rental levels referred to are face rents. RCA data relates to all deals over USD 5 mn, as of 4th Feb 2015
FIGURE 14 – GLOBAL PROPERTY INVESTMENT BY REGION
Ann
ual i
nves
tmen
t vo
lum
es (
USD
bn)
2007 2008 2009 2010 2011 2012 2014 201520130
1000
800
600
400
200
1400
1200
Source: Cushman & Wakefield, RCA, KTI and Property Data
EMEA APAC North America Latin America
14
International Investment Atlas 2015
In Europe, QE coupled with strong capital availability and an increasing supply of debt should result in strong market activity this year. Germany will be a number one target for an increasing range of global players while the tier 1 gateways markets of London and Paris will continue to lead overall, despite the high level of competition and strong pricing. Indeed, that ”strong pricing” is still being seen as perceived attractive relative to other global markets as well as bonds, and further price appreciation is likely. While London offers the better near term growth thanks to supply pressures in the market, both offer medium to long term gains from infrastructure improvements and their roles as global luxury/cultural/tourism hubs. In the next tier of cities meanwhile, there are a range of locations with high quality living, working and educational environments as well as strong tech and environmental credentials – such as Copenhagen, Stockholm, Amsterdam, Dublin, Madrid, Brussels and Warsaw.
Among recovery markets, while yield pricing in Spain is frequently now aggressive, growth potential is good given supply shortages in some areas and the seeming success of the reform programme, which will benefit all sectors. Italy too is a favoured market despite much slower progress on reform and recovery. The market has less modern space than it needs, and a requirement for partners and capital, as well as the World Expo event in Milan this year, should provide a real focus for global capital.
The Americas are expected to again perform strongly in 2015, with a further rise in activity driven by the USA and rising values from yield compression and, in the case of the USA, rental growth as well. Latin America is forecast to see a modest gain in volumes as investors look further afield for opportunities, but occupier performance in some markets will remain subdued.
Core markets in the USA will continue to attract capital, but at the same time interest will also move further into riskier markets including tier 2/3 cities and suburban areas. New targets amongst this group will focus on those appealing to the millennial generation as offering the right live/work/play environment, for example Nashville, Brooklyn, Portland or Memphis. In all cases however, the quality of the micro locations is of paramount importance.
In the US retail sector, flagship stores and other dominant retail assets are preferred due to trends such as re-urbanisation and densification, while the industrial logistics sector is also an area of strongly anticipated growth as e-commerce accelerates.
In Canada, conditions will be mixed, with weaker oil driven demand and excess supply thanks to recent development in some cities. The retail market will continue to attract significant interest from investors and US and European occupiers, with new large-scale mall concepts and dominant shopping centres in secondary markets in demand. Prospects for the industrial sector are also more bullish, with the lack of modern logistics space continuing to support new construction and refurbishment of older buildings.
MOVING UP THE RISK CURVEInvestors are looking up the risk curve in pursuit of opportunities and returns. While many are focussing on core markets, some are ready to take more market risk and judge tier 1 cities in less mature countries to be a sounder long-term prospect than tier 2/3 cities in the most mature markets.
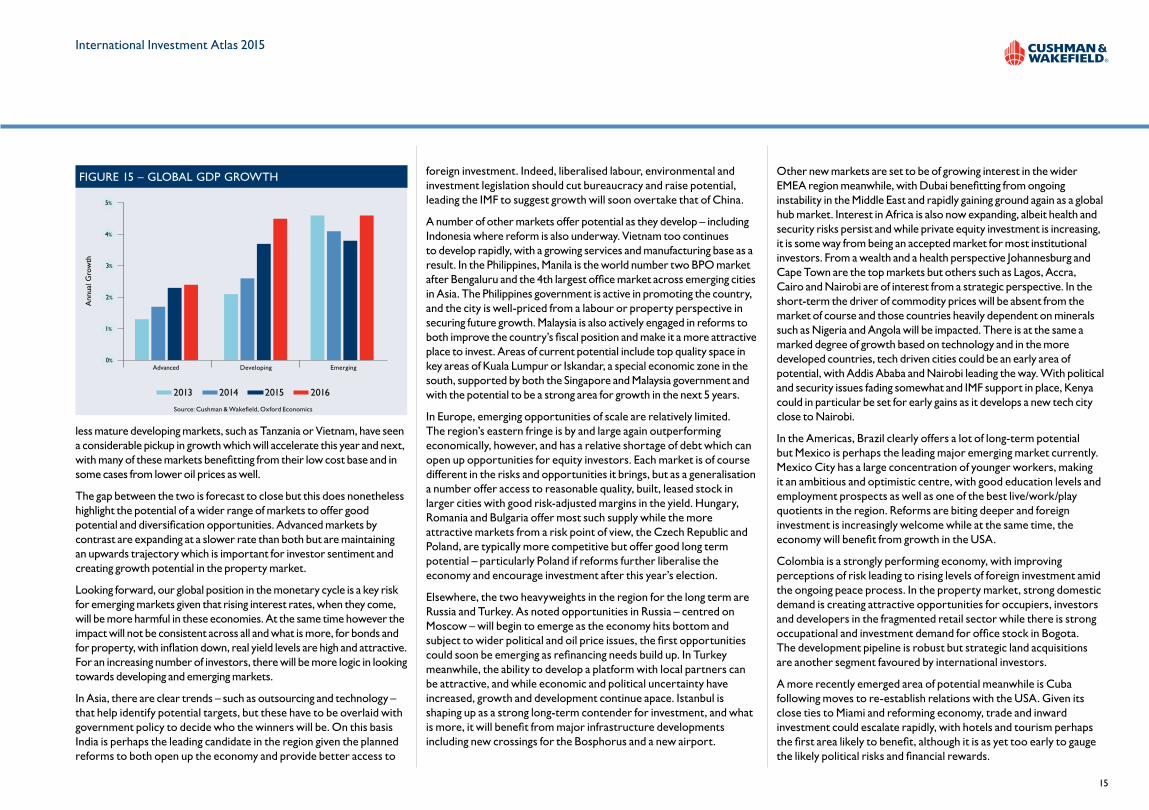
The traditional high return emerging markets – typified by the BRICs – have however seen growth rates fall in recent years (see figure 15), and this is expected to continue in 2015 as the twin forces of slower Chinese growth and weaker commodity prices impact. In contrast the
GLOBAL INVESTMENT ACTIVITY
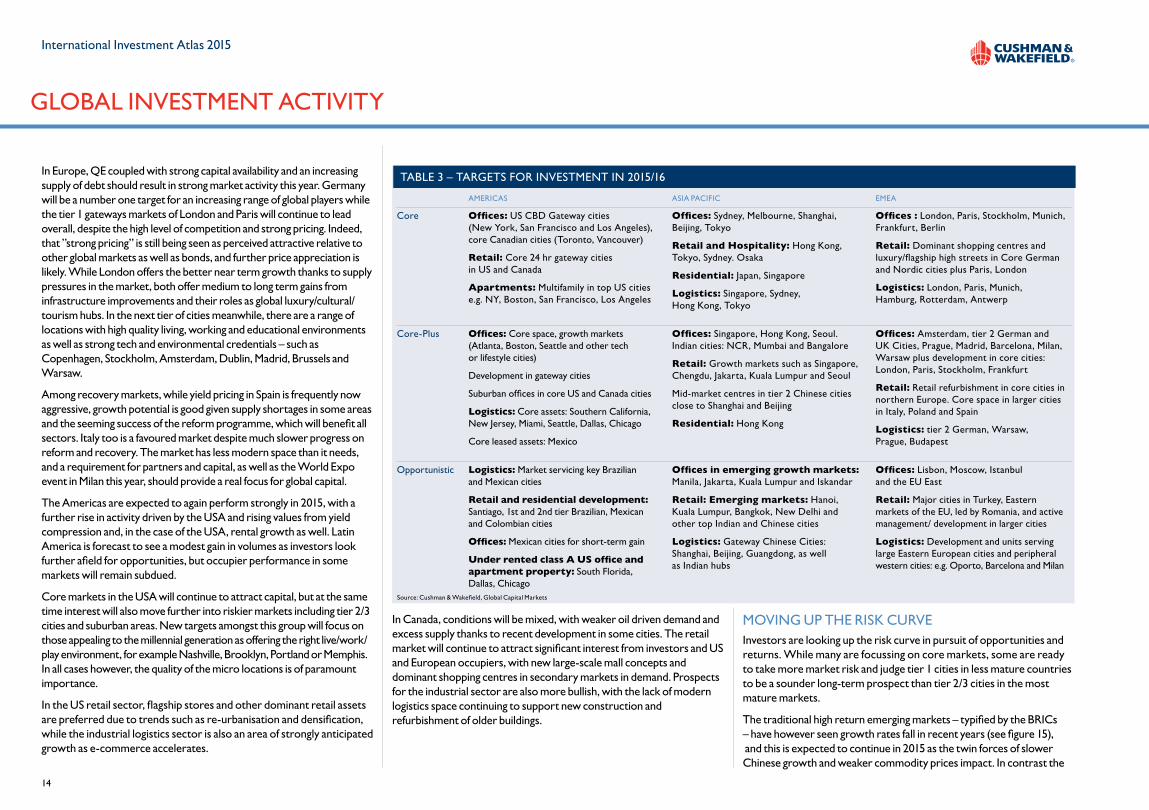
AMERICAS ASIA PACIFIC EMEA
Core Offices: US CBD Gateway cities (New York, San Francisco and Los Angeles), core Canadian cities (Toronto, Vancouver)
Retail: Core 24 hr gateway cities in US and Canada
Apartments: Multifamily in top US cities e.g. NY, Boston, San Francisco, Los Angeles
Offices: Sydney, Melbourne, Shanghai, Beijing, Tokyo
Retail and Hospitality: Hong Kong, Tokyo, Sydney. Osaka
Residential: Japan, Singapore
Logistics: Singapore, Sydney, Hong Kong, Tokyo
Offices : London, Paris, Stockholm, Munich, Frankfurt, Berlin
Retail: Dominant shopping centres and luxury/flagship high streets in Core German and Nordic cities plus Paris, London
Logistics: London, Paris, Munich, Hamburg, Rotterdam, Antwerp
Core-Plus Offices: Core space, growth markets (Atlanta, Boston, Seattle and other tech or lifestyle cities)
Development in gateway cities
Suburban offices in core US and Canada cities
Logistics: Core assets: Southern California, New Jersey, Miami, Seattle, Dallas, Chicago
Core leased assets: Mexico
Offices: Singapore, Hong Kong, Seoul. Indian cities: NCR, Mumbai and Bangalore
Retail: Growth markets such as Singapore, Chengdu, Jakarta, Kuala Lumpur and Seoul
Mid-market centres in tier 2 Chinese cities close to Shanghai and Beijing
Residential: Hong Kong
Offices: Amsterdam, tier 2 German and UK Cities, Prague, Madrid, Barcelona, Milan, Warsaw plus development in core cities: London, Paris, Stockholm, Frankfurt
Retail: Retail refurbishment in core cities in northern Europe. Core space in larger cities in Italy, Poland and Spain
Logistics: tier 2 German, Warsaw, Prague, Budapest
Opportunistic Logistics: Market servicing key Brazilian and Mexican cities
Retail and residential development: Santiago, 1st and 2nd tier Brazilian, Mexican and Colombian cities
Offices: Mexican cities for short-term gain
Under rented class A US office and apartment property: South Florida, Dallas, Chicago
Offices in emerging growth markets: Manila, Jakarta, Kuala Lumpur and Iskandar
Retail: Emerging markets: Hanoi, Kuala Lumpur, Bangkok, New Delhi and other top Indian and Chinese cities
Logistics: Gateway Chinese Cities: Shanghai, Beijing, Guangdong, as well as Indian hubs
Offices: Lisbon, Moscow, Istanbul and the EU East
Retail: Major cities in Turkey, Eastern markets of the EU, led by Romania, and active management/ development in larger cities
Logistics: Development and units serving large Eastern European cities and peripheral western cities: e.g. Oporto, Barcelona and Milan
TABLE 3 – TARGETS FOR INVESTMENT IN 2015/16
Source: Cushman & Wakefield, Global Capital Markets
15
International Investment Atlas 2015
less mature developing markets, such as Tanzania or Vietnam, have seen a considerable pickup in growth which will accelerate this year and next, with many of these markets benefitting from their low cost base and in some cases from lower oil prices as well.
The gap between the two is forecast to close but this does nonetheless highlight the potential of a wider range of markets to offer good potential and diversification opportunities. Advanced markets by contrast are expanding at a slower rate than both but are maintaining an upwards trajectory which is important for investor sentiment and creating growth potential in the property market.
Looking forward, our global position in the monetary cycle is a key risk for emerging markets given that rising interest rates, when they come, will be more harmful in these economies. At the same time however the impact will not be consistent across all and what is more, for bonds and for property, with inflation down, real yield levels are high and attractive. For an increasing number of investors, there will be more logic in looking towards developing and emerging markets.
In Asia, there are clear trends – such as outsourcing and technology – that help identify potential targets, but these have to be overlaid with government policy to decide who the winners will be. On this basis India is perhaps the leading candidate in the region given the planned reforms to both open up the economy and provide better access to
foreign investment. Indeed, liberalised labour, environmental and investment legislation should cut bureaucracy and raise potential, leading the IMF to suggest growth will soon overtake that of China.
A number of other markets offer potential as they develop – including Indonesia where reform is also underway. Vietnam too continues to develop rapidly, with a growing services and manufacturing base as a result. In the Philippines, Manila is the world number two BPO market after Bengaluru and the 4th largest office market across emerging cities in Asia. The Philippines government is active in promoting the country, and the city is well-priced from a labour or property perspective in securing future growth. Malaysia is also actively engaged in reforms to both improve the country’s fiscal position and make it a more attractive place to invest. Areas of current potential include top quality space in key areas of Kuala Lumpur or Iskandar, a special economic zone in the south, supported by both the Singapore and Malaysia government and with the potential to be a strong area for growth in the next 5 years.
In Europe, emerging opportunities of scale are relatively limited. The region’s eastern fringe is by and large again outperforming economically, however, and has a relative shortage of debt which can open up opportunities for equity investors. Each market is of course different in the risks and opportunities it brings, but as a generalisation a number offer access to reasonable quality, built, leased stock in larger cities with good risk-adjusted margins in the yield. Hungary, Romania and Bulgaria offer most such supply while the more attractive markets from a risk point of view, the Czech Republic and Poland, are typically more competitive but offer good long term potential – particularly Poland if reforms further liberalise the economy and encourage investment after this year’s election.
Elsewhere, the two heavyweights in the region for the long term are Russia and Turkey. As noted opportunities in Russia – centred on Moscow – will begin to emerge as the economy hits bottom and subject to wider political and oil price issues, the first opportunities could soon be emerging as refinancing needs build up. In Turkey meanwhile, the ability to develop a platform with local partners can be attractive, and while economic and political uncertainty have increased, growth and development continue apace. Istanbul is shaping up as a strong long-term contender for investment, and what is more, it will benefit from major infrastructure developments including new crossings for the Bosphorus and a new airport.
Other new markets are set to be of growing interest in the wider EMEA region meanwhile, with Dubai benefitting from ongoing instability in the Middle East and rapidly gaining ground again as a global hub market. Interest in Africa is also now expanding, albeit health and security risks persist and while private equity investment is increasing, it is some way from being an accepted market for most institutional investors. From a wealth and a health perspective Johannesburg and Cape Town are the top markets but others such as Lagos, Accra, Cairo and Nairobi are of interest from a strategic perspective. In the short-term the driver of commodity prices will be absent from the market of course and those countries heavily dependent on minerals such as Nigeria and Angola will be impacted. There is at the same a marked degree of growth based on technology and in the more developed countries, tech driven cities could be an early area of potential, with Addis Ababa and Nairobi leading the way. With political and security issues fading somewhat and IMF support in place, Kenya could in particular be set for early gains as it develops a new tech city close to Nairobi.
In the Americas, Brazil clearly offers a lot of long-term potential but Mexico is perhaps the leading major emerging market currently. Mexico City has a large concentration of younger workers, making it an ambitious and optimistic centre, with good education levels and employment prospects as well as one of the best live/work/play quotients in the region. Reforms are biting deeper and foreign investment is increasingly welcome while at the same time, the economy will benefit from growth in the USA.
Colombia is a strongly performing economy, with improving perceptions of risk leading to rising levels of foreign investment amid the ongoing peace process. In the property market, strong domestic demand is creating attractive opportunities for occupiers, investors and developers in the fragmented retail sector while there is strong occupational and investment demand for office stock in Bogota. The development pipeline is robust but strategic land acquisitions are another segment favoured by international investors.
A more recently emerged area of potential meanwhile is Cuba following moves to re-establish relations with the USA. Given its close ties to Miami and reforming economy, trade and inward investment could escalate rapidly, with hotels and tourism perhaps the first area likely to benefit, although it is as yet too early to gauge the likely political risks and financial rewards.
FIGURE 15 – GLOBAL GDP GROWTH
Ann
ual G
row
th
Advanced Developing Emerging0%
1%
2%
5%
4%
3%
Source: Cushman & Wakefield, Oxford Economics
2013 2014 2015 2016
16
International Investment Atlas 2015
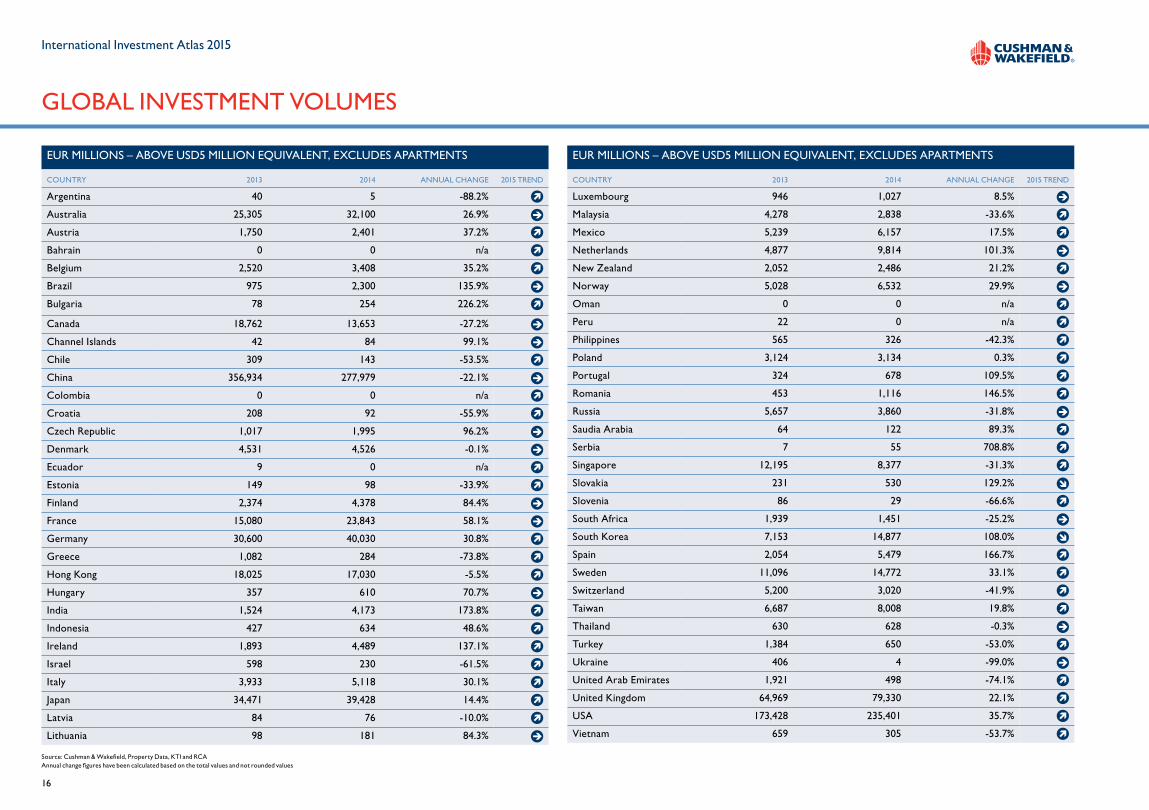
EUR MILLIONS – ABOVE USD5 MILLION EQUIVALENT, EXCLUDES APARTMENTS
COUNTRY 2013 2014 ANNUAL CHANGE 2015 TREND
Luxembourg 946 1,027 8.5%
Malaysia 4,278 2,838 -33.6%
Mexico 5,239 6,157 17.5%
Netherlands 4,877 9,814 101.3%
New Zealand 2,052 2,486 21.2%
Norway 5,028 6,532 29.9%
Oman 0 0 n/a
Peru 22 0 n/a
Philippines 565 326 -42.3%
Poland 3,124 3,134 0.3%
Portugal 324 678 109.5%
Romania 453 1,116 146.5%
Russia 5,657 3,860 -31.8%
Saudia Arabia 64 122 89.3%
Serbia 7 55 708.8%
Singapore 12,195 8,377 -31.3%
Slovakia 231 530 129.2%
Slovenia 86 29 -66.6%
South Africa 1,939 1,451 -25.2%
South Korea 7,153 14,877 108.0%
Spain 2,054 5,479 166.7%
Sweden 11,096 14,772 33.1%
Switzerland 5,200 3,020 -41.9%
Taiwan 6,687 8,008 19.8%
Thailand 630 628 -0.3%
Turkey 1,384 650 -53.0%
Ukraine 406 4 -99.0%
United Arab Emirates 1,921 498 -74.1%
United Kingdom 64,969 79,330 22.1%
USA 173,428 235,401 35.7%
Vietnam 659 305 -53.7%
EUR MILLIONS – ABOVE USD5 MILLION EQUIVALENT, EXCLUDES APARTMENTS
COUNTRY 2013 2014 ANNUAL CHANGE 2015 TREND
Argentina 40 5 -88.2%
Australia 25,305 32,100 26.9%
Austria 1,750 2,401 37.2%
Bahrain 0 0 n/a
Belgium 2,520 3,408 35.2%
Brazil 975 2,300 135.9%
Bulgaria 78 254 226.2%
Canada 18,762 13,653 -27.2%
Channel Islands 42 84 99.1%
Chile 309 143 -53.5%
China 356,934 277,979 -22.1%
Colombia 0 0 n/a
Croatia 208 92 -55.9%
Czech Republic 1,017 1,995 96.2%
Denmark 4,531 4,526 -0.1%
Ecuador 9 0 n/a
Estonia 149 98 -33.9%
Finland 2,374 4,378 84.4%
France 15,080 23,843 58.1%
Germany 30,600 40,030 30.8%
Greece 1,082 284 -73.8%
Hong Kong 18,025 17,030 -5.5%
Hungary 357 610 70.7%
India 1,524 4,173 173.8%
Indonesia 427 634 48.6%
Ireland 1,893 4,489 137.1%
Israel 598 230 -61.5%
Italy 3,933 5,118 30.1%Japan 34,471 39,428 14.4%
Latvia 84 76 -10.0%
Lithuania 98 181 84.3%
GLOBAL INVESTMENT VOLUMES
Source: Cushman & Wakefield, Property Data, KTI and RCAAnnual change figures have been calculated based on the total values and not rounded values
17
International Investment Atlas 2015
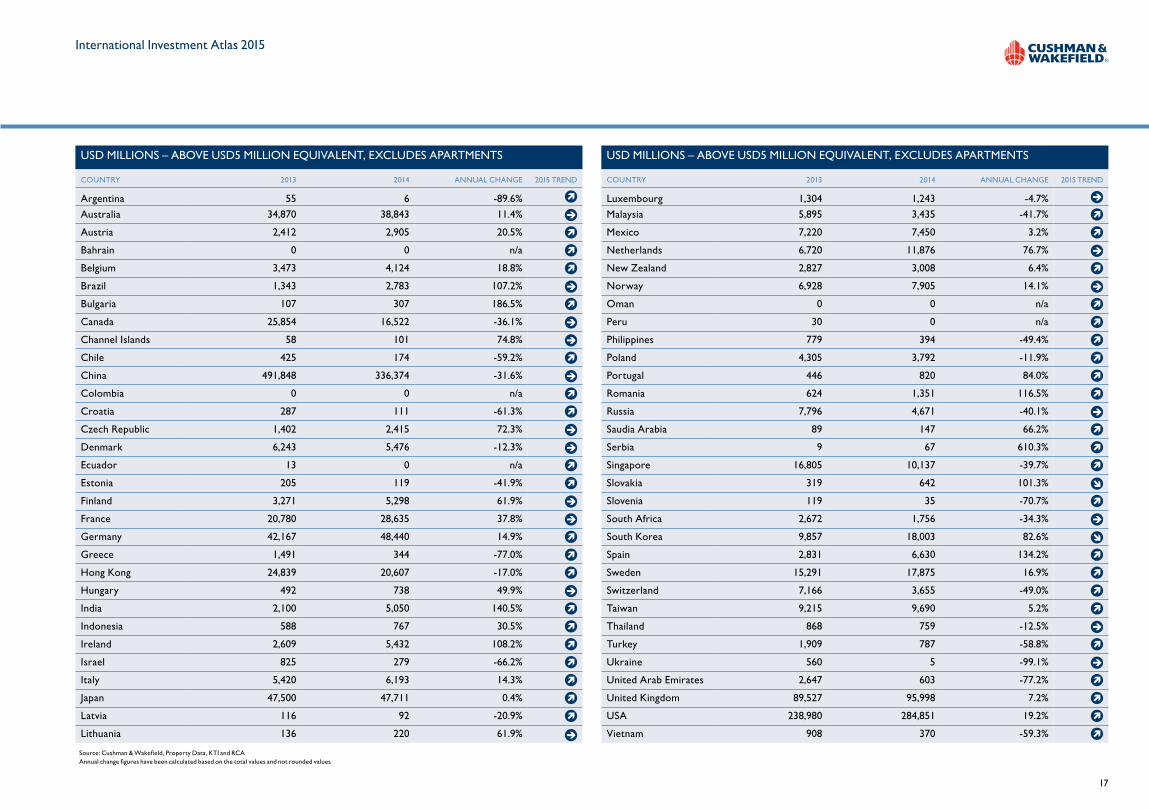
USD MILLIONS – ABOVE USD5 MILLION EQUIVALENT, EXCLUDES APARTMENTS
COUNTRY 2013 2014 ANNUAL CHANGE 2015 TREND
Argentina 55 6 -89.6%
Australia 34,870 38,843 11.4%
Austria 2,412 2,905 20.5%
Bahrain 0 0 n/a
Belgium 3,473 4,124 18.8%
Brazil 1,343 2,783 107.2%
Bulgaria 107 307 186.5%
Canada 25,854 16,522 -36.1%
Channel Islands 58 101 74.8%
Chile 425 174 -59.2%
China 491,848 336,374 -31.6%
Colombia 0 0 n/a
Croatia 287 111 -61.3%
Czech Republic 1,402 2,415 72.3%
Denmark 6,243 5,476 -12.3%
Ecuador 13 0 n/a
Estonia 205 119 -41.9%
Finland 3,271 5,298 61.9%
France 20,780 28,635 37.8%
Germany 42,167 48,440 14.9%
Greece 1,491 344 -77.0%
Hong Kong 24,839 20,607 -17.0%
Hungary 492 738 49.9%
India 2,100 5,050 140.5%
Indonesia 588 767 30.5%
Ireland 2,609 5,432 108.2%
Israel 825 279 -66.2%
Italy 5,420 6,193 14.3%Japan 47,500 47,711 0.4%
Latvia 116 92 -20.9%
Lithuania 136 220 61.9%
USD MILLIONS – ABOVE USD5 MILLION EQUIVALENT, EXCLUDES APARTMENTS
COUNTRY 2013 2014 ANNUAL CHANGE 2015 TREND
Luxembourg 1,304 1,243 -4.7%
Malaysia 5,895 3,435 -41.7%
Mexico 7,220 7,450 3.2%
Netherlands 6,720 11,876 76.7%
New Zealand 2,827 3,008 6.4%
Norway 6,928 7,905 14.1%
Oman 0 0 n/a
Peru 30 0 n/a
Philippines 779 394 -49.4%
Poland 4,305 3,792 -11.9%
Portugal 446 820 84.0%
Romania 624 1,351 116.5%
Russia 7,796 4,671 -40.1%
Saudia Arabia 89 147 66.2%
Serbia 9 67 610.3%
Singapore 16,805 10,137 -39.7%
Slovakia 319 642 101.3%
Slovenia 119 35 -70.7%
South Africa 2,672 1,756 -34.3%
South Korea 9,857 18,003 82.6%
Spain 2,831 6,630 134.2%
Sweden 15,291 17,875 16.9%
Switzerland 7,166 3,655 -49.0%
Taiwan 9,215 9,690 5.2%
Thailand 868 759 -12.5%
Turkey 1,909 787 -58.8%
Ukraine 560 5 -99.1%
United Arab Emirates 2,647 603 -77.2%
United Kingdom 89,527 95,998 7.2%
USA 238,980 284,851 19.2%
Vietnam 908 370 -59.3%
Source: Cushman & Wakefield, Property Data, KTI and RCAAnnual change figures have been calculated based on the total values and not rounded values
18
International Investment Atlas 2015
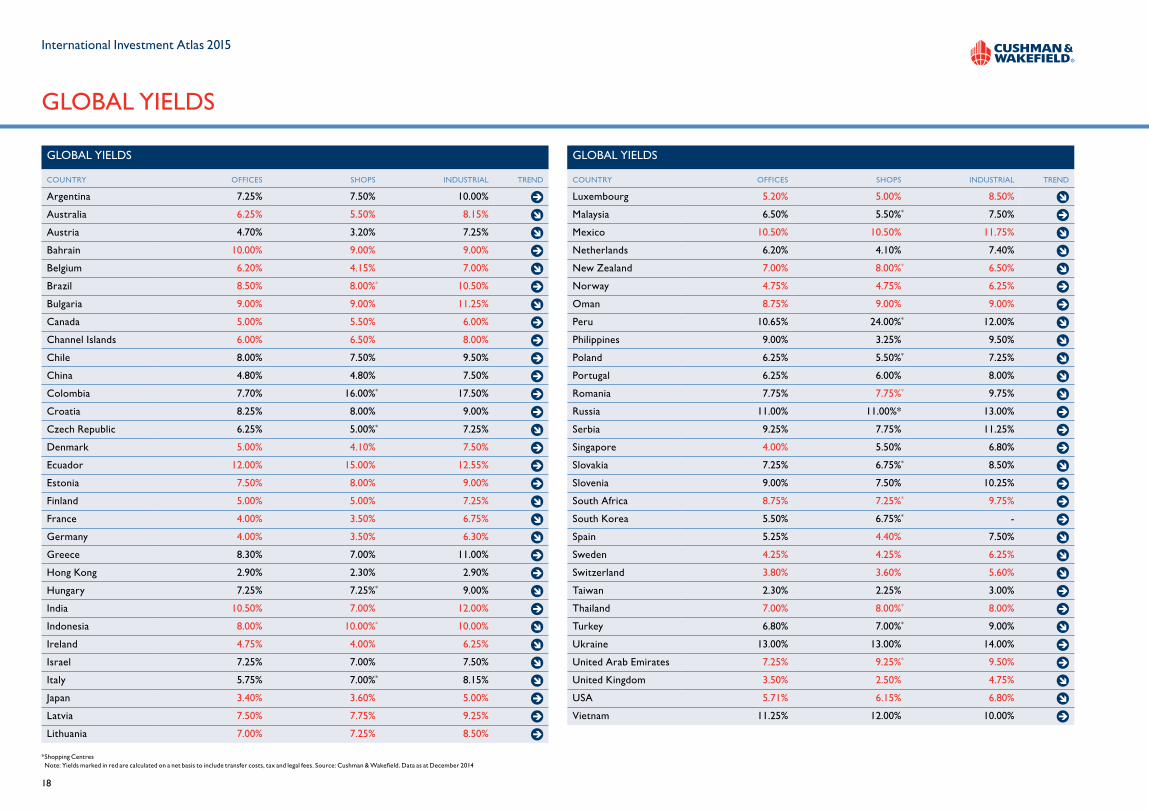
GLOBAL YIELDS
GLOBAL YIELDS
COUNTRY OFFICES SHOPS INDUSTRIAL TREND
Luxembourg 5.20% 5.00% 8.50%
Malaysia 6.50% 5.50%* 7.50%
Mexico 10.50% 10.50% 11.75%
Netherlands 6.20% 4.10% 7.40%
New Zealand 7.00% 8.00%* 6.50%
Norway 4.75% 4.75% 6.25%
Oman 8.75% 9.00% 9.00%
Peru 10.65% 24.00%* 12.00%
Philippines 9.00% 3.25% 9.50%
Poland 6.25% 5.50%* 7.25%
Portugal 6.25% 6.00% 8.00%
Romania 7.75% 7.75%* 9.75%
Russia 11.00% 11.00%* 13.00%
Serbia 9.25% 7.75% 11.25%
Singapore 4.00% 5.50% 6.80%
Slovakia 7.25% 6.75%* 8.50%
Slovenia 9.00% 7.50% 10.25%
South Africa 8.75% 7.25%* 9.75%
South Korea 5.50% 6.75%* -
Spain 5.25% 4.40% 7.50%
Sweden 4.25% 4.25% 6.25%
Switzerland 3.80% 3.60% 5.60%
Taiwan 2.30% 2.25% 3.00%
Thailand 7.00% 8.00%* 8.00%
Turkey 6.80% 7.00%* 9.00%
Ukraine 13.00% 13.00% 14.00%
United Arab Emirates 7.25% 9.25%* 9.50%
United Kingdom 3.50% 2.50% 4.75%
USA 5.71% 6.15% 6.80%
Vietnam 11.25% 12.00% 10.00%
GLOBAL YIELDS
COUNTRY OFFICES SHOPS INDUSTRIAL TREND
Argentina 7.25% 7.50% 10.00%
Australia 6.25% 5.50% 8.15%
Austria 4.70% 3.20% 7.25%
Bahrain 10.00% 9.00% 9.00%
Belgium 6.20% 4.15% 7.00%
Brazil 8.50% 8.00%* 10.50%
Bulgaria 9.00% 9.00% 11.25%
Canada 5.00% 5.50% 6.00%
Channel Islands 6.00% 6.50% 8.00%
Chile 8.00% 7.50% 9.50%
China 4.80% 4.80% 7.50%
Colombia 7.70% 16.00%* 17.50%
Croatia 8.25% 8.00% 9.00%
Czech Republic 6.25% 5.00%* 7.25%
Denmark 5.00% 4.10% 7.50%
Ecuador 12.00% 15.00% 12.55%
Estonia 7.50% 8.00% 9.00%
Finland 5.00% 5.00% 7.25%
France 4.00% 3.50% 6.75%
Germany 4.00% 3.50% 6.30%
Greece 8.30% 7.00% 11.00%
Hong Kong 2.90% 2.30% 2.90%
Hungary 7.25% 7.25%* 9.00%
India 10.50% 7.00% 12.00%
Indonesia 8.00% 10.00%* 10.00%
Ireland 4.75% 4.00% 6.25%
Israel 7.25% 7.00% 7.50%
Italy 5.75% 7.00%* 8.15%
Japan 3.40% 3.60% 5.00%
Latvia 7.50% 7.75% 9.25%
Lithuania 7.00% 7.25% 8.50%
* Shopping Centres Note: Yields marked in red are calculated on a net basis to include transfer costs, tax and legal fees. Source: Cushman & Wakefield. Data as at December 2014
19
International Investment Atlas 2015
OUR RESEARCH SERVICESThe EMEA Central Research & Consultancy Team provides a strategic advisory and supporting role to our clients. Consultancy projects are undertaken on a local and international basis, providing in-depth advice and analysis, detailed market appraisals and location and investment strategies. Typical projects include:
• Site specific location analysis, ranking and targeting for occupation or investment
• Analysis of future development activity and existing supply/competition
• Market research and demand analysis by retail or industry sector
• Rental analysis, forecasts & investment portfolio strategy
• Reliable and comparable data and market intelligence – we regularly track over 65 countries, including multiple data points across the world. As part of this consultancy service line, we can provide this time series data on the retail, office and industrial property sectors.
THE REPORTThis report has been prepared by our Capital Markets Investment Strategy and Central Research & Consultancy teams using data collected through our own research as well as information available to us from public and other external sources. Transaction information relates to non-confidential reported market deals, excluding indirect investment and future commitments. In reference to investment volumes, while the report Overview considers all sectors including multifamily residential, the country pages and global volume tables exclude multifamily residential deals. All investment volumes are quoted pertaining to deals of USD 5 million or equivalent and above.
All country page profiles were written between the dates of 16 Jan – 13 Feb, and therefore, political and economic situations may have changed since the time of writing.
In respect of all external information, the sources are believed to be reliable and have been used in good faith. However, Cushman & Wakefield cannot accept responsibility for their accuracy and completeness, nor for any undisclosed matters that would affect the conclusions drawn. Certain assumptions and definitions used in this research work are given within the body of the text. Information on any other matters can be obtained from the EMEA Central Research & Consultancy team of Cushman & Wakefield.
ALLIANCE & ASSISTANCEThis report has been prepared by Cushman & Wakefield and its local partners globally, with special thanks to the following offices:
Austria BAR bareal Immobilientreuhand GmbH Bahrain Cluttons LLP Bulgaria Forton International Channel Islands Buckley & Company Ltd. Denmark RED – Property Advisers Estonia Ober-Haus Real Estate Advisers Finland Tuloskiinteistöt Oy Greece Proprius SA Ireland Lisney LLP Israel Inter Israel Real Estate Consultants Latvia Ober-Haus Real Estate Advisers Lithuania Ober-Haus Real Estate Advisers Malaysia IVPS Property Consultant Sdn Bhd New Zealand Bayleys Realty Group Ltd. Norway Eiendomshuset Malling & Co. Oman Cluttons LLP. Romania Activ Property Services SRL Saudi Arabia Cluttons LLP Serbia Forton International Slovenia S-Invest d.o.o. South Africa ProAfrica Property Services Switzerland SPG Intercity Commercial Property Consultants Thailand Nexus Property Consultants Ltd. Ukraine First Realty Brokerage United Arab Emirates Cluttons LLP
SOURCESMacro economic data Macrobond, Consensus Economics, the Financial Times and Oxford Economics Forecasting.
On each country page: • The GDP per capita data is on a purchasing power parity (PPP) basis • The interest rates are year-end base rates • Currency conversion rates are December month-end spot rates
India Please note that, although macroeconomic data is sourced from Oxford Economics, the Indian government has revised their GDP calculation methodology, and thus the revised GDP numbers could be higher than what is indicated in the report.
Transactional data Alongside Cushman & Wakefield information, data has been used from Real Capital Analytics (RCA), Property Data and KTI. Where the data was sourced from RCA it is at 4 February 2015. Exchange rates used for the investment volume global tables are year-end currency rate and not as at the date of the deal.
Maps All maps were produced using InSite. © 2015 CACI Limited and all other applicable third party notices can be found at http://www.caci.co.uk/copyrightnotices.pdf
RESEARCH SERVICES AND THE REPORT
FOR FURTHER INFORMATION CONTACT
GLOBAL RESEARCH CONTACTS
Joanna TanoDirector Head of EMEA Central Research & [email protected] +44 20 7152 5944
Maria SicolaExecutive Managing Director Americas [email protected]+1 415 773 3542
Sigrid ZialcitaManaging Director Asia Pacific [email protected]+65 6232 0875
Erin Can Marketing & Editorial Manager EMEA Central Research & [email protected]+44 20 7152 5206

20
International Investment Atlas 2015
THE AMERICAS
THE AMERICAS
Capital Markets provides comprehensive advice and execution services to clients engaged in buying, selling, investing in, financing or developing real estate and real estate-related assets across the globe. Our solutions are tailored to meet the objectives of private and institutional owners and investors, as well as corporate owners and occupiers.
Whether you are seeking to dispose of an asset in Hong Kong, finance the purchase of a hotel in New York, or structure a complex cross border portfolio deal in Europe, Cushman & Wakefield’s expertise in capital markets is the gold standard.
Located in major markets around the world, our professionals execute customised acquisition and disposal strategies across all major property types. Additionally, we provide our clients with unique access to opportunities and capital sources worldwide. As a global leader in investment transactions, we have an unsurpassed network of buyers and sellers, access to international capital and superior market data.
Our services include but are not limited to:
• Investment Sales & Acquisitions
• Investment Advisory Services
• Investment Strategy and Market Analysis
• Equity, Debt & Structured Finance
• Corporate Finance & Investment Banking
CAPITAL MARKETS SERVICES
For further information on our services contact:
Janice StantonSenior Managing Director Investment Strategy [email protected] +1 212 841 5025
David HutchingsPartner Head of EMEA Investment Strategy [email protected] +44 20 7152 5029
Sigrid Zialcita Managing Director Asia Pacific [email protected] +65 6232 0875
INVESTMENT STRATEGY
CAPITAL MARKETS
INVESTMENT BANKING
EMEA THE AMERICAS ASIA PACIFIC
John StinsonExecutive Managing Director Asia Pacific Capital Markets [email protected] +65 6232 0878
Robert GriffinHead of US Capital Markets The Americas [email protected] +1 617 204 4150
Jan-Willem Bastijn CEO EMEA Capital [email protected] +31 20 800 2081
EMEAASIA PACIFIC
Priyaranjan KumarRegional Director Asia Pacific Capital [email protected] +65 8339 5335
Steven KohnExecutive Vice President Head of EDSF [email protected] +1 212 841 9216
Frank Nickel Managing Partner Head of EMEA Corporate [email protected] +49 69 5060 73111
EMEAASIA PACIFIC
21
International Investment Atlas 2015
GLOBAL CAPITAL MARKETS CONTACTS
THE AMERICAS
BRAZILAndre GermanosDirector, Capital [email protected] +55 1155 015901
Praça José Lannes 40- 3rd FloorSão Paulo - SP - Brazil04571-100
ARGENTINAHerman Faigenbaum Managing Director [email protected] +54 11 5555 1113
Carlos Pellegrini, 1141 Buenos Aires C1009ABX
CANADAScott ChandlerPresident & CEO CanadaValuation & [email protected] +1 416 359 2490
33 Yonge Street, Suite 1000Toronto, Ontario MSE 1S9
MEXICOAnder LegorretaExecutive Director, Capital [email protected] +52 55 8525 8027
Paseo de los Tamarindos 60, 2nd floorCol. Bosques de las Lomas Mexico City, D.F. C.P. 05120
UNITED STATESNEW YORK
Fred C. HarmeyerSenior Managing Director Capital MarketsRegional Head - [email protected] +1 212 841 7515
Steven KohnPresident, Equity Debt & Structured [email protected] +1 212 841 9216
Michael RotchfordExecutive Vice President, Corporate Finance & Investment [email protected] +1 212 841 7616
Alex Ray Managing Director, Capital Markets - Global Capital [email protected] +1 212 841 5067
1290 Avenue of the AmericasNew York, NY 10104-6178
CHICAGO
Shawn MobleyExecutive Vice President US Head of Investor [email protected] +1 312 470 2350
200 South Wacker DriveSuite 2800Chicago, IL 60606
SAN FRANCISCO
Steven A. WeilbachSenior Managing Director Capital Markets National Head of [email protected] +1 415 773 3510
425 Market Street, Suite 2300 San Francisco, CA 94105-2406
ASIA PACIFIC
AUSTRALIA Joshua CharlesManaging Director, NSW Managing Director, Capital [email protected] +61 2 9223 4888
Level 18, 175 Pitt StreetSydney, NSW 2000
CHINATed LiExecutive Director, Capital Markets [email protected] +86 10 5921 0820
Units 602-607, Tower 1, China Central PlaceNo. 81 Jianguo Lu, Chaoyang DistrictBeijing 100025
Justina FanHead of Outbound Investment Greater ChinaExecutive Director Capital Markets Asia Pacific [email protected] +86 13482 529 090 or +852 90206 850
Mark SuchyDirector, Investment, Capital [email protected] +86 212 3200 808
Unit 806, 21st Century TowerNo. 210 CenturyShanghai
HONG KONGKent FongExecutive [email protected] +85 229 56 7081
St George's Building, 9th Floor2 Ice House Street
INDIADiwakar [email protected] +91 124 469 5555
Tower C, Building 8, 14th FloorDLF Cyber CityGurgaon, Haryana-122002
INDONESIAHanda Sulaiman Executive Director [email protected] +62 21 2550 9570
Indonesia Stock Exchange Building Tower 2, 15/F JI. Jend. Sudirman Kav.52-53Jakarta 12190
JAPANYoshiyuki Tanaka Executive [email protected] +81 335 967 060
Sanno Park Tower 13F 2-11-1 NagatachoChiyoda-ku, Tokyo, 100-6113
REPUBLIC OF KOREASteve KimSenior Manager, Capital [email protected] +82 237 0888 43
6F Seoul Fiannve Center 136Sejong-daero, Jung-guSeoul, 100-768
SINGAPOREPriyaranjan KumarRegional Director Capital Markets Asia [email protected] +65 6232 0840
3 Church Street#09-03 Samsung HubSingapore, 049483
PHILIPPINESJoe CurranGeneral [email protected] +63 2830 8587
Unit 901 & 9069th Floor, Eco Tower 32nd Street corner 9th AvenueBonifacio Global City Taguig, Metro Manila, 1634
VIETNAMTim Horton General Manager [email protected] +84 8 3823 7968
Unit 16, 14th Floor, Vincom Center72 Le Thanh Ton St.Ben Nghe ward, District 1Ho Chi Minh City
FOR ALL OTHER ASIA PACIFIC ENQUIRIES CONTACT:
John StinsonManaging Director Capital Markets, Asia [email protected]+65 6232 0878

22
International Investment Atlas 2015
EMEA
BELGIUMKoen NevensManaging Partners, Capital [email protected] +32 2 5460863
Avenue des Arts, 56 1000 Brussels
CZECH REPUBLICJirí FousekPartner, Head of Capital [email protected] +420 234 603 210
Na Príkope 1110 00 Prague 1
FRANCEThierry Juteau Partner, Head of Capital Markets [email protected] +33 1 53 76 95 51
11-13 Ave de Friedland75008 Paris
GERMANYFRANKFURT
Frank NickelPartner, CEO Germany Chairman EMEA Corporate [email protected] +49 69 50 607 3 111
Michael MorganPartner, Capital [email protected] +49 69 50 607 3 230
Rathenauplatz 1 60313 Frankfurt am Main
BERLIN
Hanns-Joachim Fredrich Partner, Capital Markets hannsjoachim.fredrich@ eur.cushwake.com +49 30 20 21 4 46 20
Leipziger Straße 126 10117 Berlin
HAMBURG
Stefan AlbertHead of Capital [email protected] +49 40 30 088 1114
Bergstraße 1620095 Hamburg
MUNICH
Thomas MüllerPartner, Capital [email protected] +49 89 24 2 143 344
Maximilianstraße 40 80539 Munich
HUNGARYMike EdwardsPartner, Head of Capital [email protected]+36 1 484 1385
1052 BudapestDeak PalotaDeak Ferenc UTCA 15Budapest
ITALYMILAN
Stephen Screene Partner, Head of Capital Markets [email protected] +39 02 63799 224
Via Filippo Turati 16/1820121 Milan
ROME
Carlo Vanini Partner, Capital Markets [email protected] +39 06 420079 45
Via Vittorio Veneto 54b00187 Rome
THE NETHERLANDSMathijs Flierman Partner, Head of Capital Markets [email protected] +31 20 800 2089
Atrium building, 3rd FloorStrawinskylaan 31251077 ZX Amsterdam
POLANDPiotr Kaszyński Partner, Head of Capital Markets [email protected] +48 22 820 2037
James Chapman Partner, Head of CE Capital [email protected]+48 22820 2169
MetropolitanPlac Pilsudskiego 100-078 Warsaw
PORTUGALLuis AntunesPartner, Head of Capital Markets [email protected] +351 21 322 4753
Avenida da Liberdade 1312nd Floor1250-140 Lisbon
RUSSIAIrina UshakovaPartner, Head of Capital Markets [email protected] +7 495 799 9872
Ducat Place ||| BC, 6th FloorGasheka Street, 6125047 Moscow
SLOVAKIACristina DumitracheManaging [email protected] +42 1911 048 233
Pribinova 10811 09 Bratislava
SPAINBARCELONA
Reno Cardiff Partner, Capital Markets [email protected] +34 93 272 1668
Passeig de Gracia, 56, 7th FloorBarcelona, 08007
MADRID
Rupert LeaPartner, Capital Markets [email protected] +34 91 781 3837
Edificio BeatrizJosé Ortega y Gasset, 29-6th FloorMadrid, 28006
SWEDENAnders NordvallManaging [email protected] +46 70681 4920
Sergels Torg 12 Stockholm, SE-111 57
TURKEYTugra GöndenPartner, Capital Markets [email protected] +90 212 334 7800
Didem ErendilDirector, Head of Capital [email protected] +90212 334 7800
River PlazaBüyükdereCd Bahar Sk No: 13 Kat: 15Levent 34394 Istanbul
UNITED KINGDOMMike RoddaHead of Retail, EMEA Capital [email protected] +44 207 152 5661
David HutchingsHead of Investment Strategy EMEA Capital [email protected] +44 207 152 5029
David ErwinPartnerUK [email protected] +44 20 7152 5016
James BeckhamPartner Head of London Capital [email protected] +44 20 7152 5854
PJ ThibaultPartner UK Business [email protected] +44 20 7152 5022
Frank NickelHead of EMEA Corporate [email protected] +49 69 5060 73111
43-45 Portman SquareLondon W1A 3BG
FOR ALL OTHER EMEA ENQUIRIES CONTACT:
Jan-Willem BastijnCEO EMEA Capital [email protected]+44 207 1525531
23
International Investment Atlas 2015
REGIONAL MARKET PROFILES SUMMARY
ArgentinaBrazilCanadaChileColombia
EcuadorMexico PeruUSA
This International Investment Atlas Overview report is supplemented by three Regional Market Profiles, all of which include page-by-page country reviews. New this year, the report also is supplemented by visual one-page handouts for quick reference of the key investment trends shaping each global region.
To download all sections of this report and access global contacts please visit our dedicated International Investment website:
investmentatlas.cushwake.com
MARKET PROFILES: ASIA PACIFICMARKET PROFILES: AMERICAS MARKET PROFILES: EMEA
AustraliaChinaHong KongIndiaIndonesiaJapanMalaysia
New ZealandPhilippinesSingaporeSouth KoreaTaiwanThailandVietnam
AustriaBahrainBelgiumBulgariaChannel IslandsCroatiaCzech RepublicDenmarkEstoniaFinlandFranceGermanyGreeceHungaryIrelandIsraelItalyLatvia
LithuaniaLuxembourgNetherlandsNorwayPolandPortugalRomaniaRussiaSlovakiaSlovenia South Africa SpainSwedenSwitzerlandTurkeyUkraine United Arab EmiratesUK

24
International Investment Atlas 2015
Cushman & Wakefield (C&W) is known the world-over as an industry knowledge leader. Through the delivery of timely, accurate, high-quality research reports on the leading trends, markets around the world and business issues of the day, we aim to assist our clients in making property decisions that meet their objectives and enhance their competitive position. In addition to producing regular reports such as global rankings and local quarterly updates available on a regular basis, C&W also provides customized studies to meet specific information needs of owners, occupiers and investors. A recognized leader in local and global real estate research, the firm publishes its market information and studies online at cushmanwakefield.com/research
Cushman & Wakefield advises and represents clients on all aspects of property occupancy and investment. Founded in 1917, it has 248 offices in 58 countries, employing more than 16,000 professionals. It offers a complete range of services to its occupier and investor clients for all property types, including leasing, sales and acquisitions, equity, debt and structured finance, corporate finance and investment banking, appraisal, consulting, corporate services, and property, facilities, project and risk management. To learn more, visit cushmanwakefield.com.
This report has been prepared solely for information purposes. It does not purport to be a complete description of the markets or developments contained in this material. The information on which this report is based has been obtained from sources we believe to be reliable, but we have not independently verified such information and we do not guarantee that the information is accurate or complete.
Published by Corporate Communications.
©2015 Cushman & Wakefield. All rights reserved.
Cushman & Wakefield, LLP 43-45 Portman Square London W1A 3BG
cushmanwakefield.com

www.cushmanwakefield.com
££
£
£$$$
¥€ €€ £
££
£
$$$ ¥ €€
€€£
££
£$$$
$
£££
£
$$$ ¥€
£
£
£
$
$
$££
£
£
$
$
$¥
€
££$ $
¥€€
€
€£ £
£
£
$ $
$
¥€€
$
£££
$$$ £
££
£$$$
¥
€
£
£$
££ $ ¥€€€€ £
££ £$
$
¥€
€$
£
£
€
£
£ £
$
$
$ ¥€€€€ ££
£
$$
$¥
€
€
$
£
£
£$ $
¥
£ £
££
$ $$
¥
€
£
£ £ $¥€€
€€
£
££
£
$
$$ ¥€ €$
£
£
£$$
¥ ££
£
$$
¥€
£$£€£ £
£$ $¥
€€
£$
££$
£
$$
£$
€££
£
$$
¥€
¥$£
££
€
$
£
$¥
$
££€
$€
£ £
$$
€
¥$£ $£
£€
$
£
€£ £€
€£$
€ ££ £
$
$
¥
€
¥
$£$
££€$£ €
£
¥
€£€
£
£
$
€
¥
$
£
$£€
$€
££
££
€ ££
$
£
$€
€
© 2015 Cushman & Wakefield All rights reserved