Embed Size (px)
Citation preview
Prof. Rachel Warren, Tyndall Centre
Over view of Climate Change Impacts: The ‘Burning Embers’ Figure
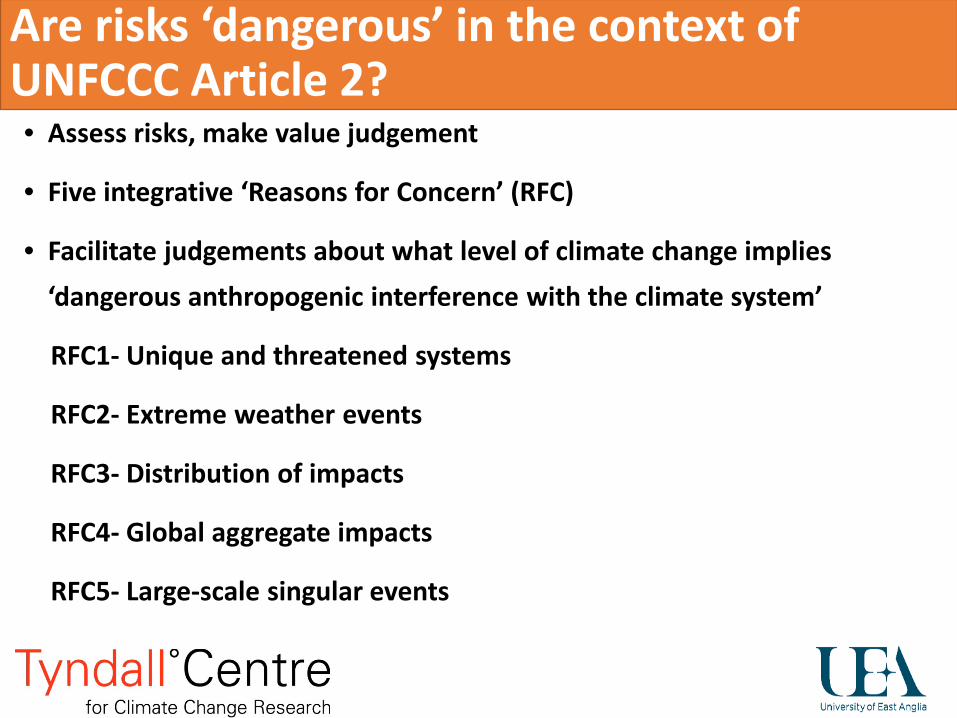
Are risks ‘dangerous’ in the context of UNFCCC Article 2?
• Assess risks, make value judgement
• Five integrative ‘Reasons for Concern’ (RFC)
• Facilitate judgements about what level of climate change implies ‘dangerous anthropogenic interference with the climate system’
RFC1- Unique and threatened systems
RFC2- Extreme weather events
RFC3- Distribution of impacts
RFC4- Global aggregate impacts
RFC5- Large-scale singular events
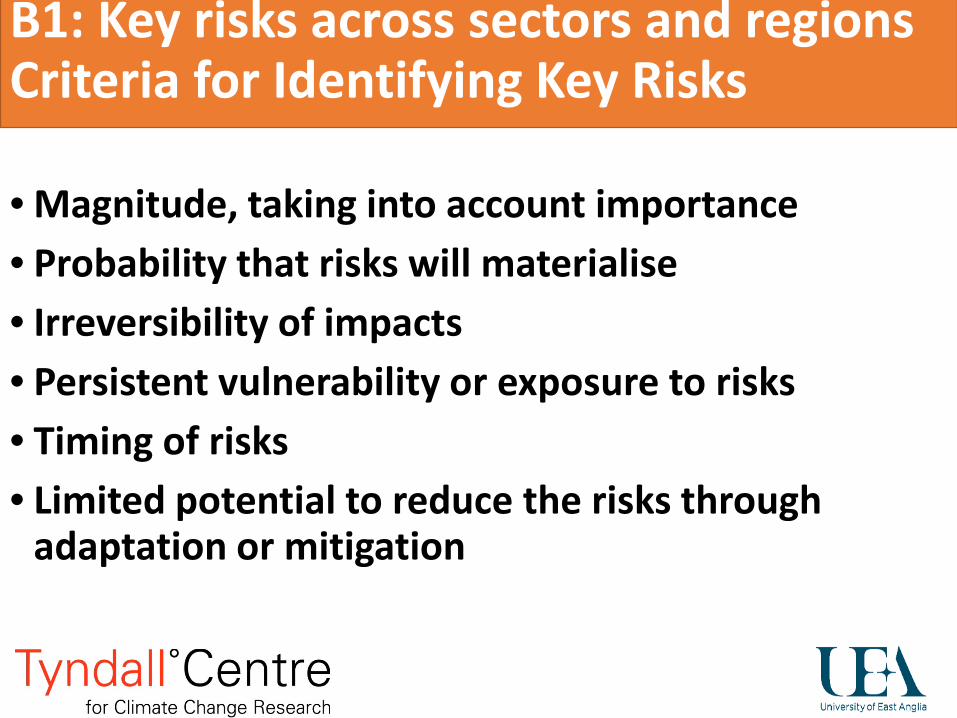
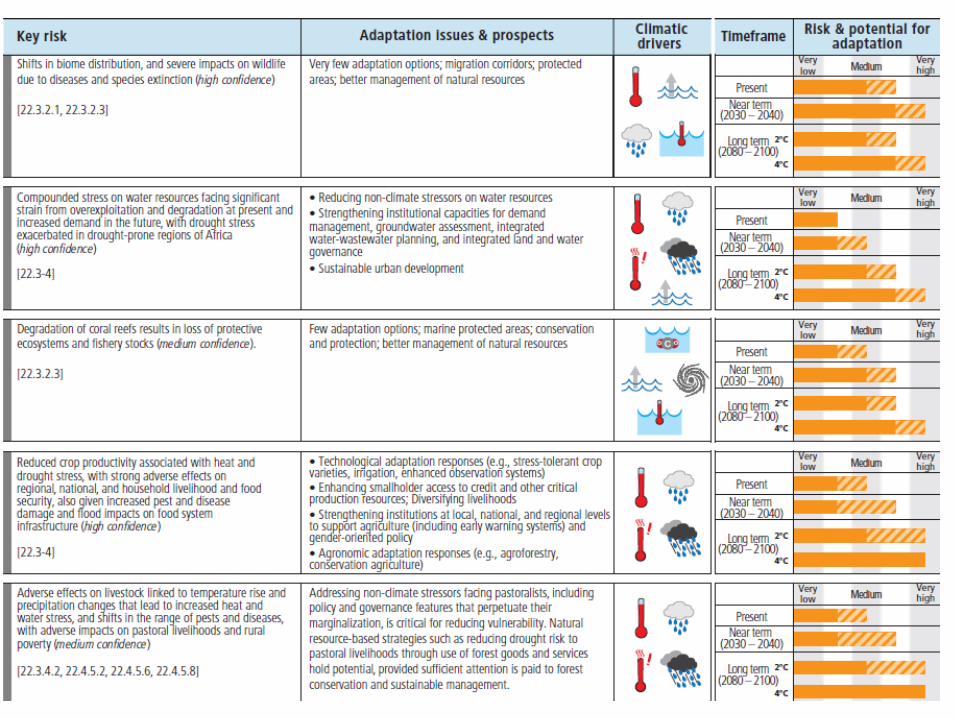
B1: Key risks across sectors and regions Criteria for Identifying Key Risks
• Magnitude, taking into account importance • Probability that risks will materialise • Irreversibility of impacts • Persistent vulnerability or exposure to risks • Timing of risks • Limited potential to reduce the risks through
adaptation or mitigation
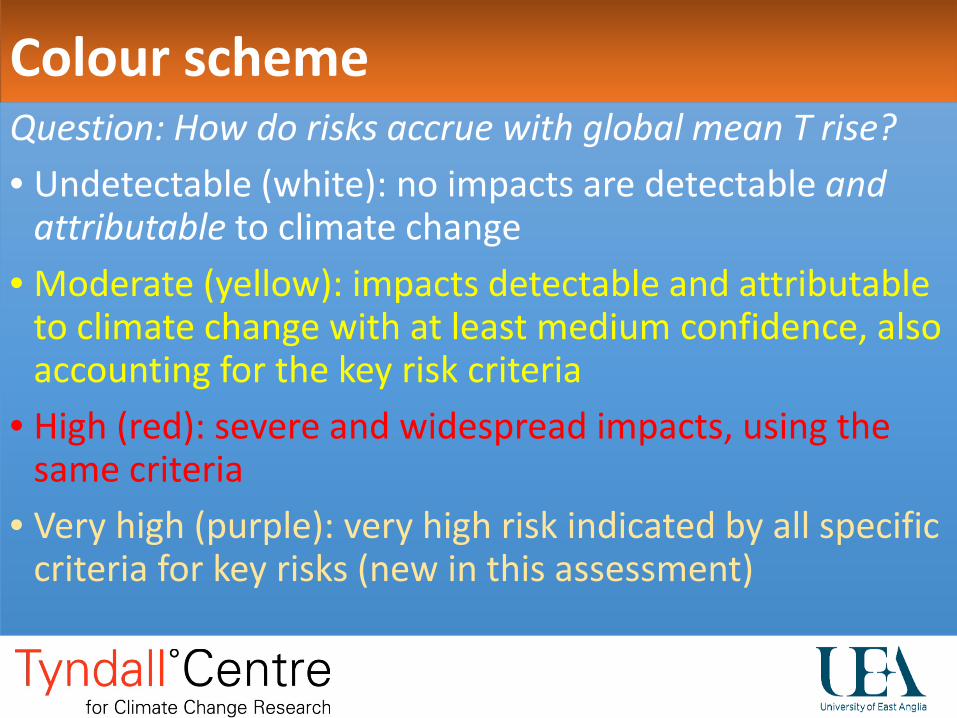
Colour scheme Question: How do risks accrue with global mean T rise? • Undetectable (white): no impacts are detectable and
attributable to climate change • Moderate (yellow): impacts detectable and attributable
to climate change with at least medium confidence, also accounting for the key risk criteria
• High (red): severe and widespread impacts, using the same criteria
• Very high (purple): very high risk indicated by all specific criteria for key risks (new in this assessment)
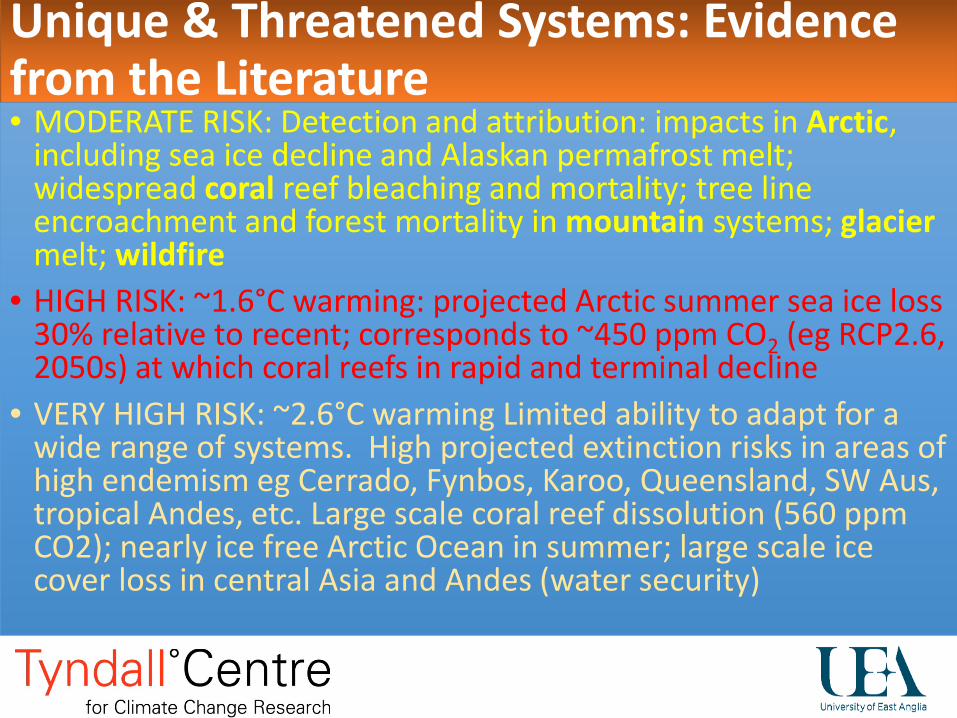
Unique & Threatened Systems: Evidence from the Literature • MODERATE RISK: Detection and attribution: impacts in Arctic,
including sea ice decline and Alaskan permafrost melt; widespread coral reef bleaching and mortality; tree line encroachment and forest mortality in mountain systems; glacier melt; wildfire
• HIGH RISK: ~1.6°C warming: projected Arctic summer sea ice loss 30% relative to recent; corresponds to ~450 ppm CO2 (eg RCP2.6, 2050s) at which coral reefs in rapid and terminal decline
• VERY HIGH RISK: ~2.6°C warming Limited ability to adapt for a wide range of systems. High projected extinction risks in areas of high endemism eg Cerrado, Fynbos, Karoo, Queensland, SW Aus, tropical Andes, etc. Large scale coral reef dissolution (560 ppm CO2); nearly ice free Arctic Ocean in summer; large scale ice cover loss in central Asia and Andes (water security)
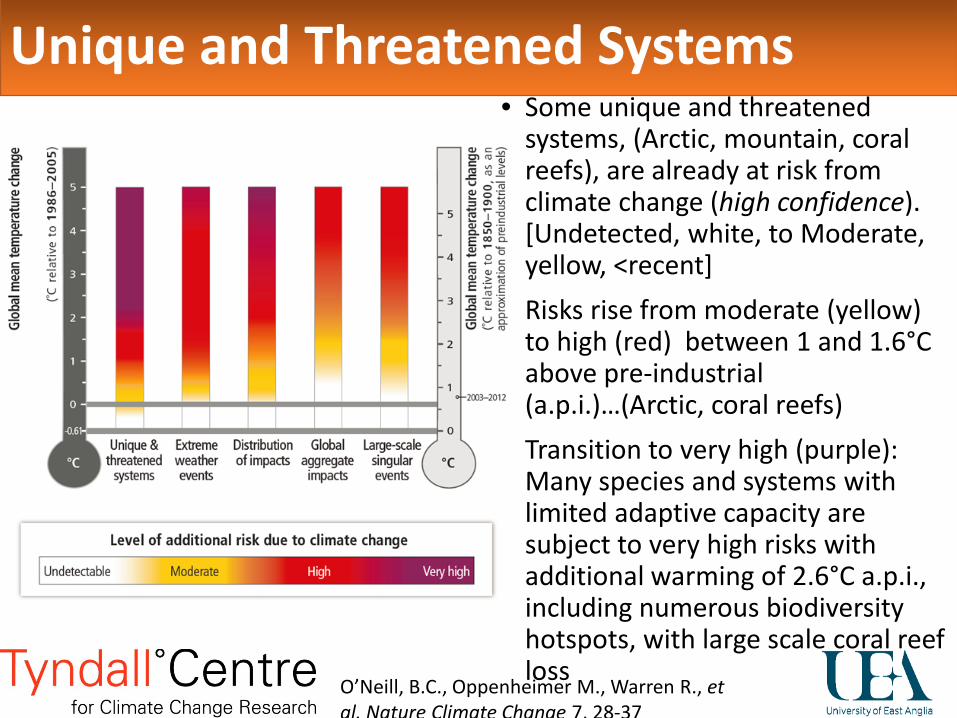
• Some unique and threatened systems, (Arctic, mountain, coral reefs), are already at risk from climate change (high confidence). [Undetected, white, to Moderate, yellow, <recent]
• Risks rise from moderate (yellow) to high (red) between 1 and 1.6°C above pre-industrial (a.p.i.)…(Arctic, coral reefs)
• Transition to very high (purple): Many species and systems with limited adaptive capacity are subject to very high risks with additional warming of 2.6°C a.p.i., including numerous biodiversity hotspots, with large scale coral reef loss
Unique and Threatened Systems
O’Neill, B.C., Oppenheimer M., Warren R., et al. Nature Climate Change 7, 28-37
Extreme Weather Events • Examples: Heat waves, drought, intense precipitation,
tropical cyclones • Attribution of observed changes to anthropogenic climate
change: • Changes in frequency and intensity of daily temperature
extremes very likely • Change in probability of heat wave likely • Intensification of precipitation over some land areas
medium confidence • Drought low confidence • Tropical cyclone activity low confidence
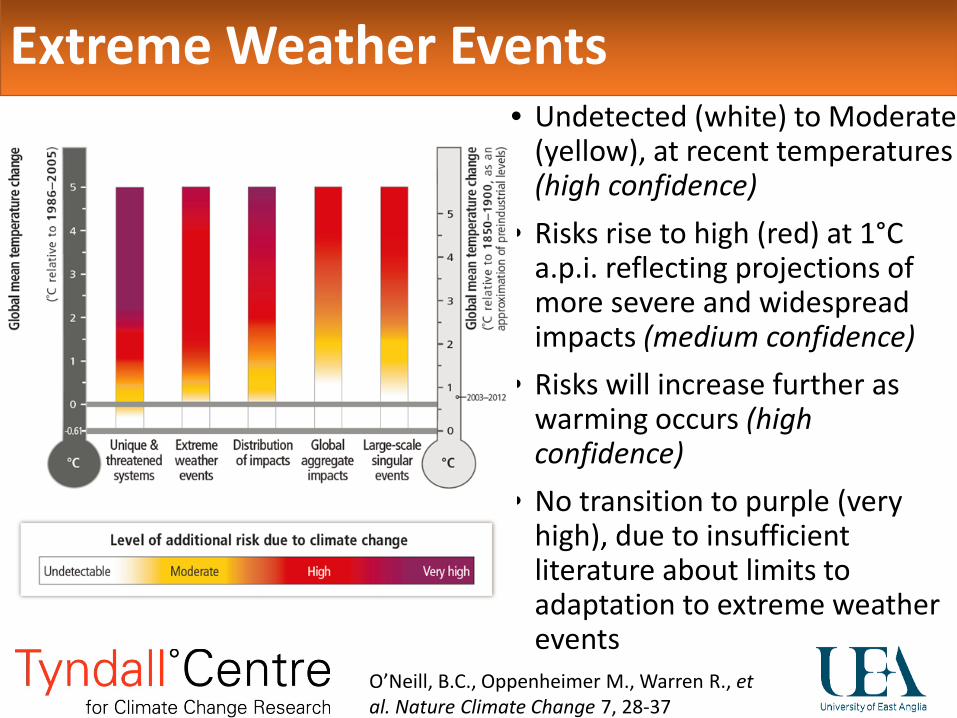
• Undetected (white) to Moderate (yellow), at recent temperatures (high confidence)
• Risks rise to high (red) at 1°C a.p.i. reflecting projections of more severe and widespread impacts (medium confidence)
• Risks will increase further as warming occurs (high confidence)
• No transition to purple (very high), due to insufficient literature about limits to adaptation to extreme weather events
Extreme Weather Events
O’Neill, B.C., Oppenheimer M., Warren R., et al. Nature Climate Change 7, 28-37
Distribution of Impacts • Risks to societies or socioecological systems that are disproportionate • Low latitude, less developed areas at greatest risk • Some population groups in developed countries are also at
disproportionately high risk • Declines in some low latitude crop yields already detected and
attributed with medium to high confidence • Projections show geographical differences in risk and highlight the
areas most at risk from – reductions in crop yields, reductions in water supplies, increases in flooding, and impacts on ecosystem services.
• Example 1: Most climate models project runoff will decrease in the Mediterranean: recent work confirms
• Example 2: Between 1.7-2.7C around 40% of the population is exposed to increased water stress (Gosling & Arnell, 2013)
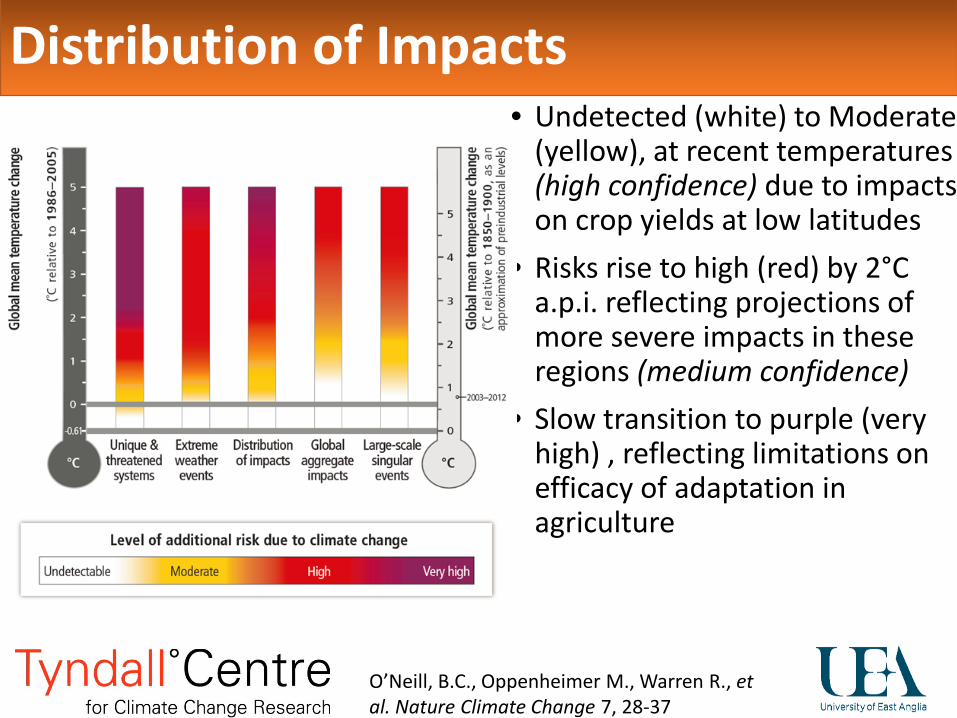
• Undetected (white) to Moderate (yellow), at recent temperatures (high confidence) due to impacts on crop yields at low latitudes
• Risks rise to high (red) by 2°C a.p.i. reflecting projections of more severe impacts in these regions (medium confidence)
• Slow transition to purple (very high) , reflecting limitations on efficacy of adaptation in agriculture
Distribution of Impacts
O’Neill, B.C., Oppenheimer M., Warren R., et al. Nature Climate Change 7, 28-37
Global Aggregate Impacts • Can be aggregated by a single metric • Examples: monetary damage, lives lost, ecosystem
degradation leading to loss of ecosystem services • Ecosystem degradation: large scale species extirpation and
disruption of function • Avoid double counting : economic studies largely exclude
estimates of impacts on biodiversity and ecosystem services but many do include impacts on human health
• Economic estimates incomplete, generally don’t capture uncertainties in climate projection/CO2 fertilisation effects, omit large scale singular events, extreme weather events, ecosystem services; depend on disputable assumptions.
O’Neill, B.C., Oppenheimer M., Warren R., et al. Nature Climate Change 7, 28-37
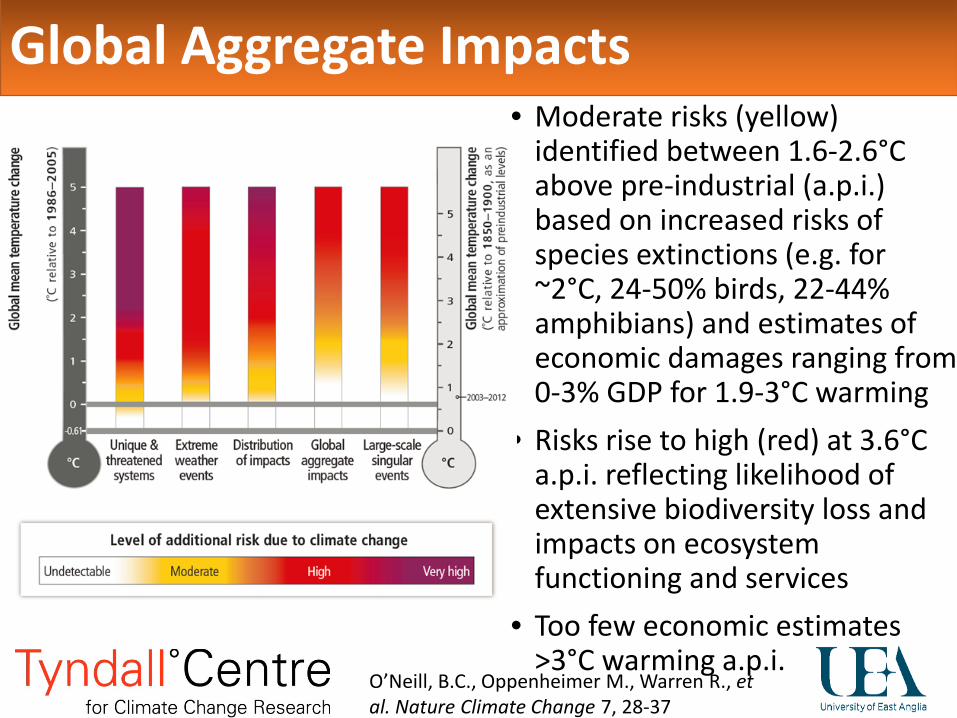
• Moderate risks (yellow) identified between 1.6-2.6°C above pre-industrial (a.p.i.) based on increased risks of species extinctions (e.g. for ~2°C, 24-50% birds, 22-44% amphibians) and estimates of economic damages ranging from 0-3% GDP for 1.9-3°C warming
• Risks rise to high (red) at 3.6°C a.p.i. reflecting likelihood of extensive biodiversity loss and impacts on ecosystem functioning and services
• Too few economic estimates >3°C warming a.p.i.
Global Aggregate Impacts
O’Neill, B.C., Oppenheimer M., Warren R., et al. Nature Climate Change 7, 28-37
Large Scale Singular Events • Also called ‘Tipping Points’ • Abrupt, drastic changes in physical, ecological or social
systems in response to smooth changes in climate • Examples: Loss of Arctic summer sea ice, Melting of
Greenland Ice Sheet, West Antarctic Ice Sheet, shutdown of AMOC, release of methane from permafrost & ocean hydrates, transformation of Amazon to savannah, and of coral reefs to algal mats.
• Observations: signs of loss of Arctic summer sea ice, and beginning of transformation of coral systems
O’Neill, B.C., Oppenheimer M., Warren R., et al. Nature Climate Change 7, 28-37
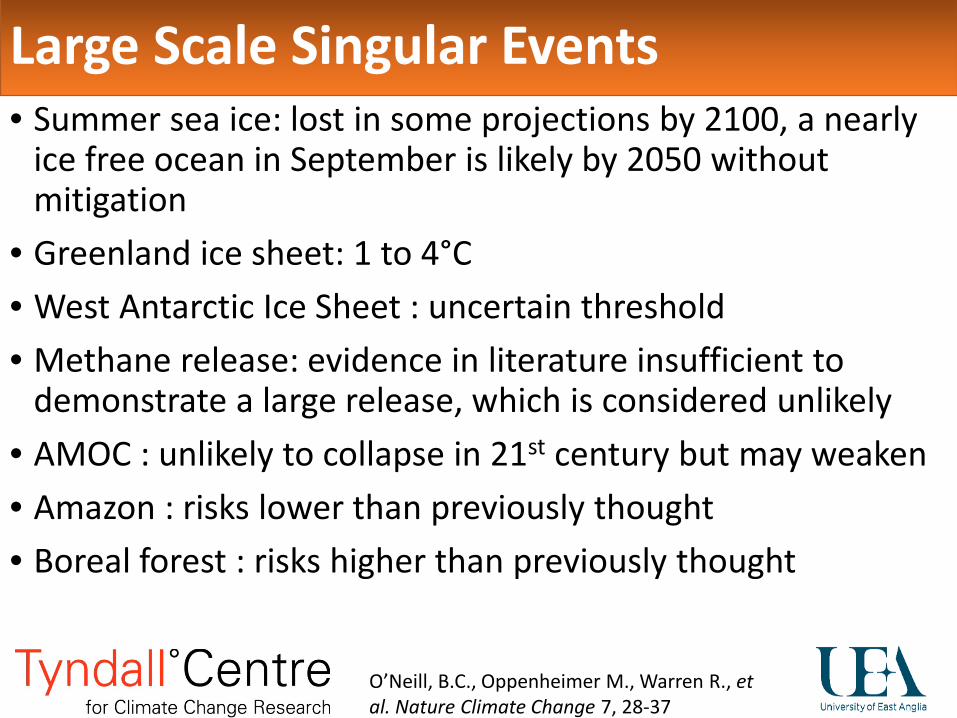
Large Scale Singular Events • Summer sea ice: lost in some projections by 2100, a nearly
ice free ocean in September is likely by 2050 without mitigation
• Greenland ice sheet: 1 to 4°C • West Antarctic Ice Sheet : uncertain threshold • Methane release: evidence in literature insufficient to
demonstrate a large release, which is considered unlikely • AMOC : unlikely to collapse in 21st century but may weaken • Amazon : risks lower than previously thought • Boreal forest : risks higher than previously thought
O’Neill, B.C., Oppenheimer M., Warren R., et al. Nature Climate Change 7, 28-37
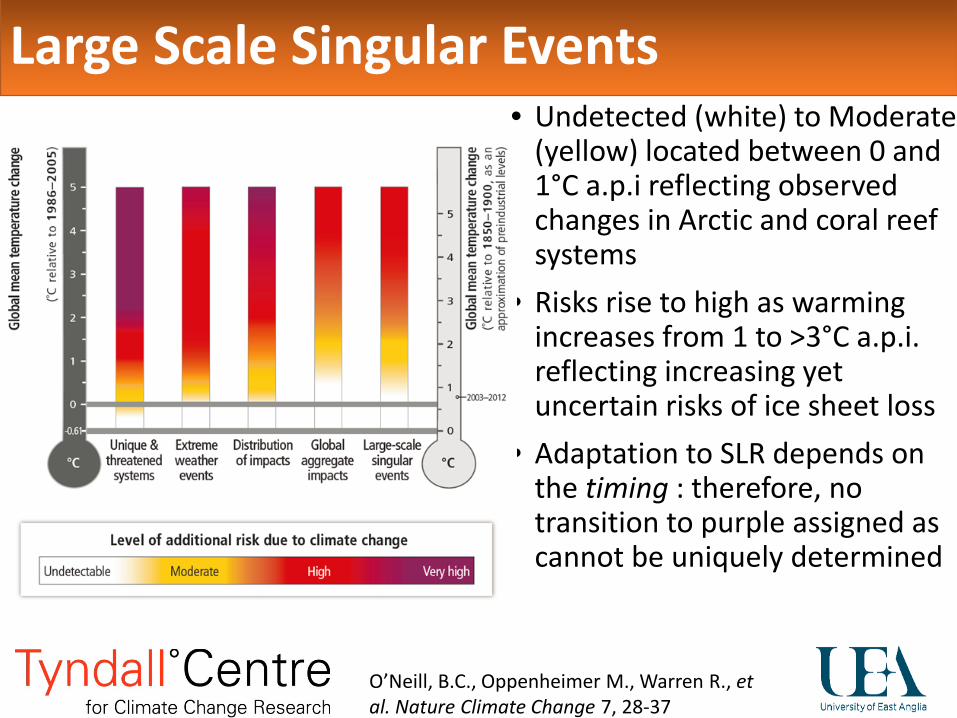
• Undetected (white) to Moderate (yellow) located between 0 and 1°C a.p.i reflecting observed changes in Arctic and coral reef systems
• Risks rise to high as warming increases from 1 to >3°C a.p.i. reflecting increasing yet uncertain risks of ice sheet loss
• Adaptation to SLR depends on the timing : therefore, no transition to purple assigned as cannot be uniquely determined
Large Scale Singular Events
O’Neill, B.C., Oppenheimer M., Warren R., et al. Nature Climate Change 7, 28-37
• Prospects for climate-resilient pathways (CRP) for sustainable development are related fundamentally to what the world accomplishes with climate change mitigation
• Greater rates and magnitude of climate change increase the likelihood of exceeding adaptation limits (high confidence).
• Limit = biophysical/socioeconomic; not possible/not available. • As mitigation reduces the rate as well as the magnitude of
warming, it increases the time available for adaptation to a given level of climate change, potentially by several decades
• Delaying mitigation ….may reduce options for CRP • Insufficient responses to emerging impacts in some areas are
eroding the basis for sustainable development • Transformations in economic, social and political decisions and
actions can enable CRP
C2: Climate Resilient Pathways and Transformation
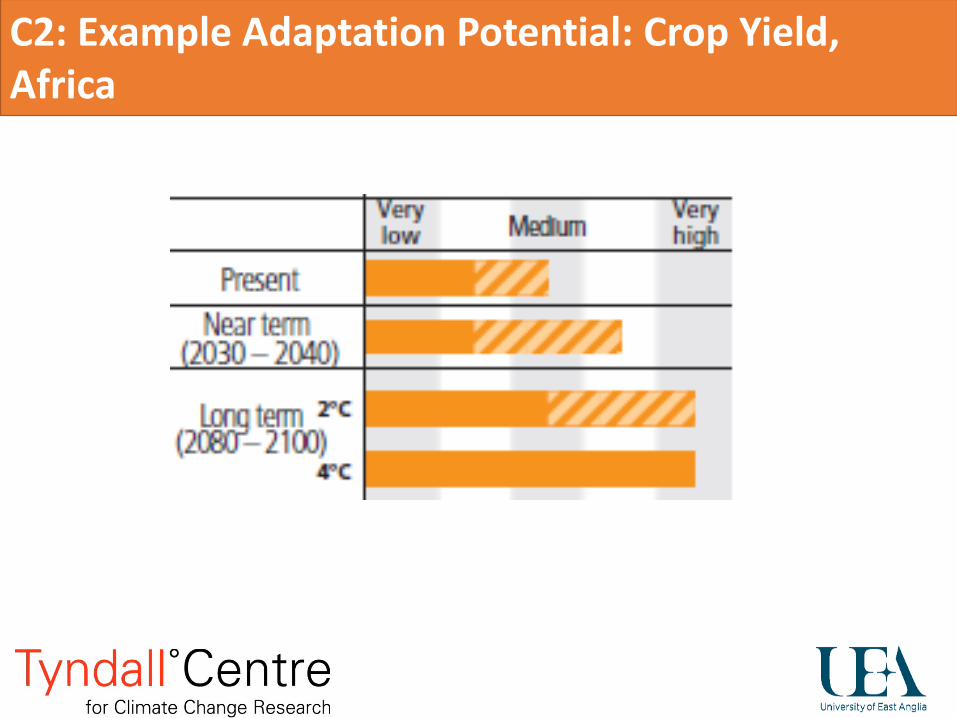
C2: Example Adaptation Potential: Crop Yield, Africa