Embed Size (px)
Citation preview

September 2015
Michael Ansley, Chairman & CEODavid Burke, CFO & Treasurer
Investor PresentationSeptember 2015
Michael Ansley, Chairman & CEO
David Burke, CFO & Treasurer
2
Safe Harbor Statement
The information made available in this presentation contains forward-looking statementswhich reflect the Company’s current view of future events, results of operations, cashflows, performance, business prospects and opportunities. Wherever used, the words"anticipate," "believe," "expect," "intend," "plan," "project," "will continue," "will likelyresult," "may," and similar expressions identify forward-looking statements as such termis defined in the Securities Exchange Act of 1934. Any such forward-looking statementsare subject to risks and uncertainties and the Company's actual growth, results ofoperations, financial condition, cash flows, performance, business prospects andopportunities could differ materially from historical results or current expectations. Someof these risks include, without limitation, the impact of economic and industryconditions, competition, food and drug safety issues, store expansion and remodeling,labor relations issues, costs of providing employee benefits, regulatory matters, legal andadministrative proceedings, information technology, security, severe weather, naturaldisasters, accounting matters, other risk factors relating to our business or industry andother risks detailed from time to time in the Securities and Exchange Commission filingsof DRH. Forward-looking statements contained herein speak only as of the date madeand, thus, DRH undertakes no obligation to update or publicly announce the revision ofany of the forward-looking statements contained herein to reflect new information,future events, developments or changed circumstances or for any other reason.
3
Who We Are
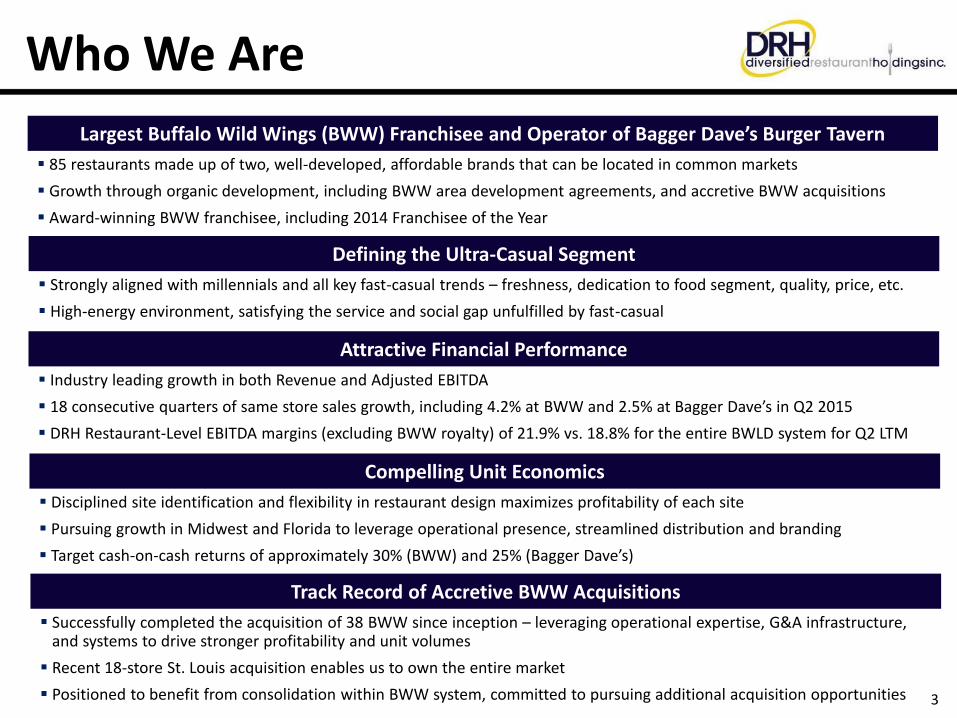
Largest Buffalo Wild Wings (BWW) Franchisee and Operator of Bagger Dave’s Burger Tavern
85 restaurants made up of two, well-developed, affordable brands that can be located in common markets
Growth through organic development, including BWW area development agreements, and accretive BWW acquisitions
Award-winning BWW franchisee, including 2014 Franchisee of the Year
Attractive Financial Performance
Industry leading growth in both Revenue and Adjusted EBITDA
18 consecutive quarters of same store sales growth, including 4.2% at BWW and 2.5% at Bagger Dave’s in Q2 2015
DRH Restaurant-Level EBITDA margins (excluding BWW royalty) of 21.9% vs. 18.8% for the entire BWLD system for Q2 LTM
Track Record of Accretive BWW Acquisitions
Successfully completed the acquisition of 38 BWW since inception – leveraging operational expertise, G&A infrastructure, and systems to drive stronger profitability and unit volumes
Recent 18-store St. Louis acquisition enables us to own the entire market
Positioned to benefit from consolidation within BWW system, committed to pursuing additional acquisition opportunities
Compelling Unit Economics
Disciplined site identification and flexibility in restaurant design maximizes profitability of each site
Pursuing growth in Midwest and Florida to leverage operational presence, streamlined distribution and branding
Target cash-on-cash returns of approximately 30% (BWW) and 25% (Bagger Dave’s)
Defining the Ultra-Casual Segment
Strongly aligned with millennials and all key fast-casual trends – freshness, dedication to food segment, quality, price, etc.
High-energy environment, satisfying the service and social gap unfulfilled by fast-casual
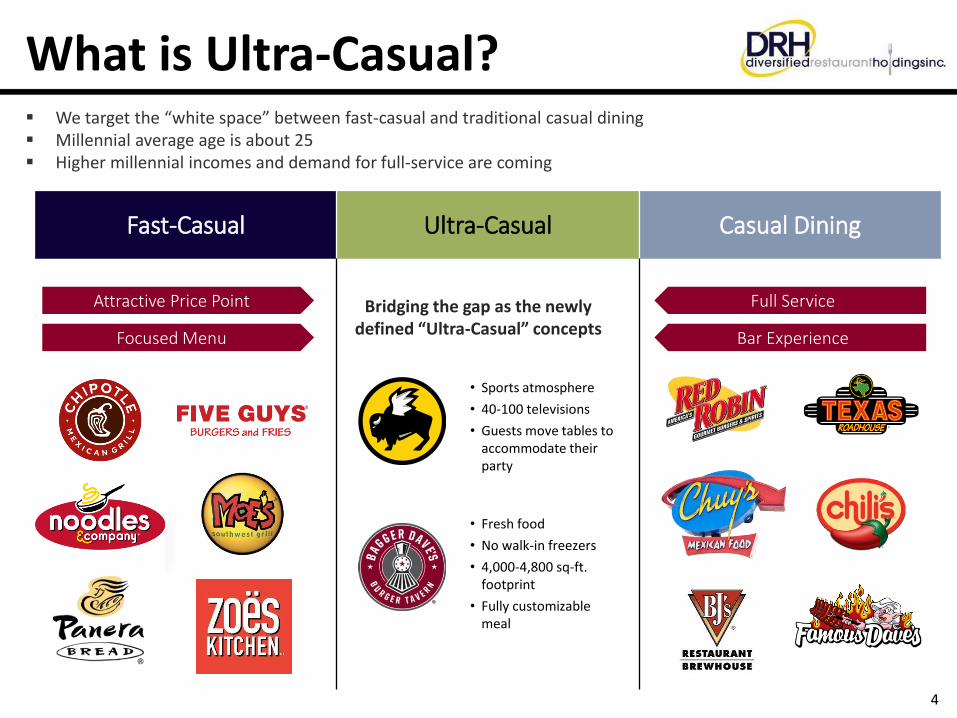
What is Ultra-Casual?
Fast-Casual Ultra-Casual Casual Dining
Bridging the gap as the newly defined “Ultra-Casual” concepts
Attractive Price Point
Focused Menu
Full Service
Bar Experience
• Fresh food
• No walk-in freezers
• 4,000-4,800 sq-ft. footprint
• Fully customizable meal
• Sports atmosphere
• 40-100 televisions
• Guests move tables to accommodate their party
We target the “white space” between fast-casual and traditional casual dining Millennial average age is about 25 Higher millennial incomes and demand for full-service are coming
4
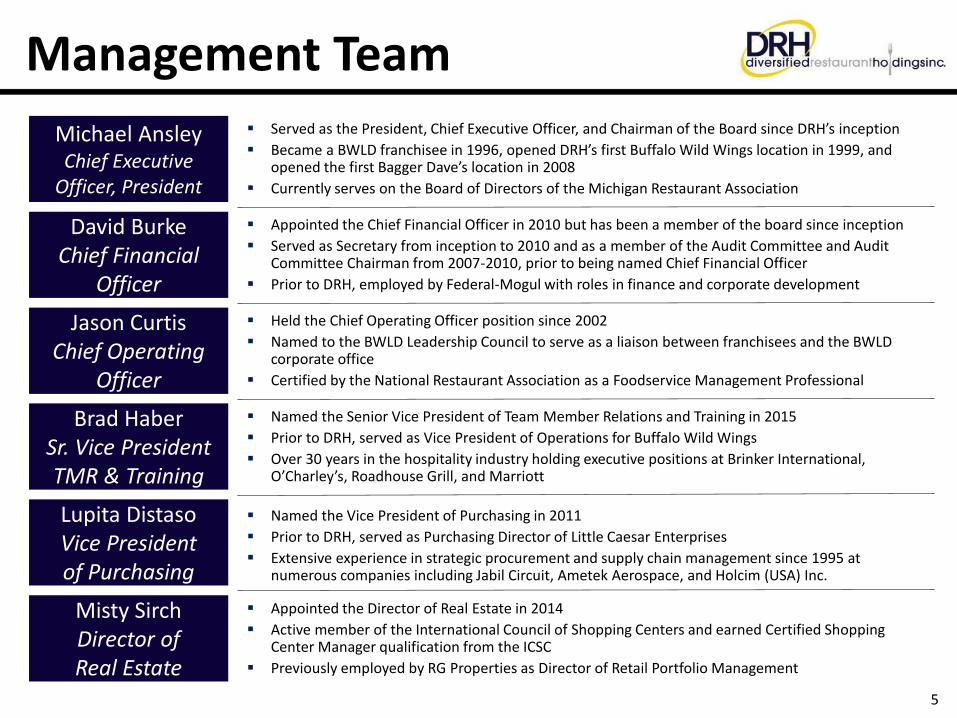
Management Team
Michael AnsleyChief Executive
Officer, President
David BurkeChief Financial
Officer
Jason CurtisChief Operating
Officer
Brad HaberSr. Vice President TMR & Training
Lupita DistasoVice President of Purchasing
Served as the President, Chief Executive Officer, and Chairman of the Board since DRH’s inception
Became a BWLD franchisee in 1996, opened DRH’s first Buffalo Wild Wings location in 1999, and opened the first Bagger Dave’s location in 2008
Currently serves on the Board of Directors of the Michigan Restaurant Association
Appointed the Chief Financial Officer in 2010 but has been a member of the board since inception
Served as Secretary from inception to 2010 and as a member of the Audit Committee and Audit Committee Chairman from 2007-2010, prior to being named Chief Financial Officer
Prior to DRH, employed by Federal-Mogul with roles in finance and corporate development
Held the Chief Operating Officer position since 2002
Named to the BWLD Leadership Council to serve as a liaison between franchisees and the BWLD corporate office
Certified by the National Restaurant Association as a Foodservice Management Professional
Named the Senior Vice President of Team Member Relations and Training in 2015
Prior to DRH, served as Vice President of Operations for Buffalo Wild Wings
Over 30 years in the hospitality industry holding executive positions at Brinker International, O’Charley’s, Roadhouse Grill, and Marriott
Named the Vice President of Purchasing in 2011
Prior to DRH, served as Purchasing Director of Little Caesar Enterprises
Extensive experience in strategic procurement and supply chain management since 1995 at numerous companies including Jabil Circuit, Ametek Aerospace, and Holcim (USA) Inc.
Misty SirchDirector of Real Estate
Appointed the Director of Real Estate in 2014
Active member of the International Council of Shopping Centers and earned Certified Shopping Center Manager qualification from the ICSC
Previously employed by RG Properties as Director of Retail Portfolio Management
5
6
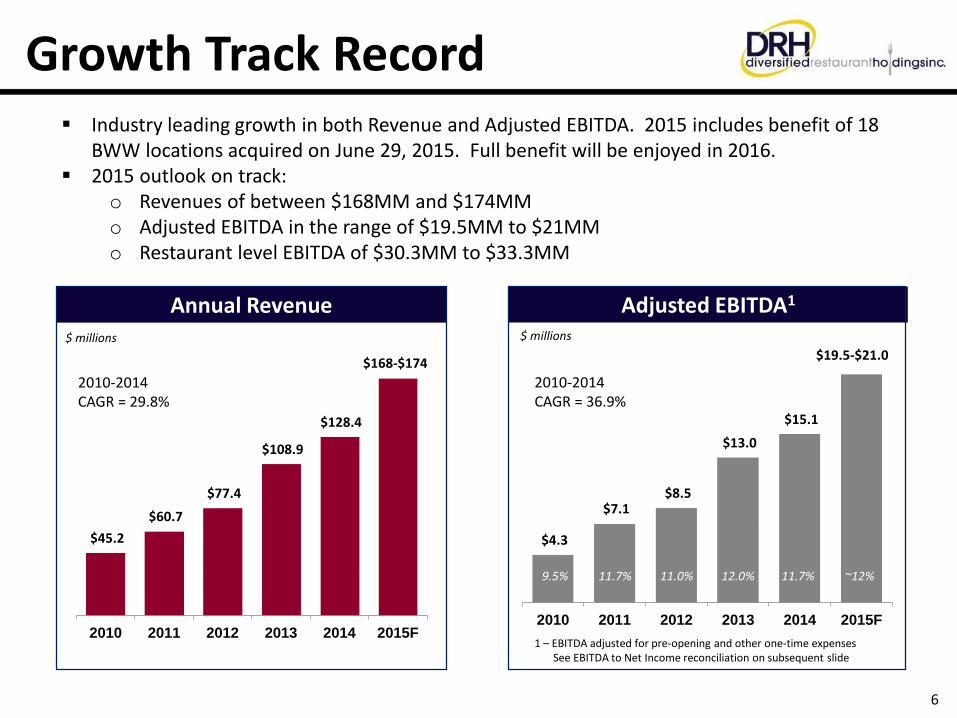
Growth Track Record Industry leading growth in both Revenue and Adjusted EBITDA. 2015 includes benefit of 18
BWW locations acquired on June 29, 2015. Full benefit will be enjoyed in 2016. 2015 outlook on track:
o Revenues of between $168MM and $174MMo Adjusted EBITDA in the range of $19.5MM to $21MMo Restaurant level EBITDA of $30.3MM to $33.3MM
Adjusted EBITDA1
$45.2
$60.7
$77.4
$108.9
$128.4
2010 2011 2012 2013 2014 2015F
Annual Revenue
$168-$174
2010-2014CAGR = 29.8%
$ millions$ millions
$4.3
$7.1 $8.5
$13.0
$15.1
2010 2011 2012 2013 2014 2015F
$19.5-$21.0
2010-2014CAGR = 36.9%
9.5% 11.7% 11.0% 12.0% 11.7% ~12%
1 – EBITDA adjusted for pre-opening and other one-time expensesSee EBITDA to Net Income reconciliation on subsequent slide
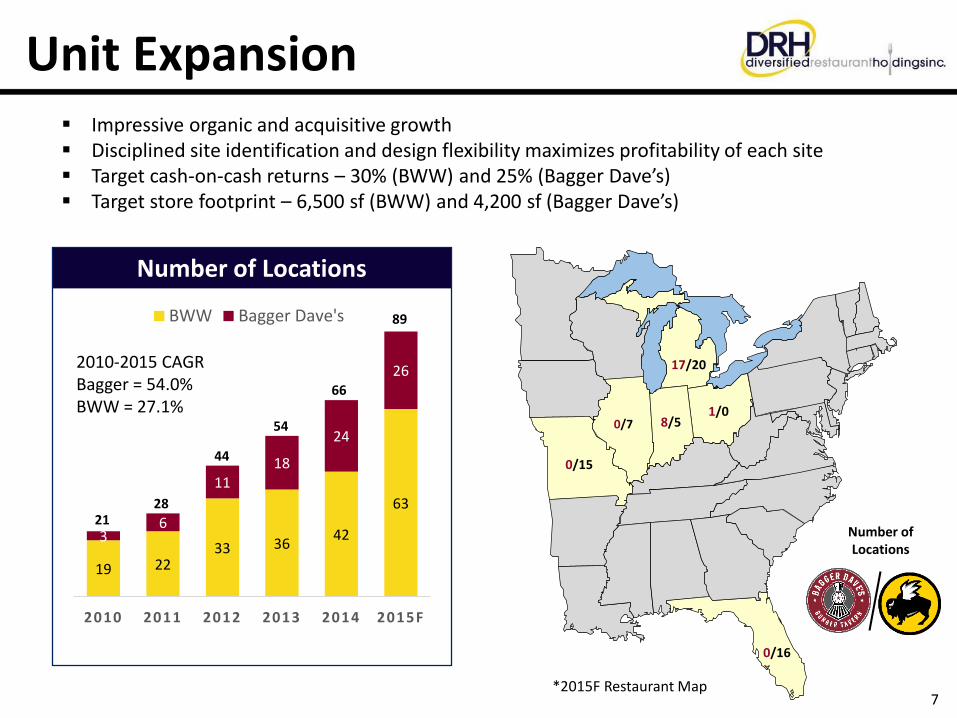
Unit Expansion Impressive organic and acquisitive growth Disciplined site identification and design flexibility maximizes profitability of each site Target cash-on-cash returns – 30% (BWW) and 25% (Bagger Dave’s) Target store footprint – 6,500 sf (BWW) and 4,200 sf (Bagger Dave’s)
0/16
0/15
0/7 8/51/0
17/20
Number of Locations
19 2233 36
42
63
36
1118
24
26
2010 2011 2012 2013 2014 2015F
BWW Bagger Dave's 89
66
54
44
2821
Number of Locations
2010-2015 CAGRBagger = 54.0%BWW = 27.1%
7*2015F Restaurant Map
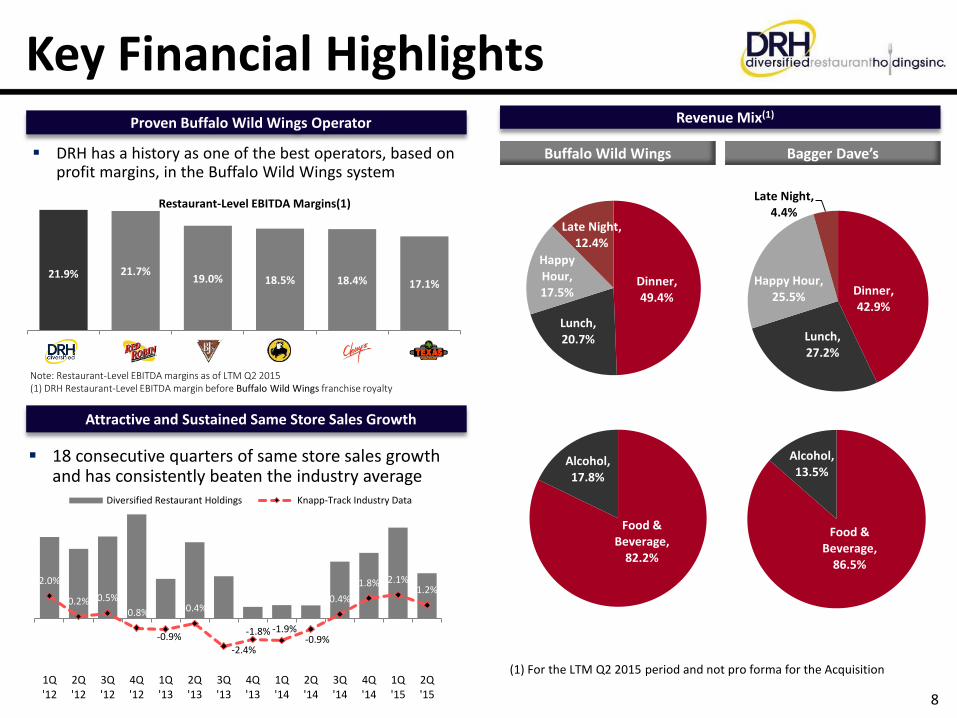
Key Financial Highlights Proven Buffalo Wild Wings Operator
Attractive and Sustained Same Store Sales Growth
DRH has a history as one of the best operators, based on profit margins, in the Buffalo Wild Wings system
18 consecutive quarters of same store sales growth and has consistently beaten the industry average
Note: Restaurant-Level EBITDA margins as of LTM Q2 2015 (1) DRH Restaurant-Level EBITDA margin before Buffalo Wild Wings franchise royalty
2.0%
0.2% 0.5%
-0.8%
-0.9%
-0.4%
-2.4%
-1.8% -1.9%-0.9%
0.4%
1.8% 2.1%1.2%
1Q'12
2Q'12
3Q'12
4Q'12
1Q'13
2Q'13
3Q'13
4Q'13
1Q'14
2Q'14
3Q'14
4Q'14
1Q'15
2Q'15
Diversified Restaurant Holdings Knapp-Track Industry Data
21.9% 21.7%19.0% 18.5% 18.4% 17.1%
-
Restaurant-Level EBITDA Margins(1)
8
Revenue Mix(1)
Buffalo Wild Wings Bagger Dave’s
(1) For the LTM Q2 2015 period and not pro forma for the Acquisition
Dinner, 49.4%
Lunch, 20.7%
Happy Hour, 17.5%
Late Night, 12.4%
Dinner, 42.9%
Lunch, 27.2%
Happy Hour, 25.5%
Late Night, 4.4%
Food & Beverage,
82.2%
Alcohol, 17.8%
Food & Beverage,
86.5%
Alcohol, 13.5%
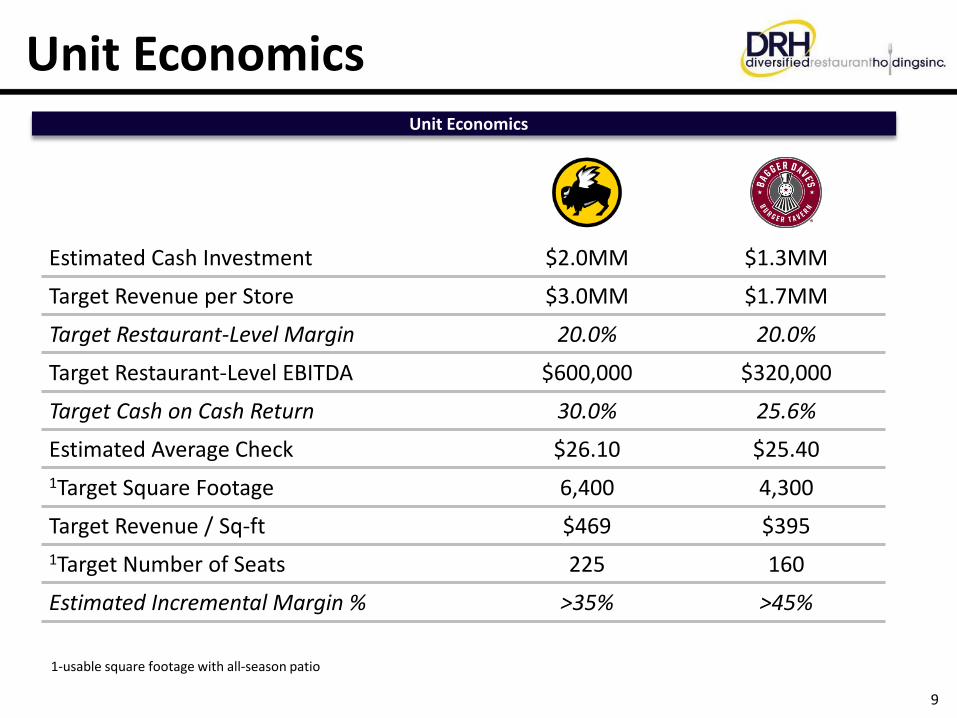
Unit Economics
9
Unit Economics
Estimated Cash Investment $2.0MM $1.3MM
Target Revenue per Store $3.0MM $1.7MM
Target Restaurant-Level Margin 20.0% 20.0%
Target Restaurant-Level EBITDA $600,000 $320,000
Target Cash on Cash Return 30.0% 25.6%
Estimated Average Check $26.10 $25.40
1Target Square Footage 6,400 4,300
Target Revenue / Sq-ft $469 $395
1Target Number of Seats 225 160
Estimated Incremental Margin % >35% >45%
1-usable square footage with all-season patio
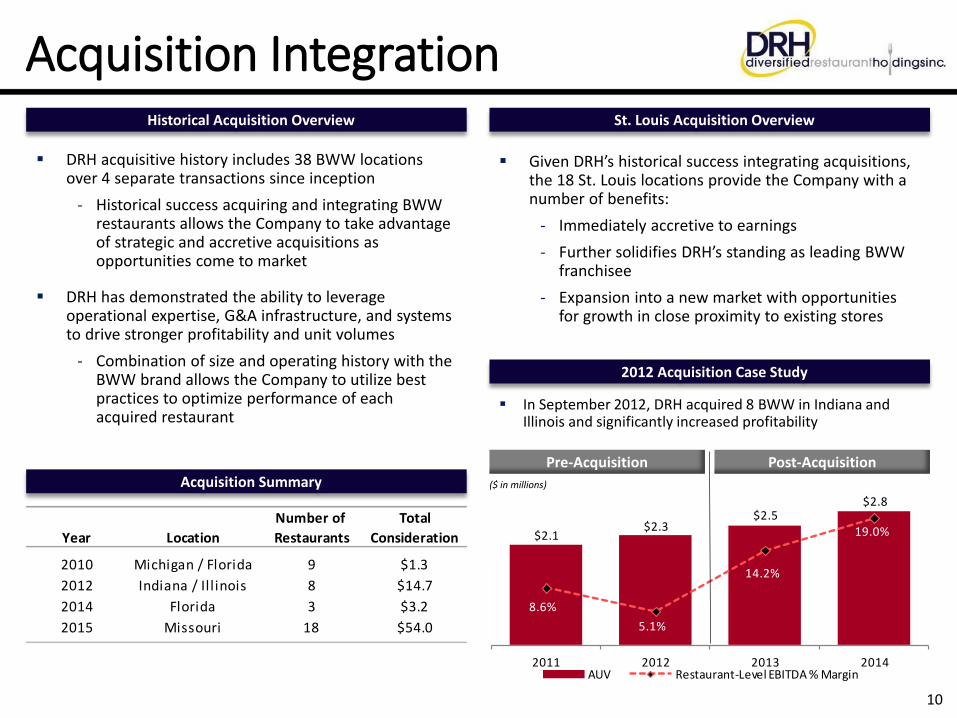
Acquisition Integration
Pre-Acquisition Post-Acquisition
$2.1 $2.3
$2.5 $2.8
8.6%
5.1%
14.2%
19.0%
2011 2012 2013 2014AUV Restaurant-Level EBITDA % Margin
St. Louis Acquisition Overview
DRH acquisitive history includes 38 BWW locations over 4 separate transactions since inception
- Historical success acquiring and integrating BWW restaurants allows the Company to take advantage of strategic and accretive acquisitions as opportunities come to market
DRH has demonstrated the ability to leverage operational expertise, G&A infrastructure, and systems to drive stronger profitability and unit volumes
- Combination of size and operating history with the BWW brand allows the Company to utilize best practices to optimize performance of each acquired restaurant
Historical Acquisition Overview
Acquisition Summary
Given DRH’s historical success integrating acquisitions, the 18 St. Louis locations provide the Company with a number of benefits:
- Immediately accretive to earnings
- Further solidifies DRH’s standing as leading BWWfranchisee
- Expansion into a new market with opportunities for growth in close proximity to existing stores
2012 Acquisition Case Study
In September 2012, DRH acquired 8 BWW in Indiana and Illinois and significantly increased profitability
($ in millions)
Number of Total
Year Location Restaurants Consideration
2010 Michigan / Florida 9 $1.3
2012 Indiana / Il l inois 8 $14.7
2014 Florida 3 $3.2
2015 Missouri 18 $54.0
10
Buffalo Wild Wings
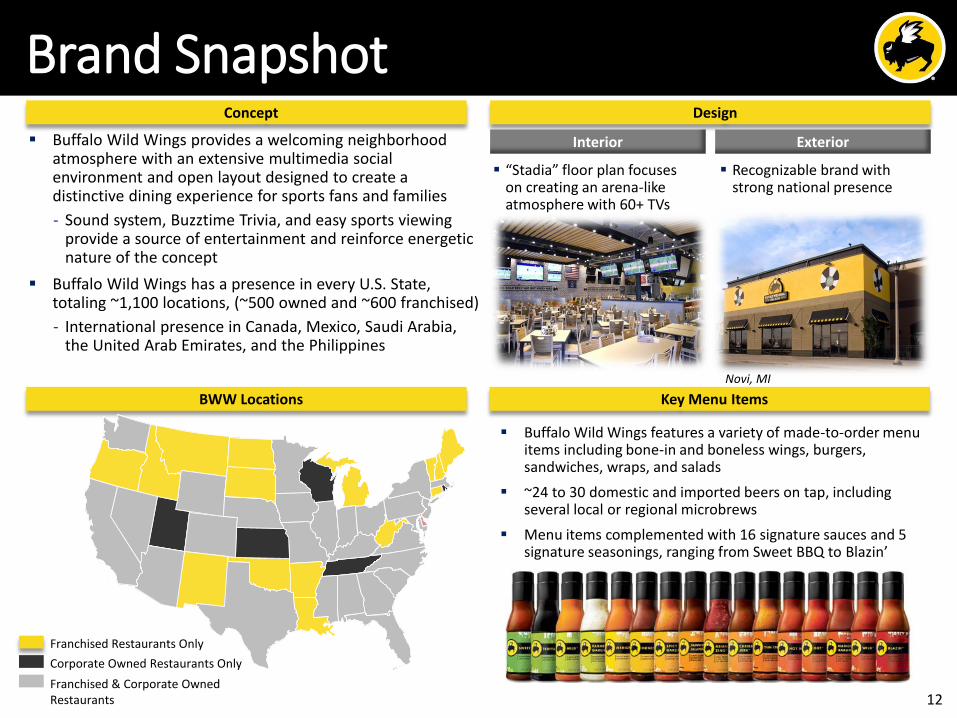
Brand SnapshotDesign
Key Menu Items
Concept
Interior Exterior
“Stadia” floor plan focuses on creating an arena-like atmosphere with 60+ TVs
Recognizable brand with strong national presence
Novi, MI
BWW Locations
Buffalo Wild Wings provides a welcoming neighborhood atmosphere with an extensive multimedia social environment and open layout designed to create a distinctive dining experience for sports fans and families
- Sound system, Buzztime Trivia, and easy sports viewing provide a source of entertainment and reinforce energetic nature of the concept
Buffalo Wild Wings has a presence in every U.S. State, totaling ~1,100 locations, (~500 owned and ~600 franchised)
- International presence in Canada, Mexico, Saudi Arabia, the United Arab Emirates, and the Philippines
Buffalo Wild Wings features a variety of made-to-order menu items including bone-in and boneless wings, burgers, sandwiches, wraps, and salads
~24 to 30 domestic and imported beers on tap, including several local or regional microbrews
Menu items complemented with 16 signature sauces and 5 signature seasonings, ranging from Sweet BBQ to Blazin’
(1)
Corporate Owned Restaurants Only
Franchised Restaurants Only
Franchised & Corporate Owned Restaurants 12
Broad, Customizable Menu Key Menu ItemsFlexible Menu Concept
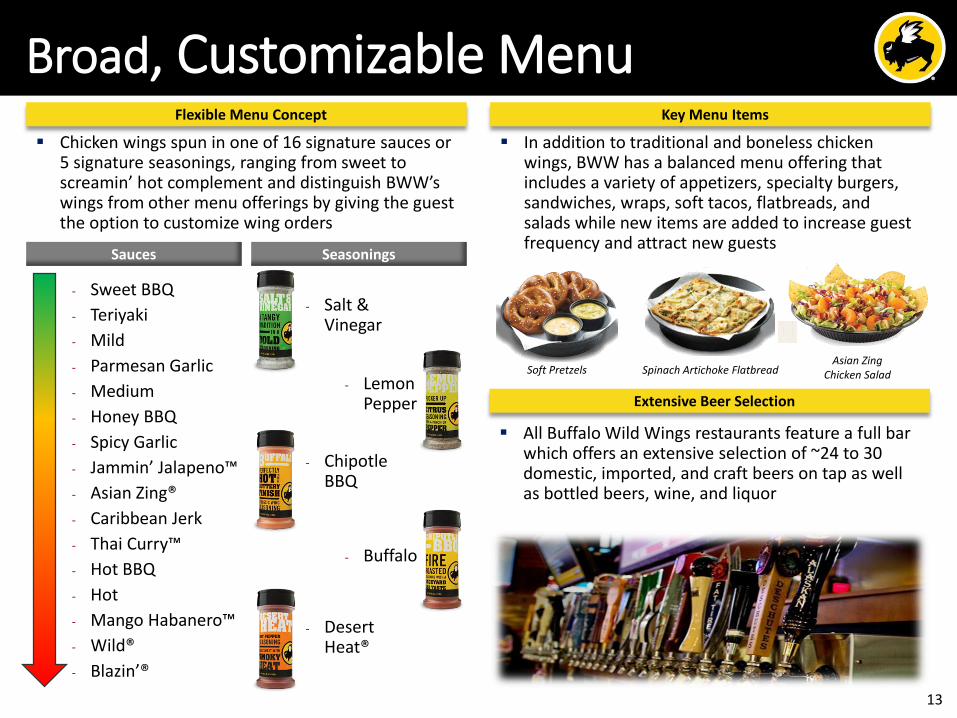
Chicken wings spun in one of 16 signature sauces or 5 signature seasonings, ranging from sweet to screamin’ hot complement and distinguish BWW’s wings from other menu offerings by giving the guest the option to customize wing orders
- Sweet BBQ
- Teriyaki
- Mild
- Parmesan Garlic
- Medium
- Honey BBQ
- Spicy Garlic
- Jammin’ Jalapeno™
- Asian Zing®
- Caribbean Jerk
- Thai Curry™
- Hot BBQ
- Hot
- Mango Habanero™
- Wild®
- Blazin’®
Extensive Beer Selection
Sauces Seasonings
- Salt & Vinegar
- Lemon Pepper
- Chipotle BBQ
- Buffalo
- Desert Heat®
All Buffalo Wild Wings restaurants feature a full bar which offers an extensive selection of ~24 to 30 domestic, imported, and craft beers on tap as well as bottled beers, wine, and liquor
In addition to traditional and boneless chicken wings, BWW has a balanced menu offering that includes a variety of appetizers, specialty burgers, sandwiches, wraps, soft tacos, flatbreads, and salads while new items are added to increase guest frequency and attract new guests
Asian Zing Chicken SaladSpinach Artichoke FlatbreadSoft Pretzels
13
Innovation, Branding & Marketing
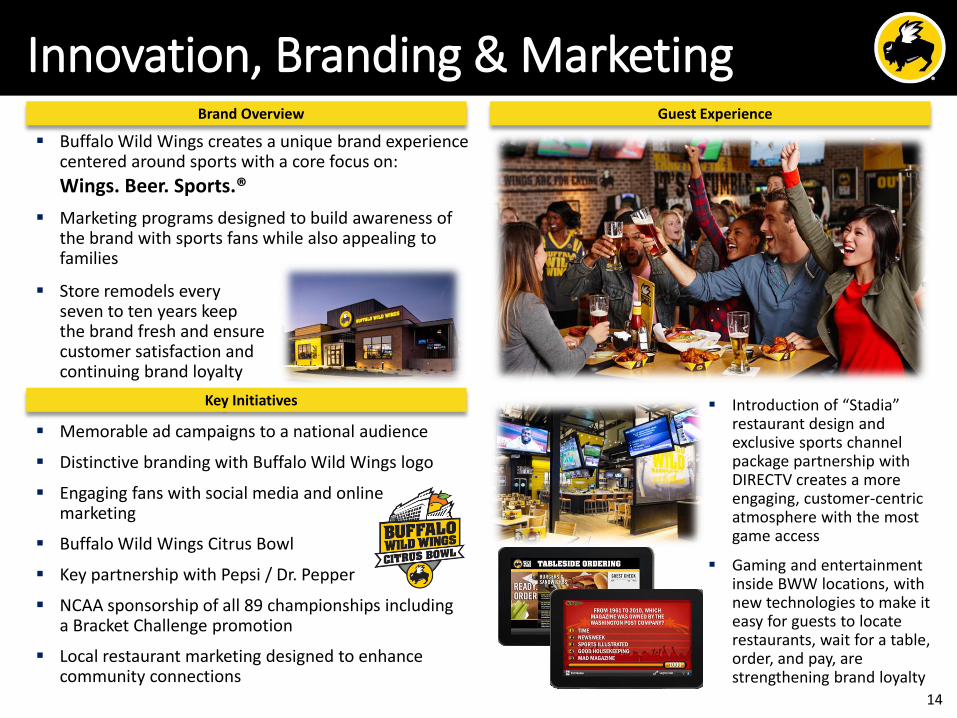
Key Initiatives
Brand Overview
Buffalo Wild Wings creates a unique brand experience centered around sports with a core focus on:
Wings. Beer. Sports.®
Marketing programs designed to build awareness of the brand with sports fans while also appealing to families
Memorable ad campaigns to a national audience
Distinctive branding with Buffalo Wild Wings logo
Engaging fans with social media and online marketing
Buffalo Wild Wings Citrus Bowl
Key partnership with Pepsi / Dr. Pepper
NCAA sponsorship of all 89 championships including a Bracket Challenge promotion
Local restaurant marketing designed to enhance community connections
Guest Experience
Introduction of “Stadia” restaurant design and exclusive sports channel package partnership with DIRECTV creates a more engaging, customer-centric atmosphere with the most game access
Gaming and entertainment inside BWW locations, with new technologies to make it easy for guests to locate restaurants, wait for a table, order, and pay, are strengthening brand loyalty
Store remodels every seven to ten years keep the brand fresh and ensure customer satisfaction and continuing brand loyalty
14
Bagger Dave’s Burger Tavern
Brand SnapshotDesign
Menu Enhancements
Concept
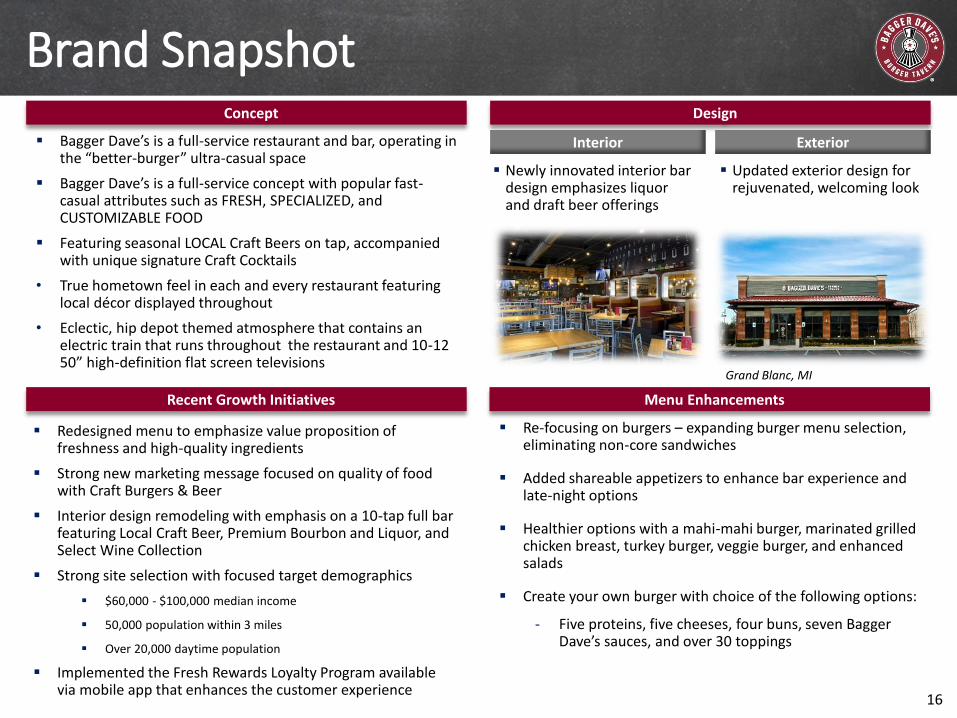
Interior Exterior Bagger Dave’s is a full-service restaurant and bar, operating in the “better-burger” ultra-casual space
Bagger Dave’s is a full-service concept with popular fast-casual attributes such as FRESH, SPECIALIZED, and CUSTOMIZABLE FOOD
Featuring seasonal LOCAL Craft Beers on tap, accompanied with unique signature Craft Cocktails
• True hometown feel in each and every restaurant featuring local décor displayed throughout
• Eclectic, hip depot themed atmosphere that contains an electric train that runs throughout the restaurant and 10-12 50” high-definition flat screen televisions
Newly innovated interior bar design emphasizes liquor and draft beer offerings
Updated exterior design for rejuvenated, welcoming look
Recent Growth Initiatives
Re-focusing on burgers – expanding burger menu selection, eliminating non-core sandwiches
Added shareable appetizers to enhance bar experience and late-night options
Healthier options with a mahi-mahi burger, marinated grilled chicken breast, turkey burger, veggie burger, and enhanced salads
Create your own burger with choice of the following options:
- Five proteins, five cheeses, four buns, seven Bagger Dave’s sauces, and over 30 toppings
Grand Blanc, MI
Redesigned menu to emphasize value proposition of freshness and high-quality ingredients
Strong new marketing message focused on quality of food with Craft Burgers & Beer
Interior design remodeling with emphasis on a 10-tap full bar featuring Local Craft Beer, Premium Bourbon and Liquor, and Select Wine Collection
Strong site selection with focused target demographics
$60,000 - $100,000 median income
50,000 population within 3 miles
Over 20,000 daytime population
Implemented the Fresh Rewards Loyalty Program available via mobile app that enhances the customer experience
16
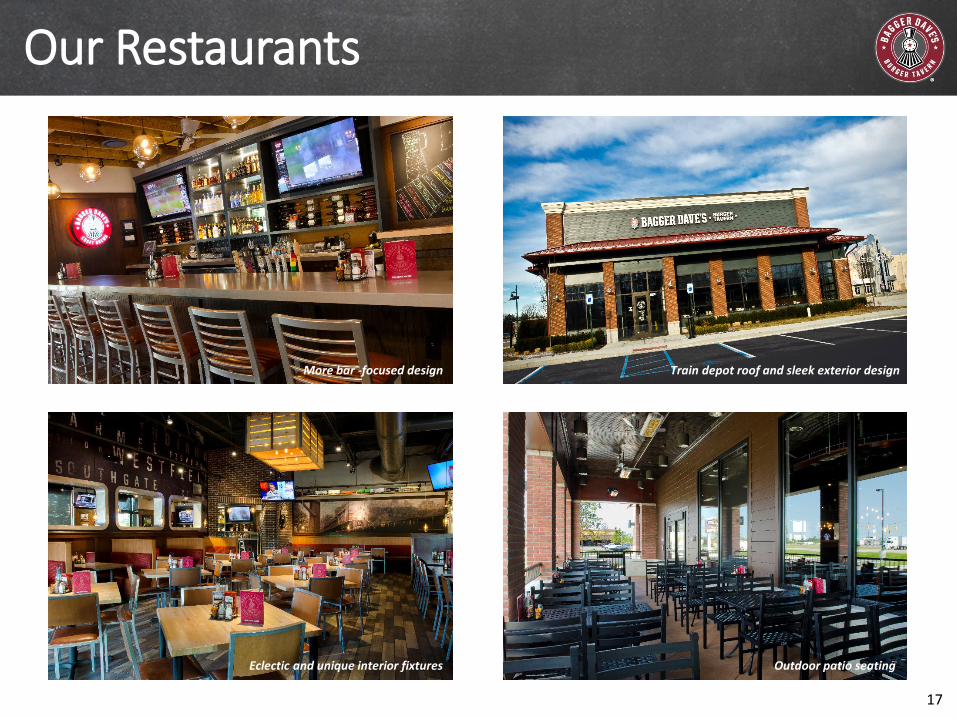
Our Restaurants
17
More bar -focused design Train depot roof and sleek exterior design
Eclectic and unique interior fixtures Outdoor patio seating
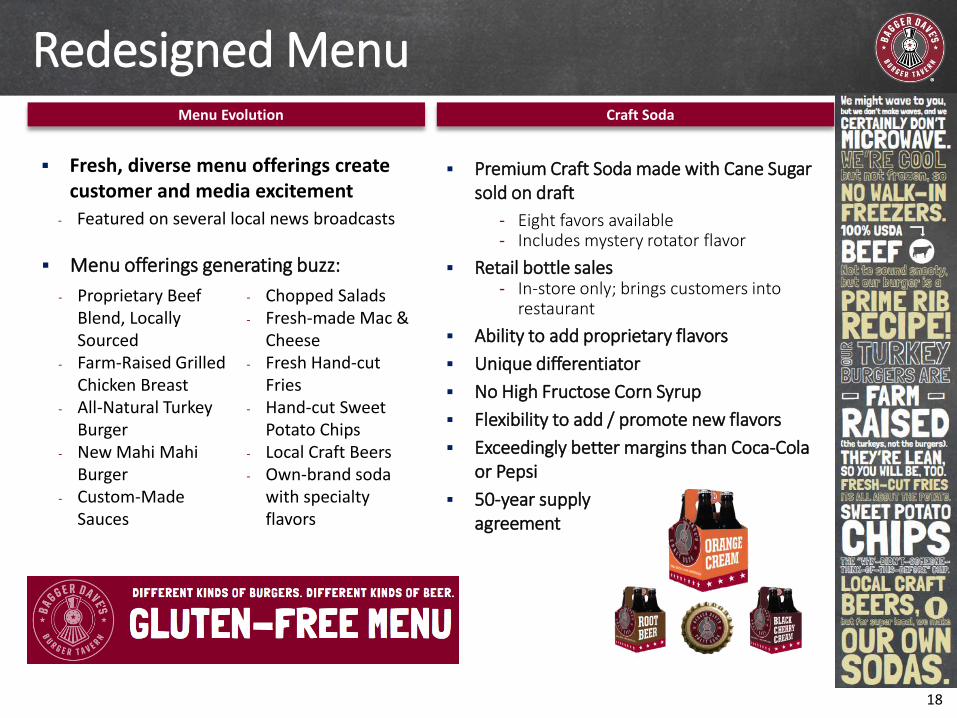
Redesigned Menu
Fresh, diverse menu offerings create customer and media excitement
- Featured on several local news broadcasts
- Proprietary Beef Blend, Locally Sourced
- Farm-Raised Grilled Chicken Breast
- All-Natural Turkey Burger
- New Mahi MahiBurger
- Custom-Made Sauces
- Chopped Salads- Fresh-made Mac &
Cheese- Fresh Hand-cut
Fries- Hand-cut Sweet
Potato Chips- Local Craft Beers- Own-brand soda
with specialty flavors
Menu Evolution
Menu offerings generating buzz:
Premium Craft Soda made with Cane Sugar sold on draft
- Eight favors available- Includes mystery rotator flavor
Retail bottle sales - In-store only; brings customers into
restaurant
Ability to add proprietary flavors
Unique differentiator
No High Fructose Corn Syrup
Flexibility to add / promote new flavors
Exceedingly better margins than Coca-Cola or Pepsi
50-year supply agreement
Craft Soda
18
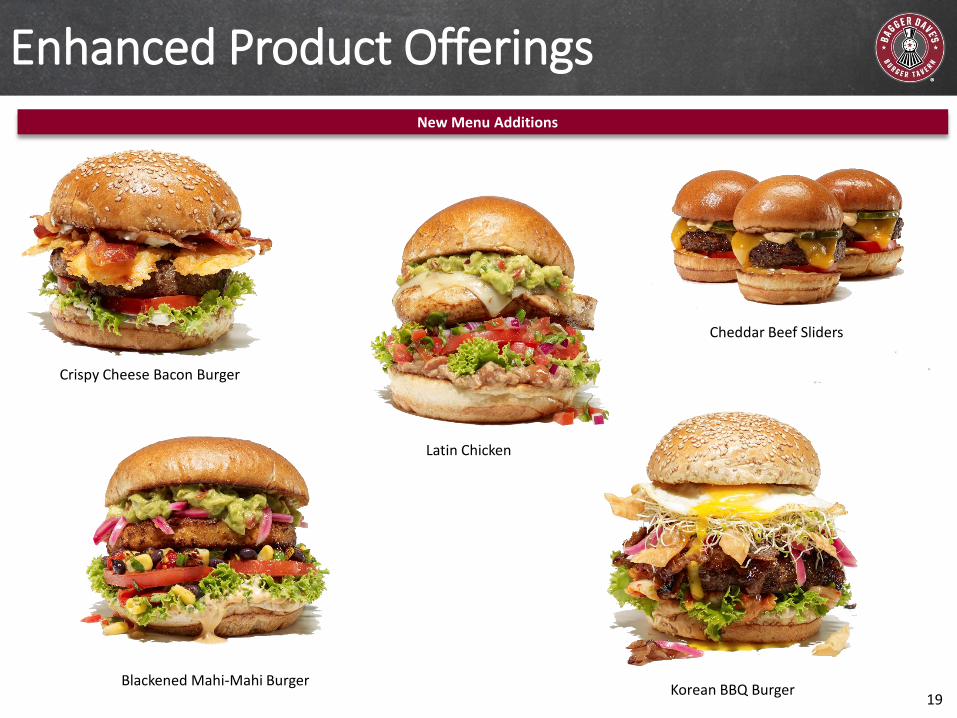
Enhanced Product Offerings
19
New Menu Additions
Crispy Cheese Bacon Burger
Korean BBQ Burger
Latin Chicken
Blackened Mahi-Mahi Burger
Cheddar Beef Sliders
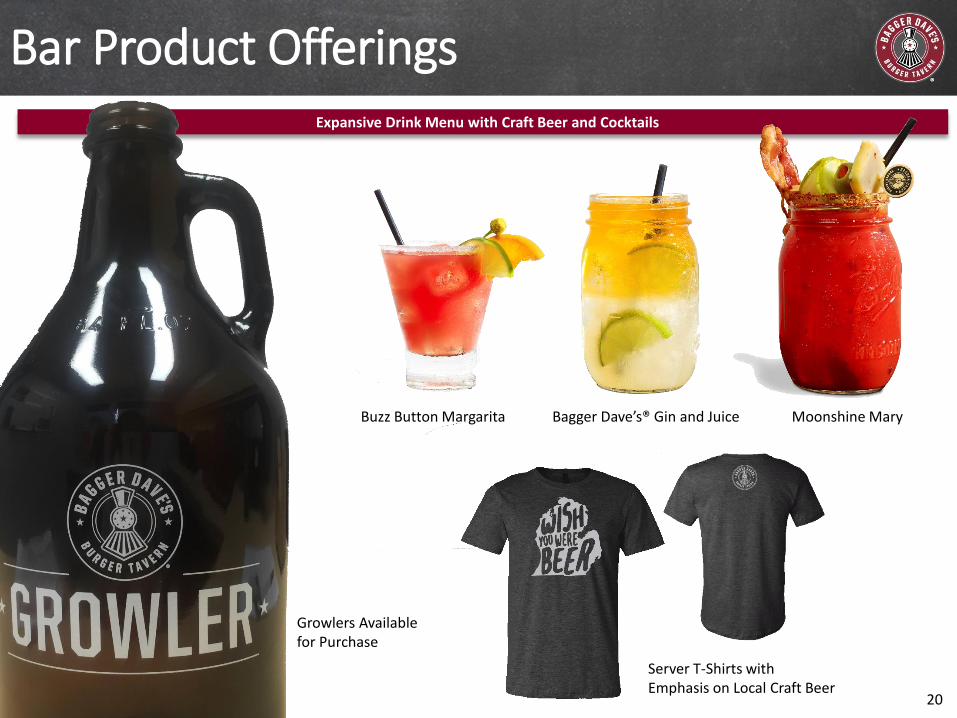
Bar Product Offerings
20
Expansive Drink Menu with Craft Beer and Cocktails
Server T-Shirts with Emphasis on Local Craft Beer
Buzz Button Margarita Bagger Dave’s® Gin and Juice Moonshine Mary
Growlers Available for Purchase
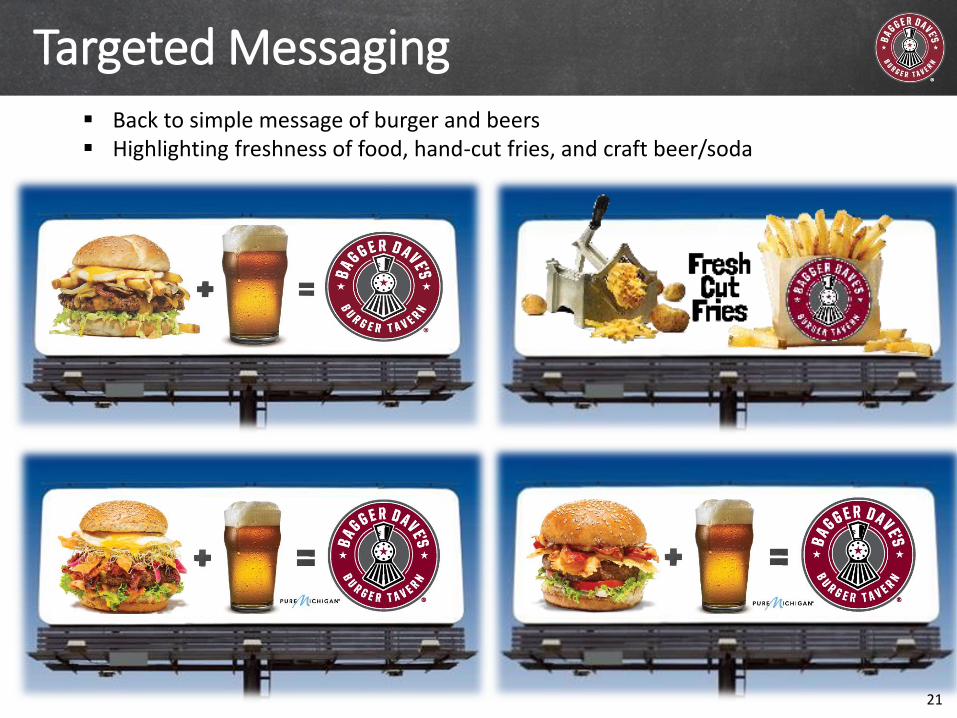
Targeted Messaging Back to simple message of burger and beers Highlighting freshness of food, hand-cut fries, and craft beer/soda
21
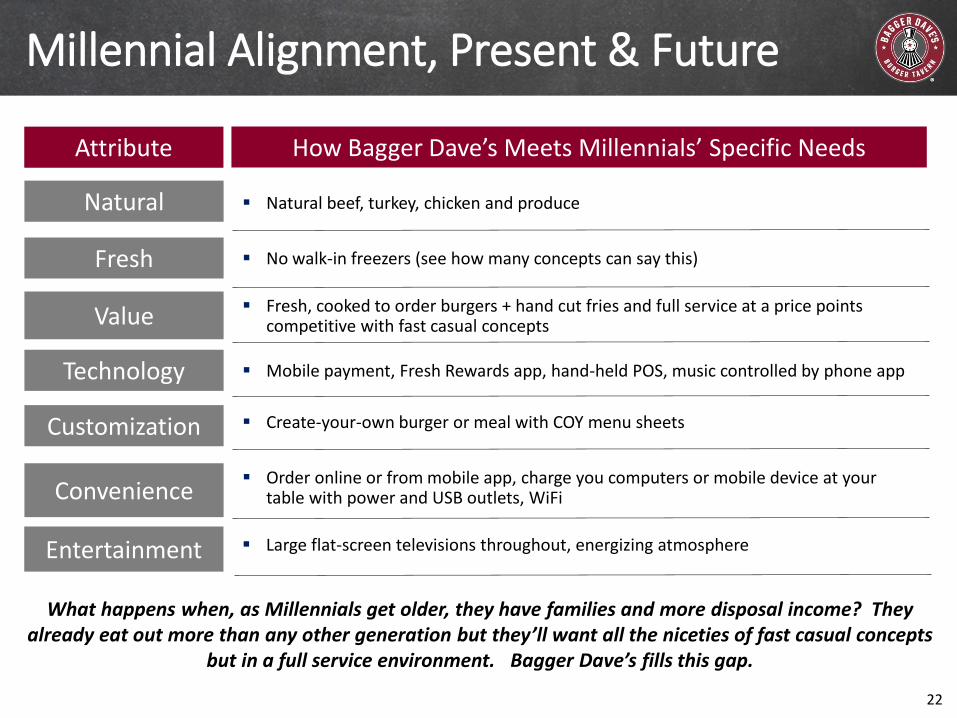
Millennial Alignment, Present & Future
Natural
Fresh
Value
Technology
Customization
Natural beef, turkey, chicken and produce
No walk-in freezers (see how many concepts can say this)
Fresh, cooked to order burgers + hand cut fries and full service at a price points competitive with fast casual concepts
Mobile payment, Fresh Rewards app, hand-held POS, music controlled by phone app
Create-your-own burger or meal with COY menu sheets
Convenience Order online or from mobile app, charge you computers or mobile device at your
table with power and USB outlets, WiFi
Entertainment Large flat-screen televisions throughout, energizing atmosphere
Attribute How Bagger Dave’s Meets Millennials’ Specific Needs
What happens when, as Millennials get older, they have families and more disposal income? They already eat out more than any other generation but they’ll want all the niceties of fast casual concepts
but in a full service environment. Bagger Dave’s fills this gap.
22
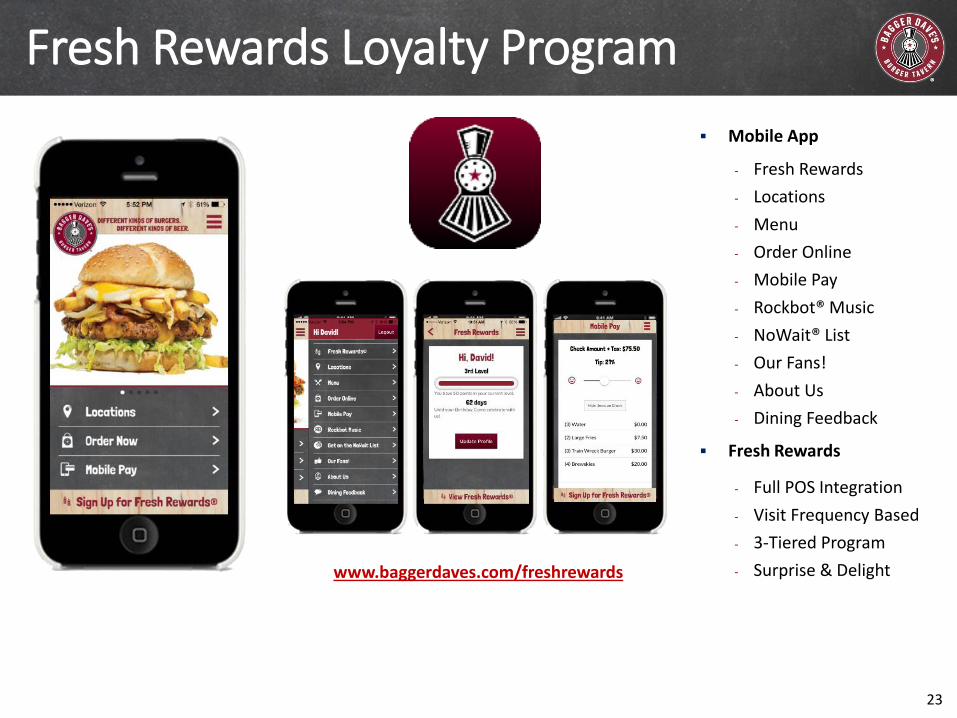
Fresh Rewards Loyalty Program
Mobile App
- Fresh Rewards
- Locations
- Menu
- Order Online
- Mobile Pay
- Rockbot® Music
- NoWait® List
- Our Fans!
- About Us
- Dining Feedback
Fresh Rewards
- Full POS Integration
- Visit Frequency Based
- 3-Tiered Program
- Surprise & Delightwww.baggerdaves.com/freshrewards
23
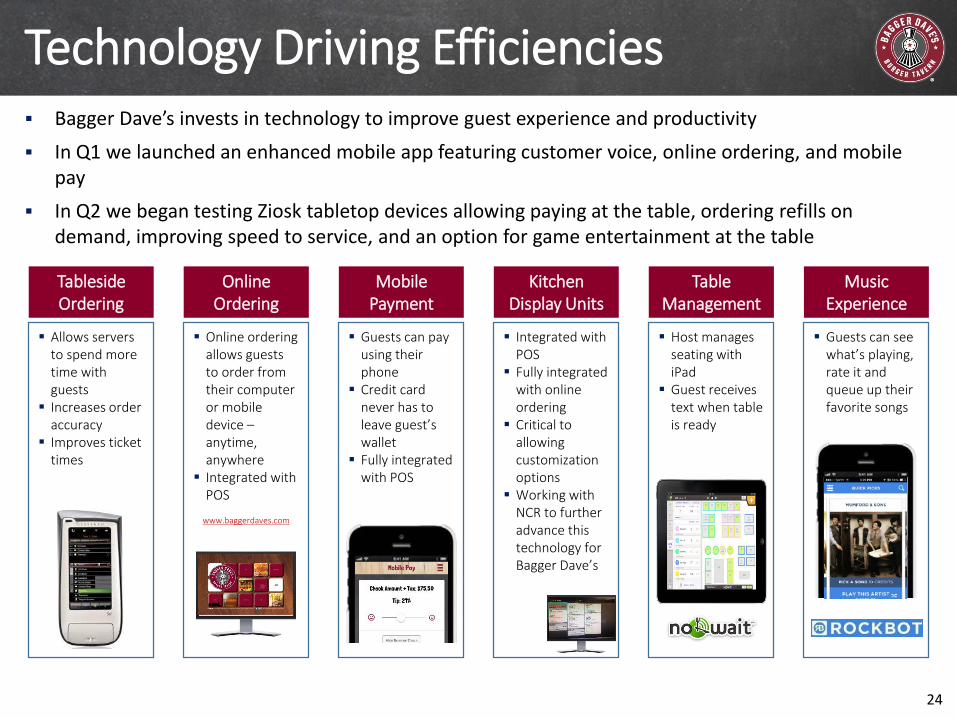
Technology Driving Efficiencies Bagger Dave’s invests in technology to improve guest experience and productivity
In Q1 we launched an enhanced mobile app featuring customer voice, online ordering, and mobile pay
In Q2 we began testing Ziosk tabletop devices allowing paying at the table, ordering refills on demand, improving speed to service, and an option for game entertainment at the table
Host manages seating with iPad
Guest receives text when table is ready
Table Management
Allows servers to spend more time with guests
Increases order accuracy
Improves ticket times
Tableside Ordering
Online ordering allows guests to order from their computer or mobile device –anytime, anywhere
Integrated with POS
www.baggerdaves.com
Online Ordering
Integrated with POS
Fully integrated with online ordering
Critical to allowing customization options
Working with NCR to further advance this technology for Bagger Dave’s
Kitchen Display Units
Guests can pay using their phone
Credit card never has to leave guest’s wallet
Fully integrated with POS
Mobile Payment
Guests can see what’s playing, rate it and queue up their favorite songs
MusicExperience
24
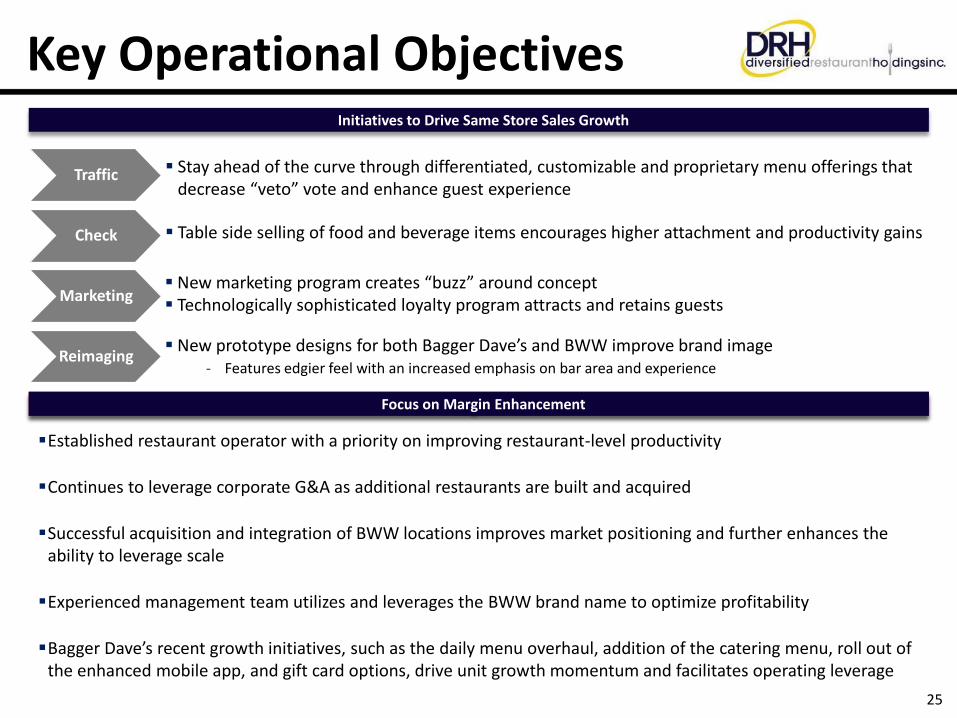
Key Operational Objectives
Traffic
Check
Marketing
Reimaging
Stay ahead of the curve through differentiated, customizable and proprietary menu offerings that decrease “veto” vote and enhance guest experience
New marketing program creates “buzz” around concept Technologically sophisticated loyalty program attracts and retains guests
New prototype designs for both Bagger Dave’s and BWW improve brand image- Features edgier feel with an increased emphasis on bar area and experience
Table side selling of food and beverage items encourages higher attachment and productivity gains
Initiatives to Drive Same Store Sales Growth
Focus on Margin EnhancementFocus on Margin Enhancement
Established restaurant operator with a priority on improving restaurant-level productivity
Continues to leverage corporate G&A as additional restaurants are built and acquired
Successful acquisition and integration of BWW locations improves market positioning and further enhances the ability to leverage scale
Experienced management team utilizes and leverages the BWW brand name to optimize profitability
Bagger Dave’s recent growth initiatives, such as the daily menu overhaul, addition of the catering menu, roll out of the enhanced mobile app, and gift card options, drive unit growth momentum and facilitates operating leverage
25
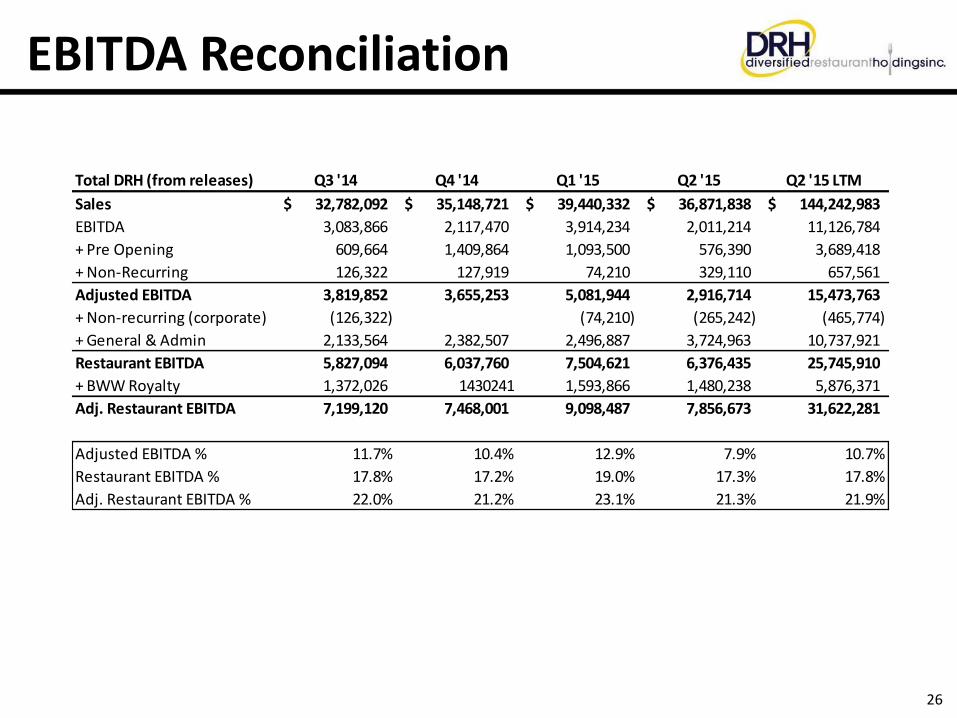
EBITDA Reconciliation
26
Total DRH (from releases) Q3 '14 Q4 '14 Q1 '15 Q2 '15 Q2 '15 LTM
Sales 32,782,092$ 35,148,721$ 39,440,332$ 36,871,838$ 144,242,983$
EBITDA 3,083,866 2,117,470 3,914,234 2,011,214 11,126,784
+ Pre Opening 609,664 1,409,864 1,093,500 576,390 3,689,418
+ Non-Recurring 126,322 127,919 74,210 329,110 657,561
Adjusted EBITDA 3,819,852 3,655,253 5,081,944 2,916,714 15,473,763
+ Non-recurring (corporate) (126,322) (74,210) (265,242) (465,774)
+ General & Admin 2,133,564 2,382,507 2,496,887 3,724,963 10,737,921
Restaurant EBITDA 5,827,094 6,037,760 7,504,621 6,376,435 25,745,910
+ BWW Royalty 1,372,026 1430241 1,593,866 1,480,238 5,876,371
Adj. Restaurant EBITDA 7,199,120 7,468,001 9,098,487 7,856,673 31,622,281
Adjusted EBITDA % 11.7% 10.4% 12.9% 7.9% 10.7%
Restaurant EBITDA % 17.8% 17.2% 19.0% 17.3% 17.8%
Adj. Restaurant EBITDA % 22.0% 21.2% 23.1% 21.3% 21.9%

September 2015
Michael Ansley, Chairman & CEODavid Burke, CFO & Treasurer
Investor PresentationSeptember 2015
Michael Ansley, Chairman & CEO
David Burke, CFO & Treasurer