Embed Size (px)
Citation preview
Welcome to Alma Media Capital Markets Day 27.11.2014
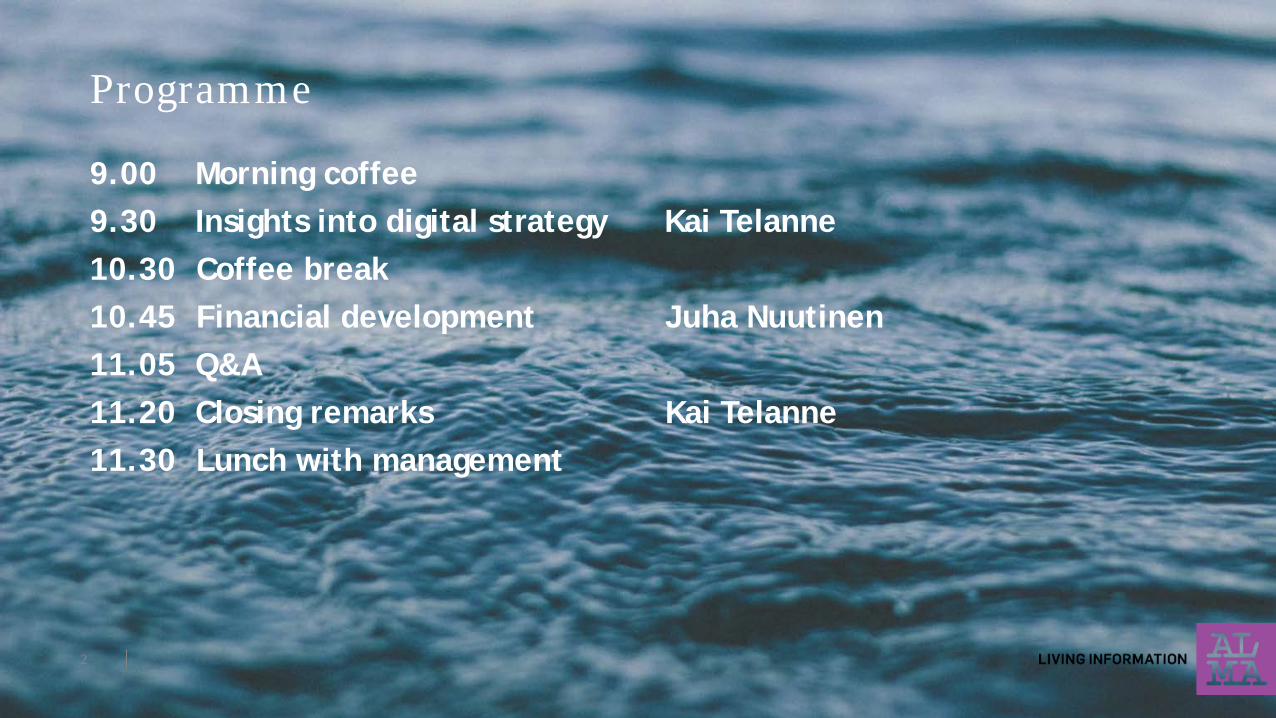
9.00 Morning coffee 9.30 Insights into digital strategy Kai Telanne 10.30 Coffee break 10.45 Financial development Juha Nuutinen 11.05 Q&A 11.20 Closing remarks Kai Telanne 11.30 Lunch with management
2
Programme
Insights into digital strategy Kai Telanne, President and CEO
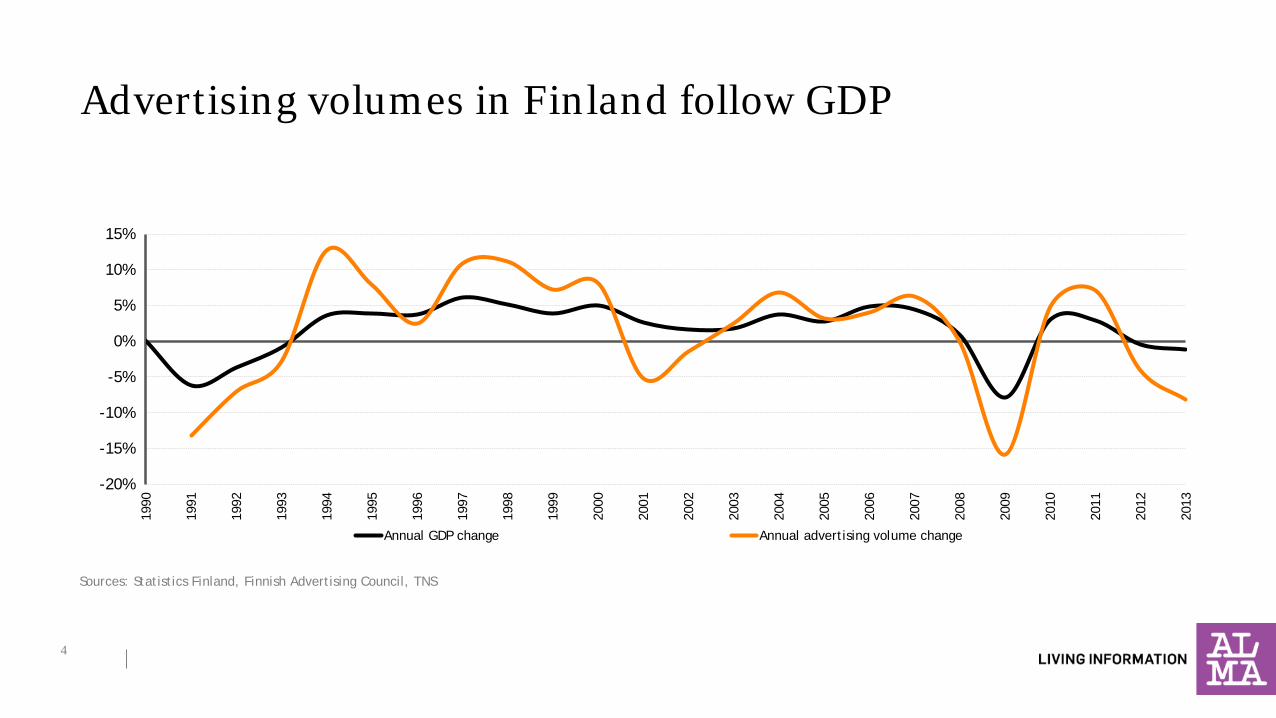
Advertising volumes in Finland follow GDP
-20%
-15%
-10%
-5%
0%
5%
10%
15%
1990
1991
1992
1993
1994
1995
1996
1997
1998
1999
2000
2001
2002
2003
2004
2005
2006
2007
2008
2009
2010
2011
2012
2013
Annual GDP change Annual advertising volume change
Sources: Statistics Finland, Finnish Advertising Council, TNS
4
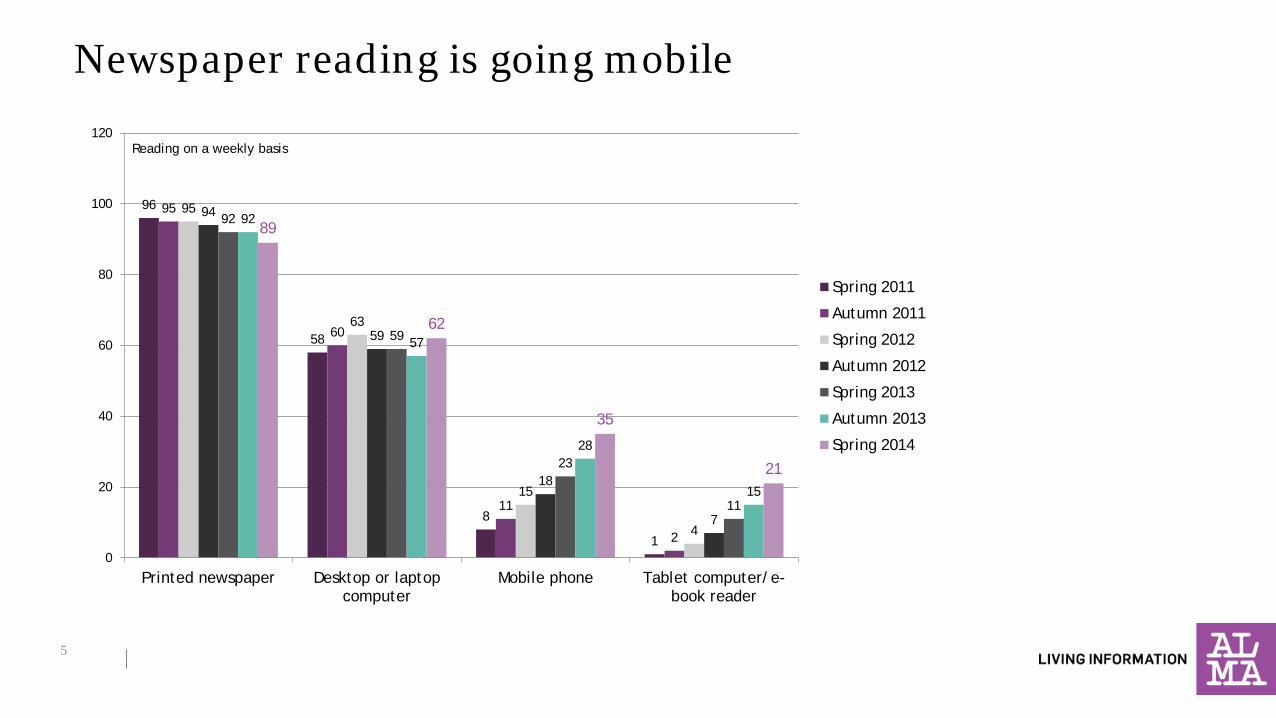
Newspaper reading is going mobile
5
96
58
8
1
95
60
11
2
95
63
15
4
94
59
18
7
92
59
23
11
92
57
28
15
89
62
35
21
0
20
40
60
80
100
120
Printed newspaper Desktop or laptopcomputer
Mobile phone Tablet computer/e-book reader
Spring 2011
Autumn 2011
Spring 2012
Autumn 2012
Spring 2013
Autumn 2013
Spring 2014
Reading on a weekly basis
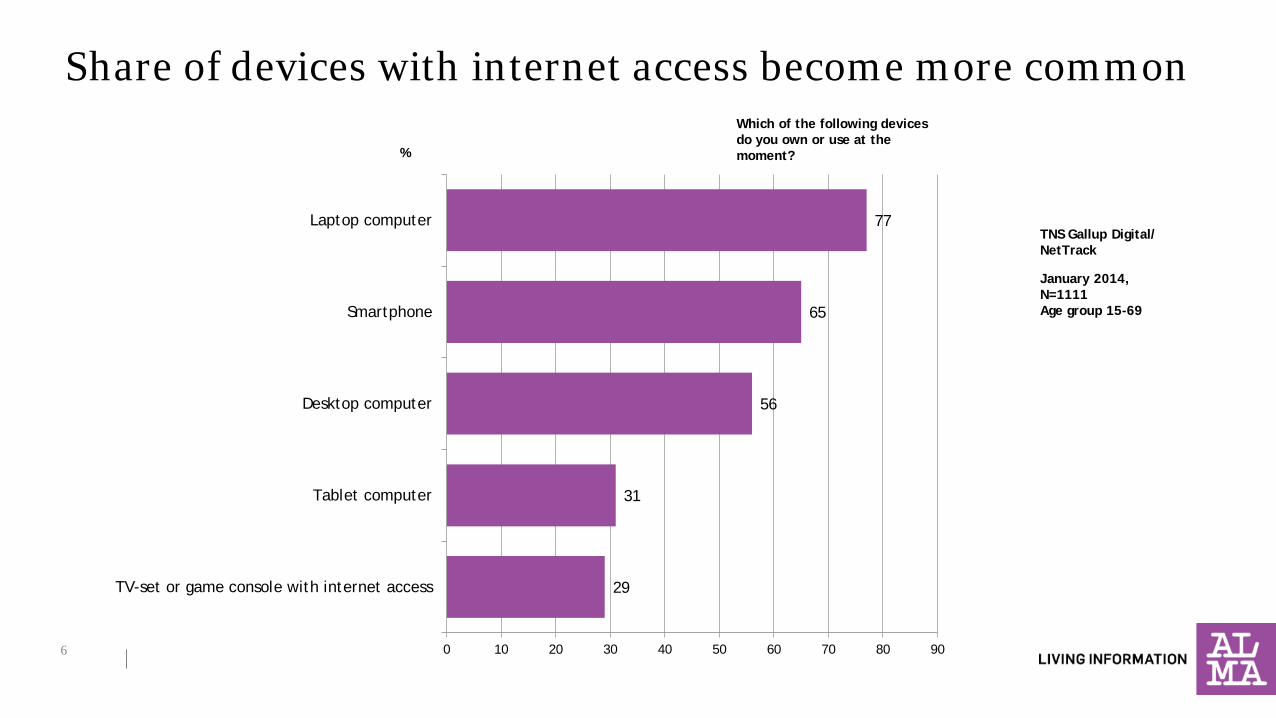
Share of devices with internet access become more common
6
29
31
56
65
77
0 10 20 30 40 50 60 70 80 90
TV-set or game console with internet access
Tablet computer
Desktop computer
Smartphone
Laptop computer
January 2014, N=1111 Age group 15-69
TNS Gallup Digital/ NetTrack
Which of the following devices do you own or use at the moment? %
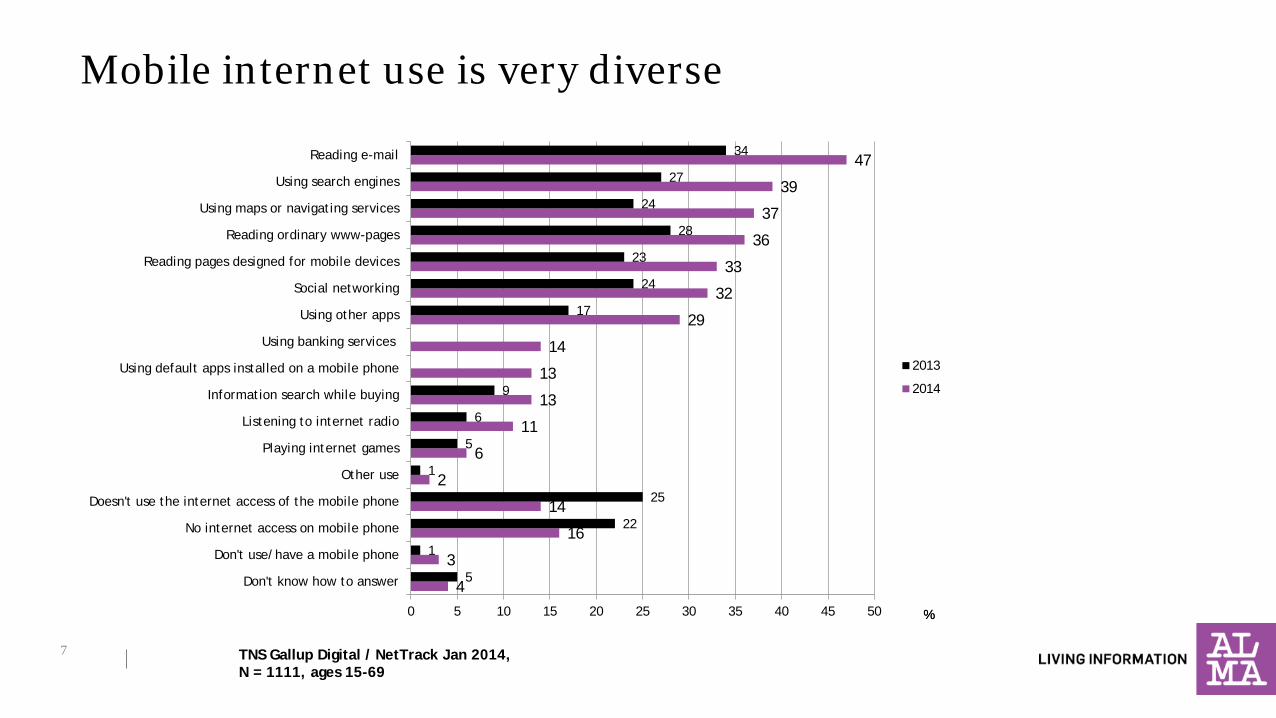
Mobile internet use is very diverse
7
4
3
16
14
2
6
11
13
13
14
29
32
33
36
37
39
47
5
1
22
25
1
5
6
9
17
24
23
28
24
27
34
0 5 10 15 20 25 30 35 40 45 50
Don't know how to answer
Don't use/have a mobile phone
No internet access on mobile phone
Doesn't use the internet access of the mobile phone
Other use
Playing internet games
Listening to internet radio
Information search while buying
Using default apps installed on a mobile phone
Using banking services
Using other apps
Social networking
Reading pages designed for mobile devices
Reading ordinary www-pages
Using maps or navigating services
Using search engines
Reading e-mail
2013
2014
% %
TNS Gallup Digital / NetTrack Jan 2014, N = 1111, ages 15-69
8
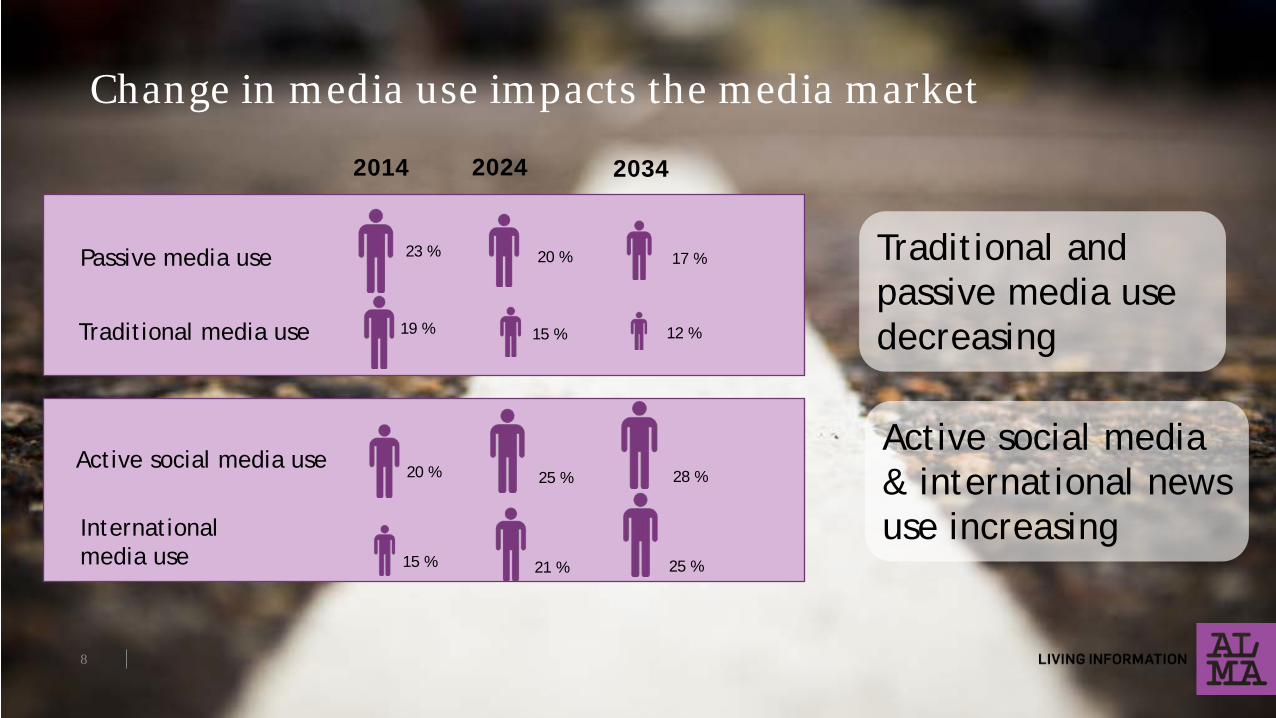
Change in media use impacts the media market
2014 2024 2034
15 % 21 % 25 %
20 % 25 % 28 %
19 % 15 % 12 %
23 % 20 % 17 % Passive media use
Traditional media use
Active social media use
International media use
Active social media & international news use increasing
Traditional and passive media use decreasing
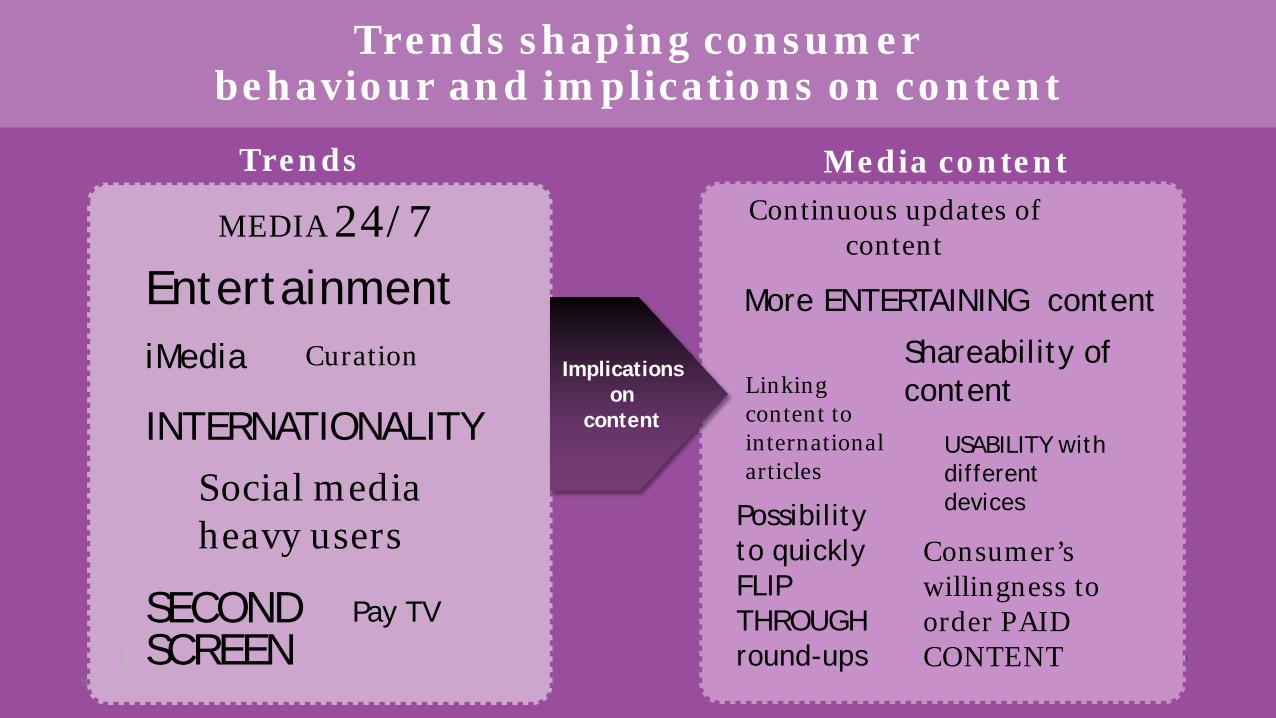
Trends shaping consumer behaviour and implications on content
9
MEDIA 24/7 Entertainment iMedia
Social media heavy users
SECOND SCREEN
INTERNATIONALITY
Curation
Pay TV
Continuous updates of content
More ENTERTAINING content
USABILITY with different devices
Shareability of content
Possibility to quickly FLIP THROUGH round-ups
Linking content to international articles
Consumer’s willingness to order PAID CONTENT
Implications on
content
Trends Media content
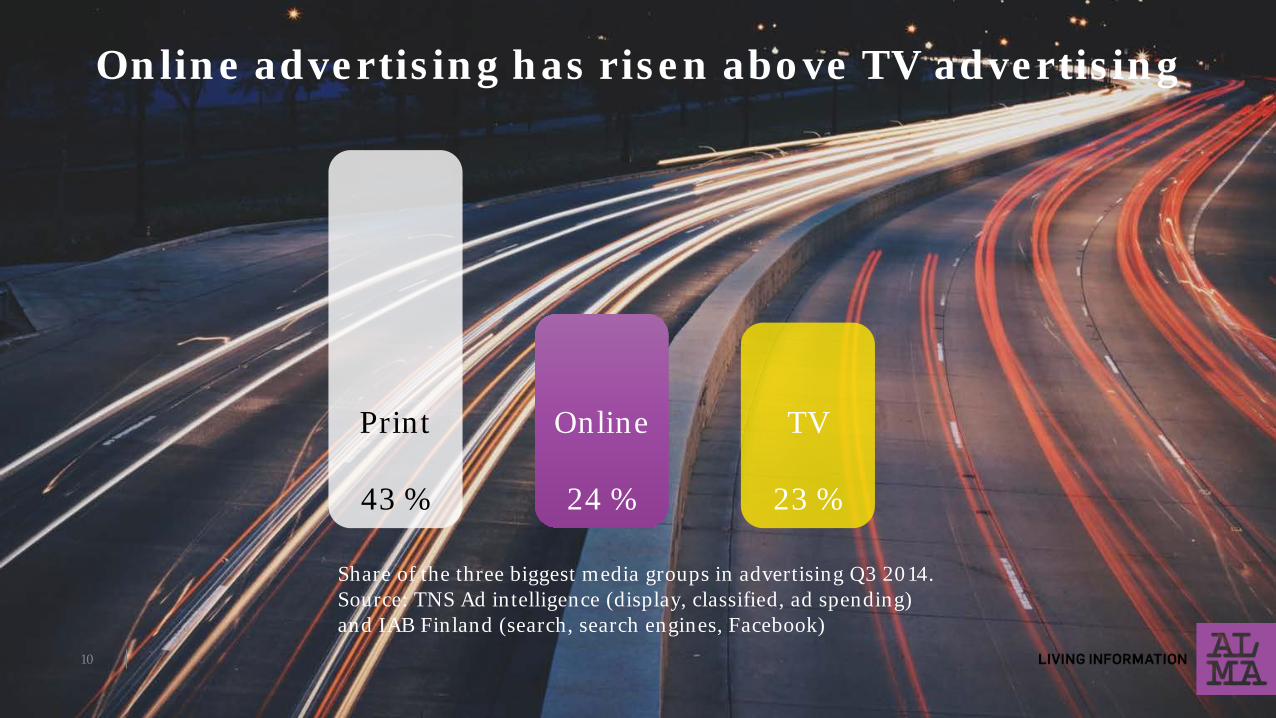
Online advertising has risen above TV advertising
Share of the three biggest media groups in advertising Q3 2014. Source: TNS Ad intelligence (display, classified, ad spending) and IAB Finland (search, search engines, Facebook)
43 %
Online
24 %
TV
23 %
10
How do we respond?
11
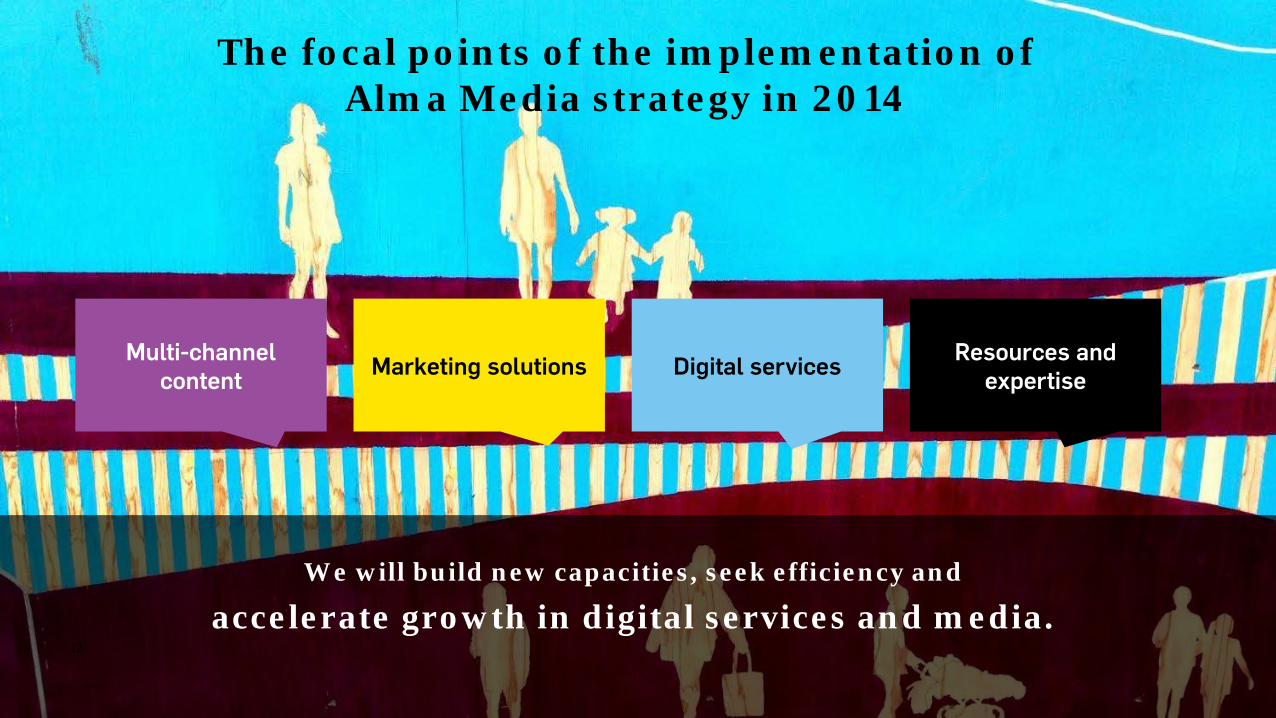
The focal points of the implementation of Alma Media strategy in 2014
We will build new capacities, seek efficiency and
accelerate growth in digital services and media.
Multi-channel content Marketing solutions Digital services Resources and
expertise
12
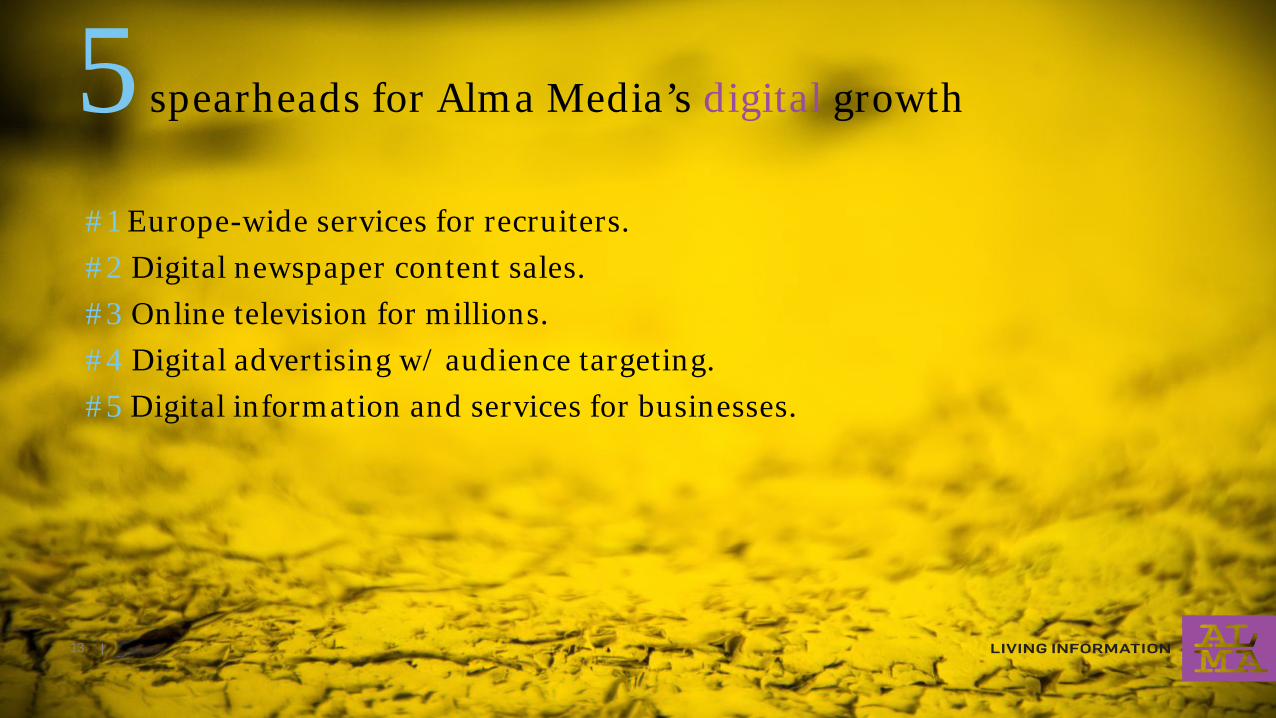
5 spearheads for Alma Media’s digital growth
#1 Europe-wide services for recruiters. #2 Digital newspaper content sales. #3 Online television for millions. #4 Digital advertising w/ audience targeting. #5 Digital information and services for businesses.
13
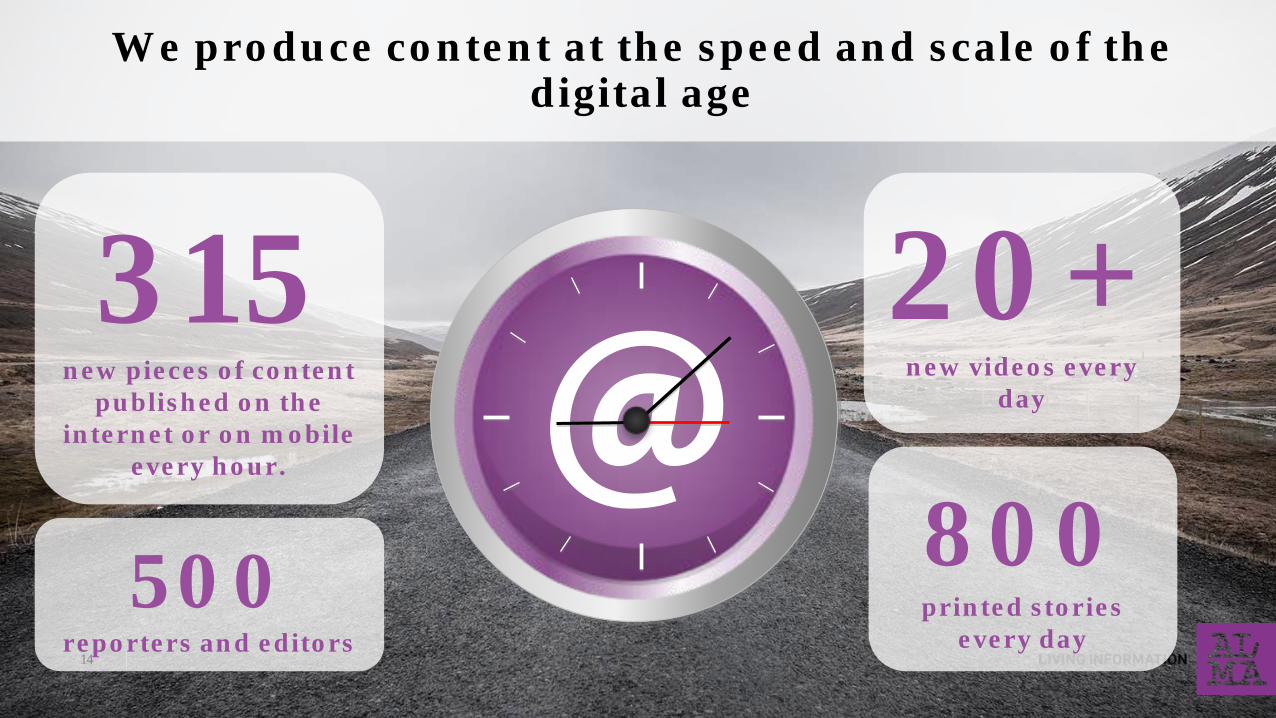
We produce content at the speed and scale of the digital age
20+ new videos every
day
315 new pieces of content
published on the internet or on mobile
every hour.
500 reporters and editors
800 printed stories
every day 14
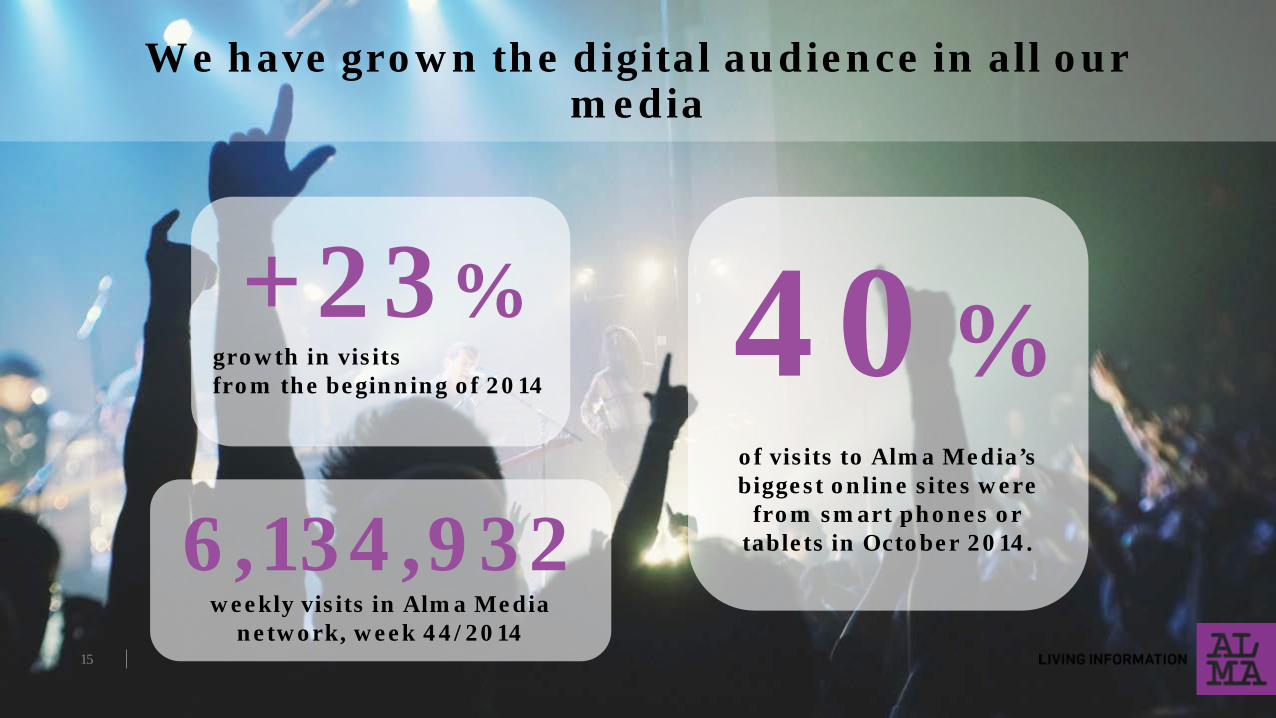
We have grown the digital audience in all our media
6,134,932 weekly visits in Alma Media
network, week 44/2014
+23% growth in visits from the beginning of 2014
40%
of visits to Alma Media’s biggest online sites were
from smart phones or tablets in October 2014.
15
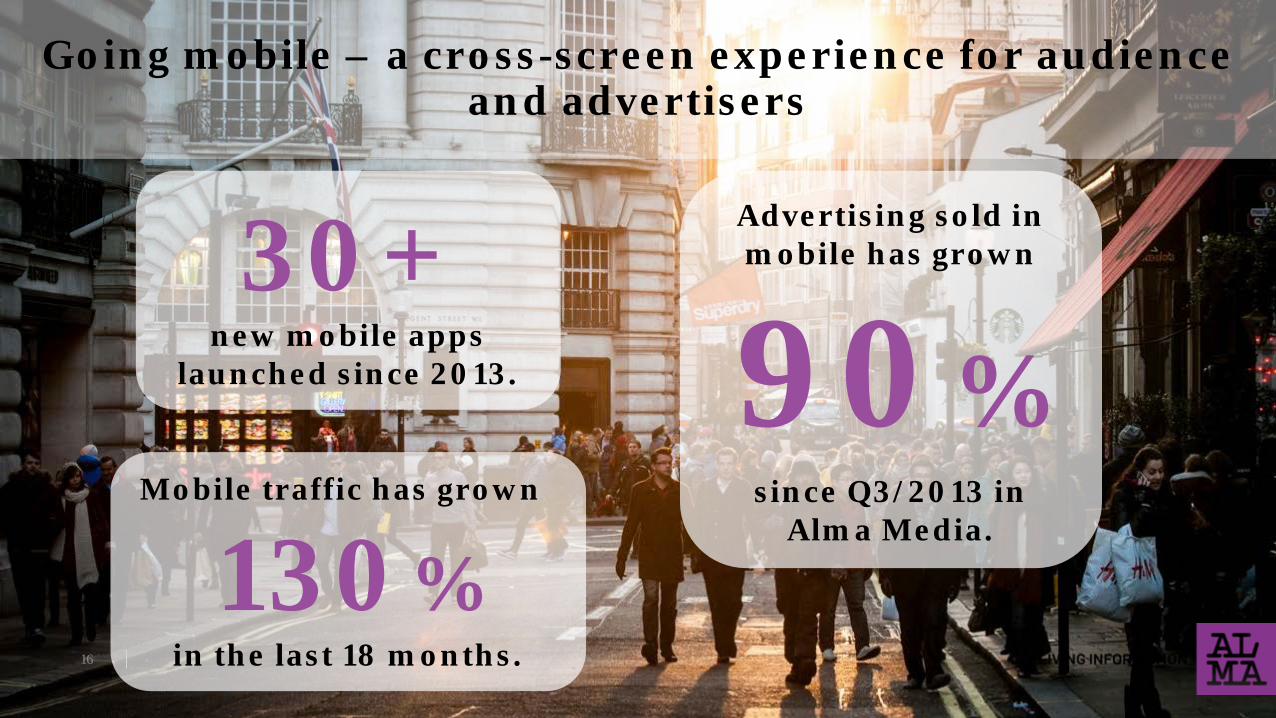
Going mobile – a cross-screen experience for audience and advertisers
Mobile traffic has grown
130% in the last 18 months.
30+ new mobile apps
launched since 2013.
Advertising sold in mobile has grown
90% since Q3/2013 in
Alma Media.
16
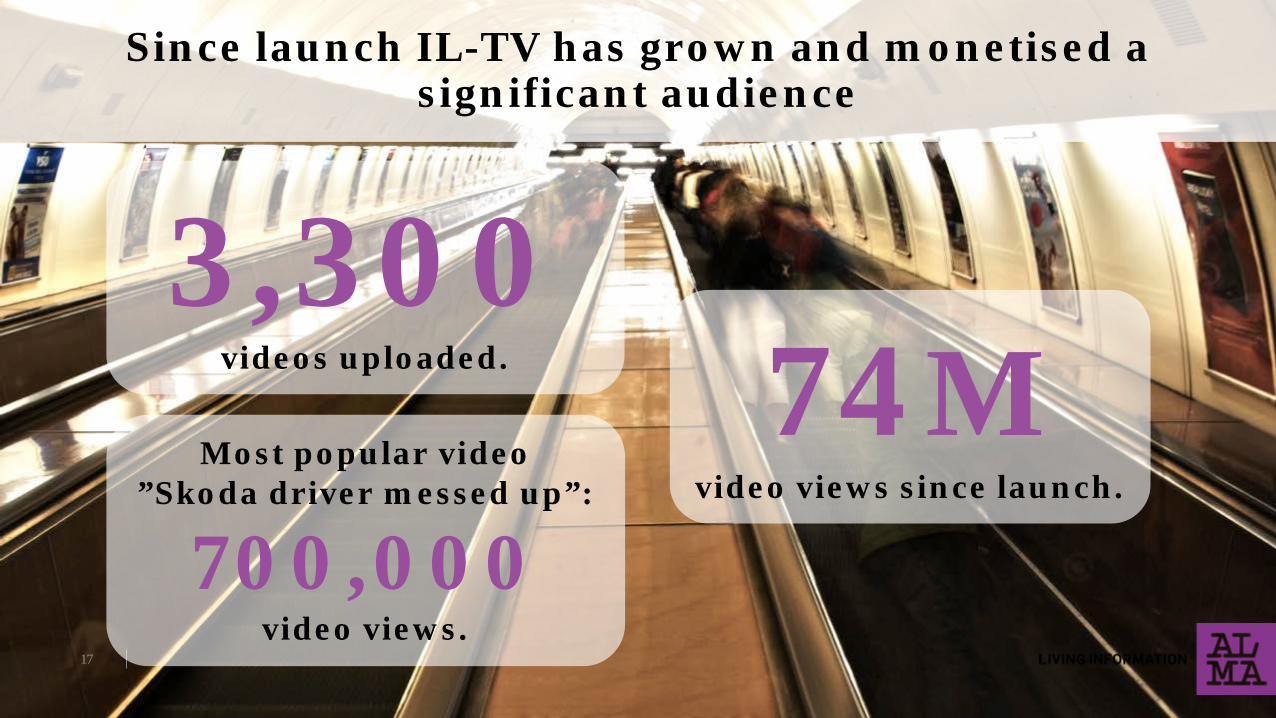
Since launch IL-TV has grown and monetised a significant audience
74M video views since launch.
3,300 videos uploaded.
Most popular video ”Skoda driver messed up”:
700,000 video views.
17
18
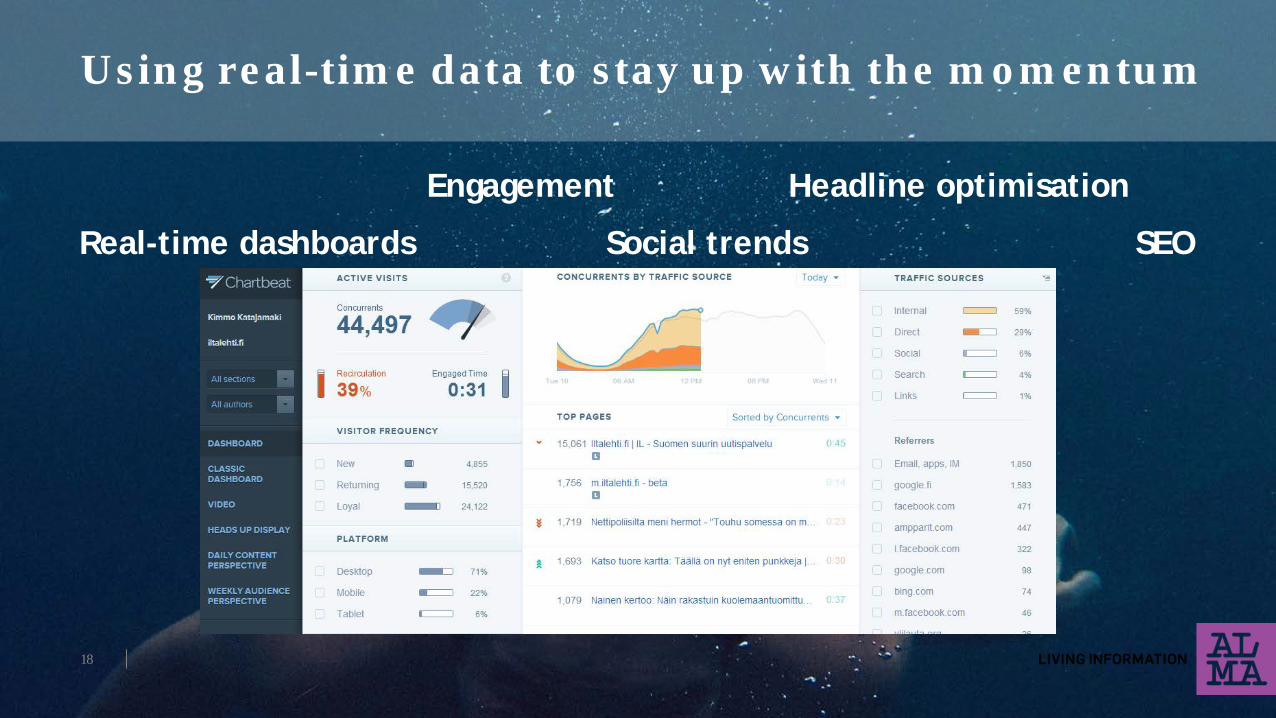
Using real-time data to stay up with the momentum
Real-time dashboards Social trends
Engagement Headline optimisation
SEO
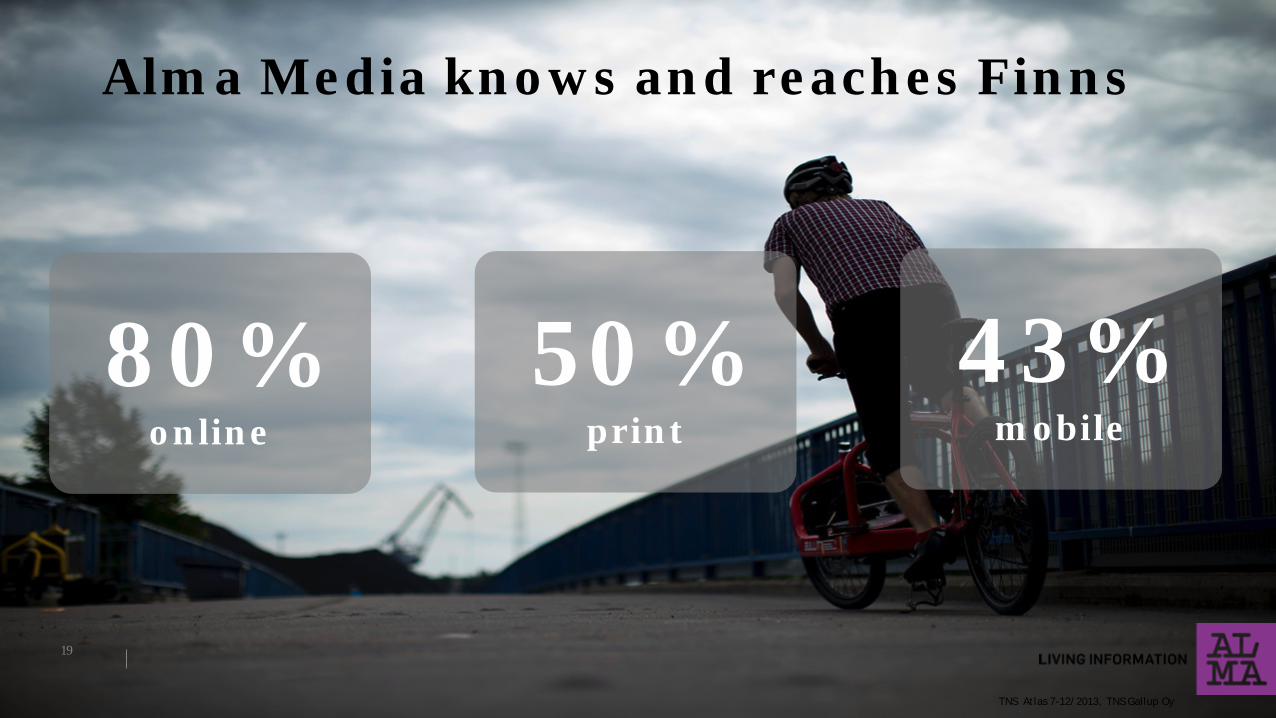
80% online
43% mobile
Alma Media knows and reaches Finns
TNS Atlas 7-12/2013, TNS Gallup Oy
50% print
19
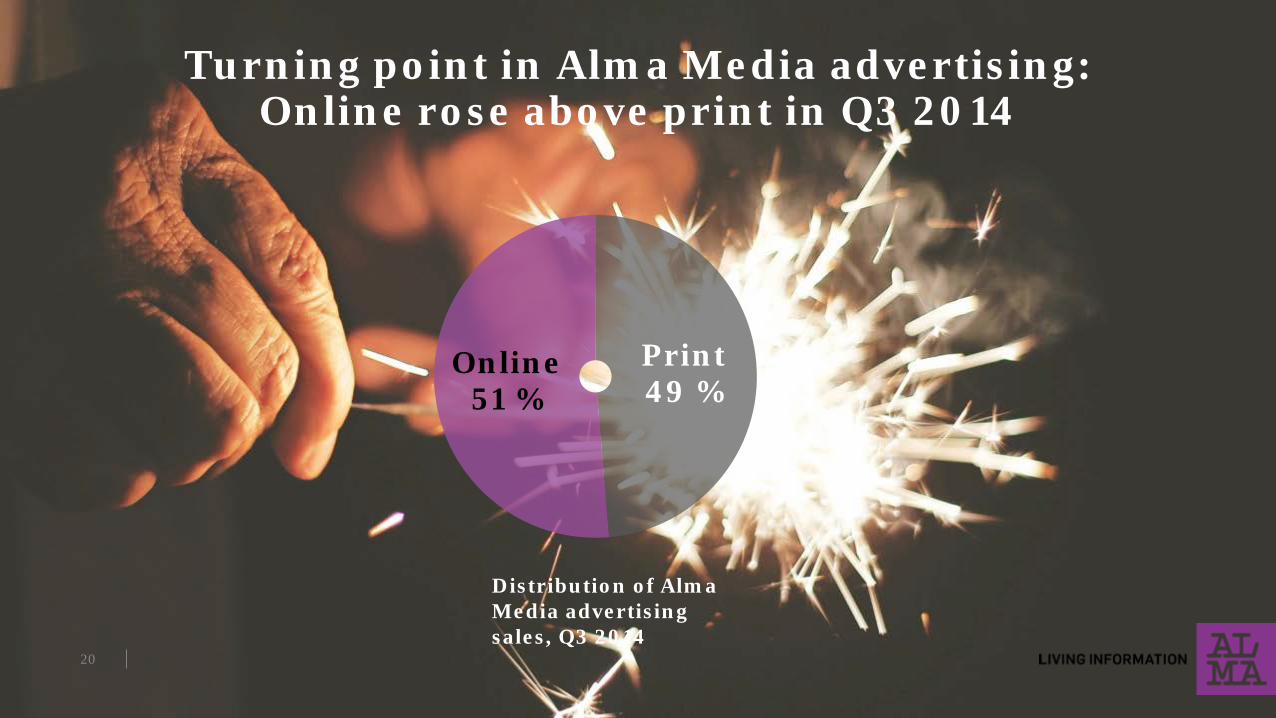
Turning point in Alma Media advertising: Online rose above print in Q3 2014
Print 49 %
Online 51 %
Distribution of Alma Media advertising sales, Q3 2014
20
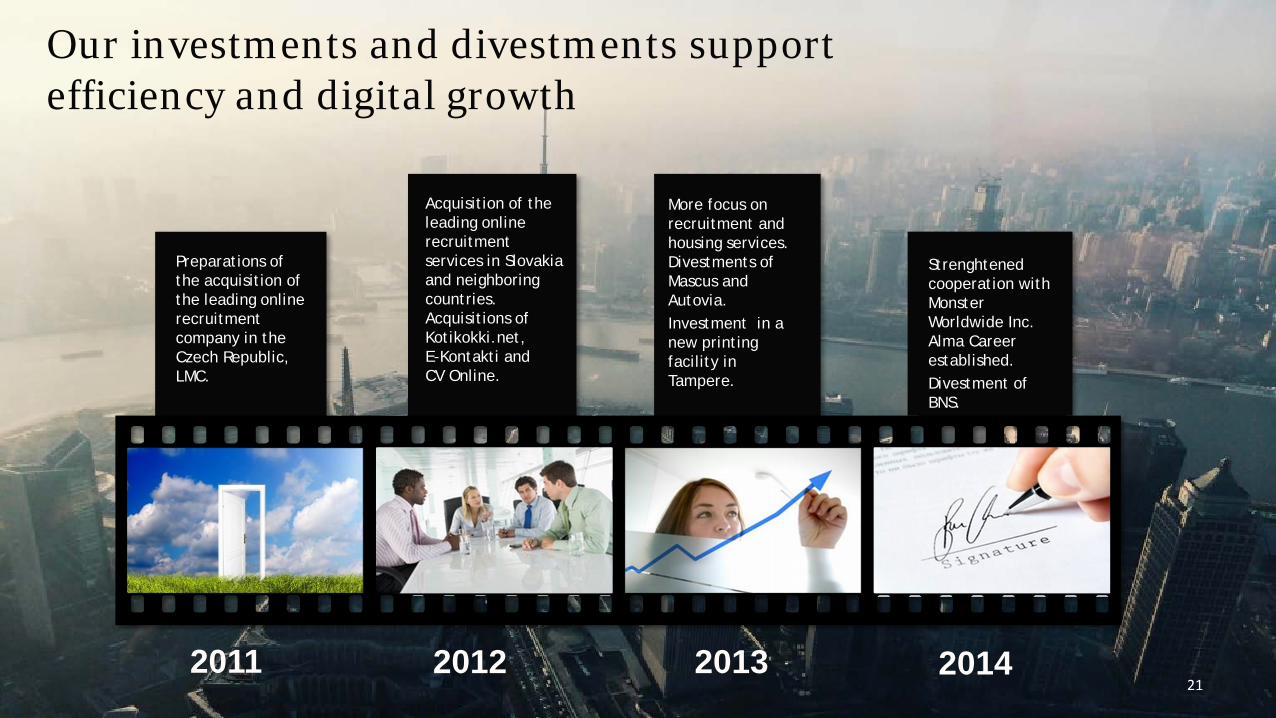
Strenghtened cooperation with Monster Worldwide Inc. Alma Career established. Divestment of BNS.
More focus on recruitment and housing services. Divestments of Mascus and Autovia. Investment in a new printing facility in Tampere.
Our investments and divestments support efficiency and digital growth
2011 2012 2013 2014
Preparations of the acquisition of the leading online recruitment company in the Czech Republic, LMC.
Acquisition of the leading online recruitment services in Slovakia and neighboring countries. Acquisitions of Kotikokki.net, E-Kontakti and CV Online.
21
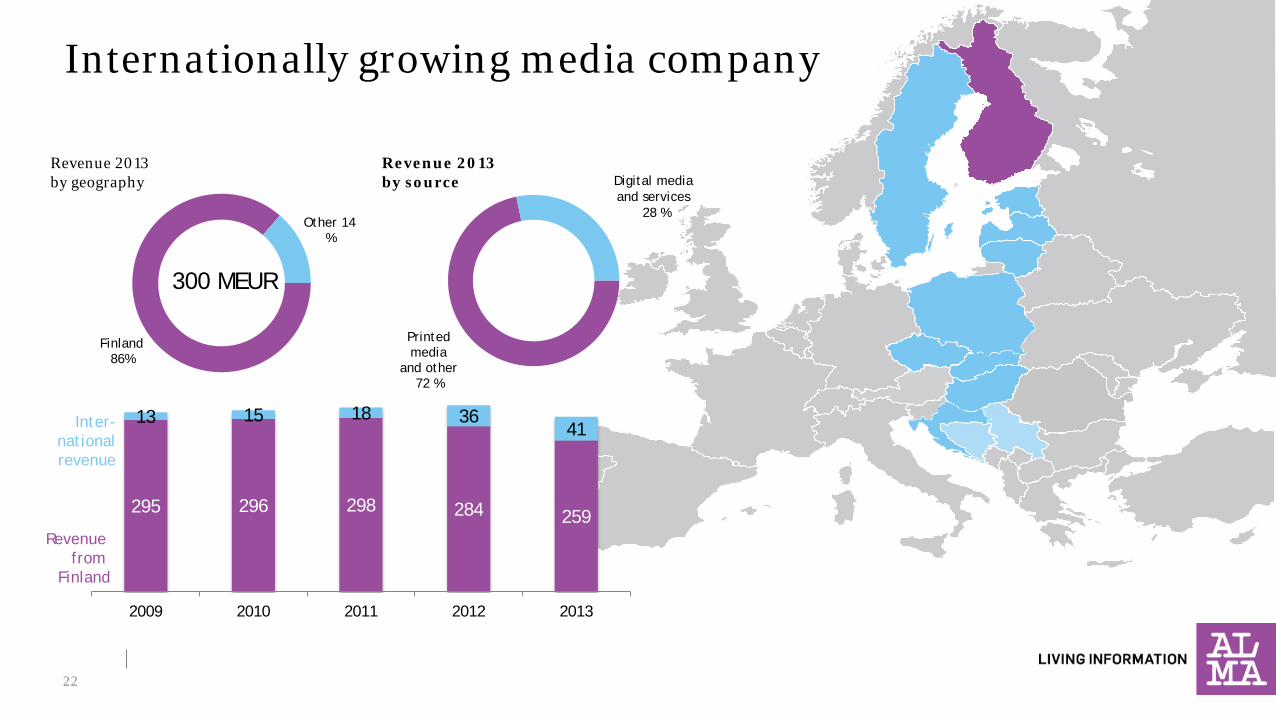
Internationally growing media company
22
Finland 86%
Other 14 %
295 296 298 284 259
13 15 18 36 41
2009 2010 2011 2012 2013
Revenue 2013 by geography
300 MEUR
Printed media
and other 72 %
Revenue 2013 by source
Digital media and services
28 %
Revenue from
Finland
Inter- national revenue
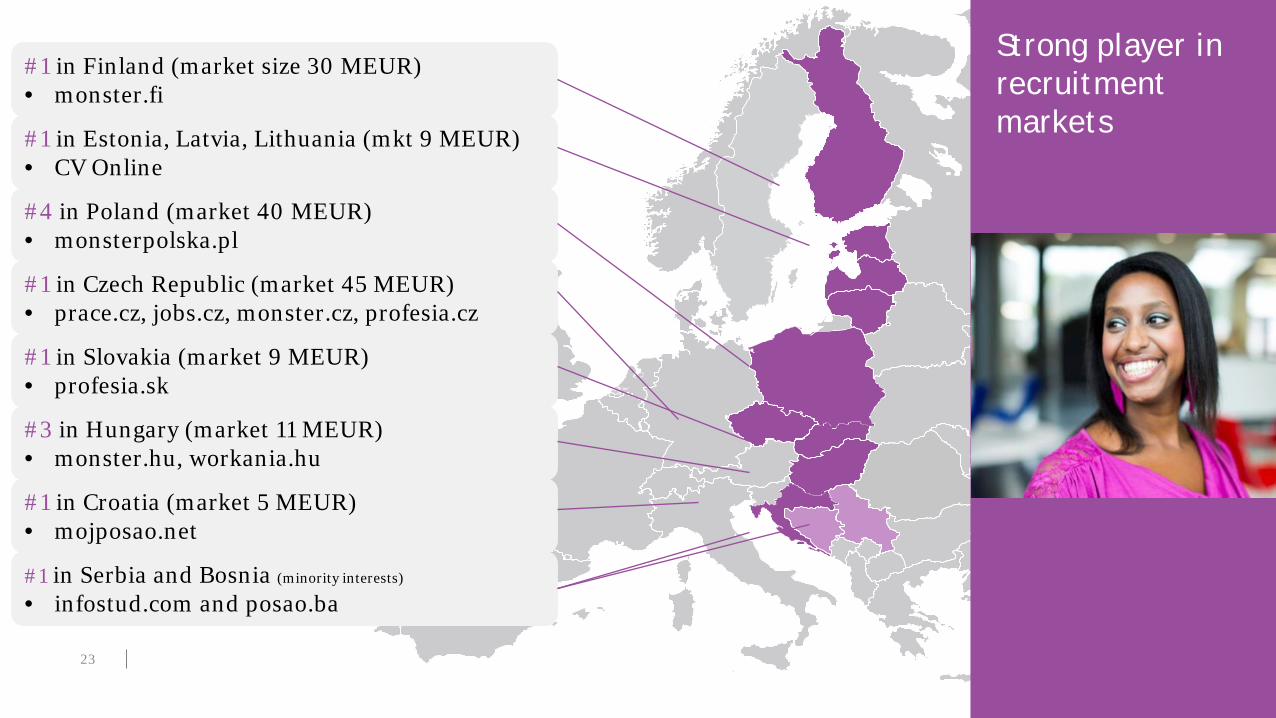
Strong player in recruitment markets
#1 in Finland (market size 30 MEUR) • monster.fi
#1 in Estonia, Latvia, Lithuania (mkt 9 MEUR) • CV Online
#1 in Czech Republic (market 45 MEUR) • prace.cz, jobs.cz, monster.cz, profesia.cz
#1 in Slovakia (market 9 MEUR) • profesia.sk
#1 in Croatia (market 5 MEUR) • mojposao.net
#1 in Serbia and Bosnia (minority interests)
• infostud.com and posao.ba
#4 in Poland (market 40 MEUR) • monsterpolska.pl
#3 in Hungary (market 11 MEUR) • monster.hu, workania.hu
23
Our success cases
Attracting audiences through growth hacking Johanna Suhonen / Kauppalehti
Multi-channel content
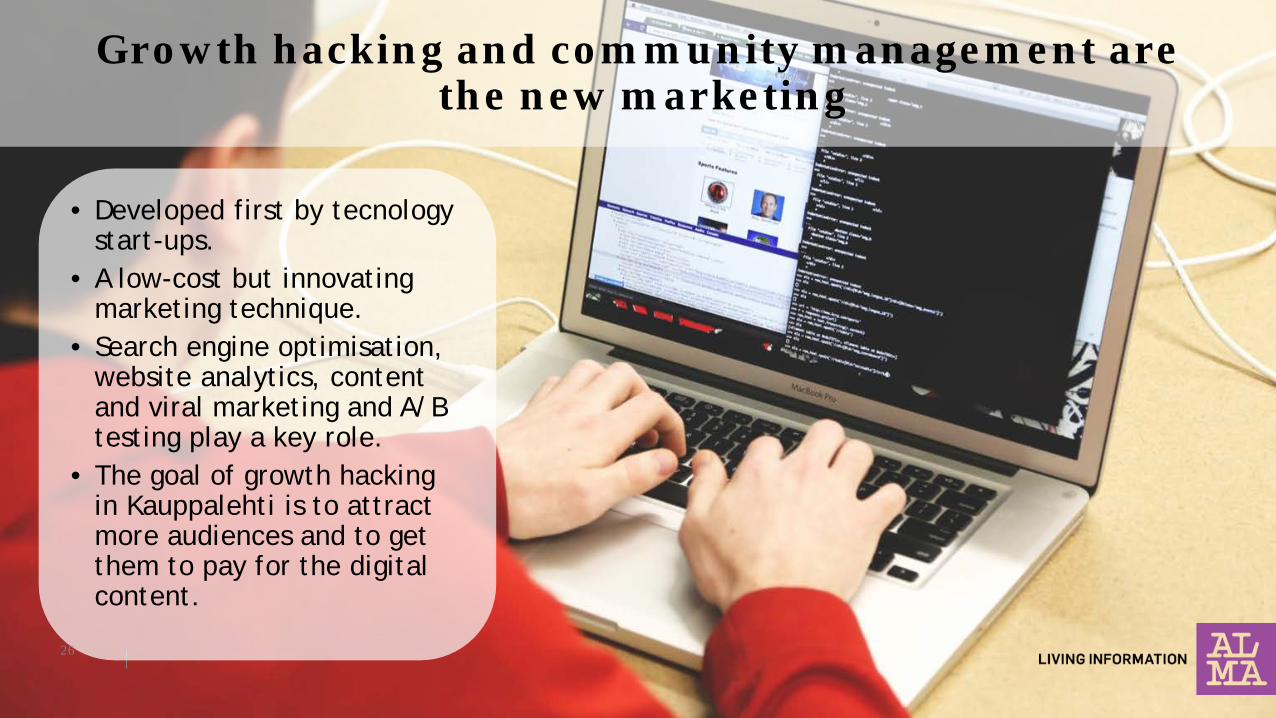
Growth hacking and community management are the new marketing
• Developed first by tecnology start-ups.
• A low-cost but innovating marketing technique.
• Search engine optimisation, website analytics, content and viral marketing and A/B testing play a key role.
• The goal of growth hacking in Kauppalehti is to attract more audiences and to get them to pay for the digital content.
26
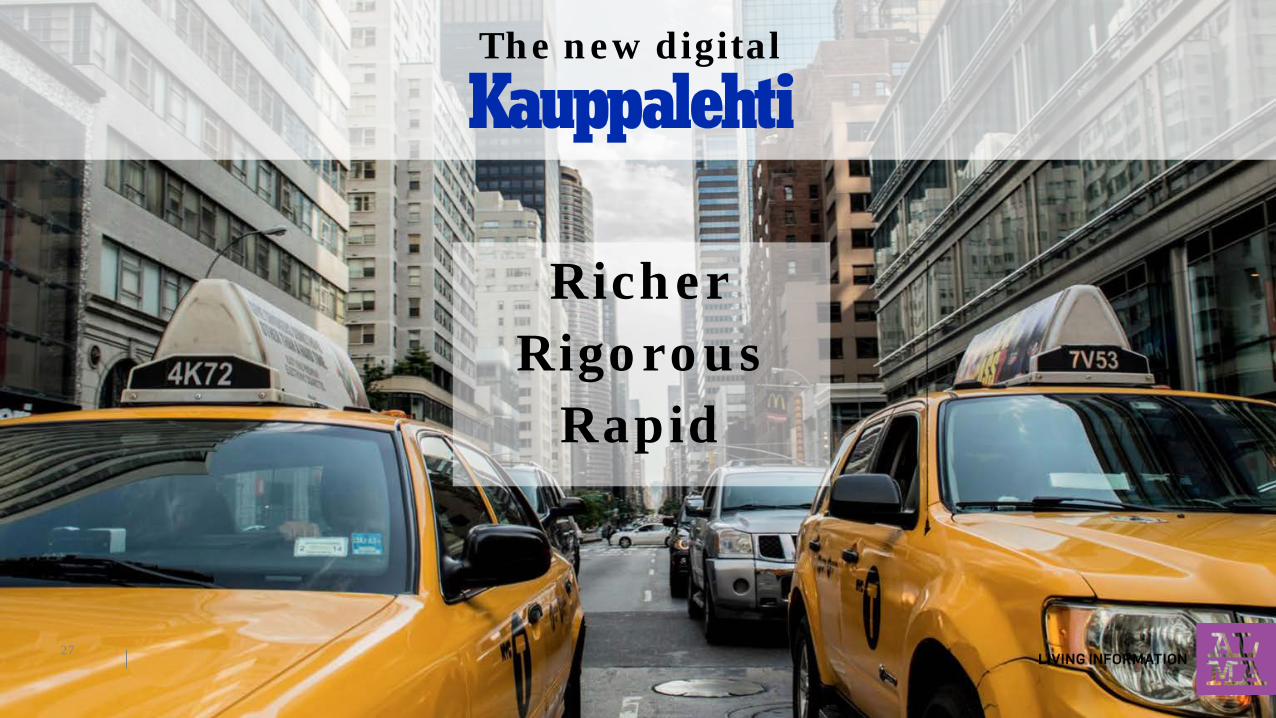
Richer Rigorous
Rapid
The new digital
27
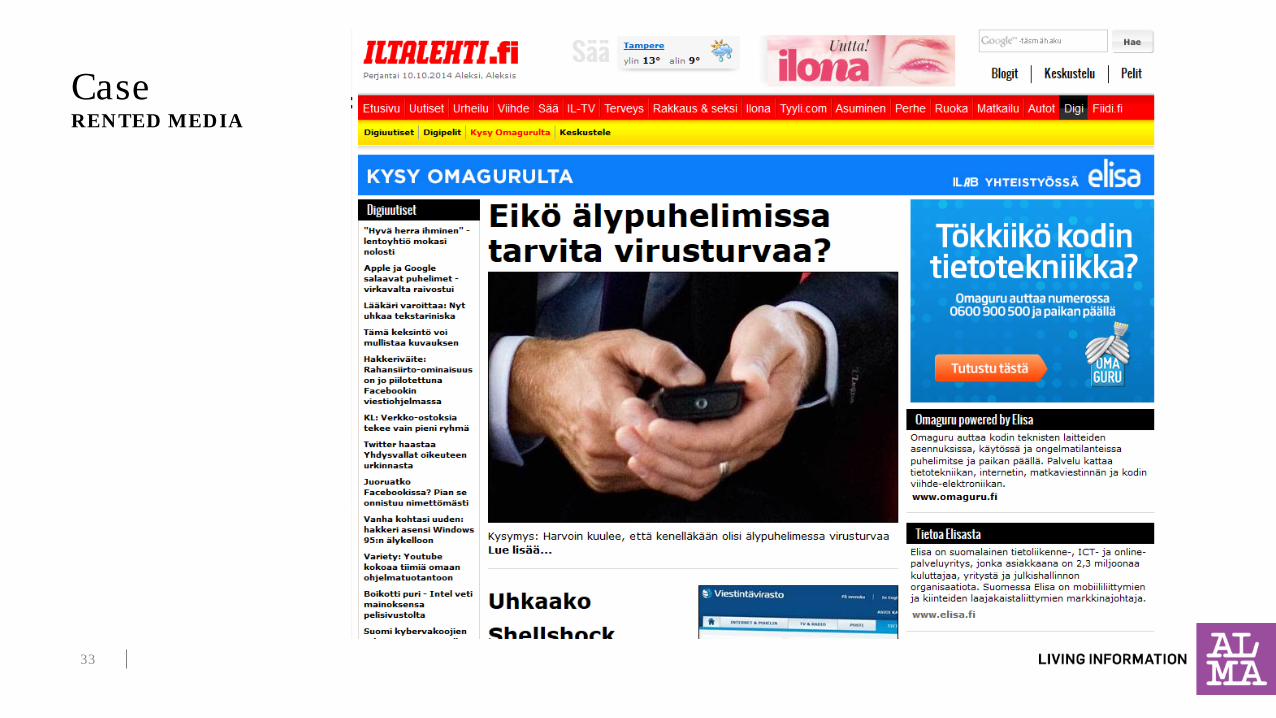
Exploring new forms of advertising
Minna Mäkinen / Iltalehti
Marketing solutions
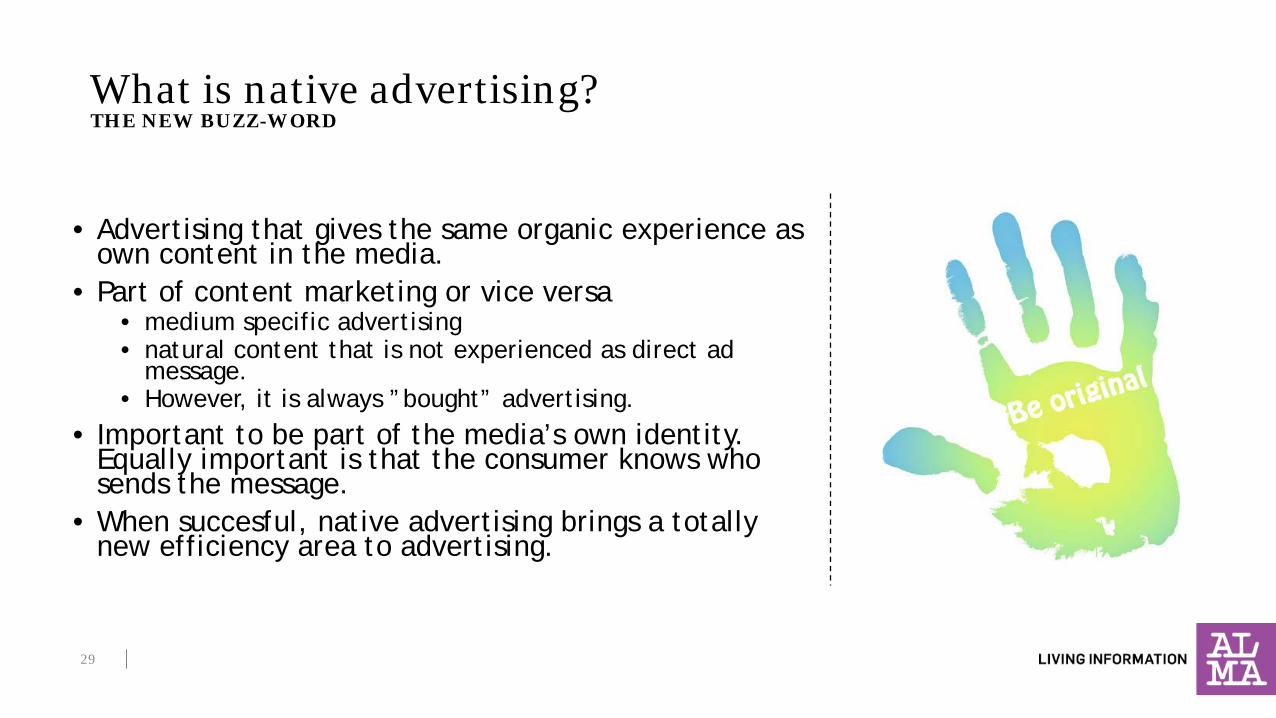
• Advertising that gives the same organic experience as
own content in the media. • Part of content marketing or vice versa
• medium specific advertising • natural content that is not experienced as direct ad
message. • However, it is always ”bought” advertising.
• Important to be part of the media’s own identity. Equally important is that the consumer knows who sends the message.
• When succesful, native advertising brings a totally new efficiency area to advertising.
THE NEW BUZZ-WORD What is native advertising?
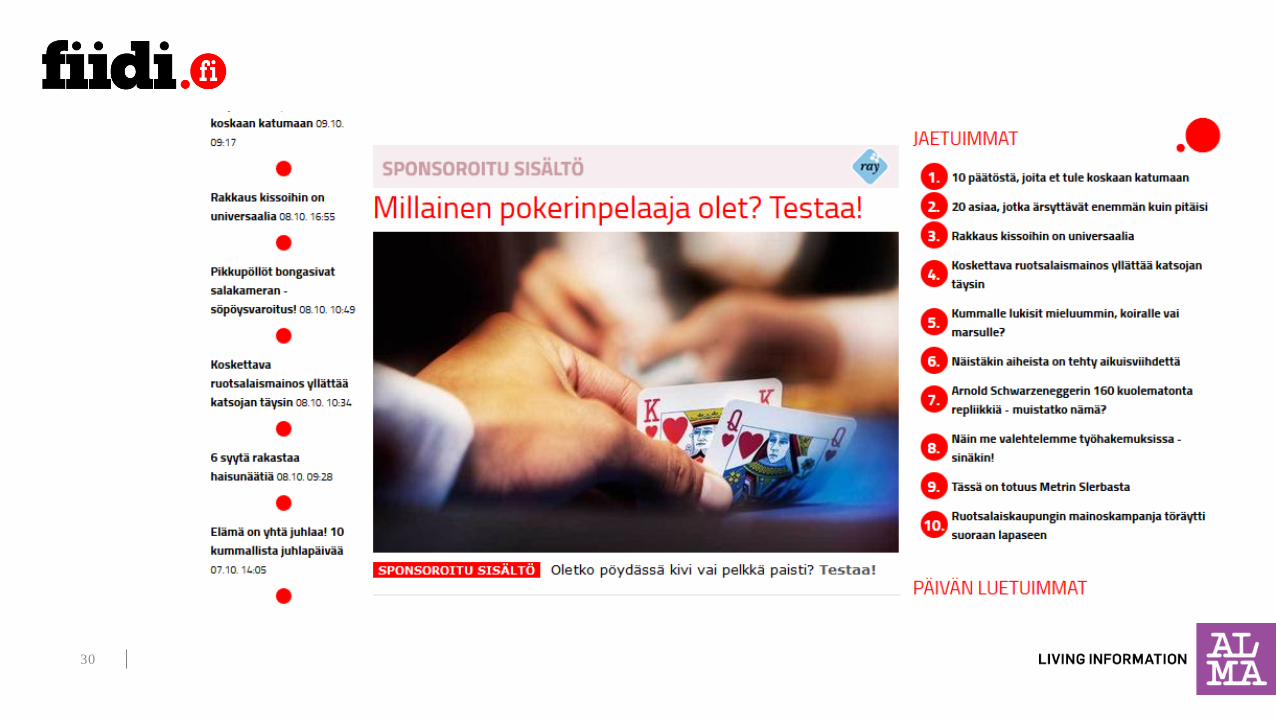
29
31
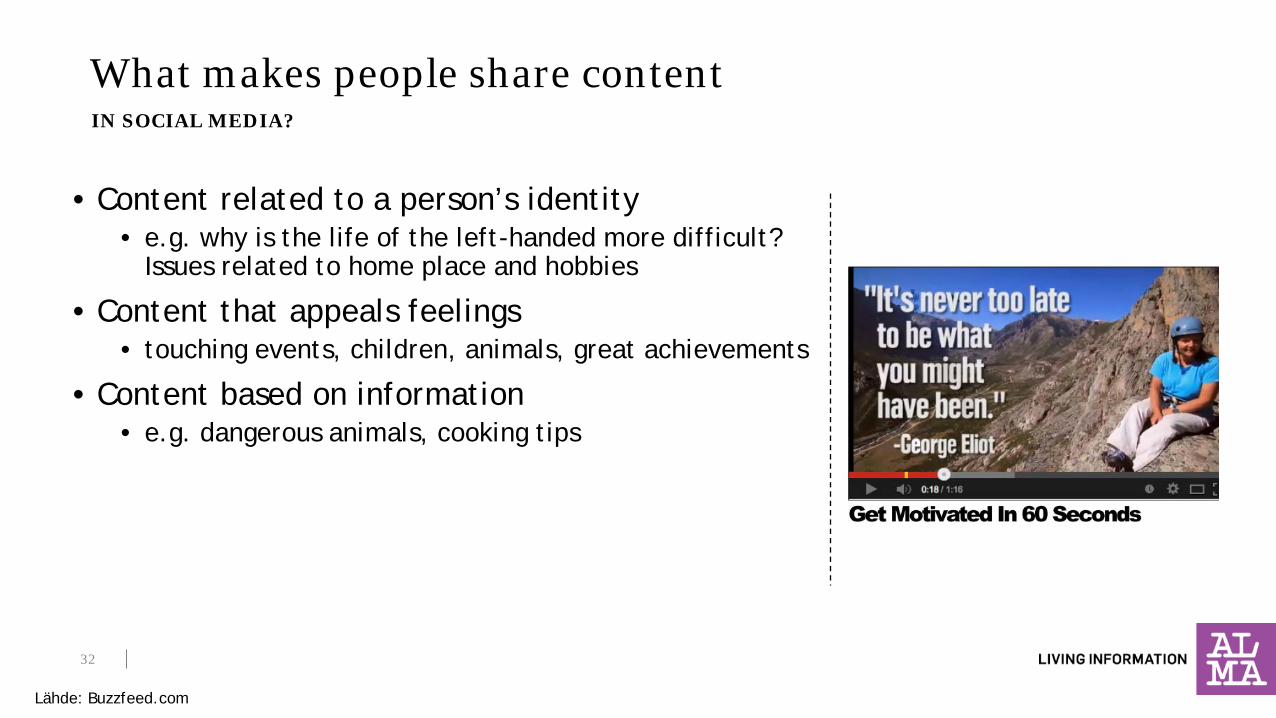
• Content related to a person’s identity • e.g. why is the life of the left-handed more difficult?
Issues related to home place and hobbies
• Content that appeals feelings • touching events, children, animals, great achievements
• Content based on information • e.g. dangerous animals, cooking tips
IN SOCIAL MEDIA?
What makes people share content
Lähde: Buzzfeed.com
32
@Telkku_com in Twitter Heli Ruotsalainen / Alma Diverso
Digital services
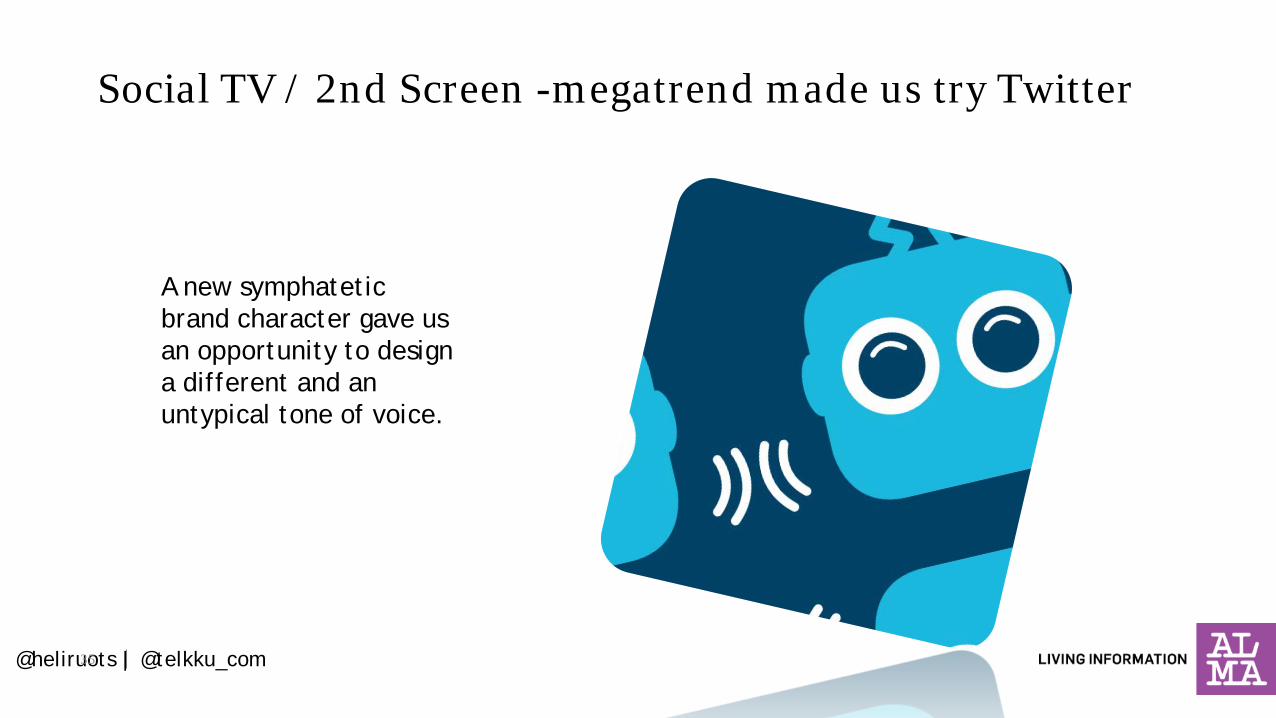
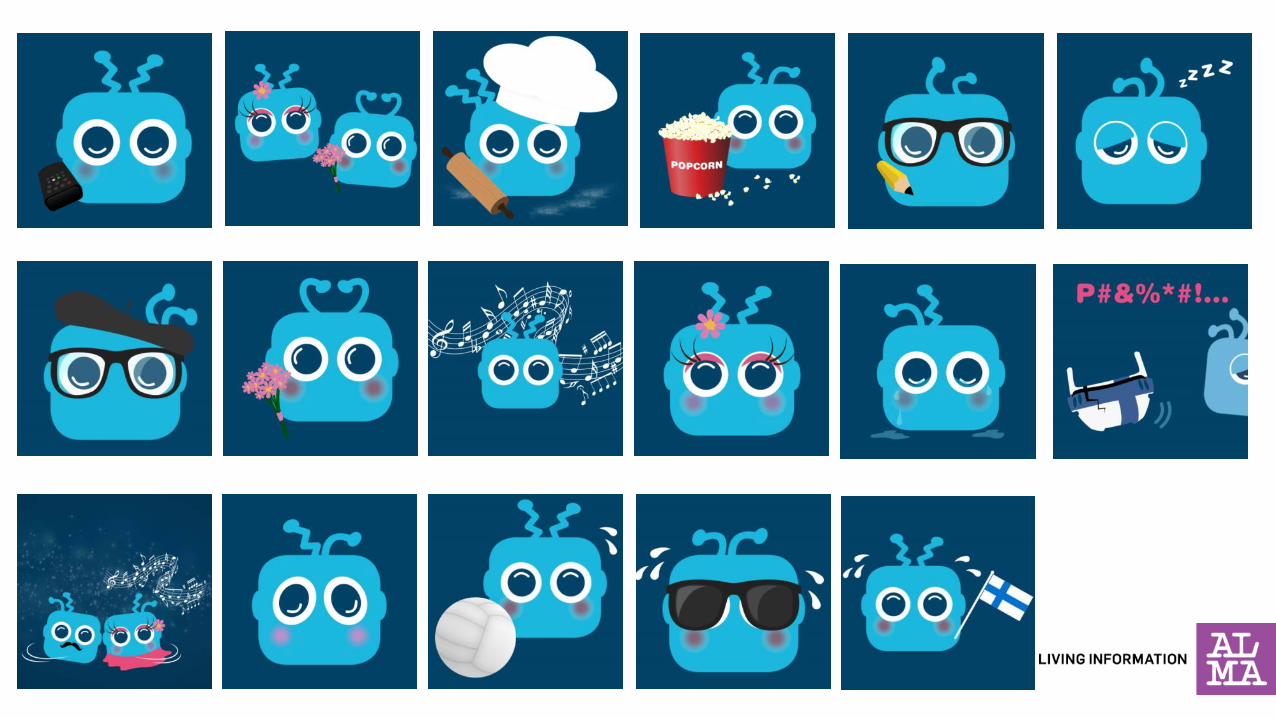
Social TV / 2nd Screen -megatrend made us try Twitter
A new symphatetic brand character gave us an opportunity to design a different and an untypical tone of voice.
@heliruots | @telkku_com 35
36
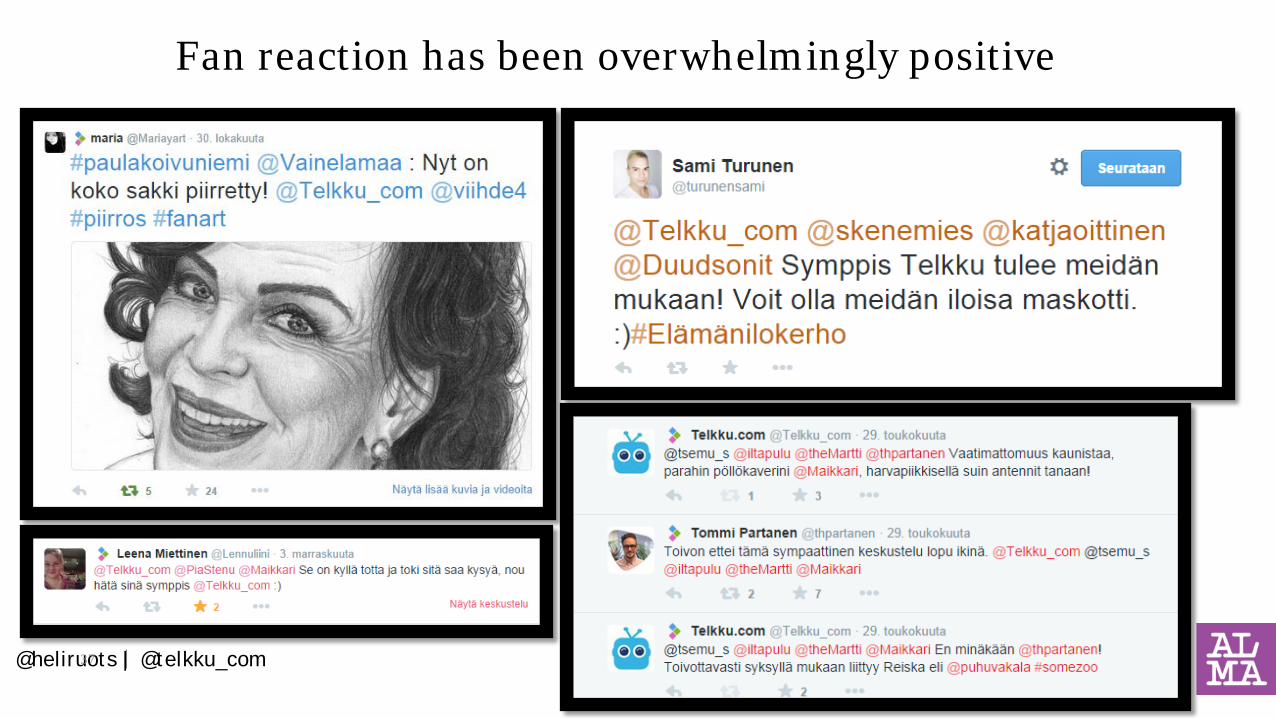
Fan reaction has been overwhelmingly positive
@heliruots | @telkku_com 37
@heliruots | @telkku_com 38
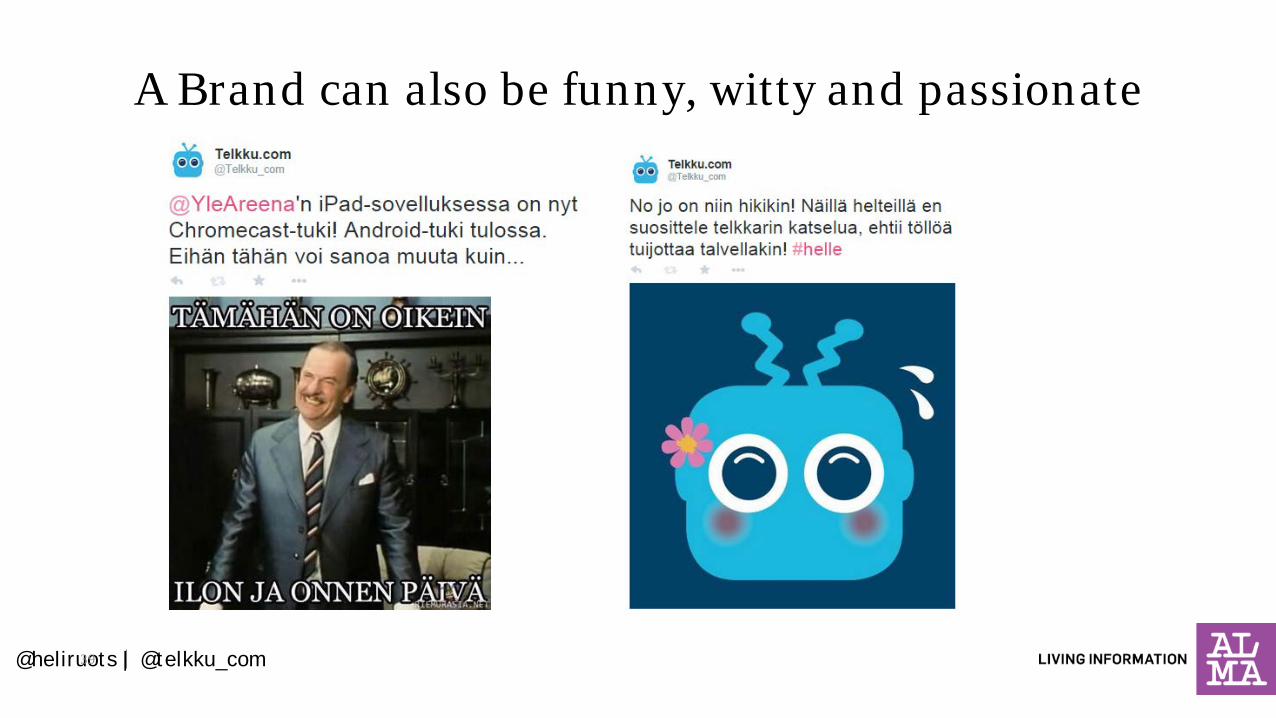
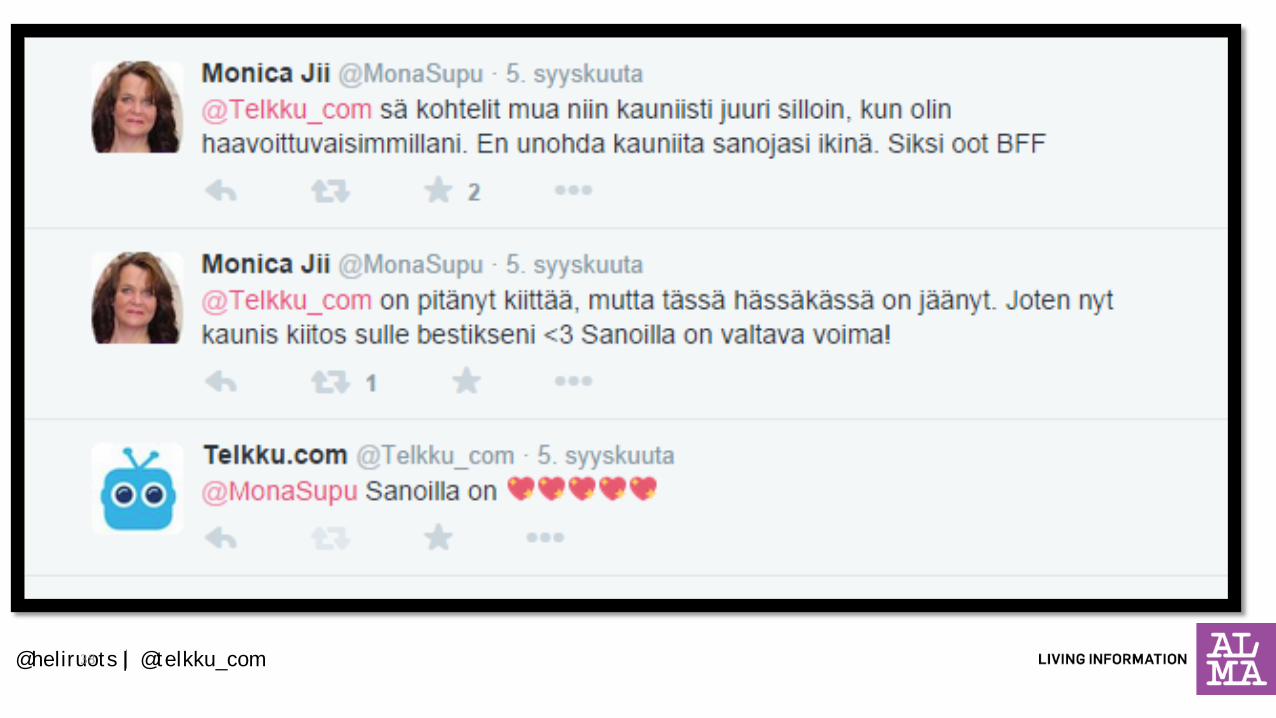
A Brand can also be funny, witty and passionate
@heliruots | @telkku_com 39
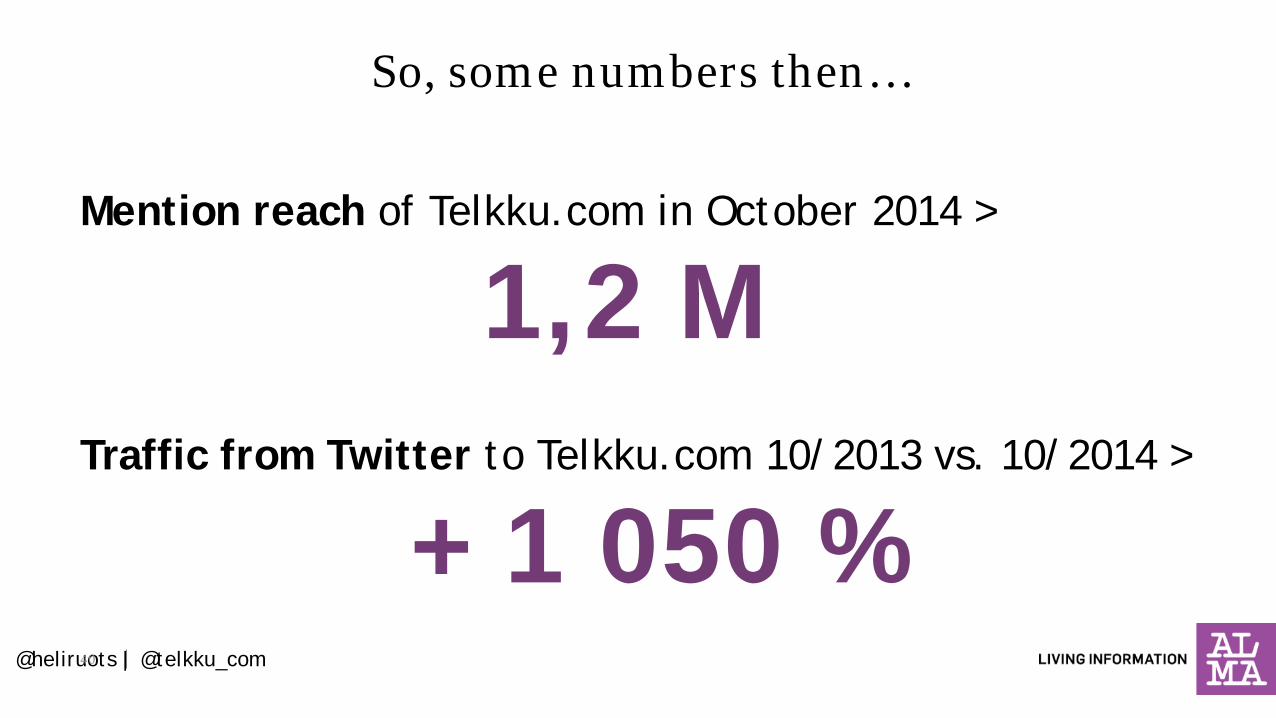
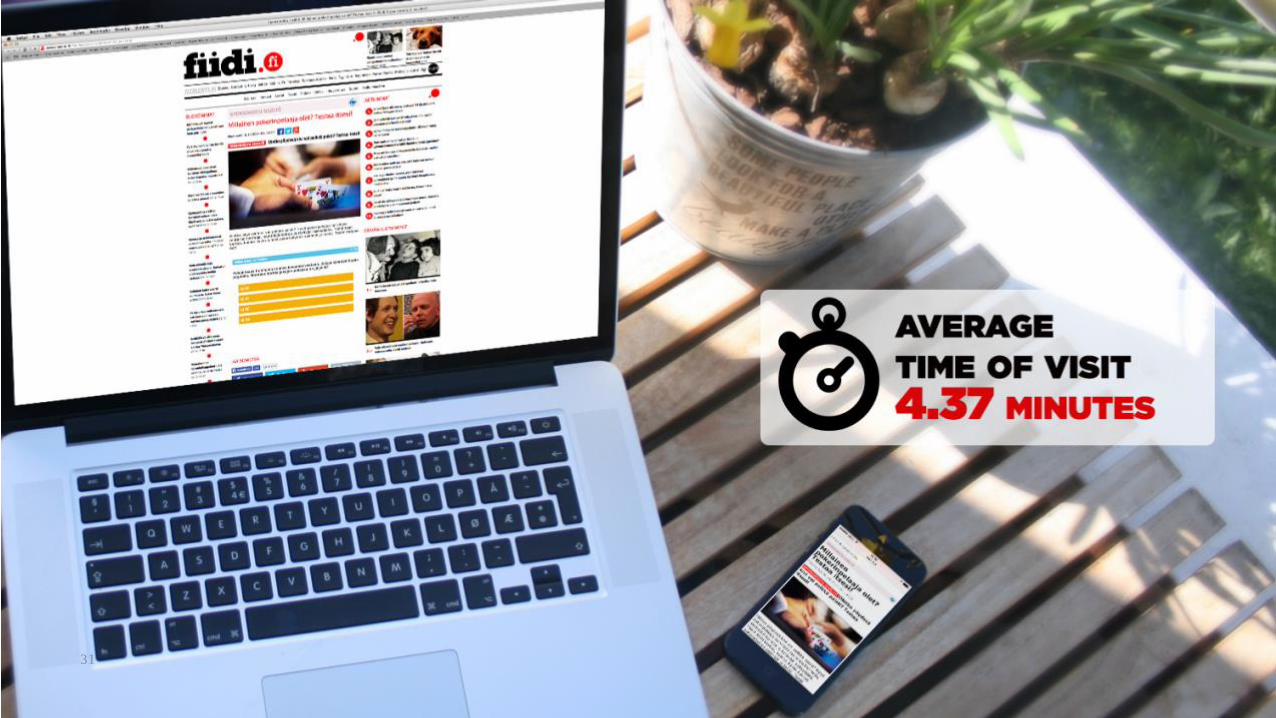
Mention reach of Telkku.com in October 2014 >
1,2 M Traffic from Twitter to Telkku.com 10/2013 vs. 10/2014 >
+ 1 050 %
So, some numbers then…
@heliruots | @telkku_com 40
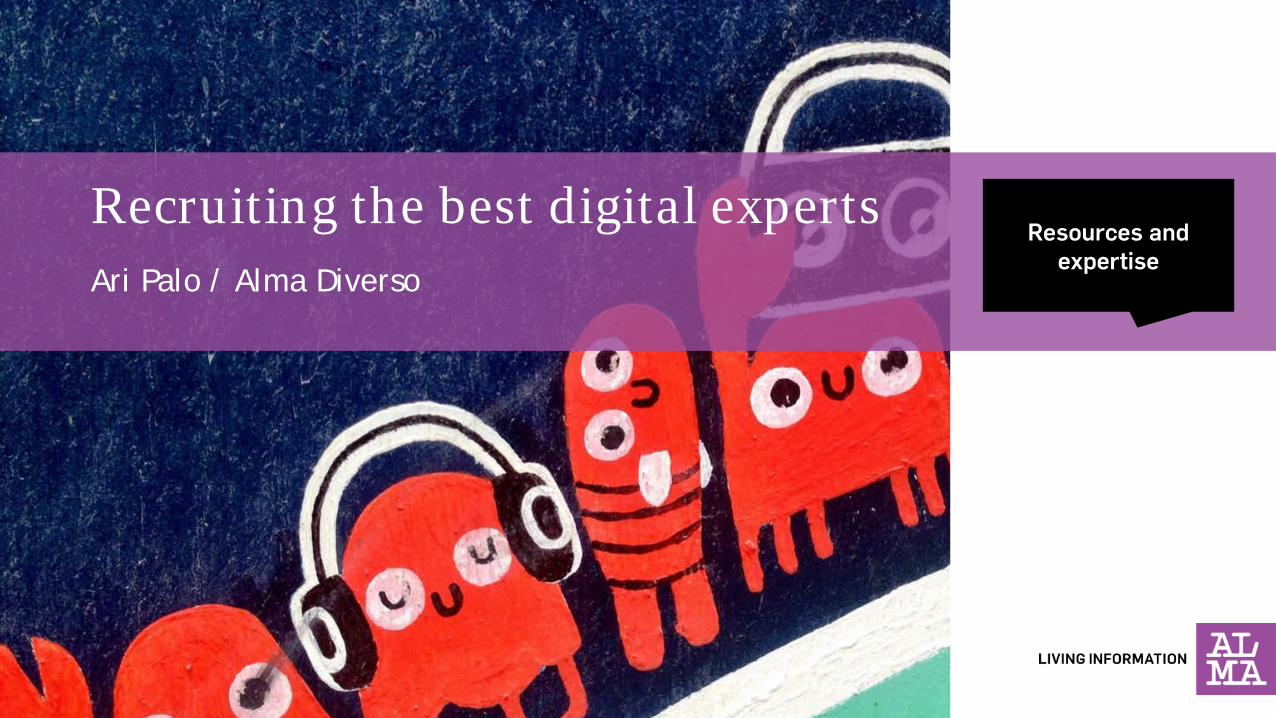
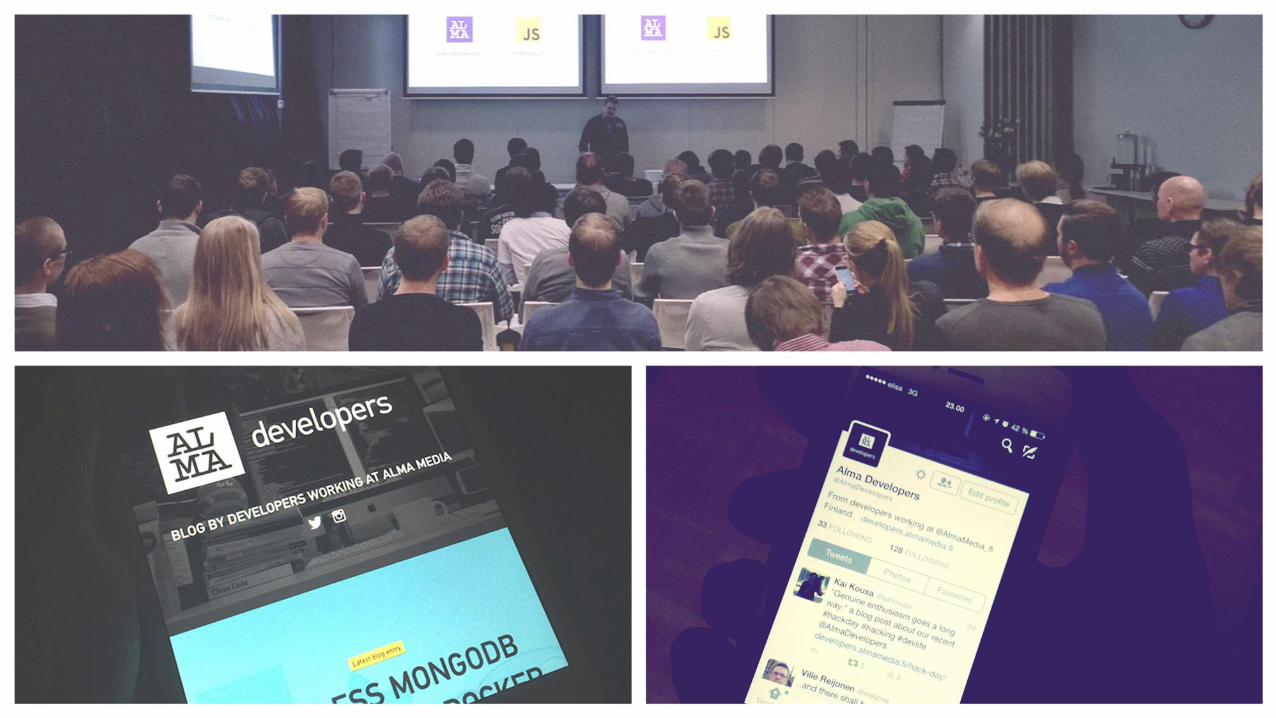
Recruiting the best digital experts Ari Palo / Alma Diverso
Resources and expertise

44
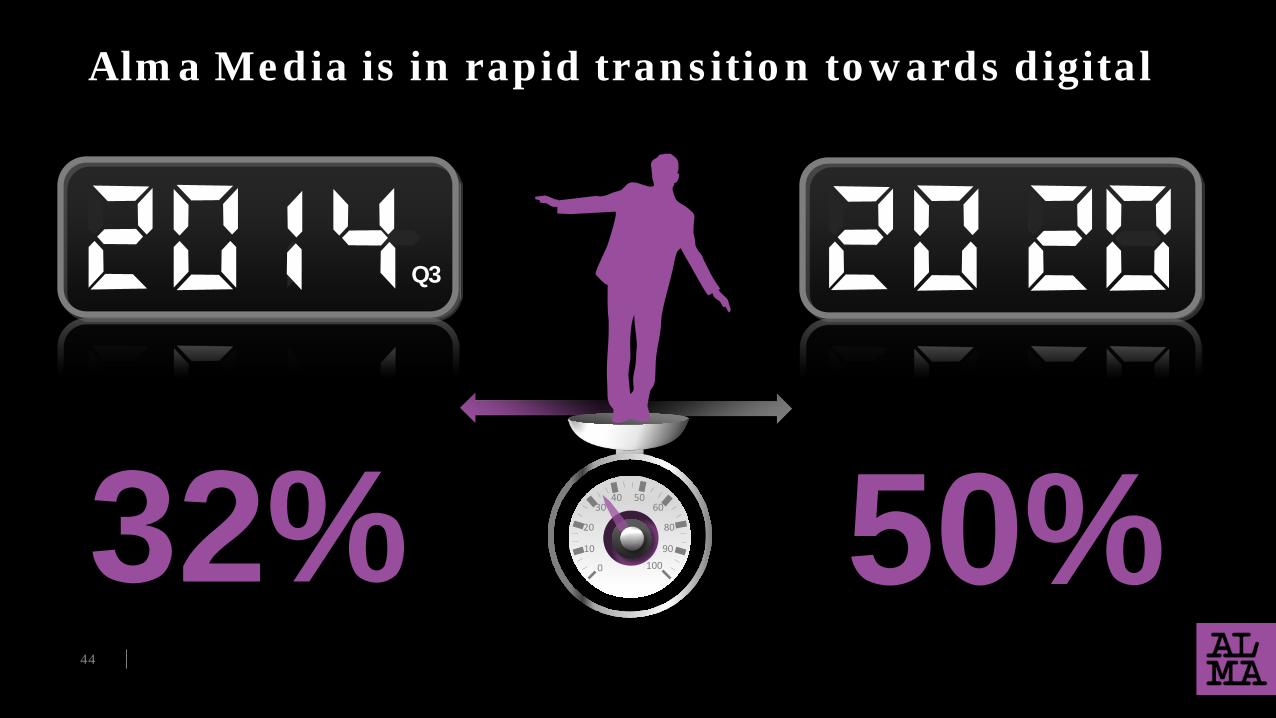
Alma Media is in rapid transition towards digital
0
10
20
30 40 50
60
80
90 100 32%
Q3
50%
Solid financial basis for growth Juha Nuutinen, CFO
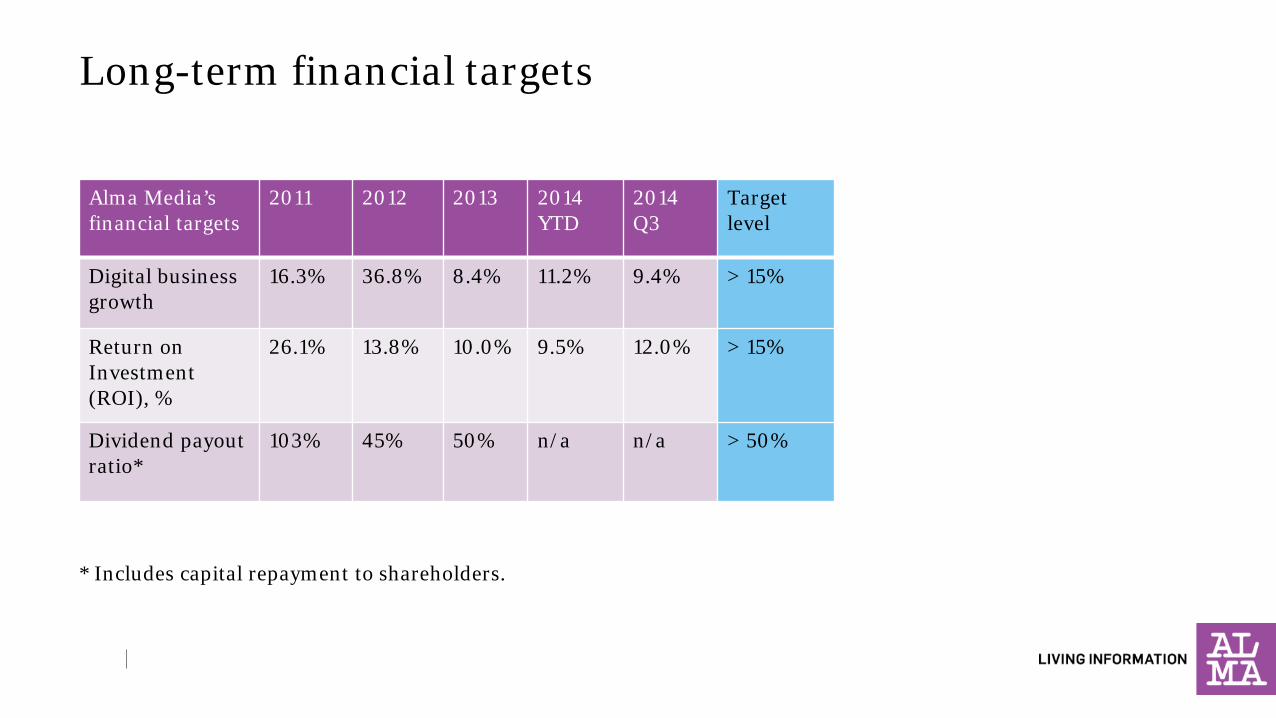
Long-term financial targets
* Includes capital repayment to shareholders.
Alma Media’s financial targets
2011 2012 2013 2014 YTD
2014 Q3
Target level
Digital business growth
16.3% 36.8% 8.4% 11.2% 9.4% > 15%
Return on Investment (ROI), %
26.1% 13.8% 10.0% 9.5% 12.0% > 15%
Dividend payout ratio*
103% 45% 50% n/a n/a > 50%
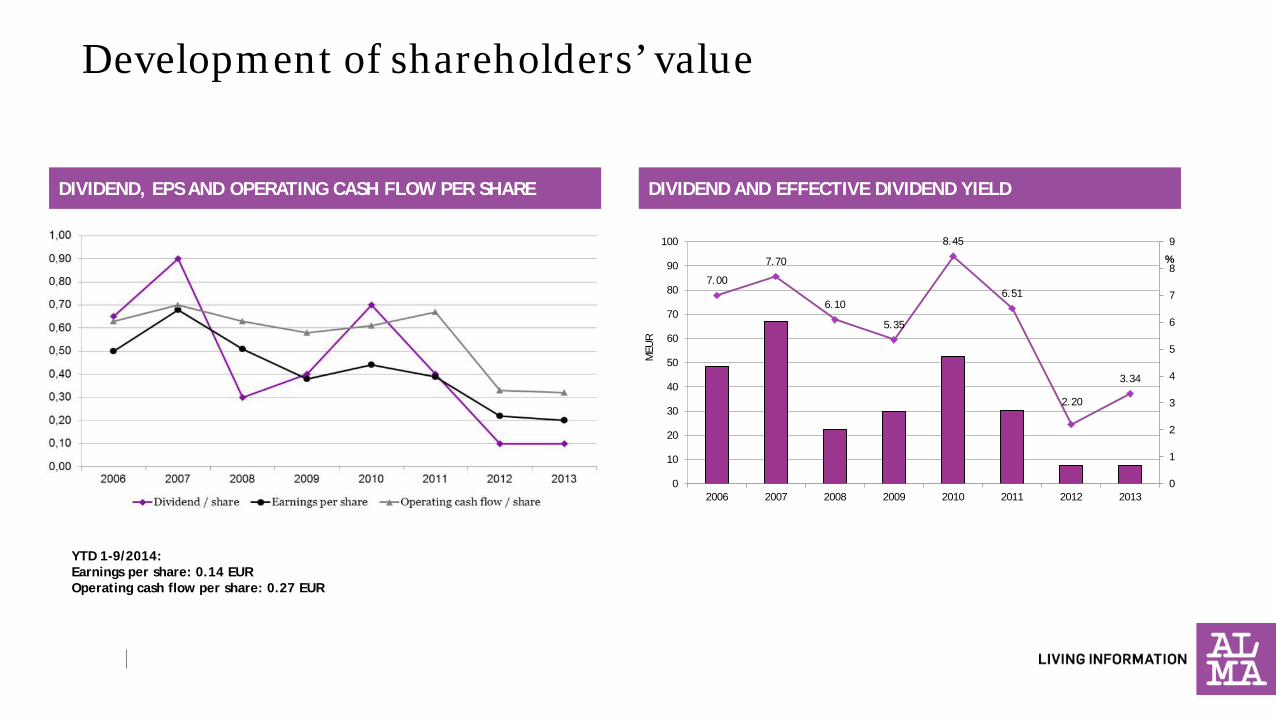
Development of shareholders’ value
7.00
7.70
6.10
5.35
8.45
6.51
2.20
3.34
0
1
2
3
4
5
6
7
8
9
0
10
20
30
40
50
60
70
80
90
100
2006 2007 2008 2009 2010 2011 2012 2013
%
MEU
R
DIVIDEND AND EFFECTIVE DIVIDEND YIELD
YTD 1-9/2014: Earnings per share: 0.14 EUR Operating cash flow per share: 0.27 EUR
DIVIDEND, EPS AND OPERATING CASH FLOW PER SHARE
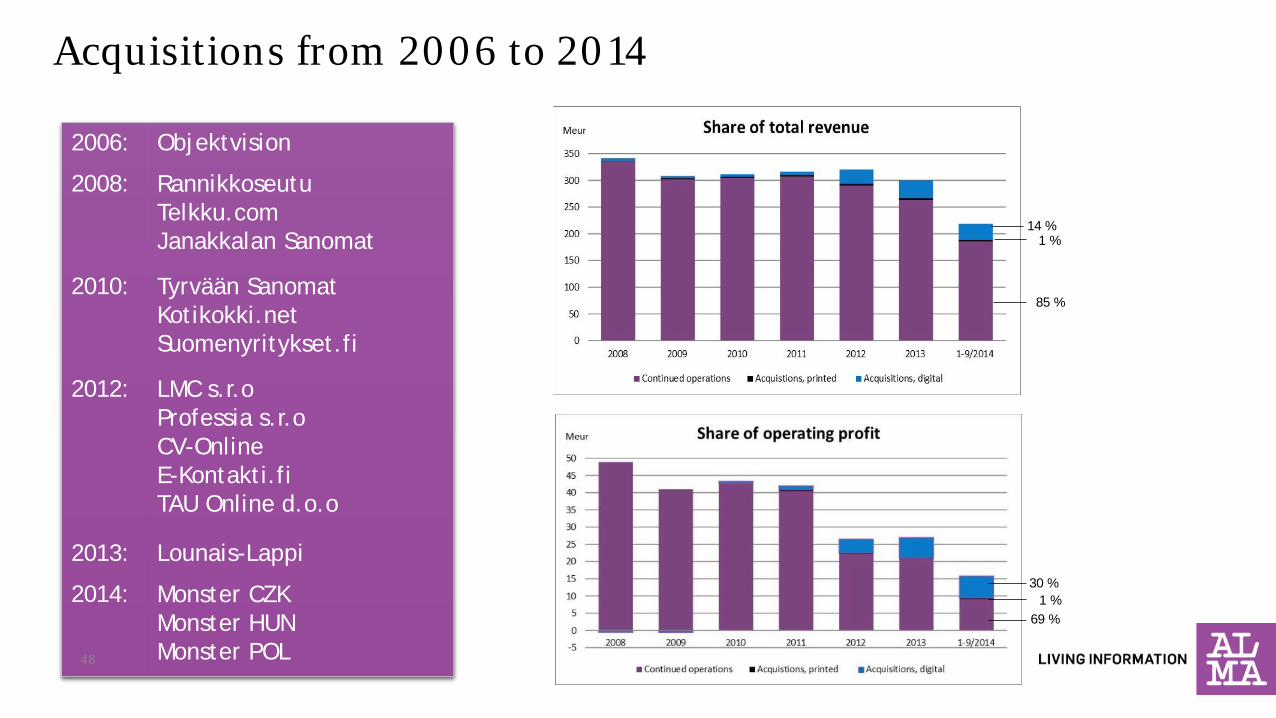
Acquisitions from 2006 to 2014
2006: Objektvision
2008: Rannikkoseutu Telkku.com Janakkalan Sanomat
2010: Tyrvään Sanomat Kotikokki.net Suomenyritykset.fi
2012: LMC s.r.o Professia s.r.o CV-Online E-Kontakti.fi TAU Online d.o.o
2013: Lounais-Lappi
2014: Monster CZK Monster HUN Monster POL
14 %
85 %
1 %
30 %
69 % 1 %
48
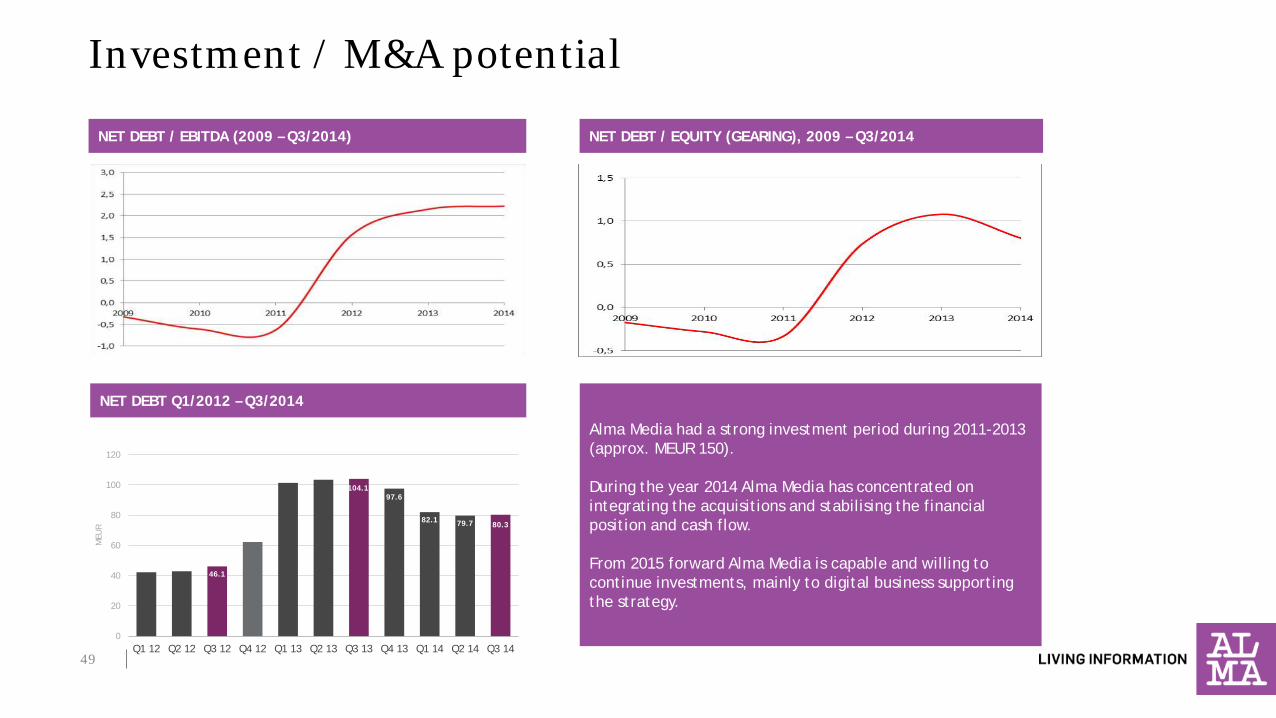
NET DEBT / EBITDA (2009 – Q3/2014) NET DEBT / EQUITY (GEARING), 2009 – Q3/2014
Alma Media had a strong investment period during 2011-2013 (approx. MEUR 150). During the year 2014 Alma Media has concentrated on integrating the acquisitions and stabilising the financial position and cash flow. From 2015 forward Alma Media is capable and willing to continue investments, mainly to digital business supporting the strategy.
Investment / M&A potential
46.1
104.197.6
82.1 79.7 80.3
0
20
40
60
80
100
120
Q1 12 Q2 12 Q3 12 Q4 12 Q1 13 Q2 13 Q3 13 Q4 13 Q1 14 Q2 14 Q3 14
MEU
R
NET DEBT Q1/2012 – Q3/2014
49
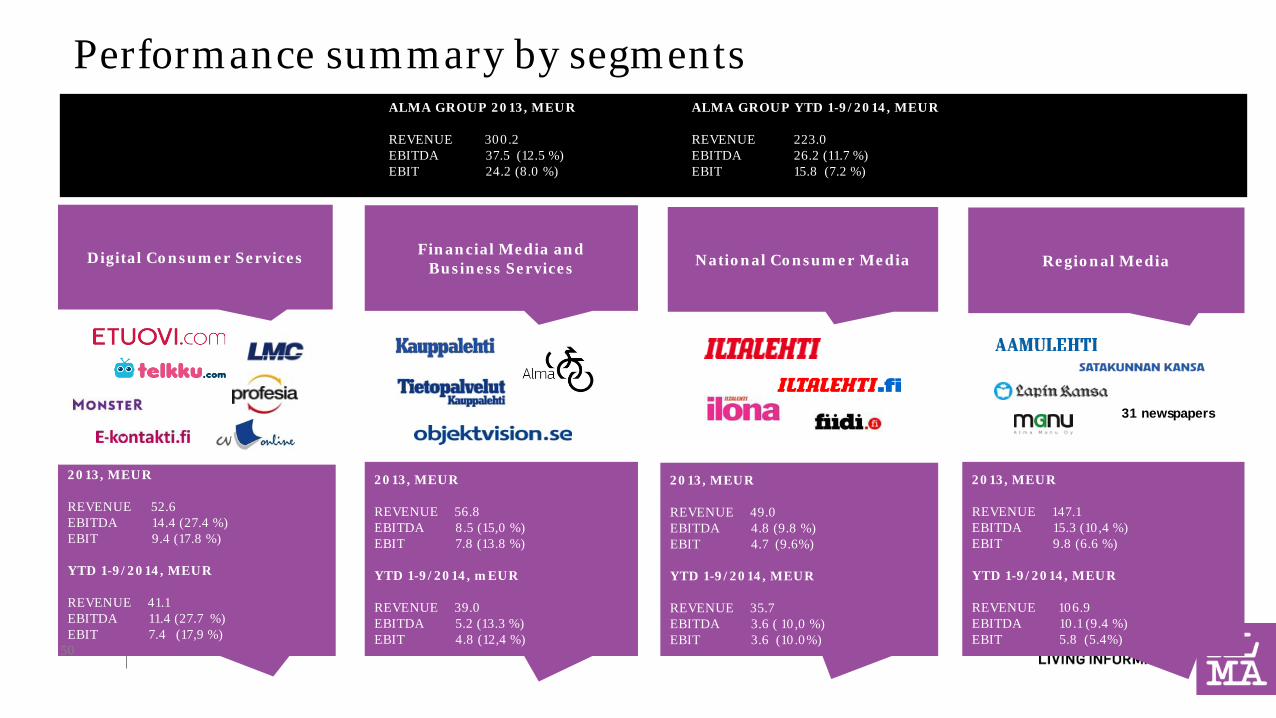
Performance summary by segments
Digital Consumer Services Financial Media and Business Services National Consumer Media
ALMA GROUP 2013, MEUR REVENUE 300.2 EBITDA 37.5 (12.5 %) EBIT 24.2 (8.0 %)
ALMA GROUP YTD 1-9/2014, MEUR REVENUE 223.0 EBITDA 26.2 (11.7 %) EBIT 15.8 (7.2 %)
2013, MEUR REVENUE 52.6 EBITDA 14.4 (27.4 %) EBIT 9.4 (17.8 %) YTD 1-9/2014, MEUR REVENUE 41.1 EBITDA 11.4 (27.7 %) EBIT 7.4 (17,9 %)
2013, MEUR REVENUE 56.8 EBITDA 8.5 (15,0 %) EBIT 7.8 (13.8 %) YTD 1-9/2014, mEUR REVENUE 39.0 EBITDA 5.2 (13.3 %) EBIT 4.8 (12,4 %)
2013, MEUR REVENUE 49.0 EBITDA 4.8 (9.8 %) EBIT 4.7 (9.6%) YTD 1-9/2014, MEUR REVENUE 35.7 EBITDA 3.6 ( 10,0 %) EBIT 3.6 (10.0%)
Regional Media
2013, MEUR REVENUE 147.1 EBITDA 15.3 (10,4 %) EBIT 9.8 (6.6 %) YTD 1-9/2014, MEUR REVENUE 106.9 EBITDA 10.1 (9.4 %) EBIT 5.8 (5.4%)
31 newspapers
50
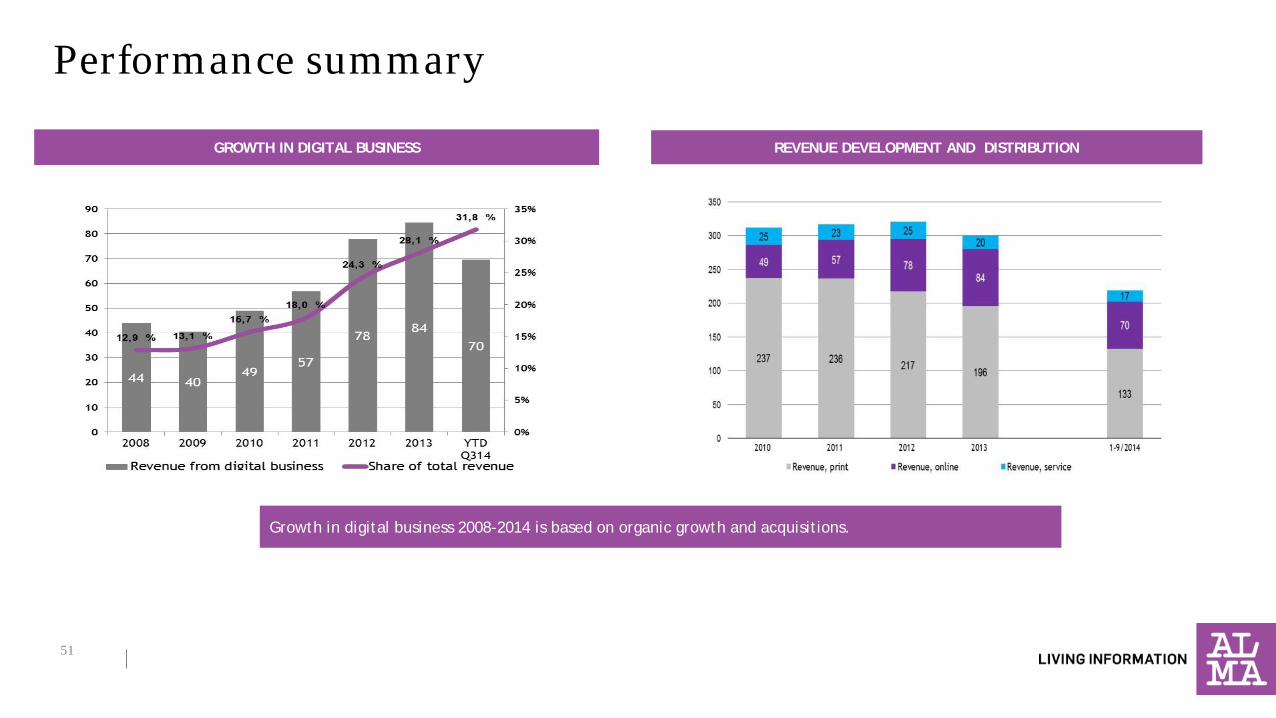
Performance summary
GROWTH IN DIGITAL BUSINESS REVENUE DEVELOPMENT AND DISTRIBUTION
Growth in digital business 2008-2014 is based on organic growth and acquisitions.
51

Thank you!