Embed Size (px)
Citation preview

Health Insurance Business –
India perspective
Healthcare Trends
Products
Penetration
Claims Analysis
Distribution Channels
Profitability
Sharad Mathur
Senior Vice President & Head – Agency, Digital & Alternate Channel
SBI General Insurance Company Limited
(A JV between State Bank of India & Insurance Australia Group)
11th Asia Conference on Healthcare & Health Insurance, Singapore

Healthcare expenditure expected to grow backed by macro drivers &
growing awareness
• India’s healthcare spending as a %
of GDP is lower than some of the
key economies
• Currently India’s healthcare is
predominantly through out of pocket
expenses
• The healthcare spends in India is
expected to grow at ~14% over the
next 5 year as per EIU projections
Trends in healthcare spending
• Large growing population with
changing lifestyle
• Advent of lifestyle related
diseases
• Increase in healthcare delivery
prices and introduction of
complex medical interventions
Macro drivers for healthcare
spends
• Increasingly insurance is being
adopted by the Indian retail segment
• There has been growing penetration of
rural mass market and BPL population
through Government sponsored
schemes
Coverage and awareness
3.10%4.0% 4.60% 4.00%
5.60%6.2%
8.90% 9.70%
0.0%
4.0%
8.0%
12.0%
Total expenditure on health as % of GDP India’s comparison with key countries
Source: World Bank database, WHO database

Growing contribution of health insurance to GI market is supported by
increasing volumes & prices of health insurance
Expected Growth in total premium of Health
Insurance in billion USD
Source: IRDAI, Industry Discussions
Contribution of Health in overall GI industry
Premium
Volume
Pricing
Health insurance
penetration backed by
shift in disease pattern,
higher awareness
Growth in “Addressable
population”
1
Healthcare inflation will
lead to cost of insurance
Detariffication impact –
elimination of cross
subsidies and continued
upward revision of health
premiums
Low priced policies will
attract large volumes of
low income consumers
2
5
6
7
Government push for
greater coverage
3
Access to multiple
channels including digital
4 18% 21% 24% 25% 28% 25% 25% 22% 25%
82% 79% 76% 75% 72% 75% 75% 78% 75%
0%
10%
20%
30%
40%
50%
60%
70%
80%
90%
100%
FY07 FY08 FY09 FY10 FY11 FY12 FY13 FY14 FY15
Health Other GI
2.50 2.83
3.33
4.00
4.67
5.50
6.33
7.50
-
1.00
2.00
3.00
4.00
5.00
6.00
7.00
8.00
FY13 FY14 FY15 FY16 FY17 FY18 FY19 FY20
Expected CAGR = 17%

Cu
sto
me
r M
ix
• Retail : ~37%, Group: ~51%, Govt: ~12%
• Mass market focus Focusing on increasing retail business
• Retail : ~35%, Group: ~48%, Govt: ~17%
• Focus on younger customers with better income profile
Focus on Retail and government business
• Retail : ~73%, Group: ~22%, Govt: ~ 5% • Strong technical capabilities while starting
operations Huge focus on retail and profitable group business
Pro
du
ct • Low priced products especially in the
group segment Significant focus on right pricing (Group + retail)
• Profitable products • Offers a basket of products with high
risk products being priced better Profitability focus through innovative products
• Innovative products with focus on wellness and wider coverage
Develop integrated care model as scale of medical partner improves
Ch
ann
el • Large branch presence
• Well developed agent base
• High focus on the bancassurance channel
• Aggressively developing alternate channels (online/telemarketing)
Focus on Bancassurance channel as a key channel
• Limited branch presence • Focus on agency channel • Shifting focus towards alternate channels
(online, telemarketing) Focus on Agency and direct channel
Op
era
tio
ns
• Claims management outsourced to TPAs
• Plan to enhance control over claims management by setting up a new TPA, promoted by the four PSUs
Insourcing health claims management
• In-house claims management (e.g. ICICI Lombard, Bajaj Allianz), stake in a TPA (e.g. Reliance)
Captive claims administration for superior service
• In-house / captive claims management
In the current market, three broad segments of insurers exist which have
varying strategies
PSU insurers Multi Line private players Pure Play health insurers
Source: IRDAI, Industry discussions

Health Products Composition - Existing
17% 12%
5% 14%
48%
51%
22%
47%
12% 9%
48%
13%
23% 28% 25% 26%
0%
10%
20%
30%
40%
50%
60%
70%
80%
90%
100%
Pvt Insurers Public Insurers Stand Alone Health
Grand Total
Individual Ins excluding Family/Floater Product
Family/Floater Ins excluding Individual Product
Group Ins excluding Govt. sponsored Schemes
Govt sponsored Health Schemes

Health Products linked to Customer Buying Behavior/ Segments
Retail Corporate
and SME
Central and
State Governments
Customer
Segments
• Indemnity products - Individual or
family floater
• Benefits : predominantly
hospitalization expenses
• Fixed benefit products - hospital
daily allowance or critical illness
• Exclusions: OPD, GPs,
pharmacies, etc.
• Typical loss ratios of 60% - 68%
• Single policy covering all
members
• Higher restrictions compared to
retail individual policies
• Sold across corporates; however
limited purchase by small
enterprises
• Typical loss ratios of 75% - 135%
• Low sum insured products
• Simple hospitalization cashless
covers with per member price
between US$ 5 – US$ 15
• Typical family floater sum
assured limited to US$ 1550 –
US$ 4500
• Typical loss ratios of 80% - 120%
Product Features
• Needs to be actively sold the
product
• High loyalty to agent /
intermediary
• Recent grievances data shows
increasing ‘mis-trust’ of health
insurers
• Highly price –sensitive market
• High bargaining power of client
• Uses either broker or direct route
• Increasing migration to self-
insurance
• Large state wise or district wise
contracts
• Not intermediated
• Bids based on combination of
technical and commercial scores
Customer Buying Behavior

Product Innovation - Approach
Customer centric innovation:
• Short-Term Medical Plans
• Accident, cancer & critical illness coverage
• Prescription insurance and discount
• Dental insurance and discount
• Vision insurance
• Health & wellness programs
• Lifestyle discounts
Ideation:
• Identify unique & unmet customer needs
• Define customer segment-specific plans
• Develop the operational capabilities to
effectively deliver these plans (services)
• Monitor and learn from them
How do we innovate on services?
• Ease of sale – right products for the right channel
• Simpler & effective underwriting
• Policy wordings adapted for local market with illustrations
• Ease of claims submission with fast assessment
• Identification of trusted hospitals
• Sharing of information on fraud
• Better communication with customers
Innovation has to be collaborative &
effective:

Two types of innovation — sustainable & disruptive:
• Sustainable innovation takes something that exists today & makes it better. Insurance
product features may be added or fine-tuned, processes streamlined or distribution
channels expanded upon. There is tremendous value in consistent, targeted change that
occurs over time.
• Disruptive innovation is a game changer, something that completely alters the way an
industry operates. Four examples of insurance industry disruptors that have occurred in
recent years include:
– predictive analytics
– usage-based insurance (UBI)
– insurance-linked securitization
– micro-insurance
Product Innovation – Approach Continued..

Health Protection Gap/ Penetration – Indian Scenario
Only 288 mn (22.2%) are covered by health insurance, of which 214 mn are insured by government schemes, 48 mn are covered by group insurance, while 25 mn use individual or family floater plans
Health protection gap is big in India. Gap is projected to rise by 12.3 % annually to $214 bn by 2020
Government & society ‘ll ‘ve to spend more in the future to make up for the growing demand for healthcare services due to higher income growth & a large population
out-of-pock-et expenses account for 60% of the total healthcare expenditure, with a very minor contribution from private insurance plans
With emerging middle class estimated to grow 10-fold from 50 mn at present to 475 mn by 2030, the demand for quality health-care & speed to access services will be greater
Increased consumer awareness along with easier access to healthcare are essential to drive penetration & double health insurance coverage in India by 2020
Health protection gap is the difference between the level of health-care costs, versus the amount that is
available to cover those costs. If total healthcare expenditure remained a constant % of GDP, the country
is likely to face a shortfall in health-care financing of around $43 bn in 2020. This will require additional
spending or higher out-of-pocket funding by individuals

Health Claims Analysis – Male & Female Demography
Male Age Band Highest Claim
Frequency Age Band
2nd Highest Claim
Frequency Age Band
3rd Highest Claim
Frequency
Infectious 1-5 years 0.915% 6-15 years 0.704% 25-36 years 0.52%
Clinical Findings Above 70 years 0.762% 1-5 years 0.758% 61-65 years 0.51%
Digestive 66 - 70 years 0.574% Above 70 years 0.544% 61-65 years 0.48%
Injury Above 70 years 0.335% 66 - 70 years 0.330% 26-35 years 0.31%
Urology 66 - 70 years 0.993% Above 70 years 0.827% 61-65 years 0.77%
Circulatory 66 - 70 years 1.910% Above 70 years 1.219% 61-65 years 0.93%
Female Age Band Highest Claim
Frequency Age Band
2nd Highest Claim
Frequency Age Band
3rd Highest Claim
Frequency
Pregnancy 26-35 years 0.95% 16-25 years 0.36% 36-45 years 0.17%
Infectious Above 1-5 years 0.94% 26-35 years 0.79% 16-25 years 0.72%
Clinical Findings 1-5 years 0.81% Above 70 years 0.64% 61-65 years 0.55%
Urology 66-70 years 0.80% 61-65 years 0.78% 56-60 years 0.59%
Digestive 66-70 years 0.48% 61-65 years 0.46% 26-35 years 0.42%
Eye 66-70 years 1.73% 61-65 years 1.42% Above 70
years 1.32%
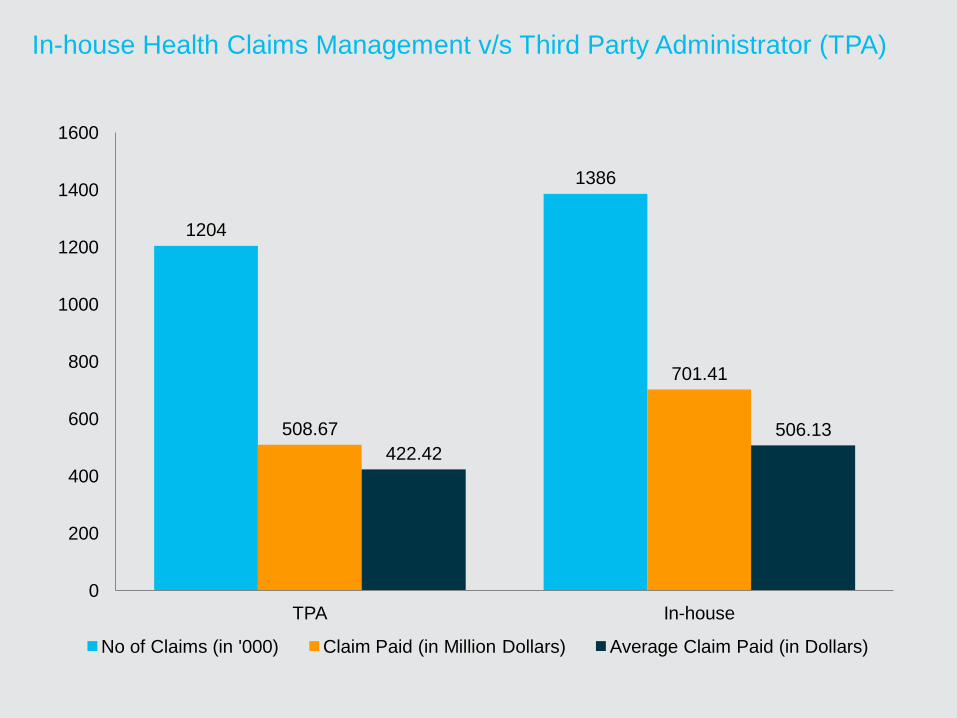
In-house Health Claims Management v/s Third Party Administrator (TPA)
1204
1386
508.67
701.41
422.42
506.13
0
200
400
600
800
1000
1200
1400
1600
TPA In-house
No of Claims (in '000) Claim Paid (in Million Dollars) Average Claim Paid (in Dollars)

Preventive Health Care Approach – Spreading awareness
Limit your salt intake
Don't load up on high protein foods such as meat & steaks
Keep your blood pressure at 130/80 or lower
Keep your blood sugar below 120 mg/dl
Drink 8 glasses of water a day
Watch your intake of pain relievers & other drugs
Be careful with tests & procedures using contrast dyes
Don't drink too much Vitamin C
Don't rely on food supplements to protect your kidneys
Get a kidney check-up
Example: 10 ways to protect your Kidney…

Distribution Mix - Channel wise contribution in health insurance
Health indeminity
(Top Up, HNI) 87%
Hospi Cash & CI
13%
Health Products Share

The profitability of the Health insurance industry - gradually improving
Standalone health insurers seem to have lower claims ratios, showing better pricing
► Net Claims Ratio for the PSU
insurers exceeded 100% largely
due to group health policies
► Since Jan 2007, post-
detariffication, health premiums
have been increasing faster
than the rest of the non-life
insurance markets
Group Segment
► Historically unprofitable segment
► Claims Ratio’s exceed 100% due
to uncompetitive premium rates
and waiver of key policy
exclusions
► Although, claims ratios are more
favorable
► Effective claims management,
strong underwriting and efficient
distribution could lead to lower
claims and distribution expenses
► Individual business can be written
more profitably
Individual Segment Premiums and Claims
Source: IRDAI Annual report and Journals
Claims ratios

Source: Company annual reports
Performance of a 5 years old Standalone Health Insurer - showing
gradual move towards profitability
Financial Performance of one of the Key Standalone Health Insurers (Figures in million USD)
-14.67 -10.17 -4.33 -9.50 -3.67 -13.17 -7.83 -1.67 -6.00 -1.00
62.33
76.67
85.67
93.83 100.33
-
20.00
40.00
60.00
80.00
100.00
120.00
-16.00
-14.00
-12.00
-10.00
-8.00
-6.00
-4.00
-2.00
-
FY11 FY12 FY13 FY14 FY15
Technical Result PBT Capital Infusion