Embed Size (px)
Citation preview
certified by experience
© 2013 ProLeiT AG
Line Management Systems
for filling and packaging plants
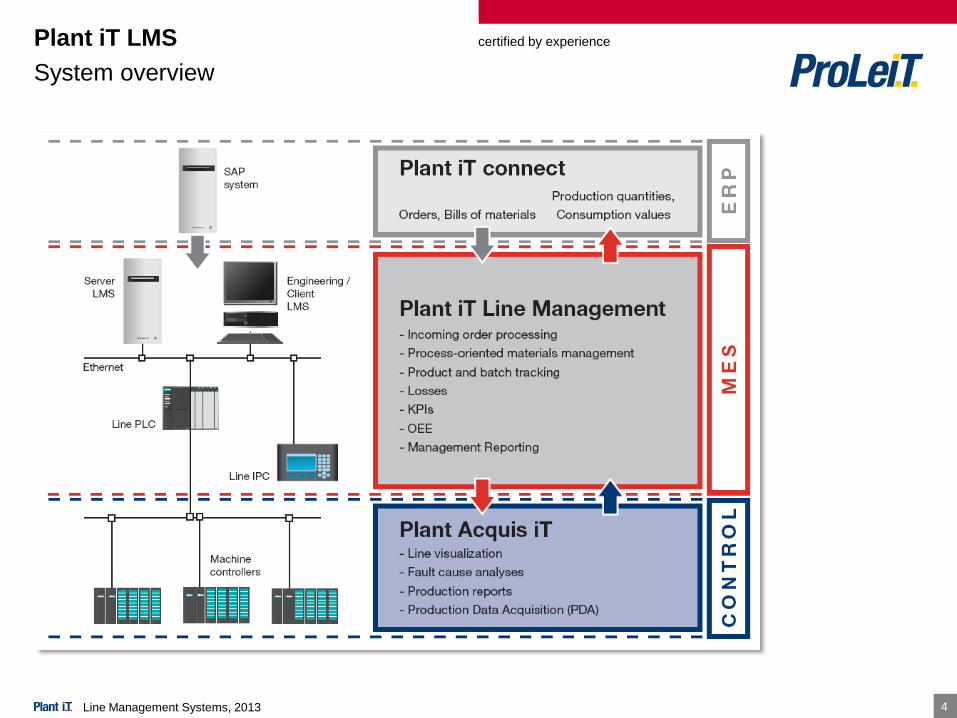
Plant iT LMS
certified by experience
2
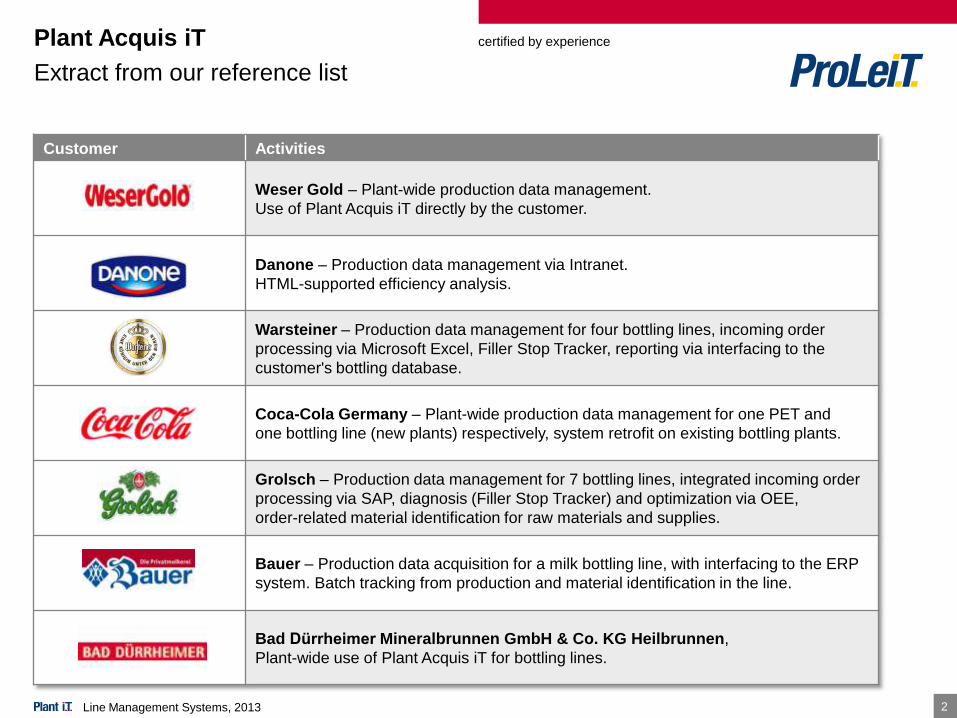
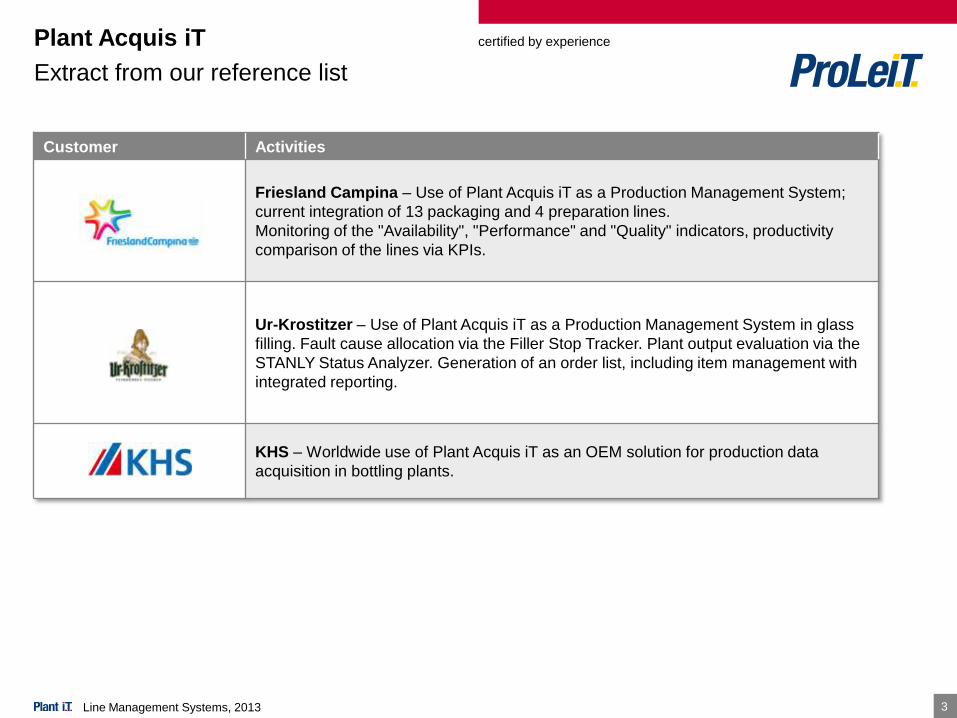
Plant Acquis iT
Extract from our reference list
Customer Activities
Weser Gold – Plant-wide production data management.
Use of Plant Acquis iT directly by the customer.
Danone – Production data management via Intranet.
HTML-supported efficiency analysis.
Warsteiner – Production data management for four bottling lines, incoming order
processing via Microsoft Excel, Filler Stop Tracker, reporting via interfacing to the
customer's bottling database.
Coca-Cola Germany – Plant-wide production data management for one PET and
one bottling line (new plants) respectively, system retrofit on existing bottling plants.
Grolsch – Production data management for 7 bottling lines, integrated incoming order
processing via SAP, diagnosis (Filler Stop Tracker) and optimization via OEE,
order-related material identification for raw materials and supplies.
Bauer – Production data acquisition for a milk bottling line, with interfacing to the ERP
system. Batch tracking from production and material identification in the line.
Bad Dürrheimer Mineralbrunnen GmbH & Co. KG Heilbrunnen,
Plant-wide use of Plant Acquis iT for bottling lines.
Line Management Systems, 2013
certified by experience
3
Plant Acquis iT
Extract from our reference list
Customer Activities
Friesland Campina – Use of Plant Acquis iT as a Production Management System;
current integration of 13 packaging and 4 preparation lines.
Monitoring of the "Availability", "Performance" and "Quality" indicators, productivity
comparison of the lines via KPIs.
Ur-Krostitzer – Use of Plant Acquis iT as a Production Management System in glass
filling. Fault cause allocation via the Filler Stop Tracker. Plant output evaluation via the
STANLY Status Analyzer. Generation of an order list, including item management with
integrated reporting.
KHS – Worldwide use of Plant Acquis iT as an OEM solution for production data
acquisition in bottling plants.
Line Management Systems, 2013
certified by experience
4
Plant iT LMS
System overview
Line Management Systems, 2013
certified by experience
55
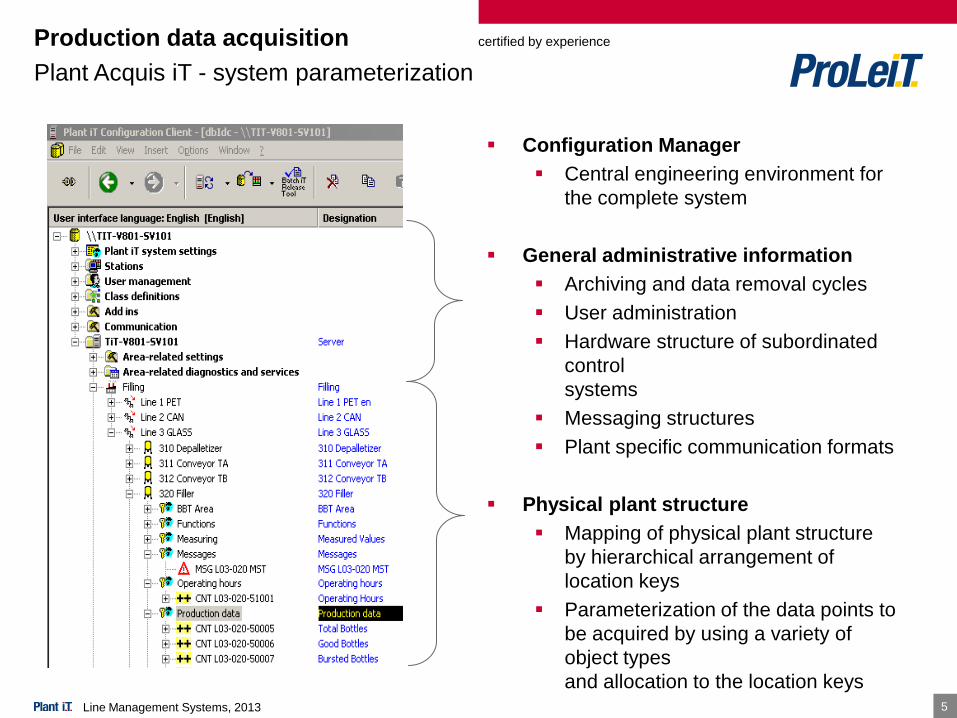
Production data acquisition
Plant Acquis iT - system parameterization
Configuration Manager
Central engineering environment for
the complete system
General administrative information
Archiving and data removal cycles
User administration
Hardware structure of subordinated
control
systems
Messaging structures
Plant specific communication formats
Physical plant structure
Mapping of physical plant structure
by hierarchical arrangement of
location keys
Parameterization of the data points to
be acquired by using a variety of
object types
and allocation to the location keysLine Management Systems, 2013
certified by experience
6
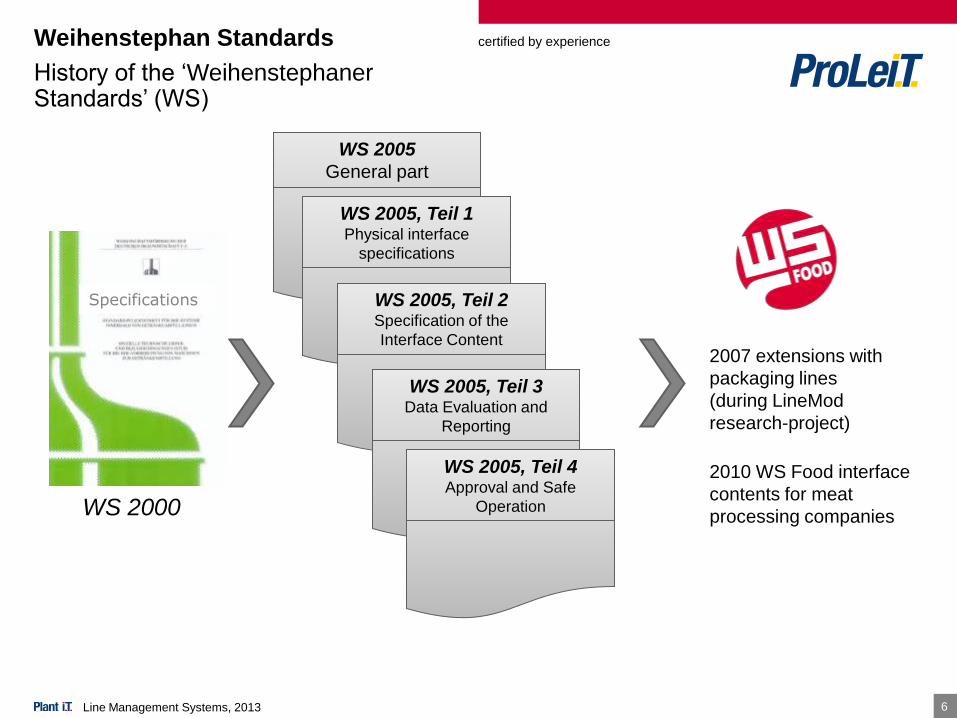
Weihenstephan Standards
History of the ‘WeihenstephanerStandards’ (WS)
WS 2005
General part
WS 2005, Teil 1Physical interface
specifications
WS 2005, Teil 2Specification of the
Interface Content
WS 2005, Teil 3Data Evaluation and
Reporting
WS 2005, Teil 4Approval and Safe
OperationWS 2000
Specifications
Line Management Systems, 2013
2007 extensions with
packaging lines
(during LineMod
research-project)
2010 WS Food interface
contents for meat
processing companies
certified by experience
7
Weihenstephan Standards
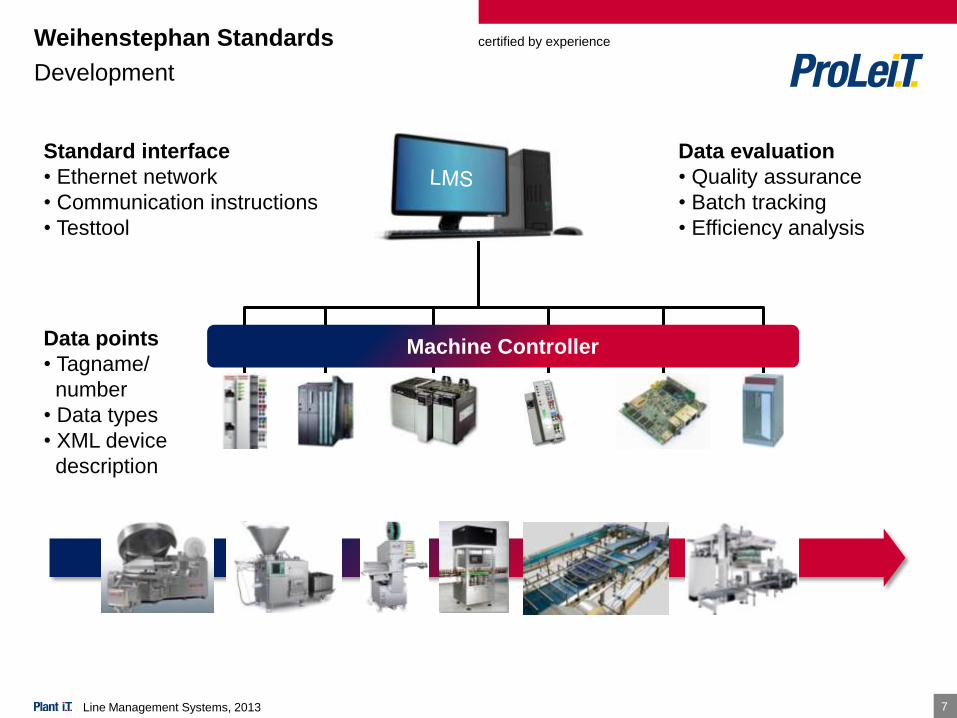
Development
Food Production/Bottling Lines, Packaging
Standard interface
• Ethernet network
• Communication instructions
• Testtool
Data evaluation
• Quality assurance
• Batch tracking
• Efficiency analysis
Data points
• Tagname/
number
• Data types
• XML device
description
Machine Controller
Line Management Systems, 2013
certified by experience
88
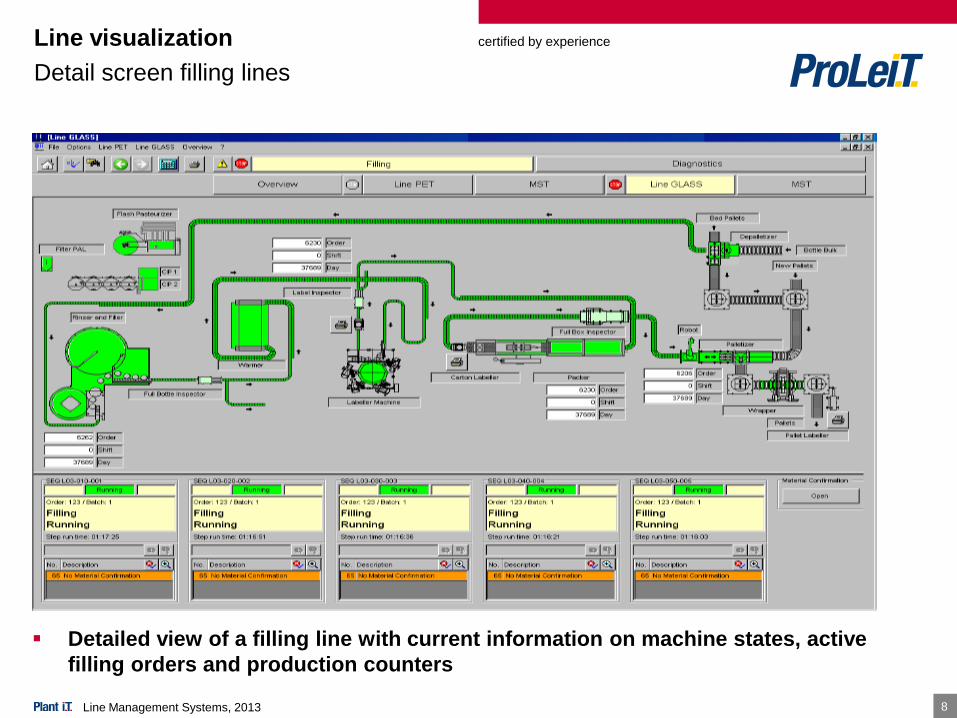
Detailed view of a filling line with current information on machine states, active
filling orders and production counters
Line visualization
Detail screen filling lines
Line Management Systems, 2013
certified by experience
99
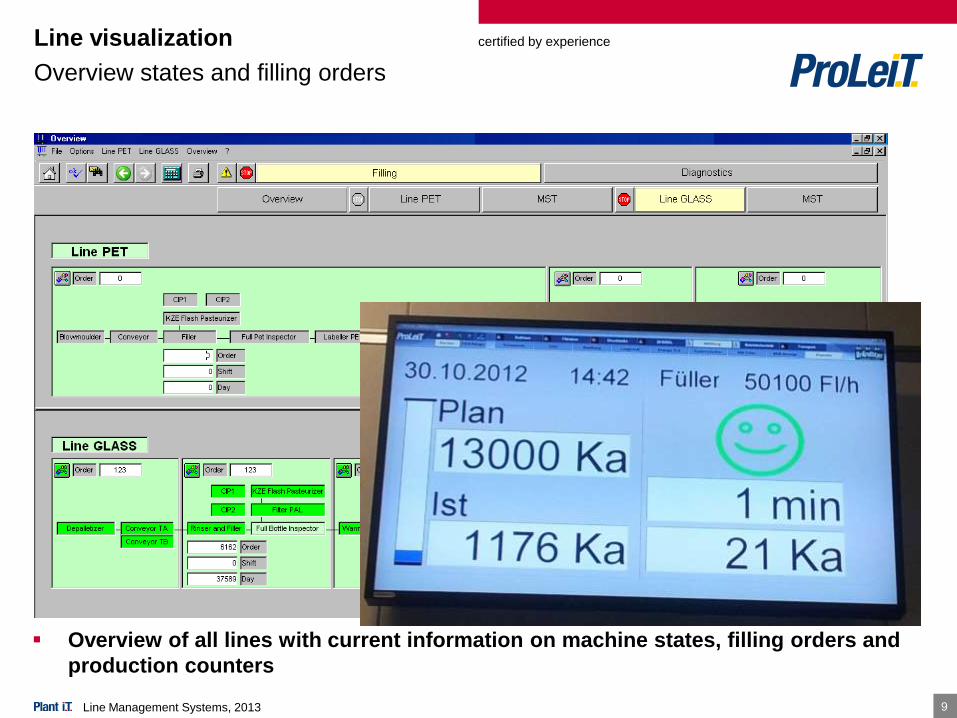
Overview of all lines with current information on machine states, filling orders and
production counters
Line visualization
Overview states and filling orders
Line Management Systems, 2013
certified by experience
10
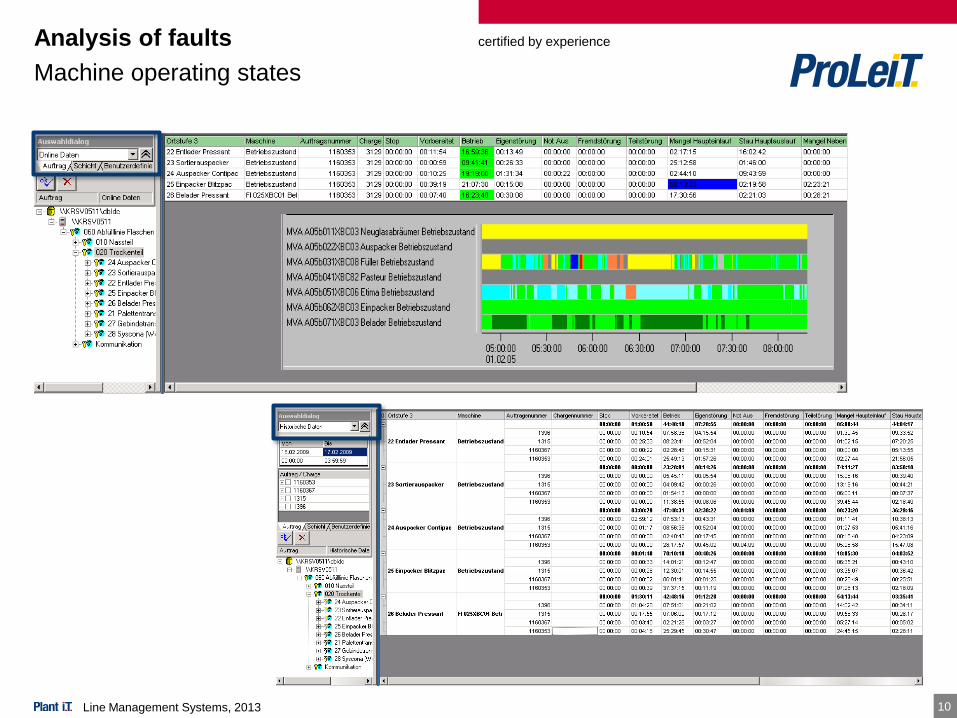
Analysis of faults
Machine operating states
Line Management Systems, 2013
certified by experience
11
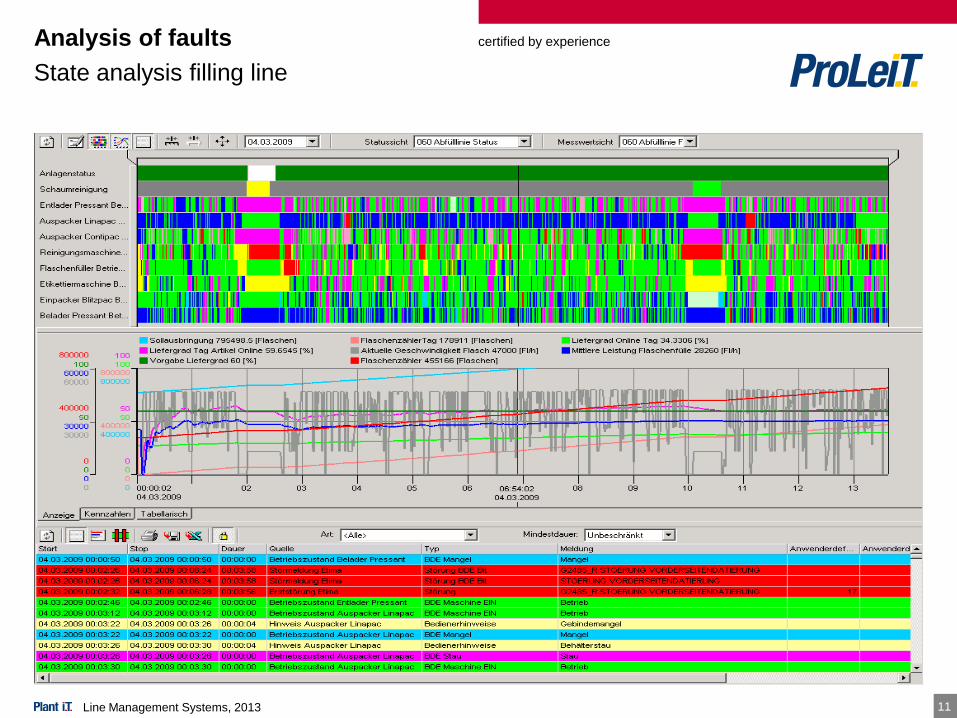
Analysis of faults
State analysis filling line
Line Management Systems, 2013
certified by experience
12
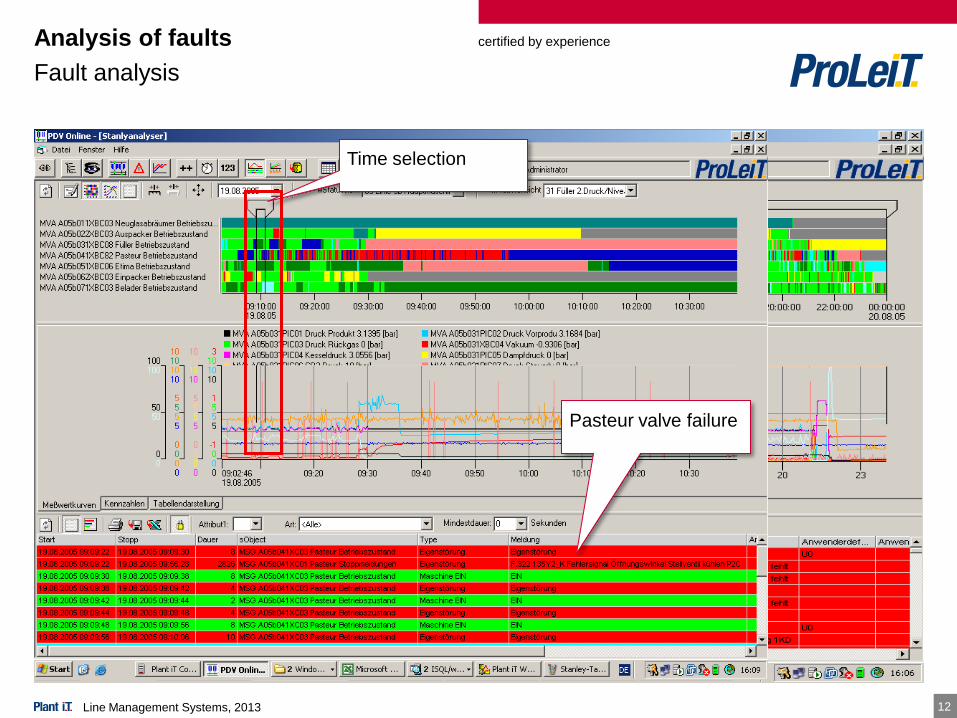
Analysis of faults
Fault analysis
full day
restrict time range
Pasteur valve failure
Time selection
Line Management Systems, 2013
certified by experience
13
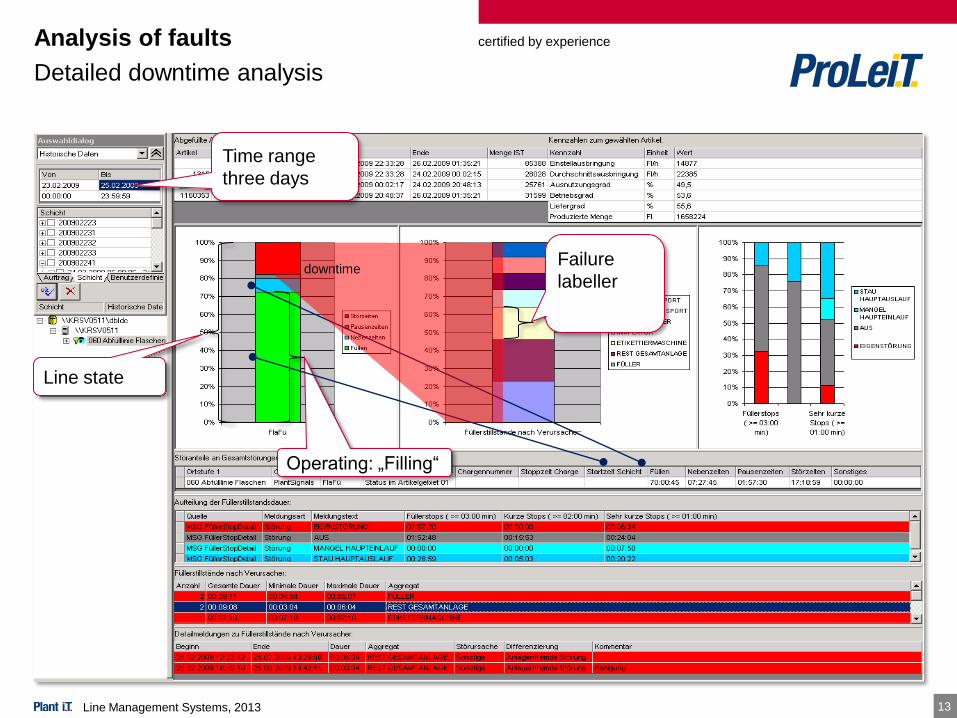
Analysis of faults
Detailed downtime analysis
Time range
three days
Line state
Operating: „Filling“
Failure
labellerdowntime
Line Management Systems, 2013
certified by experience
14
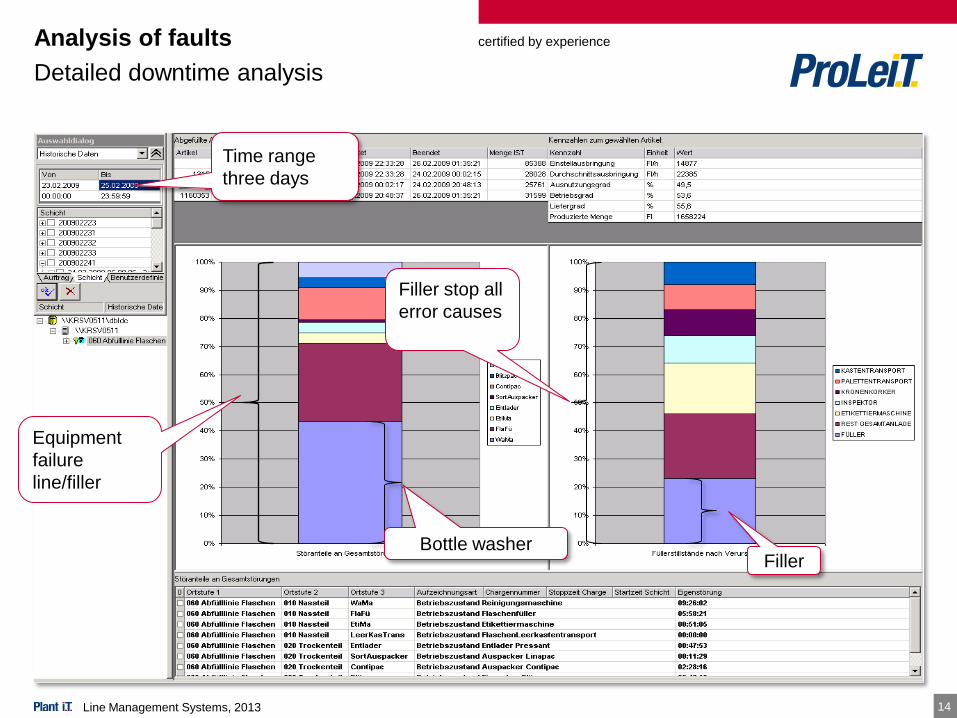
Analysis of faults
Detailed downtime analysis
Equipment
failure
line/filler
Bottle washer
Filler stop all
error causes
Filler
Time range
three days
Line Management Systems, 2013
certified by experience
1515
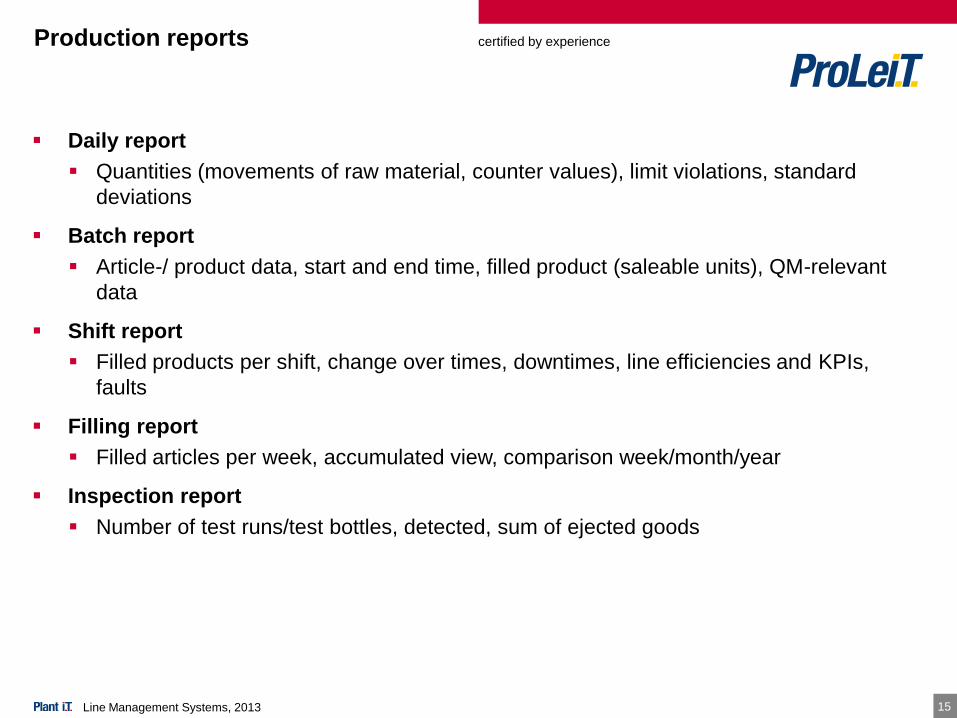
Production reports
Daily report
Quantities (movements of raw material, counter values), limit violations, standard
deviations
Batch report
Article-/ product data, start and end time, filled product (saleable units), QM-relevant
data
Shift report
Filled products per shift, change over times, downtimes, line efficiencies and KPIs,
faults
Filling report
Filled articles per week, accumulated view, comparison week/month/year
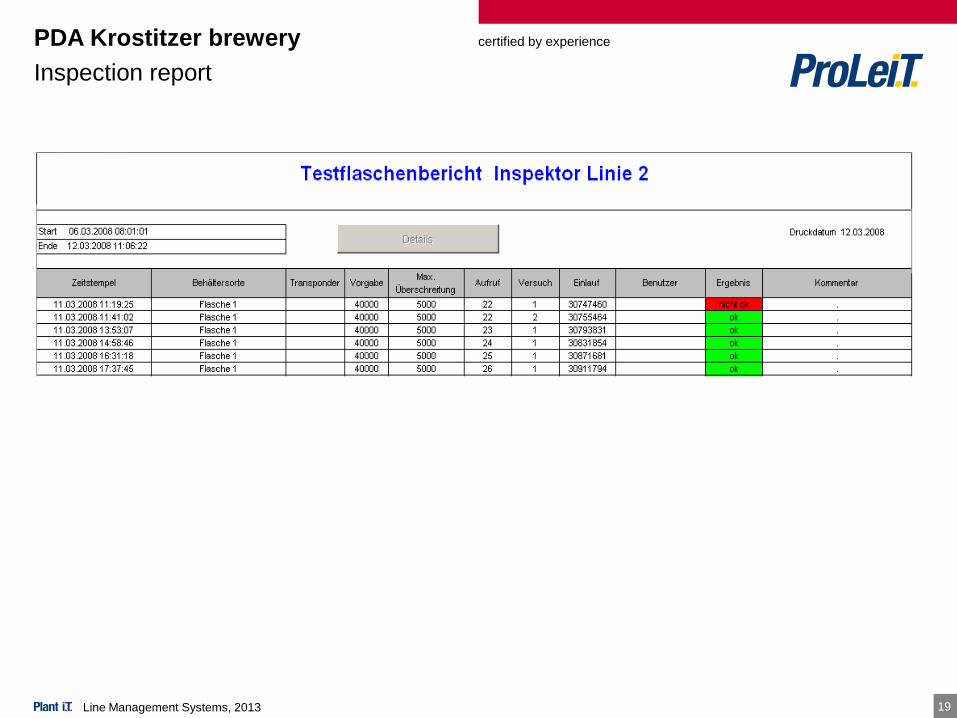
Inspection report
Number of test runs/test bottles, detected, sum of ejected goods
Line Management Systems, 2013
certified by experience
16
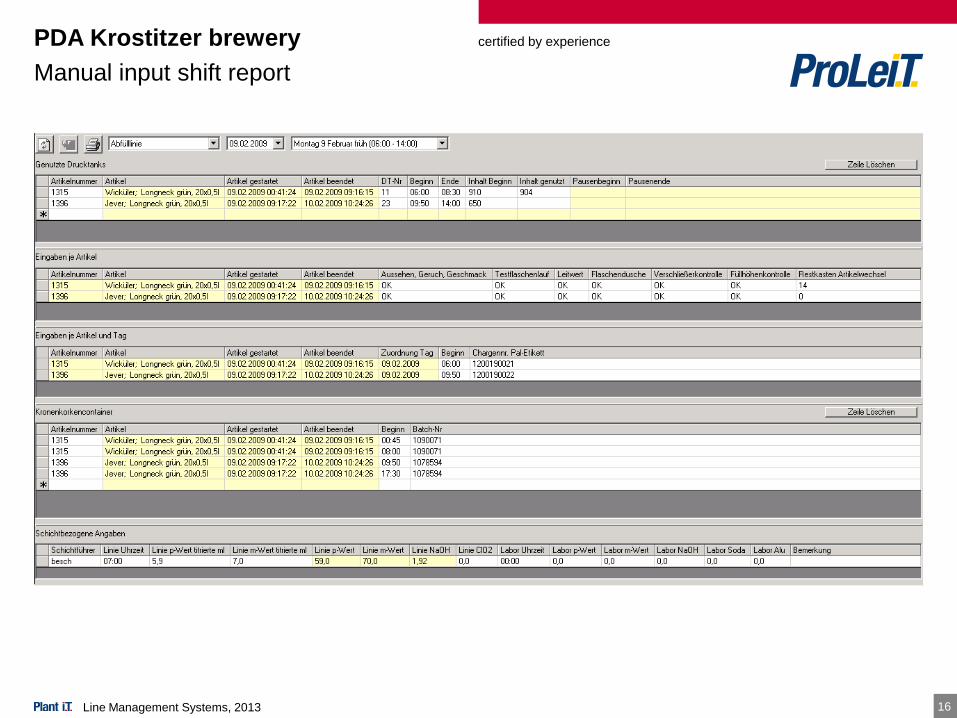
PDA Krostitzer brewery
Manual input shift report
Line Management Systems, 2013
certified by experience
17
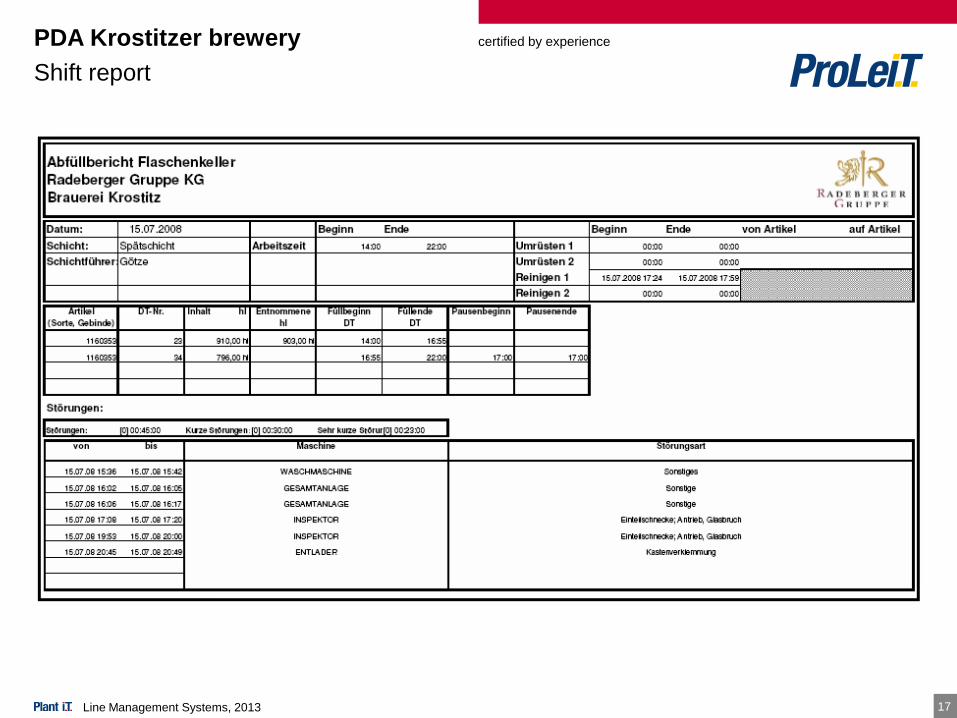
PDA Krostitzer brewery
Shift report
Line Management Systems, 2013
certified by experience
18
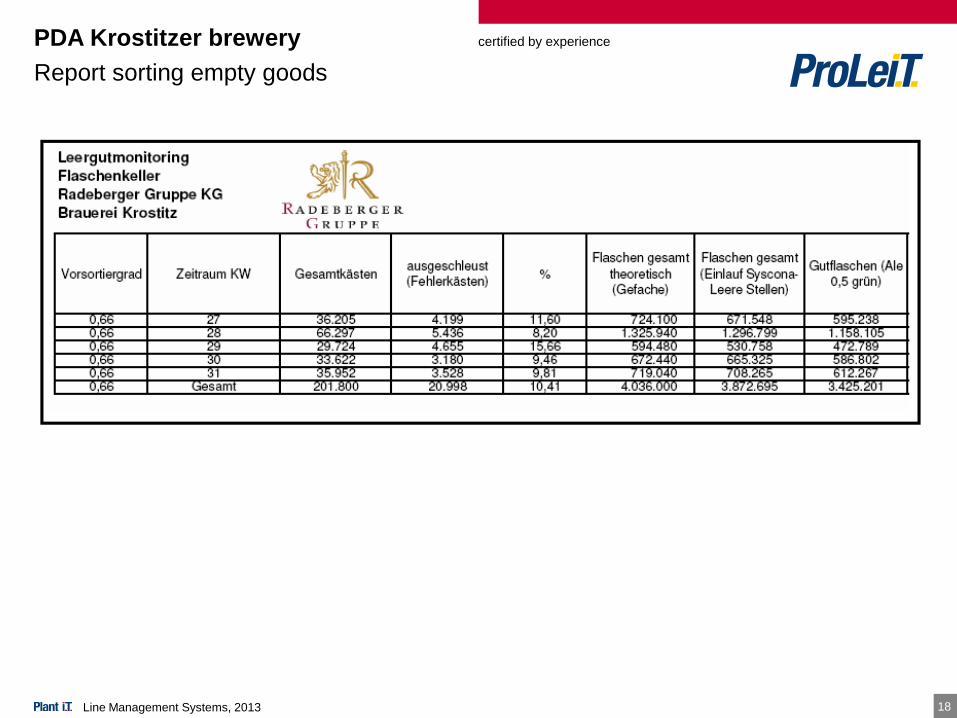
PDA Krostitzer brewery
Report sorting empty goods
Line Management Systems, 2013
certified by experience
19
PDA Krostitzer brewery
Inspection report
Line Management Systems, 2013
certified by experience
2020
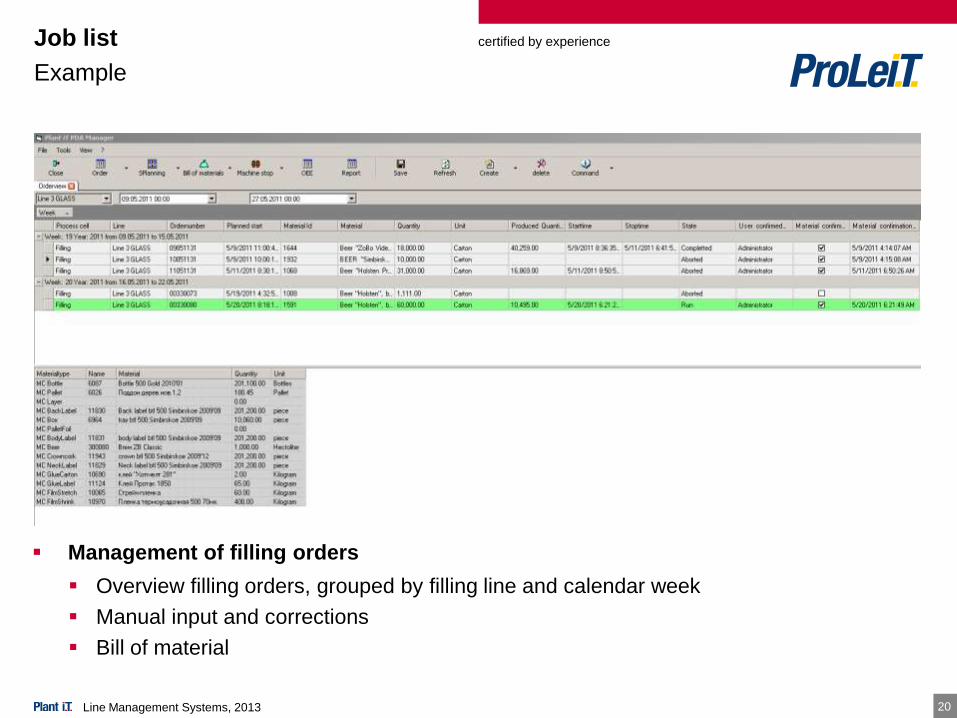
Management of filling orders
Overview filling orders, grouped by filling line and calendar week
Manual input and corrections
Bill of material
Job list
Example
Line Management Systems, 2013
certified by experience
2121
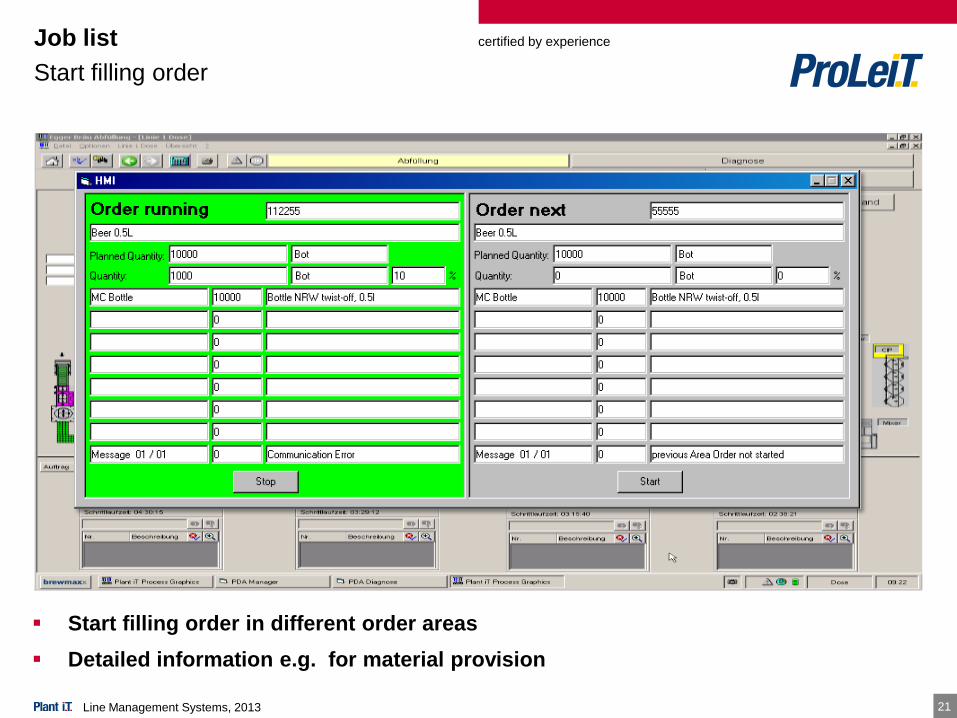
Start filling order in different order areas
Detailed information e.g. for material provision
Job list
Start filling order
Line Management Systems, 2013
certified by experience
2222
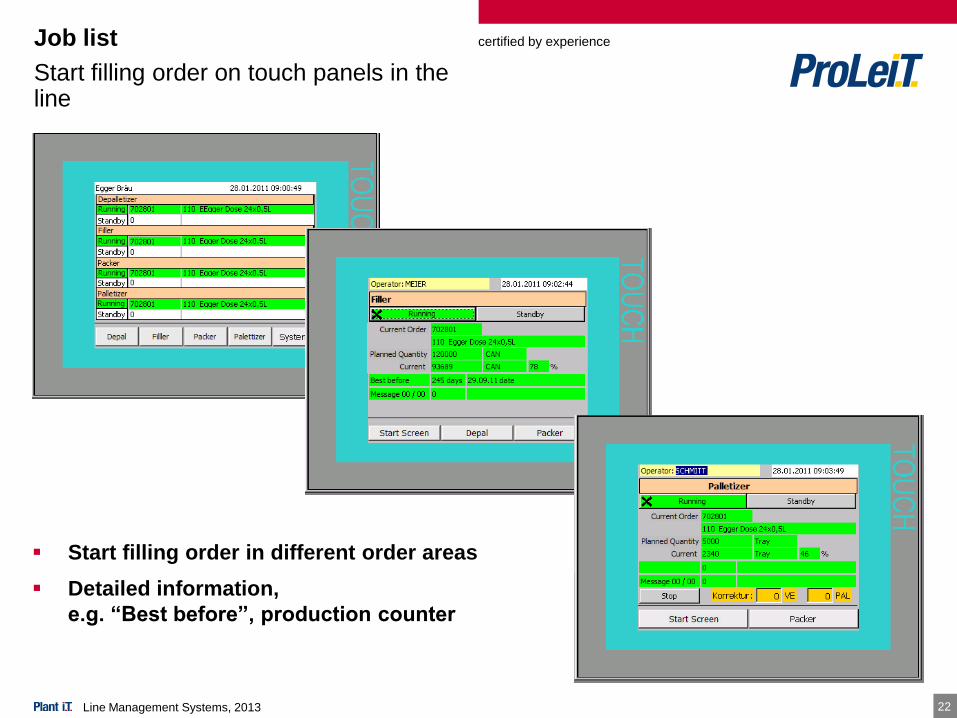
Start filling order in different order areas
Detailed information,
e.g. “Best before”, production counter
Job list
Start filling order on touch panels in the line
Line Management Systems, 2013
certified by experience
2323
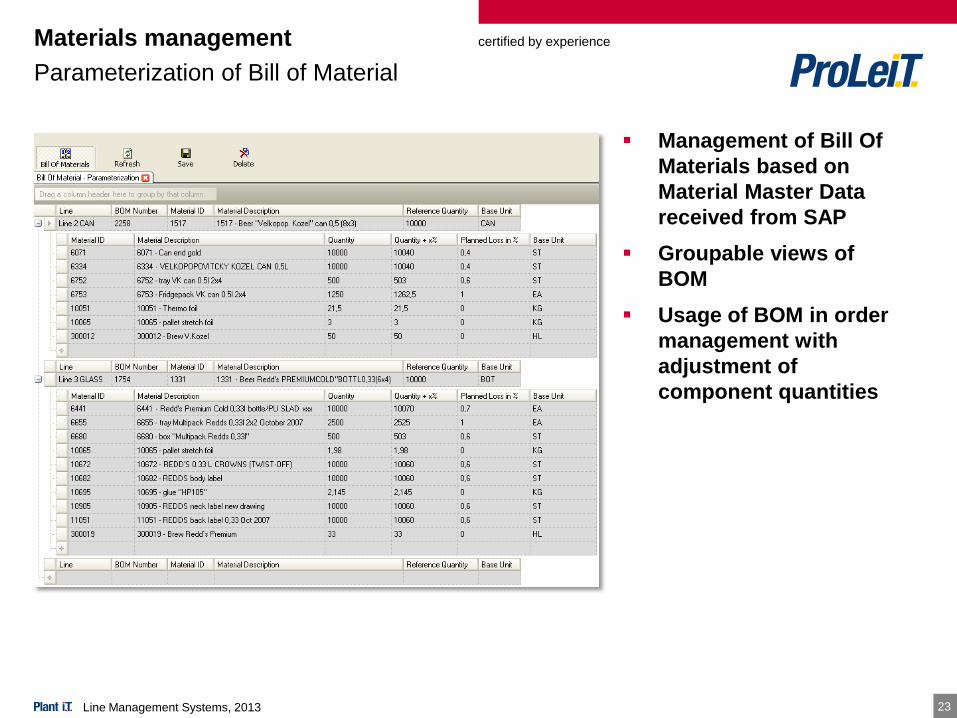
Management of Bill Of
Materials based on
Material Master Data
received from SAP
Groupable views of
BOM
Usage of BOM in order
management with
adjustment of
component quantities
Materials management
Parameterization of Bill of Material
Line Management Systems, 2013
certified by experience
2424
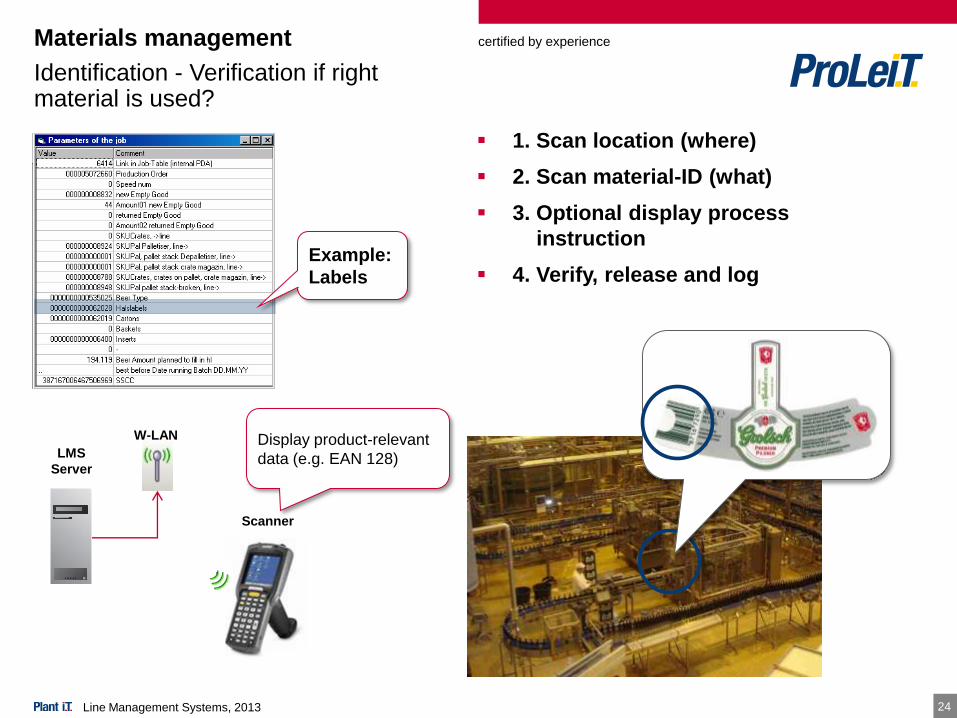
1. Scan location (where)
2. Scan material-ID (what)
3. Optional display process
instruction
4. Verify, release and log
Materials management
Identification - Verification if right material is used?
Example:
Labels
W-LAN
Scanner
Display product-relevant
data (e.g. EAN 128) LMS
Server
Line Management Systems, 2013
certified by experience
2525
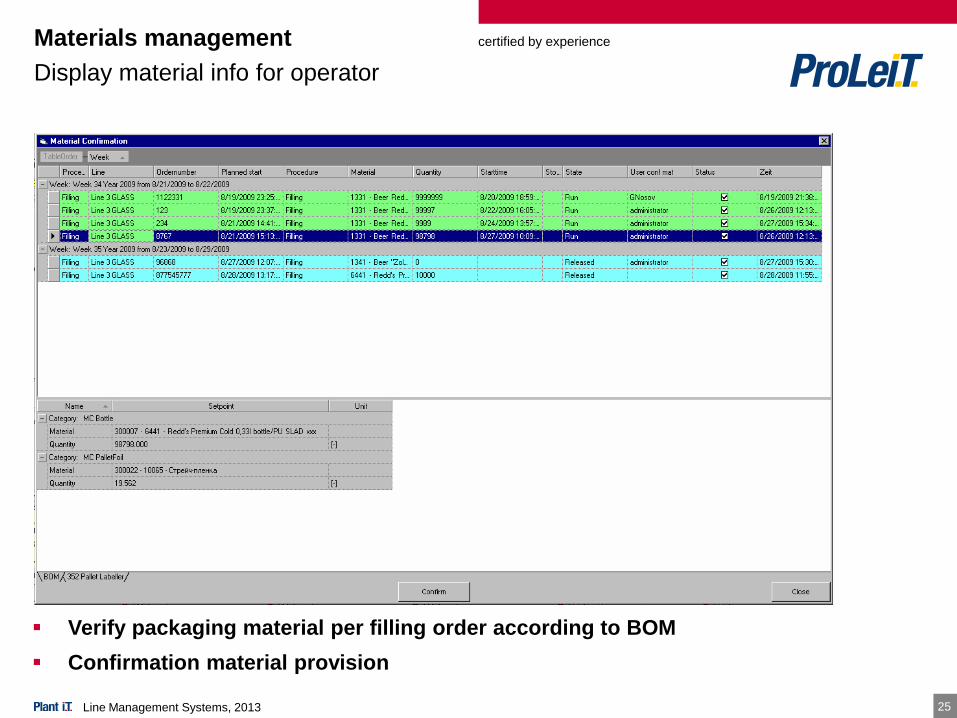
Materials management
Verify packaging material per filling order according to BOM
Confirmation material provision
Display material info for operator
Line Management Systems, 2013
certified by experience
2626
Machine-Stop-Tracker
OEE = Overall Equipment Effectiveness
OEE is a method to understand and improve the behaviour of a process by
evaluation of production stops
Basic OEE formula:
OEE = Availability rate x Performance rate x Quality rate
Process of OEE data evaluation
Define production times in the shift planning
Evaluation of heartbeat signals of the main machine to identify production stops
Assignment of error source and error cause to production stops by manual input in the
Machine Stop Tracker tool
User input of rework amounts as well as changeover timing in the dashboard overview
Store information in the database to calculate OEE rates
Establish statistical OEE – reports and analyses with the web based reporting tool,
order related view of OEE rates in the dashboard overview
OEE
Line Management Systems, 2013
certified by experience
27
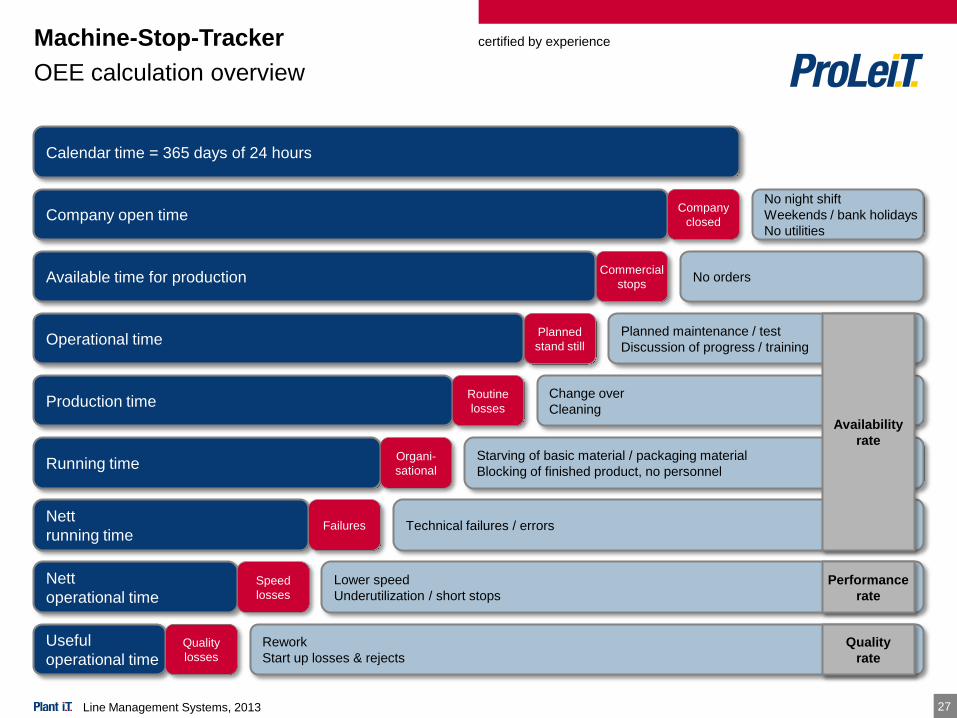
Machine-Stop-Tracker
OEE calculation overview
Line Management Systems, 2013
Calendar time = 365 days of 24 hours
Company open time
Available time for production
Operational time
Production time
Running time
Nett
running time
Nett
operational time
Useful
operational time
Commercial
stops
Company
closed
Planned
stand still
Routine
losses
Organi-
sational
Failures
Speed
losses
Quality
losses
Rework
Start up losses & rejects
Lower speed
Underutilization / short stops
Technical failures / errors
Starving of basic material / packaging material
Blocking of finished product, no personnel
Change over
Cleaning
Planned maintenance / test
Discussion of progress / training
No orders
No night shift
Weekends / bank holidays
No utilities
Availability
rate
Performance
rate
Quality
rate
certified by experience
28
Machine-Stop-Tracker
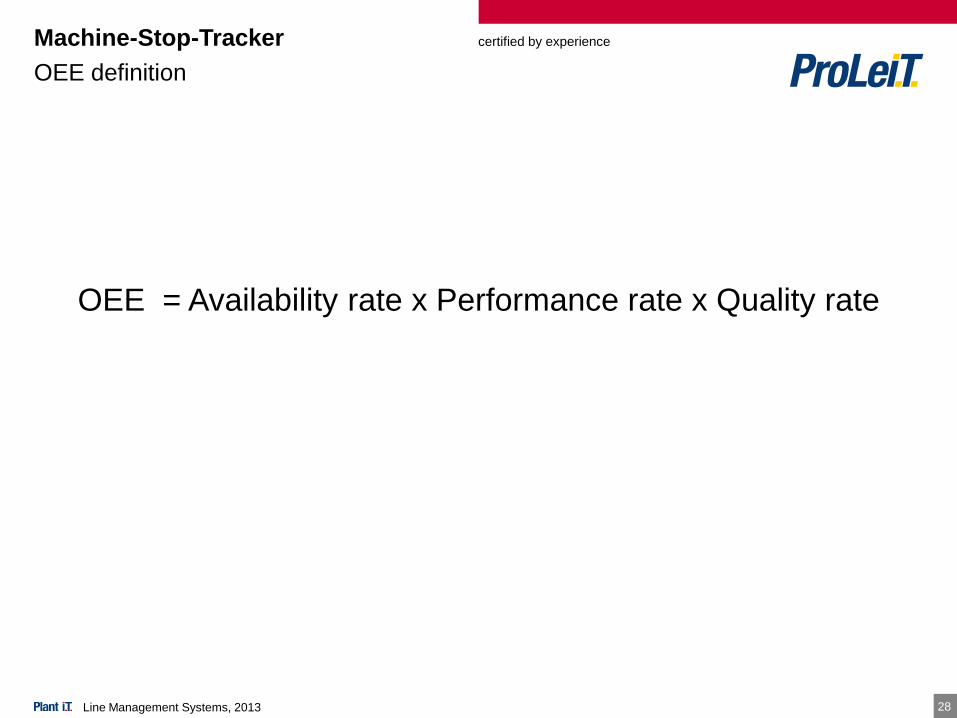
OEE definition
OEE = Availability rate x Performance rate x Quality rate
Line Management Systems, 2013
certified by experience
29
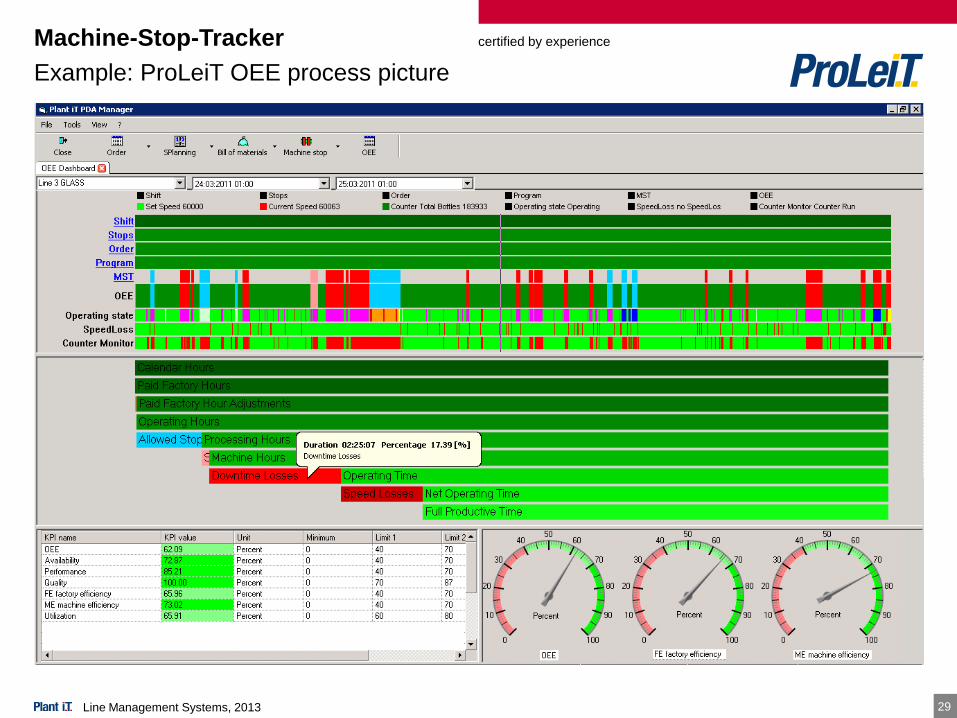
Machine-Stop-Tracker
Example: ProLeiT OEE process picture
OEE = Availability rate x Performance rate x Quality rate
Line Management Systems, 2013
certified by experience
3030
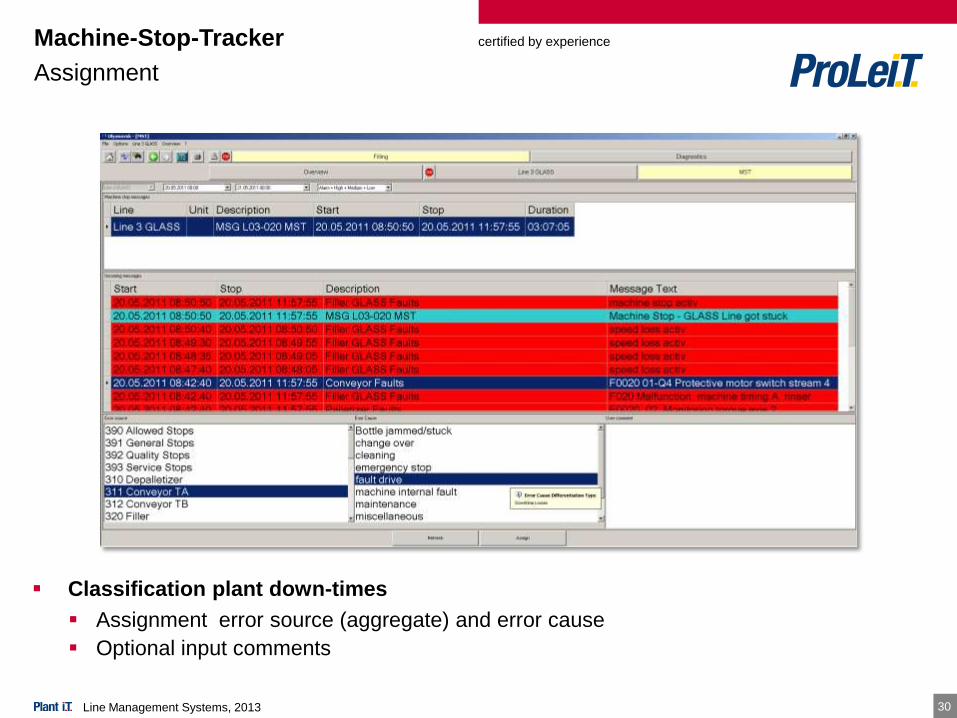
Classification plant down-times
Assignment error source (aggregate) and error cause
Optional input comments
Machine-Stop-Tracker
Assignment
Line Management Systems, 2013
certified by experience
31
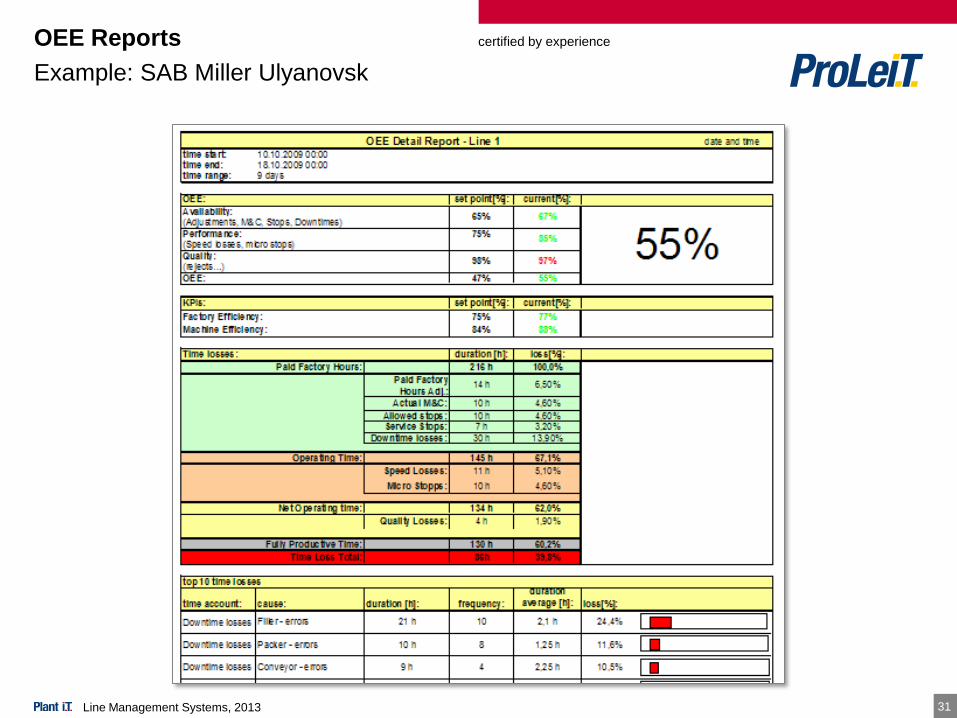
OEE Reports
Example: SAB Miller Ulyanovsk
Line Management Systems, 2013
certified by experience
3232
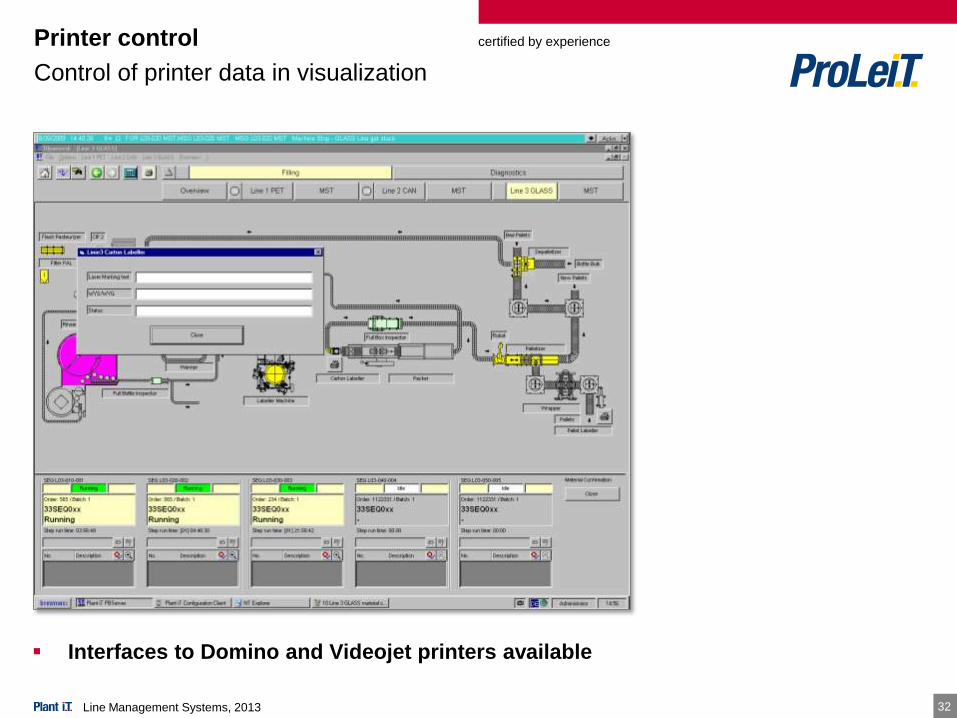
Interfaces to Domino and Videojet printers available
Printer control
Control of printer data in visualization
Line Management Systems, 2013
certified by experience
33
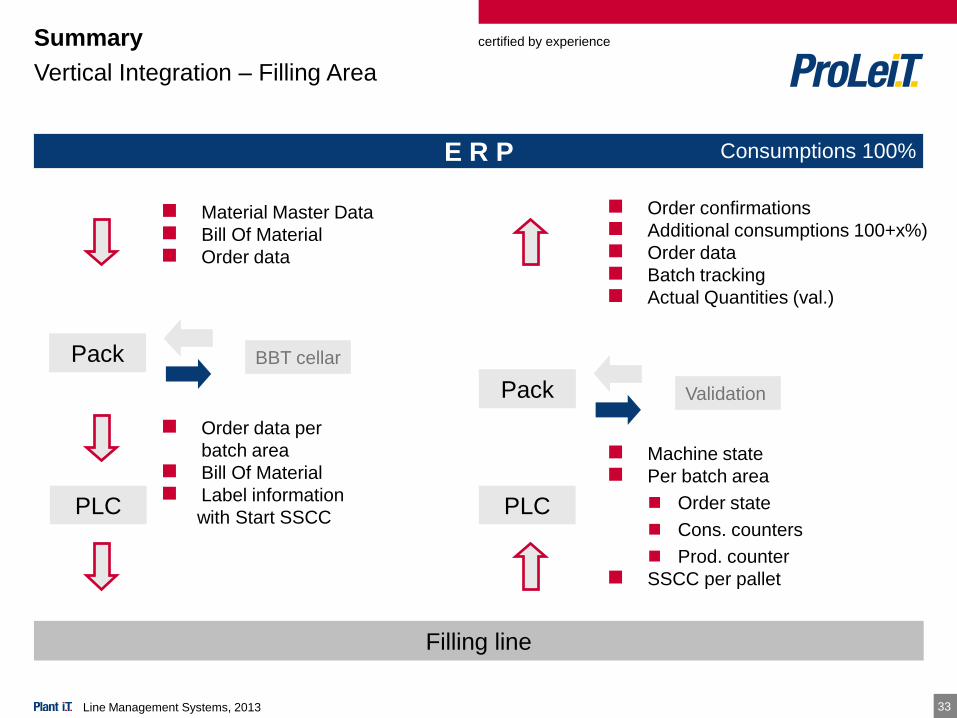
Summary
Vertical Integration – Filling Area
E R P
Filling line
Consumptions 100%
Order data per
batch area
Bill Of Material
Label information
with Start SSCCPLC
BBT cellar
Material Master Data
Bill Of Material
Order data
Pack
Order confirmations
Additional consumptions 100+x%)
Order data
Batch tracking
Actual Quantities (val.)
Machine state
Per batch area
Order state
Cons. counters
Prod. counter
SSCC per pallet
Validation Pack
PLC
Line Management Systems, 2013
certified by experience
ProLeiT AG
Einsteinstr. 8
91074 Herzogenaurach
Germany
Phone +49 91 32 777 0
Fax +49 91 32 777 150
E-Mail [email protected]
Internet www.proleit.com
ProLeiT Group
Enschede/NL – Exton/US –
Kiev/UA – Mexico City/MX –
Moscow/RU – Piracicaba/BR –
Seville/ES – Shanghai /CN –
Vienna/AT
Line Management Systems, 2013