Embed Size (px)
Citation preview

Dale PhenicieCouncil of Great Lakes Industries
1
Applying Water Stewardship Tools in North American Industry

Study Sponsors
• Great Lakes Protection Fund (GLPF)
• Council of Great Lakes Industries (CGLI)
• National Council for Air and Stream Improvement (NCASI)
• Electric Power Research Institute (EPRI)
• LimnoTech (LTI)
2

Why is Industry Interested?
• Heightened focus on water
• Many water tools
• Concern that tools might become de facto regulation
• New opportunities
3

Global Water Initiatives• Aquawareness
• Alliance for Water Stewardship (EWP)
• BIER Water Footprint Working Group
• Carbon Disclosure Project -Water Disclosure
• Corporate Water Gauge
• Federation House Commitment to Water Efficiency
• Global Environmental Management Initiative (GEMI)
• Global Reporting Initiative
• Global Water Tool (WBCSD)
• UNEP/SETAC Life Cycle Initiative
• Strategic Water Management Framework (Australia minerals)
• UN CEO Water Mandate
• Water Brief for Business
• Water Footprint Network
• Water Footprint Neutrality and Efficiency Project (UN)
• Water Neutral Offset Calculator
• WaterSense Certification Scheme
• Water Stewardship Initiative
• ISO Water Footprint Standard
Initiatives in bold text are those selected for more detailed analysis
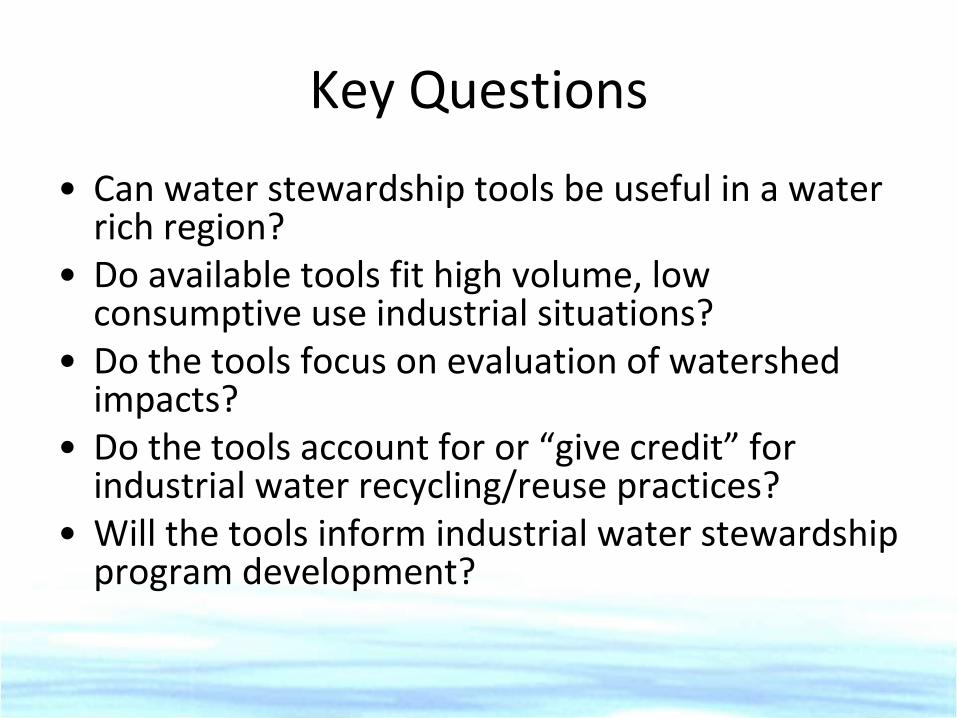
Key Questions
• Can water stewardship tools be useful in a water rich region?
• Do available tools fit high volume, low consumptive use industrial situations?
• Do the tools focus on evaluation of watershed impacts?
• Do the tools account for or “give credit” for industrial water recycling/reuse practices?
• Will the tools inform industrial water stewardship program development?

Key Questions - 2
• How do the tools fit-in with today’s industrial operational practices?
• How do tool metrics compare with data/information already being reported?
• Do the tools mesh with regulatory requirements?• Can the tools be used to support economic
development initiatives?• How will the tools recognize the need to use
water to support society’s needs, services and manufacture of products?

Study Approach
• Reviewed available tools & underlying “metrics”
• Selected metrics for evaluation
• Applied to 4 industrial facilities
• Developed findings & recommendations
8

Categories of Tools
• Water use accounting
• Business risk assessment frameworks
• Reporting and disclosure protocols
• Standards and certification frameworks
9

What are the Most Common Metrics?
10
Tool 1 Tool 2 Tool 3 Tool 4 Tool 5 Tool 6
Metric A X X
Metric B X X X X X
Metric C X
Metric D X X X
Metric E X X X X X X

What are Most Relevant to Industry?
Objective Examples
Protect ecosystem usesImpact on water quantity
Impact on water quality
Not impair other human usesAvailability for other users
Reserve water for growth
Sustain existing industrial use
Establish and maintain efficient water use plan
Response plans for dry periods
Demonstrate good water stewardship
Water reuse or recycling
Maximize return flow
Ethical governance
Permit compliance
Response actions where impacts
Out of basin transfers (avoid)
11

22 Metrics EvaluatedIndicator Metrics
Withdrawal Amounts total volume abstracted by sourcetotal volume consumed by sourcewater transfers (inter-basin and ground/surface)
peak/average/seasonal use by source
Withdrawal Source Characterization sources under stressamount of renewable water
Withdrawal Impact & Available Supply relative to total available supply
effect on ecosystem serviceseffect on human services
Discharge Amountstotal volume discharged to receiving body
Discharge Quality regulated pollutant loadnon-regulated pollutant load
Discharge Impacteutrophication potentialeffect on downstream human useseffect on ecosystem (generally)
Recycling/Reuseinternal recycling and reuseexternal recycling and reuse
Equitable & Transparent Governancewater consumption per unit productwater resource management strategy (use & disclosure)
permits and other consents (withdrawals)permits and other consents (discharges)
Benefits economic and social benefits

Initiative Developer CategoryGlobal Water Tool (GWT) World Business Council for
Sustainable Development (WBCSD)
CEO-led global organization
Managing business risk
Water Footprint (WFN) Water Footprint Network
Network of corporations, NGOs,
academics and governments
Water use accounting
Global Reporting Initiative
(GRI)
Global Reporting Initiative (GRI)
International multi-stakeholder
network of experts
Reporting and disclosure
CDP Water Disclosure
Project
Carbon Disclosure Project Water
Disclosure
Non-profit organization holding
corporate climate change database
and acting on behalf of investors
Reporting and disclosure
European Water
Stewardship (EWS)
Standard
European Water Partnership (EWP)
Regional initiative of Alliance for
Water Stewardship (AWS) which is
developing an international
standards and certification program
Standards and certification
Five Tools Evaluated
13

Four Pilot Industries
14

Consumers Energy J.H. Campbell Generating Complex
• Grand Haven, Michigan
• 2,000-acre site
• 1450 MW coal-fired power plant
– Once-through cooling
15
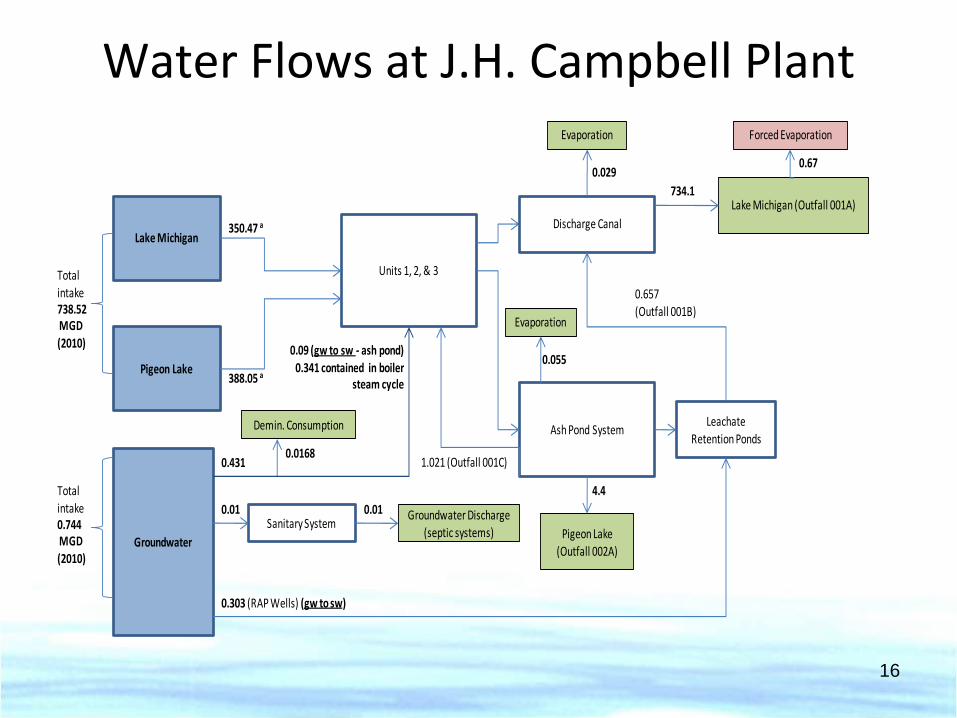
Water Flows at J.H. Campbell Plant
16
Lake Michigan
Pigeon Lake
Groundwater
Lake Michigan (Outfall 001A)
Pigeon Lake (Outfall 002A)
Total intake 738.52MGD (2010)
Ash Pond System
Units 1, 2, & 3
Discharge Canal
Evaporation
Evaporation
734.1
Leachate
Retention Ponds
0.303 (RAP Wells) (gw to sw)
0.657 (Outfall 001B)
350.47 a
388.05 a
0.431
0.09 (gw to sw - ash pond)
0.341 contained in boiler steam cycle
1.021 (Outfall 001C)
4.4
Sanitary SystemGroundwater Discharge
(septic systems)
0.01
Demin. Consumption
0.0168
0.01
Total
intake 0.744MGD
(2010)
0.055
0.029
Forced Evaporation
0.67

Site Boundary Delineation Can Affect Results
• Forced evaporation due to thermal discharge contributes to consumption
October 9, 2008
Source: http://edcsns17.cr.usgs.gov/NewEarthExplorer/
17
-
200,000
400,000
600,000
800,000
1,000,000
1,200,000
Reported to State Also including pond and canal
evaporation
Also including forced evaporation
m3
/yr
Consumers Consumption Calculations
Calculation using
State methodology

Lafarge NA Cement Plant
– Located in Bath, Ontario on Lake Ontario
– Produces Portland cement
– About 4 square mile site area
18

Lafarge NA Cement Plant
CKD Landfill
Site
Plant
MISA Pond
and Lagoon
Quarry
IntakeOutfall
19

Definitions Can Affect Results
• What is “Consumption” ?
• 3 results:361,873 m3/yr
805,601 m3/yr
- 299,108 m3/yr (negative value)
20

21
Effluent OutfallsWater Intake
St. Clair River
• Located in Corunna, Ontario on St. Clair River
• Produces refined oil products (fuels, petrochemicals, solvents)
Shell Sarnia Manufacturing Centre

Flow measurements Not Always Suitable for Metrics Calculations
• Volume withdrawn is less than volume discharged plus volume evaporated
– Possibly due to condensate blowdown, rainfall influx into system, and possible discrepancies with inlet and outlet meters
• Negative consumption calculated by one tool
• But measurement precision is suitable for current regulatory requirements and company uses.
22

NewPage Escanaba Pulp and Paper Mill
• Produces about 700,000 metric tons/yr paper and 455,000 metric tons/yr of pulp
23

Relevance of Green and Grey Water Footprints?
24

Key Findings• Potential for significant value
• No one tool provides all the answers
• Devil in the details
• Context is critical to defining value
• Some metrics are redundant, insufficient or missing
• Tools only partially address water stewardship evaluation needs
25

The ‘Ideal’ Tool
• “Low maintenance” – One-time implementation, minimal ongoing maintenance
• Minimum resource intensive (personnel/cost)• Compatible with today's highly automated/technology
based systems• Non-duplicative of existing reporting systems, compatible
with existing legislative/regulatory governance systems• Focused on stewardship demonstrations, incorporate social
and economic elements• Provide information and outputs that can be transported
into other tool systems• Produce local benefits that encourage tool use
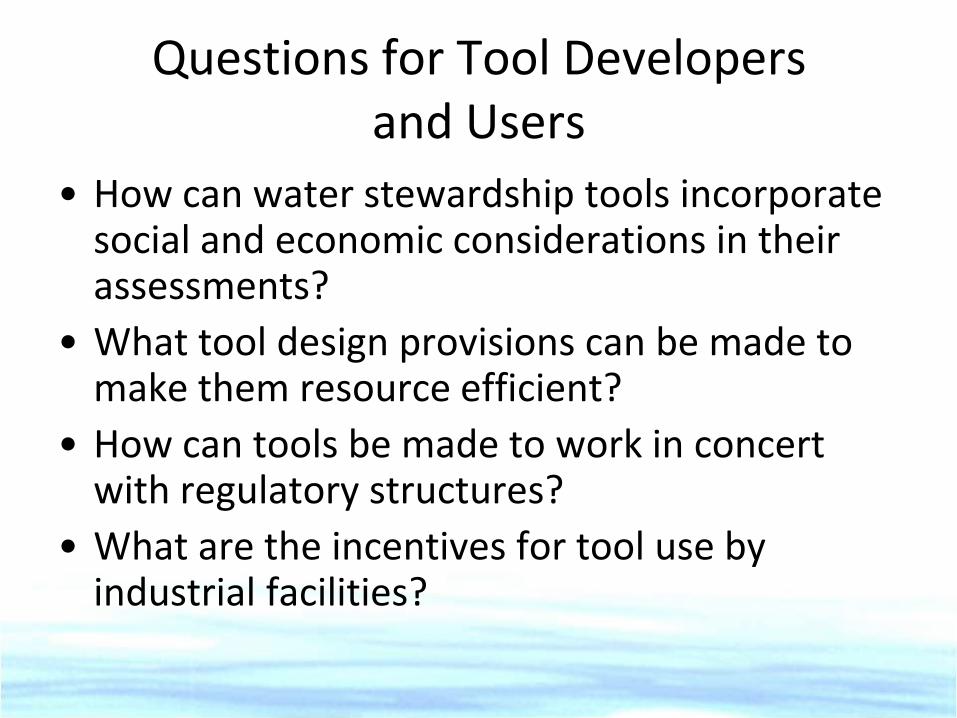
Questions for Tool Developers and Users
• How can water stewardship tools incorporate social and economic considerations in their assessments?
• What tool design provisions can be made to make them resource efficient?
• How can tools be made to work in concert with regulatory structures?
• What are the incentives for tool use by industrial facilities?

For more information…
http://www.cgli.org/waterfootprint/FinalCGLI_Rrt_PhaseII_May2012.pdf 28

Project PersonnelCGLI• Project Director
– George Kuper: [email protected] – 734 663-1944• Project Manager
– Dale Phenicie: [email protected] – 770 487-7585• Communications Director
– Evelyn Strader: [email protected] – 248 340-7062• Office Assistant
– Janet Rieke: [email protected] – 734 663-1944LimnoTech• Wendy Larson: [email protected] – 734 332-1200
– Principal Investigator• Paul Freedman
– AdvisorNCASI• Paul Wiegand: [email protected] – 919 941-6417
– Principal Investigator• Barry Malmberg
– Project AnalystEPRI• Todd Maki: [email protected] – 650 855-2162
– Principal Investigator
29

Questions?
30