Embed Size (px)
Citation preview
Fueling Export Growth: U.S. Net Export Trade Forecast for Key Chemistries to 2030
Prepared For:
American Chemistry Council
Final Report

Fueling Export Growth: U.S. Net Export Trade Forecast
for Key Chemistries to 2030 January 2015
Prepared For:
American Chemistry Council
Disclaimer
“This report was prepared by Nexant Inc. (“Nexant”), for the use of American Chemistry Council (CLIENT) in support of their own consideration of whether andhow to proceed with the subject of this report. Except where specifically stated otherwise in the report, the information contained herein was prepared on the basis ofinformation that is publicly available or was provided by the Client and has not been independently verified or otherwise examined to determine its accuracy,completeness or financial feasibility. Neither NEXANT, CLIENT nor any person acting on behalf of either assumes any liabilities with respect to the use of or fordamages resulting from the use of any information contained in this report. NEXANT does not represent or warrant that any assumed conditions will come to pass.This report speaks only as of the date herein and NEXANT has no responsibility to update this report.
This report is integral and must be read in its entirety.
The report is submitted on the understanding that the CLIENT will maintain the contents confidential except for the CLIENT’s internal use. The report should not bereproduced, distributed or used without first obtaining prior written consent by NEXANT. This report may not be relied upon by others.
This notice must accompany every copy of this report.”
Final Report
www.nexant.com
44 South Broadway, White Plains, New York 10601-4425Telephone: +1 914 609 0300 Facsimile: +1 914 609 0399

- 3 -
Contents
Section
1 Executive Summary
2 Introduction
3 US Chemical Net Exports
4 Net Exports by Region
5 Trade Trends and Policy Impacts
Appendix A Forecast by Subsector
Appendix B Nexant Methodology
Appendix C Trade Agreements
Appendix D Historic Net Exports by Category
Appendix E Historic Net Exports by Chemical

- 4 -
Section 1Executive Summary

- 5 -
Net Trade Balance, selected chemicals*($Billions per year)
Executive Summary: Background
Report Background: The ACC monitors trade statistics as part of its advocacy function
The American Chemistry Council (ACC)issued a report in early 2013, “Keys toExport Growth”, that looked at the mix ofpolicy and regulatory changes needed tocapitalize on the improved competitivenessof the U.S. chemical industry and meet theAdministration’s target of doubling U.S.exports by the end of 2014
In 2013, the net trade surplus for thechemicals shown in the figure (whichinclude all of the chemicals in this report,plus others**) was $43 billion, more thandouble the total from 2005
Since the release of the ACC’s “Key” report,total announced investment in new orexpanded chemical production facilities inthe U.S. has risen to over $100 billion,around half of which is foreign directinvestment
* Source: U.S. Department of Commerce, ACC analysis** The total 2013 net exports for the chemicals in this report was $22.4 billion
-5
0
5
10
15
20
25
30
35
40
45
50
2000 2002 2004 2006 2008 2010 2012
$Billi
ons p
er ye
ar
Inorganics Petrochem. & Inter.Plastic Resins Synthetic RubberSpecialties

- 6 -
Executive Summary: Background
Report Background
Specifically, this report examines the tradeoutlook (2010 to 2030) and the subset ofchemicals derived from unconventional oil,natural gas, and gas liquids that areexpected to experience the greatestincrease as a result of U.S. capacityincreases over this period
This report provides estimates of annualU.S. net trade volumes for the coveredproducts over the forecast period and theexpected destinations (countries and/orregions) for the chemicals examined in thereport and potential value of these trademovements
This report also provides an analysis oftrade trends and policies that could impactthe chemical industry
These investments are being driven by lowcost natural gas and associated gas liquids,especially ethane, a primary feedstock forethylene production, the largest volumepetrochemical intermediate
Even assuming that only a proportion of thisannounced investment will actually be built,it is likely that U.S. chemical production willincrease significantly in the next ten years,and that this increased production isunlikely to be absorbed by the domesticmarket
To better project the outlook for U.S.chemical exports, the ACC authorized thisreport, which examines the anticipatedincrease in U.S. chemical production to2030 and draws some conclusions aboutwhich foreign markets are likely destinationsfor this production

- 7 -
Introduction
Report Scope: This report provides a US net export trade forecast to 2030 for the following 66 chemicals and HTS codes at the Commodity and Category level:
Commodity Category Chemical Commodity Category ChemicalC1 Chemicals Methanol Expanded polystyrene (EPS)
Styrene PolyethyleneVinyl Acetate Polystyrene (PS)
2‐ethyl‐1‐hexyl Acrylate Polyvinylchloride (PVC)2‐ethylhexanol (2‐EH) Acrylic Polymers
Acrylic Acid PolycarbonatesButyl Acrylate PolypropyleneisoPropanol Acrylonitrile butadiene styrene (ABS)
n‐butyl Alcohol Polybutadiene Rubber (PBR)Propylene Glycol Styrene butadiene rubber (SBR)
C4 Chemicals 1,3‐Butadiene Aromatics Polyethylene terephthalate (PET)Benzene Ammonia
Mixed Xylene Isomers UreaPhthalic Anhydride Inorganics Diammonium phosphate (DAP) and Monoammonium phosphate (MAP)
Toluene Soda AshEthylene dichloride (EDC) Sodium Hydroxide
Ethylbenzene Sulfuric AcidEthylene Glycol Titanium Dioxide
Vinyl chloride monomer (VCM) 3208 Paint & Varnish From Synthetic Polymers, NonaqeousAcrylonitrile 3209 Paint & Varnish From Synth. Polymers, AqueousCumene 3210 Paints & Varnishes Nesoi; Water Pigmts For LeatherPhenol 3215 Ink, Printing, Writing, Drawing
Polyether Polyols 3801 Artificial Graphite; Collodial Graphite & Prep Propylene Oxide 3809 Finishing Agents Etc For Textiles, Paper
Adipic Acid 3810 Pickling Preps For Metal; SolderingAniline 3811 Antiknock Preps & Other Additives For Mineral Oils
Caprolactam 3812 Prepared Rubber Accelerators; Plasticizers Etc.Cyclohexane 3813 Prep & Charges For Fire‐extinguishers
Methylene diphenyl diisocyanate (MDI) 3815 Reaction Initiators & Catalysts Nitrobenzene 3818 Chem Elem Doped, Used In Electron, Discs WafersPara‐xylene 3819 Hydraulic Brake & Transmission Fluids
Purified terephthalic acid (PTA) 3821 Prepared Culture Media For Devel't of MicroorganismsToluene diisocyanate (TDI) 3822 Composite Diagnostic/lab Reagents, Exc Pharmaceut
Petro‐chemicals
Polymers & Rubber
Specialties
Other Specialties
Coatings & Inks
InorganicsInorganic Chemicals
C3 Chemicals
Aromatics
C2 Chemicals
C3 Chemicals
C2 Chemicals
C3 Chemicals
C4 Chemicals
Fertilizers
Intermediates
C1 ChemicalsAromatics
C2 Chemicals

- 8 -
Introduction
Report Scope and Abbreviations: This report provides a US net export trade forecast to 2030 for the chemicals listed on the previous page at the Commodity and Category level:
The geographical composition of theabove identified U.S. exports weredivided into the following fourgeographical regions:
o Americas
• Canada (added to scope)
• Mexico (added to scope)
• Brazil
• Other Americas
o Europe
o Asia
• China
• India
• Other Asia
o Rest of World. (Middle East,Africa, Oceania)
Net exports were classified intothe following segments:
o Plastic Resins
o Petrochemicals
o Fertilizers
o Intermediates
o Inorganics
o Specialties
2‐EH 2‐ethylhexanol ABS Acrylonitrile butadiene styrene APEC Asia‐Pacific Economic Cooperation forumDAP Diammonium phosphate
E&P Exploration and Production (oil and gas)
EDC Ethylene dichloride
EPCAEnergy Policy and Conservation Act of
1975EPS Expanded polystyrene FTA Free Trade AgreementHDPE High density polyethyleneLLDPE Linear low density polyethyleneMAP Monoammonium phosphate MDI Methylene diphenyl diisocyanate
NGLNatural gas liquids (ethane, propane,
butanes, and natural gasoline)PBR Polybutadiene Rubber PE Polyethylene PET Polyethylene terephthalate PS Polystyrene PTA Purified terephthalic acid PVC Polyvinylchloride SBR Styrene butadiene rubber TDI Toluene diisocyanate TPP Trans Pacific Partnership
TTIPTransatlantic Trade and Investment
Partnership (US‐EU)VCM Vinyl chloride monomer
Abbreviations Used in this Report

- 9 -
Section 1Executive Summary: Net Trade Balance Summary

- 10 -
Executive Summary: Trade Trends
The deficit in C1 chemicals will shrink by 35%, asadditional methanol, ammonia and urea capacity basedon natural gas feedstocks are constructed
Net exports of C2 chemicals, which includespolyethylene and PVC, will nearly double to 14.6 billiontons
Trade surplus for C3 chemicals will expand by 25% to 3billion tons
Due to the lightening of cracker feedstocks andcontinued importation of benzene and butadiene, thesmall trade deficit for C4s and aromatics will continue
The trade surplus for inorganics, which have loweraverage prices than the other materials, will increasefrom 10 billion tons to 13 billion tons
Due to relatively high prices, the trade surplus forspecialties has a relatively small impact on a weightbasis
On a weight basis, the largest impact is reduced C1 net imports and increased C2 net exports
Trade Trends by Category: On a weight basis, the U.S. trade balance for the selected chemicals is projected to increase from a small deficit in 2014 to a surplus of 17 billion tons by 2030
U.S. Net Trade Balance, Categories of Interest(Million tons per year)
-30
-20
-10
0
10
20
30
40
2010 2015 2020 2025 2030
Millio
n Ton
s per
year
C1 C2 C3C4 Aromatics InorganicsSpecialties Grand Total

- 11 -
Executive Summary: Trade Trends
Although balanced on a weight basis, the U.S. is insurplus by $19.5 billion on a value basis
The trade deficit in C1 chemicals will shrink as newnatural gas based ammonia and methanol plants arebuilt
Most importantly, driven by competitive advantagebased on low cost ethane and a massive investment innew crackers to make ethylene, net exports of C2chemicals will increase by $15 billion
C3 chemical exports will recover after on-purposesources of propylene are built
The trade deficit in aromatics and C4s will continue asthe U.S. continues to import large quantities of benzeneand butadiene
Note that net exports of specialties will increase from$11.2 billion in 2014 to $20.5 billion by 2030, based onintellectual property and competitive advantage
As a comparison, for 2013, total U.S. exports of goodswere $1,590.4 billion and imports were $2,293.5 billion,resulting in a goods deficit of $703 billion
The 2014 trade surplus of $19.5 billion for the selected chemicals represents 2.8% of the absolute value of the $703 billion 2013 U.S. trade deficit in “goods”
Trade Trends by Category: Due to higher “value-added” of exports compared to imports, the U.S. trade surplus for the selected chemicals is projected to increase from $19.5 billion in 2014 to $48.3 billion by 2030
U.S. Net Trade Balance, Categories of Interest($Billions per year*)
-20
-10
0
10
20
30
40
50
60
70
2010 2015 2020 2025 2030
$Billi
on pe
r yea
r
C1 C2 C3C4 Aromatics InorganicsSpecialties Grand Total
* Current dollars, assuming 2% inflation

- 12 -
Executive Summary: Trade Trends
Trade Trends by Region: The value of chemical net exports reviewed herein will increase from $19.5 billion in 2014 to $48 billion per year by 2030, with the Americas (Canada, Mexico, Brazil, Other Americas) expected to remain the leading net export destination
• Canada: Deficit remains at $3 billion by 2030
• Mexico: Surplus improves by $8.4 billion to $13.8billion by 2030 (growth of $5.4 billion), but is notgrowing as fast as the overall net trade surplus
• Brazil: Surplus more than doubles to $6.0 billion by2030
• Other Americas: Surplus improves from $2.3 billionto $10.9 billion by 2030 (growth of $8.6 billion)
• Europe Surplus improves from $2.8 billion to $5.4billion by 2030
• China: Surplus improves by $3.0 billion to $11.7billion by 2030 (growth of $8.7 billion)
• India: Surplus improves by $0.4 billion to $2.1 billionby 2030
• Other Asia: Surplus improves by $1.9 billion to $2.5billion by 2030
• Rest of World: $1.0 surplus becomes a deficit of$0.9 billion by 2030
U.S. Net Trade Balance, Regions of Interest($Billions per year)
Net exports to China, Mexico, and Other Americas and are forecast to account for $22.7 billion of the $28.5 billion in regional net export growth
-10
0
10
20
30
40
50
60
2010 2015 2020 2025 2030
$Billi
ons p
er ye
ar
Canada Mexico BrazilOther Americas Europe ChinaIndia Other Asia Rest of WorldTotal

- 13 -
Executive Summary: Trade Trends
The U.S. will remain in deficit for petrochemicals and fertilizers, and realize a modest improvement for inorganics, with the value of net exports growing at 4.0% CAGR
The biggest driver of the improving U.S. trade surplus will be polymers (with growth to $21.5 billion of net exports by 2030), specialties (to $20.5 billion), and intermediates (to $9.15 billion of net exports)
U.S. Net Trade Balance, Commodities of Interest(Million tons per year)
U.S. Net Trade Balance, Commodities of Interest($Billions per year)
-10
0
10
20
30
40
50
60
2010 2015 2020 2025 2030$B
illion
s per
year
Fertilizers IntermediatesPetrochemicals Polymers & RubberInorganics SpecialtiesGrand Total
-20
-15
-10
-5
0
5
10
15
20
25
30
2010 2015 2020 2025 2030
Millio
n Ton
s per
year
Fertilizers IntermediatesPetrochemicals Polymers & RubberInorganics SpecialtiesGrand Total

- 14 -
Executive Summary: Trade Trends
Net exports of C2 chemicals will show the largest share gain, while C1 chemical net imports will decrease markedly
On a share basis, net exports of chemicals and plastics to China and Other Americas will account for an increasing share of U.S. exports; while exports to Canada, Mexico, Europe and Other Asia will account for a declining share
Share of Net Trade Balance, Categories of Interest(percent of net exports, value weighted)
Share of Net Trade Balance, Regions of Interest(percent of net exports, value weighted)
-20%
0%
20%
40%
60%
80%
100%
2010 2015 2020 2025 2030
Canada Mexico BrazilOther Americas Europe ChinaIndia Other Asia Rest of World
-40%
-20%
0%
20%
40%
60%
80%
100%
2010 2015 2020 2025 2030
C1 C2 C3 C4 Aromatics Inorganics Specialties

- 15 -
Executive Summary: Trade Trends
The value of U.S. net exports will increase to $48.3 billion by 2030, representing 5.8% compounded value growth, with important improvements in the trade surplus for C1 chemicals, C2 chemicals and specialties
On a category basis: Shale gas and NGLs will have a positive impact on U.S. petrochemical investment and netexports for C1-C3 petrochemicals, and a negative impact on supply of aromatics, with relatively little impact on C4chemicals as follows:
• C1 – much fewer imports of methanol, ammonia and urea as new domestic capacity is added• Trade deficit shrinks from $20.5 billion to $13.2 billion in 2030
• C2 – much greater exports of ethylene derivatives based on feedstocks from new ethane steam crackers• Surplus more than doubles from $9.8 billion to $25 billion in 2030
• C3 – C3 derivative exports will recover after on-purpose sources of propylene are built• Net exports grow from $5.0 billion to $8.6 billion by 2030
• C4 – minor impact on net imports and exports of butadiene and derivatives• Deficit stays at approximately -$0.3 billion
• Aromatics – a minor change, with fewer net exports (or greater net imports) of most aromatics and derivatives• Net imports increase from $1.7 billion to $3.7 billion
• Inorganics – driven by lower energy costs, U.S. surplus will increase• Net exports increase from $3.2 billion to $5.3 billion
• Specialties – driven by technology and lower energy costs, will significantly improve the U.S. net export position• Net exports grow from $11.2 billion in 2014 to $20.5 billion

- 16 -
Executive Summary: Trade Trends
Driven by increased exports of polymers and specialties to China, Mexico and Other Americas, the U.S. trade surplus for the commodities of interest will grow by $28.8 billion
On a regional basis, there will be a significant increase in exports of chemicals and plastics to China (growing from$3 billion to $11.7 billion), as well as to Other Americas (growing from $2.3 billion to $10.9 billion), Mexico (growingfrom $8.4 billion to $13.8 billion), and Europe (growing from $2.8 billion to $5.4 billion)
• Exports to Brazil will remain relatively flat on a weight basis as domestic capacity is added during the nextdecade
• Canada and Rest of World will be a source of net imports
On a commodity basis, the biggest driver of the improving U.S. trade surplus will be polymers (with almost $15billion in net export growth) and specialties ($9.3 billion of increased net exports), with moderate growth inintermediates ($3.1 billion in net export growth)
• Although the overall position will improve, the U.S. will remain in deficit for petrochemicals ($0.7 billionimprovement – fewer imports)
• The U.S. will import less fertilizers (deficit shrinks by 2.4 million tons), but due to higher prices, net importsincreases by $0.5 billion
Polymers and specialties will be the commodities that gain the most net export value

- 17 -
Executive Summary: Trade Trends
Of the $63 billion increase in exports, net exports are forecast to increase by $29 billion
Although not part of the scope of this report, Nexant estimates that exports of “commodities of interest” will more than double from $60 billion in 2014 to $123 billion by 2030 with exports to the Americas expected to account for approximately half of total export value
U.S. Exports: Regions of Interest(Million tons per year)
U.S. Exports, Regions of Interest($Billions per year)
0
10
20
30
40
50
60
70
80
2010 2015 2020 2025 2030
Expo
rt Vo
lume (
milli
on to
ns)
Canada Mexico BrazilOther Americas Europe ChinaIndia Other Asia Rest of WorldTotal
0
20
40
60
80
100
120
140
2010 2015 2020 2025 2030
Expo
rts ($
billio
ns)
Canada Mexico BrazilOther Americas Europe ChinaIndia Other Asia Rest of WorldTotal
* Current dollars, assuming 2% inflation

- 18 -
Section 1Executive Summary: Policy Implications

- 19 -
Executive Summary: Policy Impacts
Regulatory Environment: U.S. Government policies play an important supporting role for future chemicals investment based on how it regulates key feedstocks like oil, gas and NGLs
U.S. government control of energy exports plays an indirect role in supporting petrochemical investment
U.S. government currently limits its role relative to fossil fuels to the following:
• Ensuring energy security
• Controlling energy imports and exports (especially crude oil)
• Supporting advanced research and development
Although “crude oil” exports are prohibited except as exempted by regulation, the policy regime isgentler for other fuels. Exports of coal, petroleum products, natural gas and petrochemicalfeedstocks may be restricted at the discretion of the executive branch, but they are not blocked byEPCA
Hence, refined products and petrochemicals are internationally traded at will based on market supplyand demand, and the shale revolution has created a multi-decade opportunity for increasedpetrochemical production and exports
However, the uncertainty around global supply / demand dynamics for oil, as well as futuregovernment restrictions of gas and condensate exports, will be a critical factor in determining futurefeedstock costs

- 20 -
Executive Summary: Policy Impacts
Shale Gas and NGLs: The success of U.S. E&P firms in shale gas and oil exploitation are unique to the U.S. in most cases and unlikely to be soon matched anywhere else in the world
…However, eventually one or more other regions will find ways to profitably exploit their local shale resource
Factors and Policies supporting U.S. Shale Gas and Tight Oil Development:
• Liberalized natural gas market
• Competitive industry with many entrepreneurial companies
• Industry’s focus on technological innovation
• Vast, independent oil field service sector
• Extensive natural gas processing and pipeline infrastructure
• Financial markets offering many funding options
• Financial incentives for private landowners to provide land access
• Favorable fiscal and regulatory structure

- 21 -
Executive Summary: Policy Impacts
Foreign Direct Investment: In addition to low-cost gas and NGL feedstocks, one of the attractive features of investing in U.S. petrochemical production is access to the U.S. free market economy
Access to advantaged feedstocks and U.S. infrastructure are key reasons for continuing local and foreign direct investment in the U.S.
• As a free market, most foreign companies are welcome to make an investment in the U.S.
• Investment can be with a local partner or independently, but the advantages of access toinexpensive feedstocks, land, labor, infrastructure, and shipping apply to everyone
• In addition, an investment in the U.S. can be made with confidence about the future of thecountry — the rule of law, the availability of gas and NGLs, and the well-balanced regulatoryenvironment

- 22 -
Executive Summary: Policy Impacts
Investment Drivers: Access to low-cost feedstocks and technology will drive investment in U.S. petrochemicals, fertilizers, polymers and specialty chemicals
There are very few places in the world where all of the factors necessary for competitive success in chemicals are available to domestic and outside investors
Commodity Chemicals Competitiveness Criteria

- 23 -
Executive Summary: Policy Impacts
Reducing or eliminating protective tariffs on polymers in particular could have a large impact on the growth of U.S. net exports
Tariffs and Global Trade Barriers: Historic movement towards greater free trade is expected to continue for leading export destinations, which will enable the U.S. to share its shale gas bounty with the world
TPP* and TTIP** Countries and potential new countries
Example: For LLDPE
Assuming that TTIP is completedbetween the U.S. and the EU,Nexant assumes that 6.5% dutieson LLDPE to Europe could beeliminated by 2017
Furthermore, in the Pacific Region,the TPP would eliminate duties onpolyethylene with Japan (6.5%)and Malaysia (15%). Korea’s4.5% tariff on LLDPE may also beeliminated as the FTA with Koreareaches maturity
Chinese polyethylene tariffs of6.5% could also decline if theyeventually negotiate a FTA with theU.S. or join TPP
http://www.cfr.org/councilofcouncils/global_memos/p32417?cid=rss-economics-the_high_stakes_in_regional_tr-111413* (TTP) – Trans Pacific Partnership** (TTIP) - US-EU Transatlantic Trade and Investment Partnership

- 24 -
Executive Summary: Policy Impacts
The eventual inclusion of China and other non-TPP nations in APEC would have a more significant and positive impact on chemicals trade
Tariffs and Global Trade Barriers: The current TPP countries would provide an incremental change in free trade for the U.S.
U.S.-World, APEC, and TPP Goods Trade(in billions of U.S. dollars)
Impact of TPP
For the U.S., the most importantelement of the current TPP is theaddition of Japan as a free tradepartner, which represented over $200billion in “total goods trade” in 2013
All 12 TPP partners shown in orangeon the chart are also members of theAsia-Pacific Economic Cooperation(APEC) forum
China, which represented over $500billion in “total goods trade”, hasexpressed moderate interest in joiningTPP, but this is clearly well down theroad
Several other APEC nations have alsoexpressed varying levels of interest

- 25 -
Executive Summary: Policy Impacts
Relative to net exports of chemicals, the TTIP is probably the most important FTA under negotiation by the U.S. government
Tariffs and Global Trade Barriers: The current TPP, which includes Canada, Mexico, Korea, and other countries with U.S. FTAs, would represent 41.3% of U.S. goods trade in 2013
U.S. and EU Goods Trade*(in billions of U.S. dollars)
Impact of TTIP
The TTIP, would represent 16.9% of“total goods trade” across the U.S.border and 14.2% across the EU’sborder
As a significant portion of C2chemicals and specialties trade isexpected to target Europe, the TTIPcould have a significant impact ontrade flows of chemicals
Overall trade with Europe is greaterthan trade with new FTA partners inthe TPP (Japan, Brunei, Malaysia,New Zealand, and Vietnam);therefore, Nexant expects that,compared to TPP, completion of theTTIP likely would have a larger impacton chemicals trade
http://www.europarl.europa.eu/RegData/etudes/briefing_note/join/2014/522349/EXPO-INTA_SP%282014%29522349_EN.pdf

- 26 -
Section 2Introduction

- 27 -
Introduction
Objectives
The objectives of this report are to:
Provide projections that highlight the importance of increased U.S. chemicals production to U.S.export growth to 2030
To provide data for the ACC to advocate for increased U.S. market access to priority countries, i.e.a forward-looking U.S. trade policy agenda

- 28 -
Introduction
Scope: This report provides a US net export trade forecast to 2030 for the following 66 chemicals and HTS codes at the Commodity and Category level:
Commodity Category Chemical Commodity Category ChemicalC1 Chemicals Methanol Expanded polystyrene (EPS)
Styrene PolyethyleneVinyl Acetate Polystyrene (PS)
2‐ethyl‐1‐hexyl Acrylate Polyvinylchloride (PVC)2‐ethylhexanol (2‐EH) Acrylic Polymers
Acrylic Acid PolycarbonatesButyl Acrylate PolypropyleneisoPropanol Acrylonitrile butadiene styrene (ABS)
n‐butyl Alcohol Polybutadiene Rubber (PBR)Propylene Glycol Styrene butadiene rubber (SBR)
C4 Chemicals 1,3‐Butadiene Aromatics Polyethylene terephthalate (PET)Benzene Ammonia
Mixed Xylene Isomers UreaPhthalic Anhydride Inorganics Diammonium phosphate (DAP) and Monoammonium phosphate (MAP)
Toluene Soda AshEthylene dichloride (EDC) Sodium Hydroxide
Ethylbenzene Sulfuric AcidEthylene Glycol Titanium Dioxide
Vinyl chloride monomer (VCM) 3208 Paint & Varnish From Synthetic Polymers, NonaqeousAcrylonitrile 3209 Paint & Varnish From Synth. Polymers, AqueousCumene 3210 Paints & Varnishes Nesoi; Water Pigmts For LeatherPhenol 3215 Ink, Printing, Writing, Drawing
Polyether Polyols 3801 Artificial Graphite; Collodial Graphite & Prep Propylene Oxide 3809 Finishing Agents Etc For Textiles, Paper
Adipic Acid 3810 Pickling Preps For Metal; SolderingAniline 3811 Antiknock Preps & Other Additives For Mineral Oils
Caprolactam 3812 Prepared Rubber Accelerators; Plasticizers Etc.Cyclohexane 3813 Prep & Charges For Fire‐extinguishers
Methylene diphenyl diisocyanate (MDI) 3815 Reaction Initiators & Catalysts Nitrobenzene 3818 Chem Elem Doped, Used In Electron, Discs WafersPara‐xylene 3819 Hydraulic Brake & Transmission Fluids
Purified terephthalic acid (PTA) 3821 Prepared Culture Media For Devel't of MicroorganismsToluene diisocyanate (TDI) 3822 Composite Diagnostic/lab Reagents, Exc Pharmaceut
Petro‐chemicals
Polymers & Rubber
Specialties
Other Specialties
Coatings & Inks
InorganicsInorganic Chemicals
C3 Chemicals
Aromatics
C2 Chemicals
C3 Chemicals
C2 Chemicals
C3 Chemicals
C4 Chemicals
Fertilizers
Intermediates
C1 ChemicalsAromatics
C2 Chemicals

- 29 -
Introduction
Scope: This report provides a US net export trade forecast to 2030 for the following 66 chemicals and HTS codes at the Category and Commodity level:
Category Commodity Chemical Category Commodity ChemicalPetro‐chemicals Methanol Benzene
Ammonia Mixed Xylene IsomersUrea Phthalic Anhydride
Styrene TolueneVinyl Acetate Adipic Acid
Ethylene dichloride (EDC) AnilineEthylbenzene CaprolactamEthylene Glycol Cyclohexane
Vinyl chloride monomer (VCM) Methylene diphenyl diisocyanate (MDI) Expanded polystyrene (EPS) Nitrobenzene
Polyethylene Para‐xylenePolystyrene (PS) Purified terephthalic acid (PTA)
Polyvinylchloride (PVC) Toluene diisocyanate (TDI)2‐ethyl‐1‐hexyl Acrylate Polymers & Rubber Polyethylene terephthalate (PET)
2‐ethylhexanol (2‐EH) FertilizersDiammonium phosphate (DAP) and Monoammonium
phosphate (MAP)Acrylic Acid Soda AshButyl Acrylate Sodium HydroxideisoPropanol Sulfuric Acid
n‐butyl Alcohol Titanium DioxidePropylene Glycol 3208 Paint & Varnish From Synthetic Polymers, NonaqeousAcrylonitrile 3209 Paint & Varnish From Synth. Polymers, AqueousCumene 3210 Paints & Varnishes Nesoi; Water Pigmts For LeatherPhenol 3215 Ink, Printing, Writing, Drawing
Polyether Polyols 3801 Artificial Graphite; Collodial Graphite & Prep Propylene Oxide 3809 Finishing Agents Etc For Textiles, Paper Acrylic Polymers 3810 Pickling Preps For Metal; SolderingPolycarbonates 3811 Antiknock Preps & Other Additives For Mineral OilsPolypropylene 3812 Prepared Rubber Accelerators; Plasticizers Etc.
Petro‐chemicals 1,3‐Butadiene 3813 Prep & Charges For Fire‐extinguishers Acrylonitrile butadiene styrene (ABS) 3815 Reaction Initiators & Catalysts
Polybutadiene Rubber (PBR) 3818 Chem Elem Doped, Used In Electron, Discs WafersStyrene butadiene rubber (SBR) 3819 Hydraulic Brake & Transmission Fluids
3821 Prepared Culture Media For Devel't of Microorganisms3822 Composite Diagnostic/lab Reagents, Exc Pharmaceut
Specialties
C1 Chemicals
C2 Chemicals
C3 Chemicals
C4 Chemicals
Aromatics
Inorganics
Intermediates
Polymers & Rubber
Polymers & Rubber
Petro‐chemicals
Intermediates
Inorganic Chemicals
Coatings & Inks
Other Specialties
Fertilizers
Petro‐chemicals
Intermediates
Polymers & Rubber
Petro‐chemicals

- 30 -
Introduction
Scope: This report provides a US net export trade forecast to 2030 for the chemicals on the previous page at the Commodity and Category level:
The geographical composition of the aboveidentified U.S. exports were divided into thefollowing geographical regions:
o Americas
• Canada (added to scope)
• Mexico (added to scope)
• Brazil
• Other Americas
o Europe
o Asia
• China
• India
• Other Asia
o Rest of World. (Middle East, Africa, Oceania)
Net exports were classified into the followingsegments:
• Plastic Resins
• Petrochemicals
• Fertilizers
• Intermediates
• Inorganics
• Specialties
- 31 -
Introduction
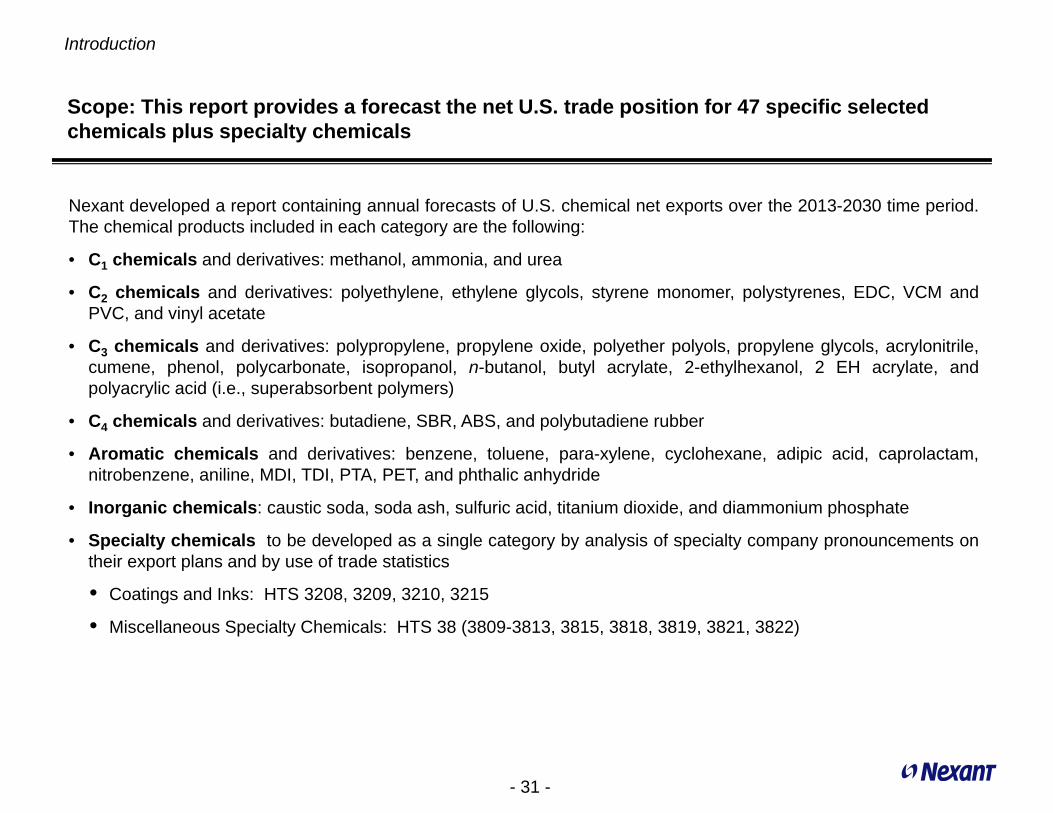
Scope: This report provides a forecast the net U.S. trade position for 47 specific selected chemicals plus specialty chemicals
Nexant developed a report containing annual forecasts of U.S. chemical net exports over the 2013-2030 time period.The chemical products included in each category are the following:
• C1 chemicals and derivatives: methanol, ammonia, and urea
• C2 chemicals and derivatives: polyethylene, ethylene glycols, styrene monomer, polystyrenes, EDC, VCM andPVC, and vinyl acetate
• C3 chemicals and derivatives: polypropylene, propylene oxide, polyether polyols, propylene glycols, acrylonitrile,cumene, phenol, polycarbonate, isopropanol, n-butanol, butyl acrylate, 2-ethylhexanol, 2 EH acrylate, andpolyacrylic acid (i.e., superabsorbent polymers)
• C4 chemicals and derivatives: butadiene, SBR, ABS, and polybutadiene rubber
• Aromatic chemicals and derivatives: benzene, toluene, para-xylene, cyclohexane, adipic acid, caprolactam,nitrobenzene, aniline, MDI, TDI, PTA, PET, and phthalic anhydride
• Inorganic chemicals: caustic soda, soda ash, sulfuric acid, titanium dioxide, and diammonium phosphate
• Specialty chemicals to be developed as a single category by analysis of specialty company pronouncements ontheir export plans and by use of trade statistics
• Coatings and Inks: HTS 3208, 3209, 3210, 3215
• Miscellaneous Specialty Chemicals: HTS 38 (3809-3813, 3815, 3818, 3819, 3821, 3822)

- 32 -
Introduction
Nexant’s Approach and Methodology: Nexant’s petrochemical simulator forecasts the capacity, operating rates, and net trade position for major petrochemicals and over 40 regions
The simulator relates market demand drivers to petrochemical consumption. From a database ofpetrochemical processes and plant capacity the regional consumption is then compared to the abilityto produce. Global trade algorithms, driven by a comprehensive logistics model, add to thesimulation of trade and build to a full supply, demand and trade model of the industry.
Raw material cost
Process technoeconomics
Cost of production
Return on investment
Consumption factors
GDP Sector Growth End usesConsumption
Capacity
Operating Rate
ROI/ Op rate correlation
Investment cost PriceMargin
Inventory change
Production
Utility cost
Labor Costs
Imports & Exports
Global trade flows
Regional Competition
Logistics model
PP: PPE2003/PetchemProfForc/SEC_2
The net trade forecasts for each region are assumed to not vary with the crude oil price

- 33 -
Section 3Forecast Net Exports
- 34 -
Net Exports by Category and Region
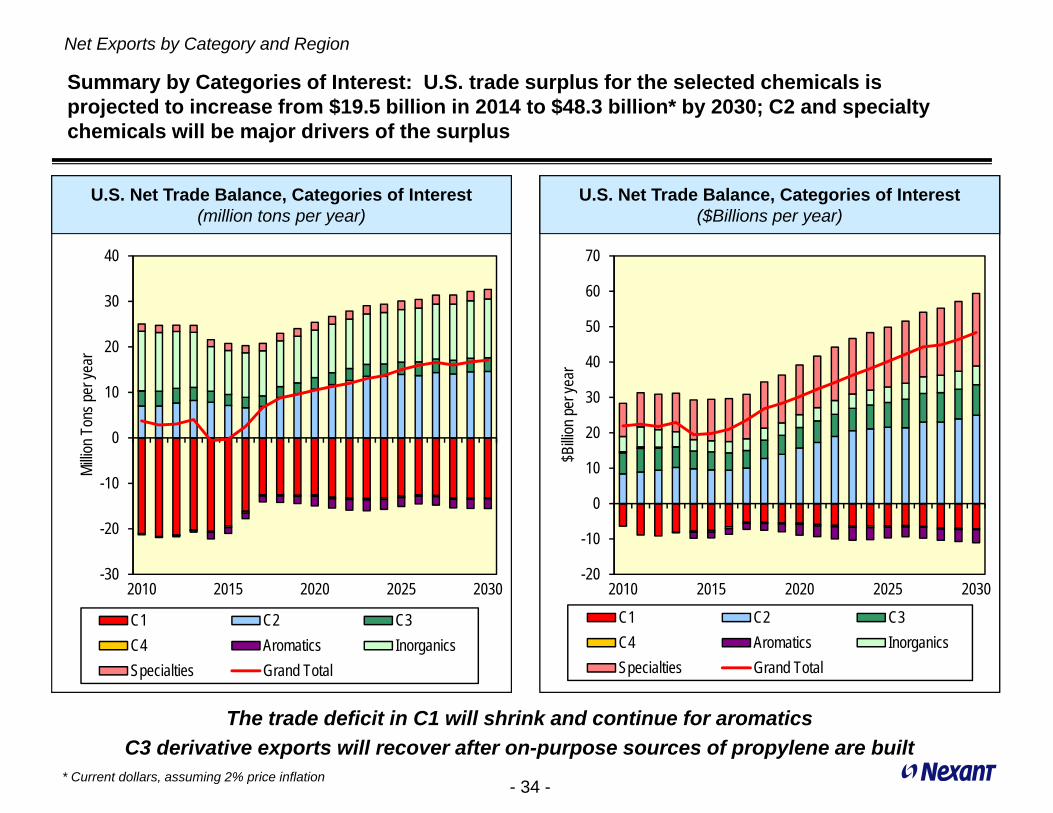
The trade deficit in C1 will shrink and continue for aromaticsC3 derivative exports will recover after on-purpose sources of propylene are built
Summary by Categories of Interest: U.S. trade surplus for the selected chemicals is projected to increase from $19.5 billion in 2014 to $48.3 billion* by 2030; C2 and specialty chemicals will be major drivers of the surplus
U.S. Net Trade Balance, Categories of Interest(million tons per year)
U.S. Net Trade Balance, Categories of Interest($Billions per year)
-20
-10
0
10
20
30
40
50
60
70
2010 2015 2020 2025 2030$B
illion
per y
ear
C1 C2 C3C4 Aromatics InorganicsSpecialties Grand Total
-30
-20
-10
0
10
20
30
40
2010 2015 2020 2025 2030
Millio
n Ton
s per
year
C1 C2 C3C4 Aromatics InorganicsSpecialties Grand Total
* Current dollars, assuming 2% price inflation

- 35 -
Net Exports by Category and Region
C1 chemicals includes: ammonia, urea and methanol
C1 Chemicals: The deficit in C1 chemicals will decline to under $6 billion by 2017, as the U.S. adds shale gas based capacity for methanol, ammonia and urea. Currently, the U.S. sources much of its C1 chemicals deficit from “Other Americas”
U.S. Net Trade Balance, C1 Chemicals(Million tons per year)
U.S. Net Trade Balance, C1 Chemicals($Billions per year)
-25
-20
-15
-10
-5
0
5
2010 2015 2020 2025 2030
Millio
n ton
s per
year
Canada Mexico BrazilOther Americas Europe ChinaIndia Other Asia Rest of WorldTotal
-10
-8
-6
-4
-2
0
2
2010 2015 2020 2025 2030
$Billi
ons p
er ye
ar
Canada Mexico BrazilOther Americas Europe ChinaIndia Other Asia Rest of WorldTotal

- 36 -
Net Exports by Category and Region
C2 Chemicals includes: PE, PVC, PS, EDC, VCM, MEG, Styrene, and VAM
C2 Chemicals: The C2 chemicals surplus will increase to nearly $25 billion, as additional new ethylene supply from steam cracking of ethane creates competitive advantage for exports of polymers and intermediates to China, Europe, Mexico and Other Americas
U.S. Net Trade Balance, C2 Chemicals(Million tons per year)
U.S. Net Trade Balance, C2 Chemicals($Billions per year)
-5
0
5
10
15
20
2010 2015 2020 2025 2030
Millio
n ton
s per
year
Canada Mexico BrazilOther Americas Europe ChinaIndia Other Asia Rest of WorldTotal
-10
-5
0
5
10
15
20
25
30
35
2010 2015 2020 2025 2030$B
illion
s per
year
Canada Mexico BrazilOther Americas Europe ChinaIndia Other Asia Rest of WorldTotal
- 37 -
Net Exports by Category and Region
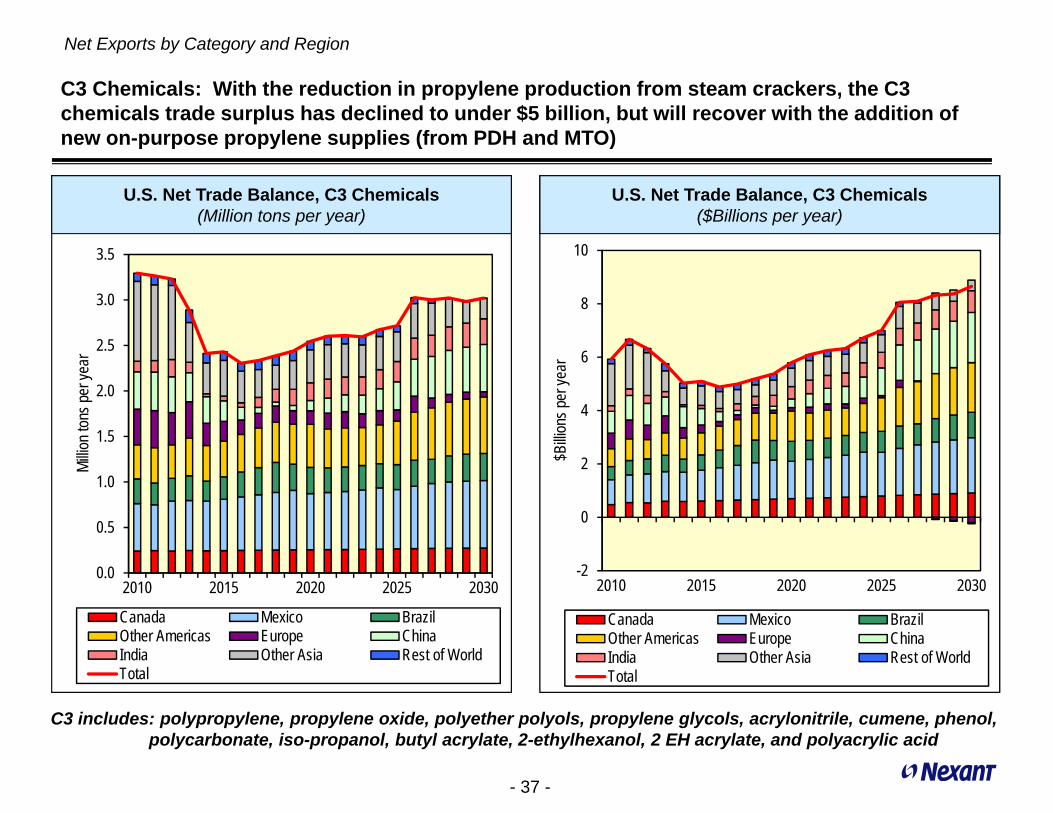
C3 includes: polypropylene, propylene oxide, polyether polyols, propylene glycols, acrylonitrile, cumene, phenol, polycarbonate, iso-propanol, butyl acrylate, 2-ethylhexanol, 2 EH acrylate, and polyacrylic acid
U.S. Net Trade Balance, C3 Chemicals(Million tons per year)
U.S. Net Trade Balance, C3 Chemicals($Billions per year)
0.0
0.5
1.0
1.5
2.0
2.5
3.0
3.5
2010 2015 2020 2025 2030
Millio
n ton
s per
year
Canada Mexico BrazilOther Americas Europe ChinaIndia Other Asia Rest of WorldTotal
C3 Chemicals: With the reduction in propylene production from steam crackers, the C3 chemicals trade surplus has declined to under $5 billion, but will recover with the addition of new on-purpose propylene supplies (from PDH and MTO)
-2
0
2
4
6
8
10
2010 2015 2020 2025 2030$B
illion
s per
year
Canada Mexico BrazilOther Americas Europe ChinaIndia Other Asia Rest of WorldTotal

- 38 -
Net Exports by Category and Region
C4 Chemicals includes: butadiene and the derivatives SBR, ABS, and polybutadiene rubber
C4 Chemicals: The 2010 surplus in C4 chemicals has shifted to deficit, as the U.S. will import significant amounts of butadiene from Europe and Other Asia
U.S. Net Trade Balance, C4 Chemicals(Million tons per year)
U.S. Net Trade Balance, C4 Chemicals($Billions per year)
-0.8
-0.6
-0.4
-0.2
0.0
0.2
0.4
2010 2015 2020 2025 2030
Millio
n ton
s per
year
Canada Mexico BrazilOther Americas Europe ChinaIndia Other Asia Rest of WorldTotal
-2.0
-1.5
-1.0
-0.5
0.0
0.5
1.0
1.5
2010 2015 2020 2025 2030$B
illion
s per
year
Canada Mexico BrazilOther Americas Europe ChinaIndia Other Asia Rest of WorldTotal

- 39 -
Net Exports by Category and Region
Aromatics and derivatives includes: benzene, toluene, para-xylene, cyclohexane, adipic acid, caprolactam, nitrobenzene, aniline, MDI, TDI, PTA, PET, and phthalic anhydride
Aromatics: The shift to lighter cracker feedstocks has resulted in significant deficit in benzene, which along with para-xylene, is the most important aromatic feedstock
U.S. Net Trade Balance, Aromatics(Million tons per year)
U.S. Net Trade Balance, Aromatics($Billions per year)
-5
-4
-3
-2
-1
0
1
2
3
2010 2015 2020 2025 2030
Millio
n ton
s per
year
Canada Mexico BrazilOther Americas Europe ChinaIndia Other Asia Rest of WorldTotal
-7
-6
-5
-4
-3
-2
-1
0
1
2
3
4
2010 2015 2020 2025 2030$B
illion
s per
year
Canada Mexico BrazilOther Americas Europe ChinaIndia Other Asia Rest of WorldTotal

- 40 -
Net Exports by Category and Region
Inorganics include: caustic soda, soda ash, sulfuric acid, titanium dioxide, and diammonium phosphate (DAP) and monoammonium phosphate (MAP)
Inorganics: As India has become more self sufficient in DAP and MAP, the net trade surplus for inorganics of interest has declined to $3.2 billion. Growing demand from Brazil and Other Americas will push the surplus back over $5 billion by the end of the period
U.S. Net Trade Balance, Inorganics(Million tons per year)
U.S. Net Trade Balance, Inorganics($Billions per year)
-4
-2
0
2
4
6
8
10
12
14
16
2010 2015 2020 2025 2030
Millio
n ton
s per
year
Canada Mexico BrazilOther Americas Europe ChinaIndia Other Asia Rest of WorldTotal
-1
0
1
2
3
4
5
6
7
2010 2015 2020 2025 2030$B
illion
s per
year
Canada Mexico BrazilOther Americas Europe ChinaIndia Other Asia Rest of WorldTotal

- 41 -
Net Exports by Category and Region
Specialties includes: coatings, inks and miscellaneous chemicals (HTS 38)
Specialties: The surplus in Specialties will grow from $11.2 billion to $20.5 billion, with a trade surplus in every region, especially China, Mexico, Other Americas and Rest of World
U.S. Net Trade Balance, Specialties(Million tons per year)
U.S. Net Trade Balance, Specialties($Billions per year)
0
5
10
15
20
25
2010 2015 2020 2025 2030$B
illion
s per
year
Canada Mexico BrazilOther Americas Europe ChinaIndia Other Asia Rest of WorldTotal
-0.5
0.0
0.5
1.0
1.5
2.0
2.5
2010 2015 2020 2025 2030
Millio
n ton
s per
year
Canada Mexico BrazilOther Americas Europe ChinaIndia Other Asia Rest of WorldTotal
- 42 -
Net Exports by Category and Region
Summary on a Category Basis: The value of U.S. net exports will increase to $48.3 billion by 2030, representing 5.8% CAGR value growth, with important improvements from C2 chemicals, specialties and C1 chemicals
• C1 – The deficit in C1 chemicals will decline to under $6 billion by 2017, as the U.S. adds shale gas basedcapacity for methanol, ammonia and urea. Currently, the U.S. sources much of its C1 deficit from “OtherAmericas”
• Trade deficit shrinks from $20.5 billion to $13.2 billion• C2 – The C2 surplus will improve as additional low cost ethylene supply based on feedstocks from new ethane
steam crackers creates competitive advantage for exports of polymers and intermediates to China, Europe, OtherAmericas and Mexico
• Surplus grows from $9.8 billion to $25 billion in 2030• C3 – C3 chemical exports will recover after on-purpose sources of propylene are built (via PDH and MTO)
• Net exports grow from $5.0 billion to $8.6 billion by 2030• C4 – The 2010 surplus in C4 chemicals falls into deficit, as the U.S. will import significant amounts of butadiene
from Europe and Other Asia• Deficit stays at approximately -$0.3 billion
• Aromatics – As supplies of benzene have declined, imports have increased to support exports of aromaticsderivatives to Mexico, China and Other Americas. Overall, a minor change . . .
• Net imports increase from $1.7 billion to $3.7 billion• Inorganics – As India has become more self sufficient in DAP and MAP, the net trade surplus for inorganics of
interest has declined to $3.2 billion. Growing demand from Brazil and Other Americas will push the surplus backover $5 billion by the end of the period
• Net exports increase from $3.2 billion to $5.3 billion (with 4.0% CAGR)• Specialties – Increased sales to China, Mexico, Other Americas, and Rest of World will significantly improve the
U.S. net export position (3.8% CAGR)• Specialties net exports grow from $11.2 billion in 2014 to $20.5 billion in 2030

- 43 -
Net Exports by Region
The rapid growth of exports to China, Other Americas and Mexico will drive the chemicals trade surplus to $48.3 billion by 2030
Summary by Region: Although the U.S. is nearly in balance on a tons basis in 2014, the mix of higher value chemicals that are exported drives the over trade balance (for the selected chemicals) to a $19.5 billion surplus in 2014
U.S. Net Trade Balance, Regions of Interest(Million tons per year)
U.S. Net Trade Balance, Regions of Interest($Billions per year)
-20
-15
-10
-5
0
5
10
15
20
25
30
2010 2015 2020 2025 2030
Millio
n Ton
s per
year
Canada Mexico BrazilOther Americas Europe ChinaIndia Other Asia Rest of WorldTotal
-10
0
10
20
30
40
50
60
2010 2015 2020 2025 2030$B
illion
s per
year
Canada Mexico BrazilOther Americas Europe ChinaIndia Other Asia Rest of WorldTotal

- 44 -
Net Exports by Commodity Type and Region
The value of U.S. net exports will increase to $48.3 billion by 2030, representing 5.8% compounded value growth driven by increased exports to China and Other Americas
On a regional basis, there will be a significant increase in exports of chemicals and plastics to China (growing from$3 billion to $11.7 billion), as well as to Other Americas (growing from $2.3 billion to $10.9 billion), Mexico (growingfrom $8.4 billion to $13.8 billion), and Europe (growing from $2.8 billion to $5.4 billion)
• Exports to Brazil will remain relatively flat on a weight basis as domestic capacity is added based during thenext decade
• Canada and Rest of World will be a source of net imports
On a commodity basis, the biggest driver of the improving U.S. trade surplus will be polymers (with almost $15billion in net export growth) and specialties ($9.3 billion of increased net exports), with moderate growth inintermediates ($3.1 billion in net export growth)
• Although the overall position will improve, the U.S. will remain in deficit for petrochemicals ($0.7 billionimprovement – fewer imports)
• The U.S. will import less fertilizers (deficit shrinks by 2.4 million tons), but due to higher prices, net importsincreases by $0.5 billion
Exports of “commodities of interest”: Although not part of the scope of this report, Nexant estimates that exportsof “commodities of interest” will more than double from $60 billion in 2014 to $123 billion by 2030, with exports to theAmericas expected to account for half of total export value
In comparison, for 2013, total U.S. exports of goods were $1,590.4 billion and imports were $2,293.5 billion, resultingin a goods deficit of $703.2 billion
Polymers and specialties will be the commodities that capture the most net export value

- 45 -
Net Exports by Commodity Type and Region
Benzene and butadiene will remain key petrochemical net import items
Net exports of Petrochemicals have been dragged down by methanol, which has been in deficit, but will reach near parity in the next 3 years
U.S. Net Trade Balance, Petrochemicals(Million tons per year)
U.S. Net Trade Balance, Petrochemicals($Billions per year)
-5
-4
-3
-2
-1
0
1
2
3
4
2010 2015 2020 2025 2030$B
illion
s per
year
Canada Mexico BrazilOther Americas Europe ChinaIndia Other Asia Rest of WorldTotal
-8
-6
-4
-2
0
2
4
6
2010 2015 2020 2025 2030
Millio
n ton
s/yea
r
Canada Mexico BrazilOther Americas Europe ChinaIndia Other Asia Rest of WorldTotal

- 46 -
Net Exports by Commodity Type and Region
Canada will remain a key source of PTA and MEG (PET intermediates)
Intermediates are in surplus, with exports to China expected to more than triple by 2030, leading to category surplus growth of $3 billion
U.S. Net Trade Balance, Intermediates(Million tons per year)
U.S. Net Trade Balance, Intermediates($Billions per year)
-2
0
2
4
6
8
10
12
2010 2015 2020 2025 2030$B
illion
s per
year
Canada Mexico BrazilOther Americas Europe ChinaIndia Other Asia Rest of WorldTotal
-2
-1
0
1
2
3
4
5
6
7
8
9
2010 2015 2020 2025 2030
Millio
n ton
s/yea
r
Canada Mexico BrazilOther Americas Europe ChinaIndia Other Asia Rest of WorldTotal

- 47 -
Net Exports by Commodity Type and Region
Canada will continue to be a key source of polymer supply
Polyethylene and PVC are expected to drive the exports for Plastics Resins, with sales to Other Americas, China and ROW likely to expand, leading to surplus growth of $14.8 billion
U.S. Net Trade Balance, Plastics & Rubber(Million tons per year)
U.S. Net Trade Balance, Plastics & Rubber($Billions per year)
-5
0
5
10
15
20
25
30
2010 2015 2020 2025 2030$B
illion
s per
year
Canada Mexico BrazilOther Americas Europe ChinaIndia Other Asia Rest of WorldTotal
-4
-2
0
2
4
6
8
10
12
2010 2015 2020 2025 2030
Millio
n ton
s/yea
r
Canada Mexico BrazilOther Americas Europe ChinaIndia Other Asia Rest of WorldTotal

- 48 -
Net Exports by Commodity Type and Region
The deficit in fertilizers will shrink on a weight basis, but increase on a value basisIntermediates will exhibit modest growth
Summary Commodities of Interest: Change in tons is driven by all categories except specialties; but the change in net export surplus value is clearly driven by polymers ($14.8 billion increase) and specialties ($9.3 billion increase)
U.S. Net Trade Balance, Commodities of Interest(Million tons per year)
U.S. Net Trade Balance, Commodities of Interest($Billions per year)
-10
0
10
20
30
40
50
60
2010 2015 2020 2025 2030$B
illion
s per
year
Fertilizers IntermediatesPetrochemicals Polymers & RubberInorganics SpecialtiesGrand Total
-20
-15
-10
-5
0
5
10
15
20
25
30
2010 2015 2020 2025 2030
Millio
n Ton
s per
year
Fertilizers IntermediatesPetrochemicals Polymers & RubberInorganics SpecialtiesGrand Total

- 49 -
Net Exports by Commodity Type and Region
The value of U.S. net exports will increase to $48.3 billion by 2030, representing 5.8% compounded value growth driven by increased exports of polymers and specialties
On a commodity basis, the biggest driver of the improving U.S. trade surplus will be polymers (with almost $15billion in net export growth) and specialties ($9.3 billion of increased net exports), with moderate growth inintermediates ($3.1 billion in net export growth)
• Polyethylene and PVC are expected to drive the exports for plastic resins, with sales to China, Other Americas,and ROW forecast to expand significantly
• Although the overall position will improve, the U.S. will remain in deficit for petrochemicals ($0.7 billionimprovement – due to fewer imports). Petrochemicals have been dragged down by methanol, which has beenin deficit, but will reach parity in the next 3 years; Benzene and butadiene will remain key petrochemical importitems
• Intermediates are in surplus, with exports to China expected to more than triple by 2030. Canada will remain akey source of PTA and MEG
• The U.S. will import less fertilizers (deficit shrinks by 2.4 million tons), but due to higher prices, net importsincreases by $0.5 billion
Polymers and specialties will be the commodities that gain the most net export value

- 50 -
Section 4Forecast: Net Exports by Region

- 51 -
Net Trade by Region
Canada, which also supplies PTA and butadiene, while receiving C4 rubbers and polypropylene, will remain in deficit as net trade partner with the U.S.
Canada is a key source of C1 and C2 chemicals to the U.S. including: polyethylene, styrene, MEG, urea and ammonia
U.S. Net Trade Balance, Canada(Million ton per year)
U.S. Net Trade Balance, Canada($Billions)
-8
-6
-4
-2
0
2
4
2010 2015 2020 2025 2030$B
illion
per y
ear
C1 C2 C3C4 Aromatics InorganicsSpecialties Grand Total
-7
-6
-5
-4
-3
-2
-1
0
1
2
2010 2015 2020 2025 2030
Millio
n Ton
s per
year
C1 C2 C3C4 Aromatics InorganicsSpecialties Grand Total

- 52 -
Net Trade by Region
Mexico will increase its net imports from the U.S. by $5.4 billion, based largely on greater net imports of C2 chemicals ($1.9 billion of growth) and specialties ($2.5 billion)
Mexico is an important destination for para-xylene, polyethylene, styrene, polypropylene, polycarbonates, polyether polyols, and VCM from the U.S.
U.S. Net Trade Balance, Mexico(Million ton per year)
U.S. Net Trade Balance, Mexico($Billions)
0
1
2
3
4
5
6
7
2010 2015 2020 2025 2030
Millio
n Ton
s per
year
C1 C2 C3C4 Aromatics InorganicsSpecialties Grand Total
0
2
4
6
8
10
12
14
16
2010 2015 2020 2025 2030$B
illion
per y
ear
C1 C2 C3C4 Aromatics InorganicsSpecialties Grand Total

- 53 -
Net Trade by Region
Brazil, which is a notable source of benzene, toluene and para-xylene, will increase its net imports from the U.S. by $3.3 billion, based on greater imports of C2 chemicals and inorganics
Brazil is an important destination for styrene, sodium hydroxide, polyether polyols, DAP, acrylic polymers and polyethylene from the U.S.
U.S. Net Trade Balance, Brazil(Million ton per year)
U.S. Net Trade Balance, Brazil($Billions)
-1
0
1
2
3
4
5
6
7
2010 2015 2020 2025 2030$B
illion
per y
ear
C1 C2 C3C4 Aromatics InorganicsSpecialties Grand Total
-1
0
1
2
3
4
5
6
7
8
2010 2015 2020 2025 2030
Millio
n Ton
s per
year
C1 C2 C3C4 Aromatics InorganicsSpecialties Grand Total

- 54 -
Net Trade by Region
Other Americas, which is a key source of ammonia and methanol, will increase its net imports from the U.S. by $8.6 billion based on less C1 net exports and greater C2 net imports
Other Americas is an important destination for PE, PVC, DAP, styrene, acrylic polymers, sodium hydroxide, soda ash, and TiO2 from the U.S.
U.S. Net Trade Balance, Other Americas(Million ton per year)
U.S. Net Trade Balance, Other Americas($Billions)
-6
-4
-2
0
2
4
6
8
10
12
14
16
2010 2015 2020 2025 2030$B
illion
per y
ear
C1 C2 C3C4 Aromatics InorganicsSpecialties Grand Total
-15
-10
-5
0
5
10
2010 2015 2020 2025 2030
Millio
n Ton
s per
year
C1 C2 C3C4 Aromatics InorganicsSpecialties Grand Total

- 55 -
Net Trade by Region
Europe, which is a key source of ammonia, urea, butadiene, benzene and para-xylene, will increase its net imports from the U.S. by $2.5 billion based on greater C2 net imports
Europe is an important destination for TiO2, PVC, butadiene rubber, styrene, ethylene copolymers, acrylic polymers and polyether polyols from the U.S.
U.S. Net Trade Balance, Europe(Million ton per year)
U.S. Net Trade Balance, Europe($Billions)
-4
-2
0
2
4
6
8
2010 2015 2020 2025 2030$B
illion
per y
ear
C1 C2 C3C4 Aromatics InorganicsSpecialties Grand Total
-5
-4
-3
-2
-1
0
1
2
3
4
2010 2015 2020 2025 2030
Millio
n Ton
s per
year
C1 C2 C3C4 Aromatics InorganicsSpecialties Grand Total

- 56 -
Net Trade by Region
China will increase its net imports from the U.S. by $8.7 billion based largely on greater C2 net imports with $5.1 billion of growth
China is an important destination for polycarbonates, PVC, para-xylene, styrene, caprolactam, MEG, polypropylene, PE and polyether polyols from the U.S.
U.S. Net Trade Balance, China(Million ton per year)
U.S. Net Trade Balance, China($Billions)
-2
0
2
4
6
8
10
12
14
2010 2015 2020 2025 2030$B
illion
per y
ear
C1 C2 C3C4 Aromatics InorganicsSpecialties Grand Total
-2
-1
0
1
2
3
4
5
6
7
2010 2015 2020 2025 2030
Millio
n Ton
s per
year
C1 C2 C3C4 Aromatics InorganicsSpecialties Grand Total
- 57 -
Net Trade by Region
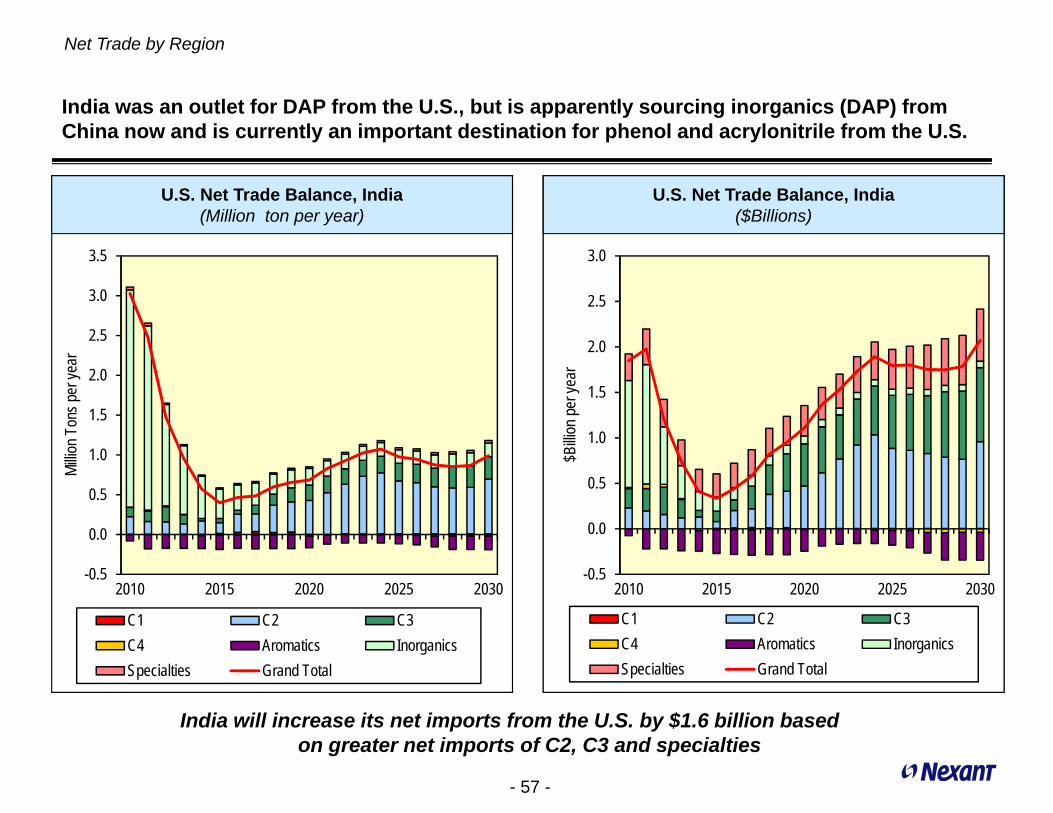
India will increase its net imports from the U.S. by $1.6 billion based on greater net imports of C2, C3 and specialties
India was an outlet for DAP from the U.S., but is apparently sourcing inorganics (DAP) from China now and is currently an important destination for phenol and acrylonitrile from the U.S.
U.S. Net Trade Balance, India(Million ton per year)
U.S. Net Trade Balance, India($Billions)
-0.5
0.0
0.5
1.0
1.5
2.0
2.5
3.0
2010 2015 2020 2025 2030$B
illion
per y
ear
C1 C2 C3C4 Aromatics InorganicsSpecialties Grand Total
-0.5
0.0
0.5
1.0
1.5
2.0
2.5
3.0
3.5
2010 2015 2020 2025 2030
Millio
n Ton
s per
year
C1 C2 C3C4 Aromatics InorganicsSpecialties Grand Total

- 58 -
Net Trade by Region
Other Asia, which is an important source of benzene, ABS, toluene, and urea, will increase its net imports from the U.S. by $0.5 billion based on a mix of greater
C2 and specialty imports, along with greater exports of aromatics
Other Asia is an important destination for acrylonitrile, TiO2, ethylene copolymers, xylenes, polyether polyols, polycarbonates and phenol from the U.S
U.S. Net Trade Balance, Other Asia(Million ton per year)
U.S. Net Trade Balance, Other Asia($Billions)
-6
-4
-2
0
2
4
6
8
2010 2015 2020 2025 2030$B
illion
per y
ear
C1 C2 C3C4 Aromatics InorganicsSpecialties Grand Total
-4
-3
-2
-1
0
1
2
3
4
5
6
2010 2015 2020 2025 2030
Millio
n Ton
s per
year
C1 C2 C3C4 Aromatics InorganicsSpecialties Grand Total

- 59 -
Net Trade by Region
Rest of World, which is an important source of urea and ethylene glycol, will decrease its net imports from the U.S. by $2.1 billion based on greater exports of C1 chemicals to the U.S.
Rest of World is an important destination for PVC from the U.S
U.S. Net Trade Balance, Rest of World(Million ton per year)
U.S. Net Trade Balance, Rest of World($Billions)
-5
-4
-3
-2
-1
0
1
2
3
4
5
2010 2015 2020 2025 2030$B
illion
per y
ear
C1 C2 C3C4 Aromatics InorganicsSpecialties Grand Total
-10
-8
-6
-4
-2
0
2
4
2010 2015 2020 2025 2030
Millio
n Ton
s per
year
C1 C2 C3C4 Aromatics InorganicsSpecialties Grand Total

- 60 -
Net Exports by Commodity Type and Region
Net exports to China, Other Americas and Mexico are forecast to account for $22.7 billion of the $28.5 billion in regional net export growth by 2030
Summary by Region: Although the U.S. is nearly in balance on a tons basis in 2014, the mix of higher value chemicals that are exported drives the over trade balance (for the selected chemicals) to a $19.5 billion surplus in 2014
U.S. Net Trade Balance, Regions of Interest(Million tons per year)
U.S. Net Trade Balance, Regions of Interest($Billions per year)
-20
-15
-10
-5
0
5
10
15
20
25
30
2010 2015 2020 2025 2030
Millio
n Ton
s per
year
Canada Mexico BrazilOther Americas Europe ChinaIndia Other Asia Rest of WorldTotal
-10
0
10
20
30
40
50
60
2010 2015 2020 2025 2030$B
illion
s per
year
Canada Mexico BrazilOther Americas Europe ChinaIndia Other Asia Rest of WorldTotal

- 61 -
Net Trade by Region
Summary: Net Trade by Region – With the exception of Canada and ROW, the U.S. has a positive net trade balance with all the other regions/countries as defined in this report
• Canada is a key source of C1 and C2 chemicals including: Polyethylene, Styrene, MEG, Urea and ammonia;Canada also supplies PTA and butadiene, while receiving C4 rubbers and polypropylene (Deficit remains at $3billion by 2030)
• Mexico is an important destination for para-xylene, polyethylene, styrene, polypropylene, polycarbonates,polyether polyols, and VCM (Surplus improves by $8.4 billion to $13.8 billion by 2030, growth of $5.4 billion)
• Brazil is an important destination for styrene, sodium hydroxide, polyether polyols, DAP (Surplus more thandoubles to $6.0 billion by 2030)
• Other Americas is an important destination for PE, PVC, DAP, styrene, acrylic polymers, sodium hydroxide, sodaash, and TiO2; Other Americas is a key source of ammonia and methanol (Surplus improves from $2.3 billion to$10.9 billion by 2030, growth of $8.6 billion)
• Europe is an important destination for TiO2, PVC, butadiene rubber, styrene, ethylene copolymers, acrylicpolymers and polyether polyols; Europe is a key source of ammonia, urea, butadiene, benzene and para-xylene(Surplus improves from $2.8 billion to $5.4 billion by 2030)
• China is an important destination for polycarbonates, PVC, para-xylene, styrene, caprolactam, MEG,polypropylene, PE and polyether polyols (Surplus improves by $3.0 billion to $11.7 billion by 2030, growth of $8.7billion)
• India is an important destination for DAP, phenol and acrylonitrile (Surplus improves by $0.4 billion to $2.1 billionby 2030)
• Other Asia is an important destination for acrylonitrile, TiO2, ethylene copolymers, xylenes, polyether polyols,polycarbonates and phenol and an important source of benzene, ABS, toluene, and urea (Surplus improves by$1.9 billion to $2.5 billion by 2030)
• Rest of World (ROW) is a important source of urea and ethylene glycol and is an important destination for PVC($1.0 surplus becomes a deficit of $0.9 billion by 2030)

- 62 -
Section 5Conclusions: Trade Trends and Policy Impacts

- 63 -
Conclusions: Trade Trends
The deficit in C1 chemicals will shrink by 35%, asadditional methanol, ammonia and urea capacity basedon natural gas feedstocks are constructed
Net exports of C2 chemicals, which includespolyethylene and PVC, will nearly double to 14.6 billiontons
Trade surplus for C3 chemicals will expand by 25% to 3billion tons
Due to the lightening of cracker feedstocks andcontinued importation of benzene and butadiene, thesmall trade deficit for C4s and aromatics will continue
The trade surplus for inorganics, which have loweraverage prices than the other materials, will increasefrom 10 billion tons to 13 billion tons
Due to relatively high prices, the trade surplus forspecialties has a relatively small impact on a weightbasis
On a weight basis, the largest impact is reduced C1 net imports and increased C2 net exports
Trade Trends by Category: On a weight basis, U.S. trade for the selected chemicals is projected to increase from a small deficit in 2014 to a surplus of 17 billion tons by 2030
U.S. Net Trade Balance, Categories of Interest(Million tons per year)
-30
-20
-10
0
10
20
30
40
2010 2015 2020 2025 2030
Millio
n Ton
s per
year
C1 C2 C3C4 Aromatics InorganicsSpecialties Grand Total

- 64 -
Conclusions: Trade Trends
Although balanced on a weight basis, the U.S. is insurplus by $19.5 billion on a value basis
The trade deficit in C1 chemicals will shrink as newnatural gas based ammonia and methanol plants arebuilt
Most importantly, driven by competitive advantagebased on low cost ethane and a massive investment innew crackers to make ethylene, net exports of C2chemicals will increase by $15 billion
C3 chemical exports will recover after on-purposesources of propylene are built
The trade deficit in aromatics and C4s will continue asthe U.S. continues to import large quantities of benzeneand butadiene
Note that net exports of specialties will increase from$11.2 billion in 2014 to $20.5 billion by 2030, based onintellectual property and competitive advantage
As a comparison, for 2013, total U.S. exports of goodswere $1,590.4 billion and imports were $2,293.5 billion,resulting in a goods deficit of $703 billion
The 2014 trade surplus of $19.5 billion for the selected chemicals represents 2.8% of the absolute value of the $703 billion 2013 U.S. trade deficit in “goods”
Trade Trends by Category: Due to higher “value-added” of exports compared to imports, the U.S. trade surplus for the selected chemicals is projected to increase from $19.5 billion in 2014 to $48.3 billion by 2030
U.S. Net Trade Balance, Categories of Interest($Billions per year*)
-20
-10
0
10
20
30
40
50
60
70
2010 2015 2020 2025 2030
$Billi
on pe
r yea
r
C1 C2 C3C4 Aromatics InorganicsSpecialties Grand Total
* Current dollars, assuming 2% inflation

- 65 -
Conclusions: Trade Trends
Trade Trends by Region: The value of chemical net exports reviewed herein will increase from $19.5 billion in 2014 to $48 billion per year by 2030, with the Americas (Canada, Mexico, Brazil, Other Americas) expected to remain the leading net export destination
• Canada: Deficit remains at $3 billion by 2030
• Mexico: Surplus improves by $8.4 billion to $13.8billion by 2030 (growth of $5.4 billion), but is notgrowing as fast as the overall net trade surplus
• Brazil: Surplus more than doubles to $6.0 billion by2030
• Other Americas: Surplus improves from $2.3 billionto $10.9 billion by 2030 (growth of $8.6 billion)
• Europe Surplus improves from $2.8 billion to $5.4billion by 2030
• China: Surplus improves by $3.0 billion to $11.7billion by 2030 (growth of $8.7 billion)
• India: Surplus improves by $0.4 billion to $2.1 billionby 2030
• Other Asia: Surplus improves by $1.9 billion to $2.5billion by 2030
• Rest of World: $1.0 surplus becomes a deficit of$0.9 billion by 2030
U.S. Net Trade Balance, Regions of Interest($Billions per year)
Net exports to China, Mexico, and Other Americas and are forecast to account for $22.7 billion of the $28.5 billion in regional net export growth
-10
0
10
20
30
40
50
60
2010 2015 2020 2025 2030
$Billi
ons p
er ye
ar
Canada Mexico BrazilOther Americas Europe ChinaIndia Other Asia Rest of WorldTotal

- 66 -
Conclusions: Trade Trends
The U.S. will remain in deficit for petrochemicals and fertilizers, and realize a modest improvement for inorganics, with the value of net exports growing at 4.0% CAGR
The biggest driver of the improving U.S. trade surplus will be polymers (with growth to $21.5 billion net exports by 2030), specialties (to $20.5 billion), and intermediates (to $9.15 billion of net exports)
U.S. Net Trade Balance, Commodities of Interest(Million tons per year)
U.S. Net Trade Balance, Commodities of Interest($Billions per year)
-10
0
10
20
30
40
50
60
2010 2015 2020 2025 2030$B
illion
s per
year
Fertilizers IntermediatesPetrochemicals Polymers & RubberInorganics SpecialtiesGrand Total
-20
-15
-10
-5
0
5
10
15
20
25
30
2010 2015 2020 2025 2030
Millio
n Ton
s per
year
Fertilizers IntermediatesPetrochemicals Polymers & RubberInorganics SpecialtiesGrand Total
- 67 -
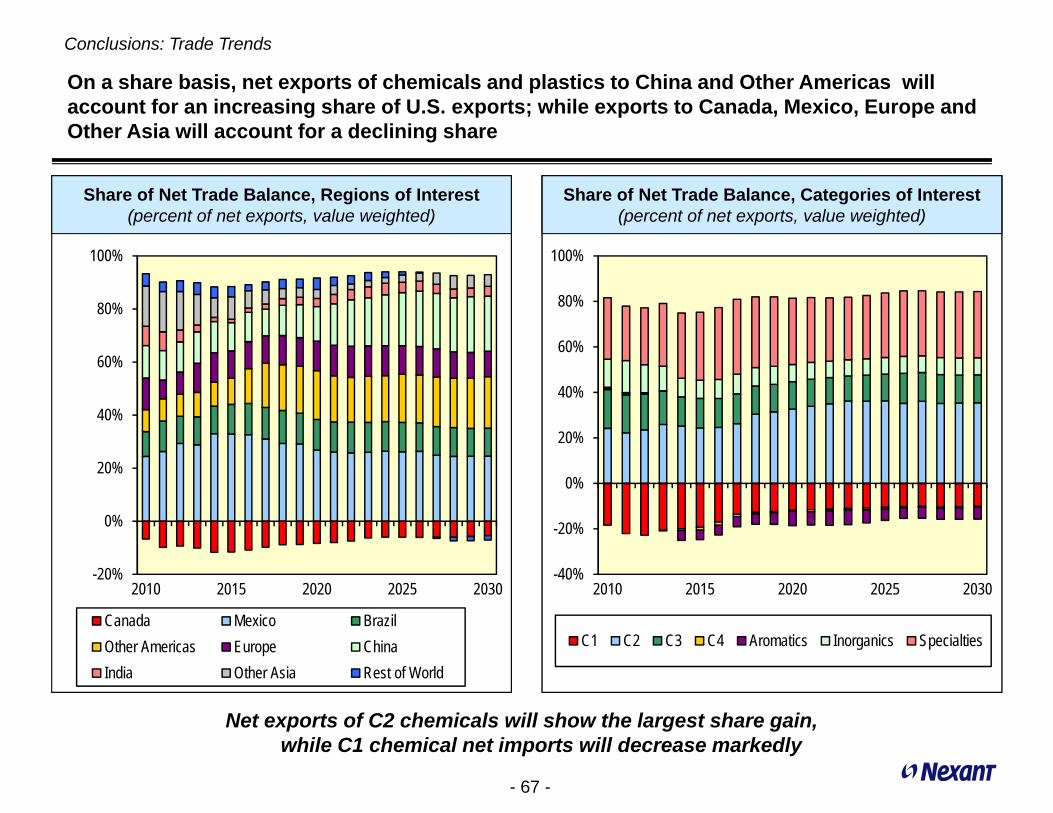
Conclusions: Trade Trends
Net exports of C2 chemicals will show the largest share gain, while C1 chemical net imports will decrease markedly
On a share basis, net exports of chemicals and plastics to China and Other Americas will account for an increasing share of U.S. exports; while exports to Canada, Mexico, Europe and Other Asia will account for a declining share
Share of Net Trade Balance, Categories of Interest(percent of net exports, value weighted)
Share of Net Trade Balance, Regions of Interest(percent of net exports, value weighted)
-20%
0%
20%
40%
60%
80%
100%
2010 2015 2020 2025 2030
Canada Mexico BrazilOther Americas Europe ChinaIndia Other Asia Rest of World
-40%
-20%
0%
20%
40%
60%
80%
100%
2010 2015 2020 2025 2030
C1 C2 C3 C4 Aromatics Inorganics Specialties

- 68 -
Conclusions: Trade Trends
The value of U.S. net exports will increase to $48.3 billion by 2030, representing 5.8% compounded value growth, with important improvements in the trade surplus for C1 chemicals, C2 chemicals and specialties
On a category basis: Shale gas and NGLs will have a positive impact on U.S. petrochemical investment and netexports for C1-C3 petrochemicals, and a negative impact on supply of aromatics, with relatively little impact on C4chemicals as follows:
• C1 – much fewer imports of methanol, ammonia and urea as new domestic capacity is added• Trade deficit shrinks from $20.5 billion to $13.2 billion in 2030
• C2 – much greater exports of ethylene derivatives based on feedstocks from new ethane steam crackers• Surplus more than doubles from $9.8 billion to $25 billion in 2030
• C3 – C3 derivative exports will recover after on-purpose sources of propylene are built• Net exports grow from $5.0 billion to $8.6 billion by 2030
• C4 – minor impact on net imports and exports of butadiene and derivatives• Deficit stays at approximately -$0.3 billion
• Aromatics – a minor change, with fewer net exports (or greater net imports) of most aromatics and derivatives• Net imports increase from $1.7 billion to $3.7 billion
• Inorganics – driven by lower energy costs, U.S. surplus will increase• Net exports increase from $3.2 billion to $5.3 billion
• Specialties – driven by technology and lower energy costs, will significantly improve the U.S. net export position• Net exports grow from $11.2 billion in 2014 to $20.5 billion

- 69 -
Conclusions: Trade Trends
Driven by increased exports of polymers and specialties to China, Mexico and Other Americas, the U.S. trade surplus for the commodities of interest will grow by $28.8 billion
On a regional basis, there will be a significant increase in exports of chemicals and plastics to China (growing from$3 billion to $11.7 billion), as well as to Other Americas (growing from $2.3 billion to $10.9 billion), Mexico (growingfrom $8.4 billion to $13.8 billion), and Europe (growing from $2.8 billion to $5.4 billion)
• Exports to Brazil will remain relatively flat on a weight basis as domestic capacity is added during the nextdecade
• Canada and Rest of World will be a source of net imports
On a commodity basis, the biggest driver of the improving U.S. trade surplus will be polymers (with almost $15billion in net export growth) and specialties ($9.3 billion of increased net exports), with moderate growth inintermediates ($3.1 billion in net export growth)
• Although the overall position will improve, the U.S. will remain in deficit for petrochemicals ($0.7 billionimprovement – fewer imports)
• The U.S. will import less fertilizers (deficit shrinks by 2.4 million tons), but due to higher prices, net importsincreases by $0.5 billion
Polymers and specialties will be the commodities that gain the most net export value

- 70 -
Conclusions: Trade Trends
Of the $63 billion increase in exports, net exports are forecast to increase by $29 billion
Although not part of the scope of this report, Nexant estimates that exports of “commodities of interest” will more than double from $60 billion in 2014 to $123 billion by 2030, with exports to the Americas expected to account for approximately half of total export value
U.S. Exports: Regions of Interest(Million tons per year)
U.S. Exports, Regions of Interest($Billions per year*)
0
10
20
30
40
50
60
70
80
2010 2015 2020 2025 2030
Expo
rt Vo
lume (
milli
on to
ns)
Canada Mexico BrazilOther Americas Europe ChinaIndia Other Asia Rest of WorldTotal
0
20
40
60
80
100
120
140
2010 2015 2020 2025 2030
Expo
rts ($
billio
ns)
Canada Mexico BrazilOther Americas Europe ChinaIndia Other Asia Rest of WorldTotal
* Current dollars, assuming 2% inflation

- 71 -
Section 5Conclusions: Policy Implications

- 72 -
Conclusions: Policy Impacts
Regulatory Environment: U.S. Government policies play an important supporting role for future chemicals investment based on how it regulates key feedstocks like oil, gas and NGLs
U.S. government control of energy exports plays an indirect role in supporting petrochemical investment
U.S. government currently limits its role relative to fossil fuels to the following:
• Ensuring energy security
• Controlling energy imports and exports (especially crude oil)
• Supporting advanced research and development
Although “crude oil” exports are prohibited except as exempted by regulation, the regime is gentlerfor other fuels. Exports of coal, petroleum products, natural gas and petrochemical feedstocks maybe restricted at the discretion of the executive branch, but they are not blocked by EPCA
Hence, refined products and petrochemicals are internationally traded at will based on market supplyand demand, and the shale revolution has created a multi-decade opportunity for increasedpetrochemical production and exports
However, the uncertainty around the future of gas and condensate exports could be a critical factorin determining future feedstock costs

- 73 -
Conclusions: Policy Impacts
Shale Gas and NGLs: The success of U.S. E&P firms in shale gas and oil exploitation are unique to the U.S. in most cases and unlikely to be soon matched anywhere else in the world
…However, eventually one or more other regions will find ways to profitably exploit their local shale resource
Factors and Policies supporting U.S. Shale Gas and Tight Oil Development:
• Liberalized natural gas market
• Competitive industry with many entrepreneurial companies
• Industry’s focus on technological innovation
• Vast, independent oil field service sector
• Extensive natural gas processing and pipeline infrastructure
• Financial markets offering many funding options
• Incentives for private landowners to provide land access
• Favorable fiscal and regulatory structure

- 74 -
Conclusions: Policy Impacts
Foreign Direct Investment: In addition to low-cost gas and NGL feedstocks, one of the attractive features of investing in U.S. petrochemical production is access to the U.S. free market economy
Access to advantaged feedstocks and U.S. infrastructure are key reasons for continuing local and foreign direct investment in the U.S.
• As a free market, most foreign companies are welcome to make an investment in the U.S.
• Investment can be with a local partner or independently, but the advantages of access toinexpensive feedstocks, land, labor, infrastructure, and shipping apply to everyone
• In addition, an investment in the U.S. can be made with confidence about the future of thecountry — the rule of law, the availability of gas and NGLs, and the well-balanced regulatoryenvironment

- 75 -
Conclusions: Policy Impacts
Investment Drivers: Access to low-cost feedstocks and technology will drive investment in U.S. petrochemicals, fertilizers, polymers and specialty chemicals
There are very few places in the world where all of the factors necessary for competitive success in chemicals are available to domestic and outside investors
Commodity Chemicals Competitiveness Criteria

- 76 -
Conclusions: Policy Impacts
Reducing or eliminating protective tariffs on polymers in particular could have a large impact on the growth of U.S. net exports
Tariffs and Global Trade Barriers: Historic movement towards greater free trade is expected to continue for leading export destinations, which will enable the U.S. to share its shale gas bounty with the world
TPP* and TTIP** Countries and potential new countries
Example: For LLDPE
Assuming that TTIP is completedbetween the U.S. and the EU,Nexant assumes that 6.5% dutieson LLDPE to Europe could beeliminated by 2017
Furthermore, in the Pacific Region,the TPP would eliminate duties onpolyethylene with Japan (6.5%)and Malaysia (15%). Korea’s4.5% tariff on LLDPE may also beeliminated as the FTA with Koreareaches maturity
Chinese polyethylene tariffs of6.5% could also decline if theyeventually negotiate a FTA with theU.S. or join TPP
http://www.cfr.org/councilofcouncils/global_memos/p32417?cid=rss-economics-the_high_stakes_in_regional_tr-111413* (TTP) – Trans Pacific Partnership** (TTIP) - US-EU Transatlantic Trade and Investment Partnership

- 77 -
Conclusions: Policy Impacts
The eventual inclusion of China and other non-TPP nations in APEC would have a more significant and positive impact on chemicals trade
Tariffs and Global Trade Barriers: The current TPP countries would provide an incremental change in free trade for the U.S.
U.S.-World, APEC, and TPP Goods Trade(in billions of U.S. dollars)
Impact of TPP
For the U.S., the most importantelement of the current TPP is theaddition of Japan as a free tradepartner, which represented over $200billion in “total goods trade” in 2013
All 12 TPP partners shown in orangeon the chart are also members of theAsia-Pacific Economic Cooperation(APEC) forum
China, which represented over $500billion in “total goods trade”, hasexpressed moderate interest in joiningTPP, but this is clearly well down theroad
Several other APEC nations have alsoexpressed varying levels of interest

- 78 -
Conclusions: Policy Impacts
Relative to net exports of chemicals, the TTIP is probably the most important FTA under negotiation by the U.S. government
Tariffs and Global Trade Barriers: The current TPP, which includes Canada, Mexico, Korea, and other countries with U.S. FTAs, would represent 41.3% of U.S. goods trade in 2013
U.S. and EU Goods Trade(in billions of U.S. dollars)
Impact of TTIP
The TTIP, would represent 16.9% of“total goods trade” across the U.S.border and 14.2% across the EU’sborder
As a significant portion of C2chemicals and specialties trade isexpected to target Europe, the TTIPcould have a significant impact ontrade flows of chemicals
Overall trade with Europe is greaterthan trade with new FTA partners inthe TPP (Japan, Brunei, Malaysia,New Zealand, and Vietnam);therefore, Nexant expects that,compared to TPP, completion of theTTIP would likely have a larger impacton chemicals trade
http://www.europarl.europa.eu/RegData/etudes/briefing_note/join/2014/522349/EXPO-INTA_SP%282014%29522349_EN.pdf

- 79 -
Appendix AForecast, Net Exports by Subsector

- 80 -
Appendix A
The methanol trade balance is expected toimprove in the short term.
China is expected in became a large netimporter of methanol from the U.S. as theyexecute their methanol to olefins (MTO)self-sufficiency plan
Depending on the restrictions on the exportof natural gas, and the resulting price,methanol net exports from “OtherAmericas” and ROW could resume later inthe 2020s
Petrochemicals: C1: The methanol net trade deficit will disappear
Net Trade Balance, Petrochemicals: C1(Million ton per year)
-8
-6
-4
-2
0
2
4
6
2010 2012 2014 2016 2018 2020 2022 2024 2026 2028 2030
Millio
n ton
s/yea
r
Canada Mexico BrazilOther Americas Europe ChinaIndia Other Asia Rest of World

- 81 -
Appendix A
Styrene and VAM should remainadvantaged exports due to low costethylene and conversion energy (naturalgas)
Petrochemicals: C2: Styrene, VAM
Net Trade Balance, Petrochemicals: C2(Million ton per year)
-1.0
-0.5
0.0
0.5
1.0
1.5
2.0
2.5
3.0
2010 2012 2014 2016 2018 2020 2022 2024 2026 2028 2030
Millio
n ton
s/yea
r
Canada Mexico BrazilOther Americas Europe ChinaIndia Other Asia Rest of World

- 82 -
Appendix A
C3 petrochemical net exports havedeclined with the availability of propylene
With the installation of new on-purposepropylene via PDH and MTO, the U.S.should be able to resume at least a portionof its previous position
Petrochemicals: C3: 2EH, iPropanol, n-butanol, 2EH Acrylate, butyl acrylate, propylene glycol
Net Trade Balance, Petrochemicals: C3(Million ton per year)
-0.1
0.0
0.1
0.2
0.3
0.4
0.5
0.6
0.7
0.8
0.9
2010 2012 2014 2016 2018 2020 2022 2024 2026 2028 2030
Millio
n ton
s/yea
r
Canada Mexico BrazilOther Americas Europe ChinaIndia Other Asia Rest of World

- 83 -
Appendix A
Butadiene will increasingly be imported asdomestic sources have declined with thelightening of cracker feedstocks
Petrochemicals: C4: 1,3-Butadiene
Net Trade Balance, Petrochemicals: C4(Million ton per year)
-0.6
-0.5
-0.4
-0.3
-0.2
-0.1
0.0
0.1
2010 2012 2014 2016 2018 2020 2022 2024 2026 2028 2030
Millio
n ton
s/yea
r
Canada Mexico BrazilOther Americas Europe ChinaIndia Other Asia Rest of World

- 84 -
Appendix A
Aromatic petrochemicals, especiallybenzene will be increasingly imported asdomestic sources have declined with thelightening of cracker feedstocks
Petrochemicals: Aromatics: Benzene, xylene, toluene, Phthalic Anhydride
Net Trade Balance, Petrochemicals: Aromatics (Million ton per year)
-3.5
-3.0
-2.5
-2.0
-1.5
-1.0
-0.5
0.0
0.5
2010 2012 2014 2016 2018 2020 2022 2024 2026 2028 2030
Millio
n ton
s/yea
r
Canada Mexico BrazilOther Americas Europe ChinaIndia Other Asia Rest of World

- 85 -
Appendix A
Shale gas NGLs provides a hugeadvantage to the USA for exports of EDC,VCM and MEG to China for producing PVCand polyester
Intermediates: C2: EDC, MEG, VCM
Net Trade Balance, Intermediates: C2(Million ton per year)
-2.0
-1.0
0.0
1.0
2.0
3.0
4.0
5.0
6.0
2010 2012 2014 2016 2018 2020 2022 2024 2026 2028 2030
Millio
n ton
s/yea
r
Canada Mexico BrazilOther Americas Europe ChinaIndia Other Asia Rest of World

- 86 -
Appendix A
The large decrease in exports of phenoland acrylonitrile from 2012-2014 was drivenby economics of reduced propylene supply
With the installation of new on-purposepropylene via PDH and MTO, the U.S.should be able to resume at least a portionof its previous position
Intermediates: C3: Acrylonitrile, Cumene, Phenol, PO, Polyether polyols
Net Trade Balance, Intermediates: C3(Million ton per year)
0.0
0.5
1.0
1.5
2.0
2.5
2010 2012 2014 2016 2018 2020 2022 2024 2026 2028 2030
Millio
n ton
s/yea
r
Canada Mexico BrazilOther Americas Europe ChinaIndia Other Asia Rest of World
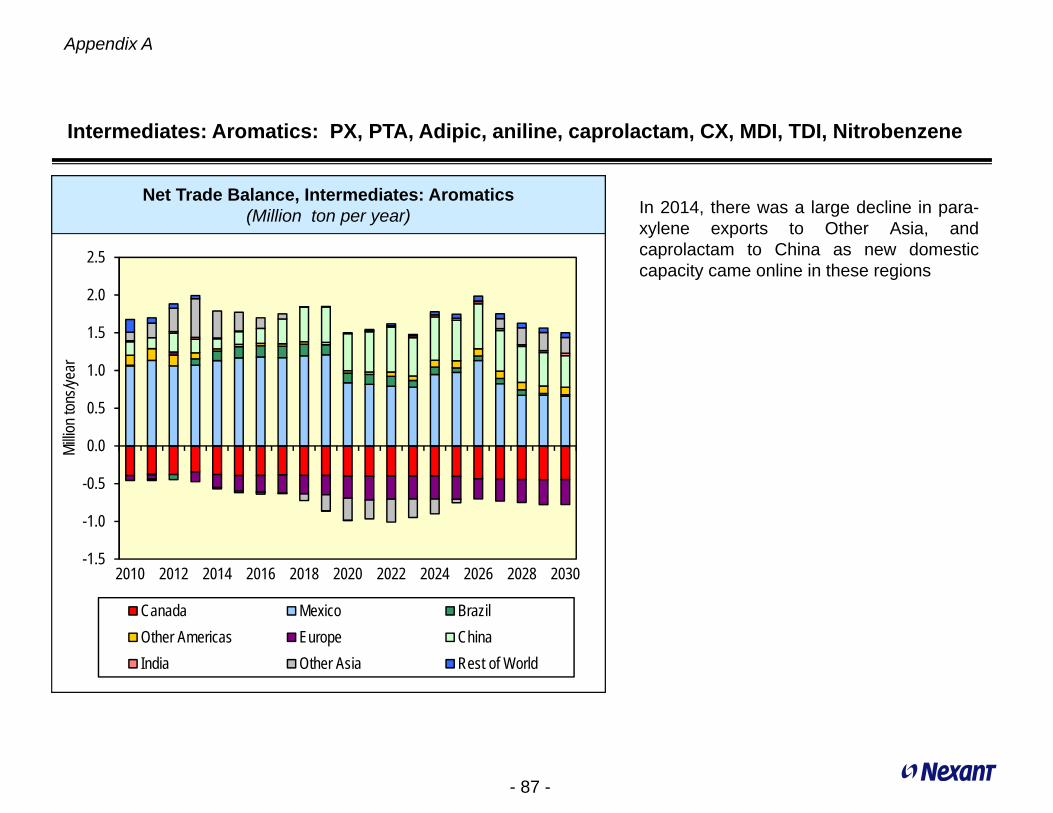
- 87 -
Appendix A
In 2014, there was a large decline in para-xylene exports to Other Asia, andcaprolactam to China as new domesticcapacity came online in these regions
Intermediates: Aromatics: PX, PTA, Adipic, aniline, caprolactam, CX, MDI, TDI, Nitrobenzene
Net Trade Balance, Intermediates: Aromatics(Million ton per year)
-1.5
-1.0
-0.5
0.0
0.5
1.0
1.5
2.0
2.5
2010 2012 2014 2016 2018 2020 2022 2024 2026 2028 2030
Millio
n ton
s/yea
r
Canada Mexico BrazilOther Americas Europe ChinaIndia Other Asia Rest of World

- 88 -
Appendix A
There will be a large increase inpolyethylene and PVC net exports to China,Europe and Other Americas as newethane–based steam crackers andderivative capacity is installed in the U.S.
Plastic Resins & Rubber: C2: Polyethylene and PVC are expected to drive the exports of C2 based polymers
Net Trade Balance, Plastic Resins & Rubber: C2 (Million ton per year)
-4
-2
0
2
4
6
8
10
12
2010 2012 2014 2016 2018 2020 2022 2024 2026 2028 2030
Millio
n ton
s/yea
r
Canada Mexico BrazilOther Americas Europe ChinaIndia Other Asia Rest of World

- 89 -
Appendix A
C3 polymer net exports have declined withthe availability of propylene
With the installation of new on-purposepropylene via PDH and MTO, the U.S.should be able to resume at least a portionof its previous position, as integratedsuppliers of polypropylene gain competitiveadvantage for shipments to China, India,and Other Americas
Plastic Resins & Rubber: C3: Polypropylene, acrylic polymers, polycarbonate
Net Trade Balance, Plastic Resins & Rubber: C3(Million ton per year)
-1.0
-0.5
0.0
0.5
1.0
1.5
2.0
2010 2012 2014 2016 2018 2020 2022 2024 2026 2028 2030
Millio
n ton
s/yea
r
Canada Mexico BrazilOther Americas Europe ChinaIndia Other Asia Rest of World

- 90 -
Appendix A
Mexico already imports butadiene (which isdifficult/expensive to ship) and is adding tirecapacity. Mexico is likely to import rubberand ABS rather than add butadienecapacity
Much of this category goes into tires andvehicles. As new tire factories are built inthe U.S., rubber requirements will increase,and existing rubber capacity will refill.
However, ABS, which is largely importedfrom Other Asia, will continue to beimported
Plastic Resins & Rubber: C4: PBR, SBR, ABS
Net Trade Balance, Plastic Resins & Rubber: C4(Million ton per year)
-0.4
-0.3
-0.2
-0.1
0.0
0.1
0.2
0.3
0.4
0.5
2010 2012 2014 2016 2018 2020 2022 2024 2026 2028 2030
Millio
n ton
s/yea
r
Canada Mexico BrazilOther Americas Europe ChinaIndia Other Asia Rest of World

- 91 -
Appendix A
2 new PET units open in 2016 in USGCeliminating imports from Mexico, India andother Asia
Plastic Resins & Rubber: Aromatics: PET
Net Trade Balance, Plastic Resins & Rubber: Aromatics(Million ton per year)
-0.8
-0.6
-0.4
-0.2
0.0
0.2
0.4
2010 2012 2014 2016 2018 2020 2022 2024 2026 2028 2030
Millio
n ton
s/yea
r
Canada Mexico BrazilOther Americas Europe ChinaIndia Other Asia Rest of World

- 92 -
Appendix A
The C1 Fertilizers (ammonia and urea)trade deficit should decrease as newcapacity is installed
Depending on the restrictions on the exportof natural gas, and the resulting price, C1Fertilizers net imports could be even lessthan shown here, as additional capacity isinstalled
Fertilizers: C1: Ammonia & Urea
Net Trade Balance, Fertilizers: C1(Million ton per year)
-18
-16
-14
-12
-10
-8
-6
-4
-2
0
2
2010 2015 2020 2025 2030
Millio
n ton
s per
year
Canada Mexico BrazilOther Americas Europe ChinaIndia Other Asia Rest of World

- 93 -
Appendix A
New capacity and production in China nowsupports India’s import needs, as thetransportation cost is much lower for thisregional destination
The U.S. can remain an exporter of theseinorganic fertilizers to other nearby regions
Fertilizers: Inorganics: Monoammonium phosphate (MAP), diammonium phosphate (DAP)
Net Trade Balance, Fertilizers: Inorganics(Million ton per year)
-2
-1
0
1
2
3
4
5
6
7
2010 2015 2020 2025 2030
Millio
n ton
s per
year
Canada Mexico BrazilOther Americas Europe ChinaIndia Other Asia Rest of World

- 94 -
Appendix A
Other inorganics, of which a large portion issold to Brazil and “Other Americas”, shouldresume its historic growth trend as worldeconomies recover from the recenteconomic softening
Inorganics: Caustic soda, soda ash, sulfuric acid, titanium dioxide are largely sold in the Americas
Net Trade Balance, Inorganics(Million ton per year)
-4
-2
0
2
4
6
8
10
12
2010 2015 2020 2025 2030
Millio
n ton
s per
year
Canada Mexico BrazilOther Americas Europe ChinaIndia Other Asia Rest of WorldGrand Total
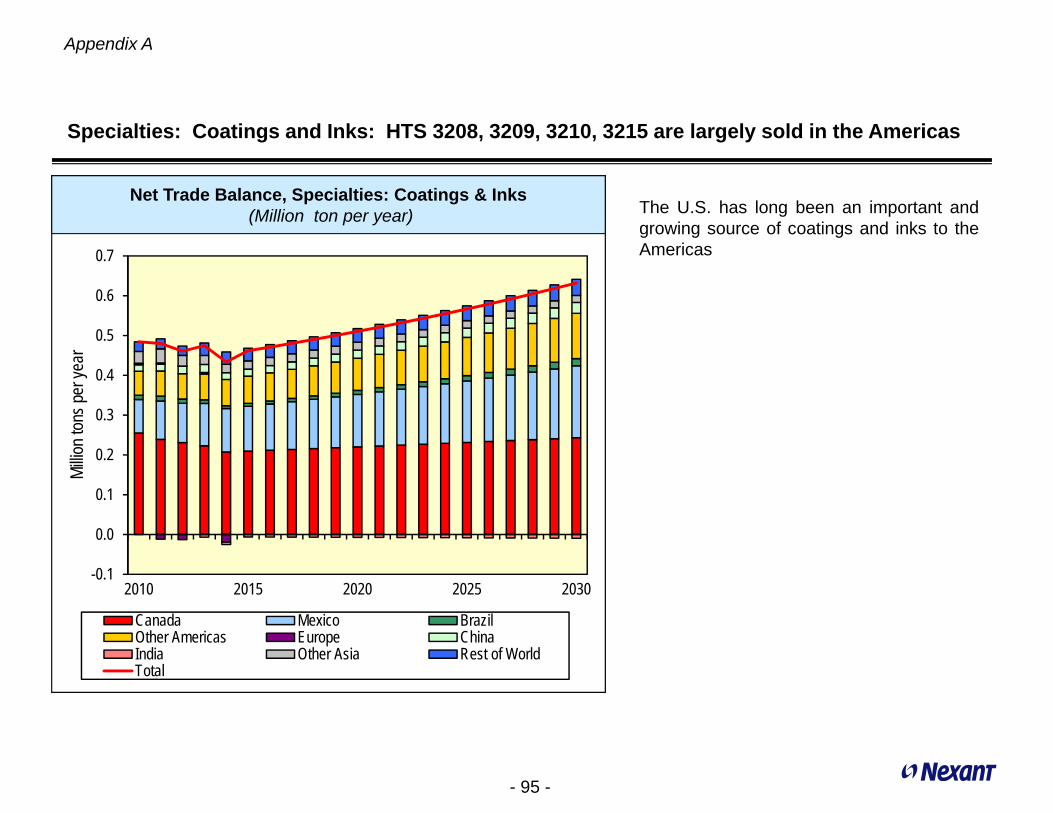
- 95 -
Appendix A
The U.S. has long been an important andgrowing source of coatings and inks to theAmericas
Specialties: Coatings and Inks: HTS 3208, 3209, 3210, 3215 are largely sold in the Americas
Net Trade Balance, Specialties: Coatings & Inks(Million ton per year)
-0.1
0.0
0.1
0.2
0.3
0.4
0.5
0.6
0.7
2010 2015 2020 2025 2030
Millio
n ton
s per
year
Canada Mexico BrazilOther Americas Europe ChinaIndia Other Asia Rest of WorldTotal

- 96 -
Appendix A
The U.S. has a strong and growing positionin miscellaneous specialty chemicalsincluding:
• 3801 Artificial Graphite; Collodial Graphite &Prep
• 3809 Finishing Agents Etc For Textiles,Paper
• 3810 Pickling Preps For Metal; Soldering
• 3811 Antiknock Preps & Other Additives ForMineral Oils
• 3812 Prepared Rubber Accelerators;Plasticizers Etc.
• 3813 Prep & Charges For Fire-extinguishers
• 3815 Reaction Initiators & Catalysts
• 3818 Chem Elem Doped, Used In Electron,Discs Wafers
• 3819 Hydraulic Brake & Transmission Fluids
• 3821 Prepared Culture Media For Devel't ofMicroorganisms
• 3822 Composite Diagnostic/lab Reagents,Exc Pharmaceutical
Specialties: Miscellaneous: HTS 38 (3809-3813, 3815, 3818, 3819, 3821, 3822)
Net Trade Balance, Specialties: Miscellaneous(Million ton per year)
-0.2
0.0
0.2
0.4
0.6
0.8
1.0
1.2
1.4
1.6
2010 2015 2020 2025 2030
Millio
n ton
s per
year
Canada Mexico BrazilOther Americas Europe ChinaIndia Other Asia Rest of WorldTotal

- 97 -
Appendix BNexant’s Simulator Methodology and Assumptions

- 98 -
Markets and prices are inherently linked. Crude oil and inflation scenarios influence costs. Economic growth scenarios directly influence markets
Nexant’s Petrochemical Simulator prepares forecasts of the global petro-chemical industry, with self consistent outlooks for markets and prices
CAPACITY
CONSUMPTION
SUPPLY DEMAND MODEL
PLANT MARGINS
PROFITABILITY CORRELATIONS
OPERATING RATES
COST MODELS
PRODUCT PRICES
PRICE COMPETITION
ECONOMIC GROWTH
CRUDE OILINFLATION
EXCHANGE RATES
SCENARIO INPUTS
Nexant’s Petrochemical Simulator Market Forecast Methodology
Appendix B

- 99 -
Economic Growth will slow in China
-6%
-4%
-2%
0%
2%
4%
6%
8%
10%
12%
14%
16%
1980 1985 1990 1995 2000 2005 2010 2015 2020 2025 2030
World North America Western Europe Japan China
Annu
al rea
l cha
nge i
n GDP
ScenarioActual
XL: 00235\09.01.06.1\13\WE\Sec2
World Economic Performance and Outlook(Real change in GDP)
The outlook for economic growth scenario has been developed to follow an eight year cycle. 2007 marks the most recent peak of the world economic cycle, and the next peaks are
nominally placed in 2015 and 2023.
Appendix B

- 100 -
Nexant retains a flat trend line exchange rate forecast to reflect the view that inflation and growth rates will be similar in the U.S. and the EU
Nexant’s outlook assumes a stable $1.30 = €1.00 long term trend, close to the average of the last decade
0.00
0.20
0.40
0.60
0.80
1.00
1.20
1.40
1.60
1.80
1983 1986 1989 1992 1995 1998 2001 2004 2007 2010 2013Historic Rate Continuous Average4 Year Average Forecast
US D
ollar
s pe
r eur
o
XL: 00235\09.01.06.1\13\WE\Sec2
Euro Versus U.S. Dollar
Appendix B

- 101 -
Even though recent operating rates have lagged in the USA, low cost feedstocks have lifted the profitability of many products well above the long-term trendline
Margins are dependent upon the tightness of the market, typically measured by the average industry operating rate
Return on Capital and Operating Rate(U.S.)
Appendix B

- 102 -
The Petrochemical Simulator produces a price and profitability forecast that is inherently linked to the market dynamics scenario projected
0%
10%
20%
30%
40%
50%
60%
70%
80%
90%
100%
1990 1995 2000 2005 2010 2015 2020 2025 2030
ROI Operating Cycle
Actual Forecast
XL: 00235\09.01.06.1\12\US\Sec2
Return on Capital and Operating Rate(U.S. Petrochemical Industry)
Capacity expansions in the next two to three years are known and factored into the projections. Beyond the short term, the outcome of the cycle is speculative since it depends on unforeseen
events as well as economic performance and the degree of over or under investment in the industry
Appendix B

- 103 -
Appendix CTrade Agreements that could Impact Trade

- 104 -
TPP is not finished yet, but is scheduled to begin in2015
The countries currently party to the agreement —currently including Australia, Brunei, Chile, Malaysia,
Mexico, New Zealand, Canada, Peru,Singapore, Vietnam, most critically Japanand potentially Korea — are some of the U.S.'biggest and fastest-growing commercial partners,accounting for $1.5 trillion worth of trade in goods in2012 and $242 billion worth of services in 2011.
They're responsible for 40 percent of the world'sGDP and 26 percent of the world's trade.
Trans Pacific Partnership (TPP) Free Trade Agreement (FTA) is still being negotiated
http://www.washingtonpost.com/blogs/wonkblog/wp/2013/12/11/everything-you-need-to-know-about-the-trans-pacific-partnership/
Trans Pacific Partnership
Appendix C

- 105 -
There are a number of existing FTA among the partiesnegotiating the TPP
In addition, there is a parallel effort to negotiate a FTAbetween U.S. and the E.U. called the TransatlanticTrade and Investment Partnership (TTIP)
Trans Pacific Partnership
Actual Scenario
http://www.washingtonpost.com/blogs/wonkblog/wp/2013/12/11/everything-you-need-to-know-about-the-trans-pacific-partnership/
Existing Free Trade Agreements Among TPP Countries
Appendix C

- 106 -
TTIP is particularly significant as an opportunityfor both sides to gain strategic market access toeach other’s economies
For instance, shortly after Japan announcedplans to join the TPP negotiations, the EU andJapan stated their intent to negotiate a bilateralFTA
The EU-Canada Comprehensive Economic andTrade Agreement (CETA), reached in October2013, makes the absence of a U.S.-EU FTA allthe more notable, as now both the U.S. and EUseparately have FTAs with Canada and Mexico
The two sides have had just three roundscompared to more than 30 in the negotiationstowards TTIP’s Asian cousin, the Trans-PacificPartnership
Transatlantic Trade and Investment Partnership (TTIP) is still at an early stage
Actual Scenario
http://transatlantic.sais-jhu.edu/publications/CRS_TTIP_report_Feb_2014.pdf
Largest U.S. Free Trade Agreements (FTAs): Economic Area, 2012
Appendix C

- 107 -
Appendix DHistoric Net Exports by Category

- 108 -
Appendix D: Historic Net Exports
Using $millions as the metric for netexports:
• Plastics and rubber have reboundedsince the recession
• Intermediates and Inorganics (excludingDAP & MAP) have also shown growth
• Petrochemicals have become balanced
• Fertilizers have reached a net tradedeficit
However, the increase in oil prices since 2009 has had a significant impact on net exports
Since 2009, fertilizers have dragged down the net trade balance for chemicals
Net Trade Balance, selected chemicals($Millions)
-10000
-5000
0
5000
10000
15000
20000
25000
2009 2010 2011 2012 2013
$milli
ons p
er ye
ar
Fertilizers Inorganic Chemicals Petrochemicals Intermediates Plastics & Rubber Grand Total

- 109 -
Appendix D: Historic Net Exports
The overall net trade balance declinedsharply in 2010, but has remained flatthrough 2013
• Inorganics (excluding DAP & MAP, whichare included in fertilizers) andintermediates have shown moderategrowth
• Petrochemicals have been flat andremained in deficit
• Plastics and rubber have also been flat
Using ktons instead of $millions shows that the trade balance for these chemicals has been flat to moderate growth for most chemicals other than fertilizers, which had a steep decline in 2010
Net Trade Balance, selected chemicals(metric ktons)
-15000
-10000
-5000
0
5000
10000
15000
2009 2010 2011 2012 2013
ktons
per y
ear
Fertilizers Inorganic Chemicals Petrochemicals Intermediates Plastics & Rubber Grand Total

- 110 -
Appendix D: Historic Net Exports
Using $millions as the metric for netexports:
• C1 Chemicals have sunk further intodeficit, as ammonia and urea importshave increased
• C2 and C3 have rebounded since therecession, though C3 has flattened
• C4 have remained balanced
• Aromatics increased and then declined
• Inorganics (including DAP & MAPfertilizers) rebounded and then declined
Since the 2009 recession , C2 and C3 chemicals have had solid net export growth
Net Trade Balance, selected chemicals($Millions)
-15000
-10000
-5000
0
5000
10000
15000
20000
25000
2009 2010 2011 2012 2013
$milli
ons p
er ye
ar
C1 Chemicals C2 Chemicals C3 Chemicals C4 Chemicals Aromatics Inorganics Grand Total

- 111 -
Appendix D: Historic Net Exports
Net trade in aromatics and C4 chemicals isrelatively minor compared to the othercategories
Note: Inorganics here includes DAP & MAP(fertilizers), as well as soda ash, sodiumhydroxide, sulfuric acid, and titaniumhydroxide
C1 Chemicals have sunk further into deficit, while C2, C3 and inorganics have remained in surplus
Net Trade Balance, selected chemicals(metric ktons)
-25000
-20000
-15000
-10000
-5000
0
5000
10000
15000
2009 2010 2011 2012 2013
ktons
per y
ear
C1 Chemicals C2 Chemicals C3 Chemicals C4 Chemicals Aromatics Inorganics Grand Total

- 112 -
Appendix EHistoric Net Exports by Chemical and Category

- 113 -
Appendix E: Historic Net Exports
Methanol and benzene are key drivers ofthe petrochemicals trade deficit
Petrochemicals have been mixed, with Styrene improving . . .
Net Trade Balance, Petrochemicals: Aromatics, C1, C2($Millions)
-$2,500
-$2,000
-$1,500
-$1,000
-$500
$0
$500
$1,000
$1,500
$2,000
2009 2010 2011 2012 2013
Net E
xpor
ts ($
millio
ns)
Benzene Mixed Xylene IsomersPhthalic Anhydride TolueneMethanol StyreneVinyl Acetate

- 114 -
Appendix E: Historic Net Exports
Butadiene imports result in in a signicantdeficit for C4s
C3 Petrochemicals have a minor surplus driven by butyl acrylate . . .
Net Trade Balance, Petrochemicals: C3 & C4($Millions)
-$800
-$600
-$400
-$200
$0
$200
$400
$600
2009 2010 2011 2012 2013
Net E
xpor
ts ($
millio
ns)
2-ethyl-1-hexyl Acrylate 2-ethylhexan-1-olButyl Acrylate isoPropanoln-butyl Alcohol Propylene GlycolButa-1,3-diene
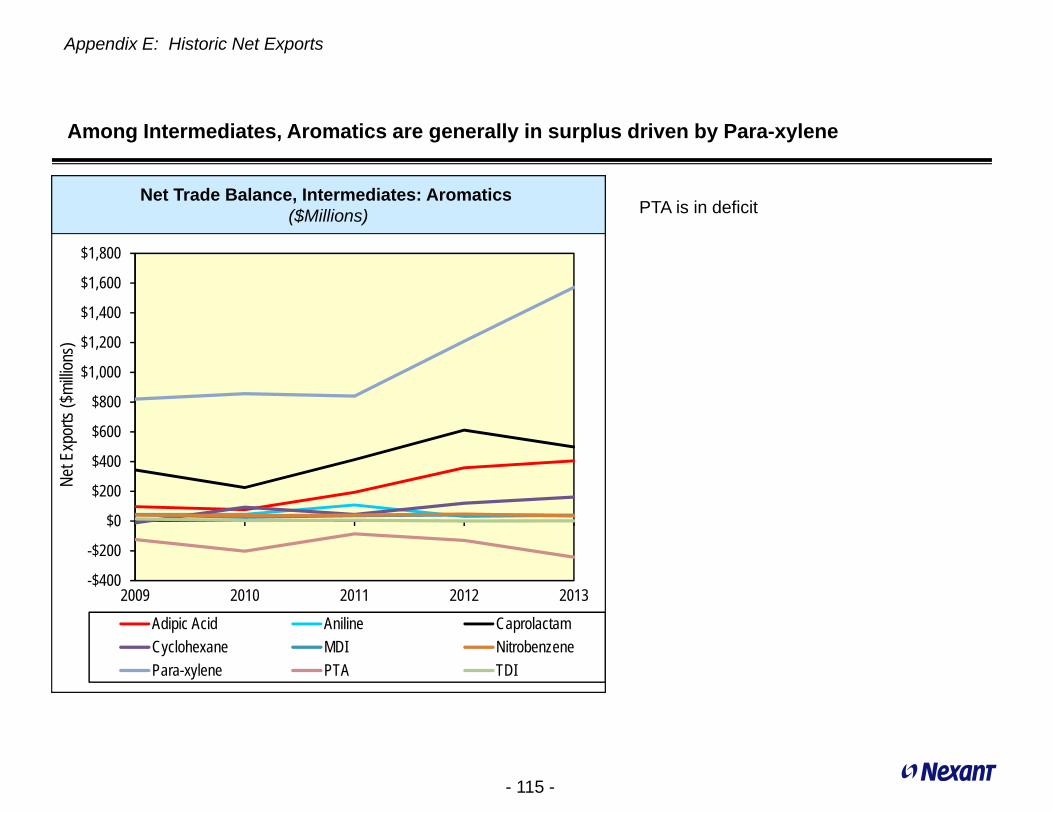
- 115 -
Appendix E: Historic Net Exports
PTA is in deficit
Among Intermediates, Aromatics are generally in surplus driven by Para-xylene
Net Trade Balance, Intermediates: Aromatics ($Millions)
-$400
-$200
$0
$200
$400
$600
$800
$1,000
$1,200
$1,400
$1,600
$1,800
2009 2010 2011 2012 2013
Net E
xpor
ts ($
millio
ns)
Adipic Acid Aniline CaprolactamCyclohexane MDI NitrobenzenePara-xylene PTA TDI

- 116 -
Appendix E: Historic Net Exports
MEG is in deficit
Intermediates are in surplus, largely driven by polyether polyols and acrylonitrile
Net Trade Balance, Intermediates: C2, C3 ($Millions)
-$1,000
-$500
$0
$500
$1,000
$1,500
2009 2010 2011 2012 2013
Net E
xpor
ts ($
millio
ns)
EDC Ethylene Glycol VCMAcrylonitrile Cumene PhenolPolyether Polyols Propylene Oxide
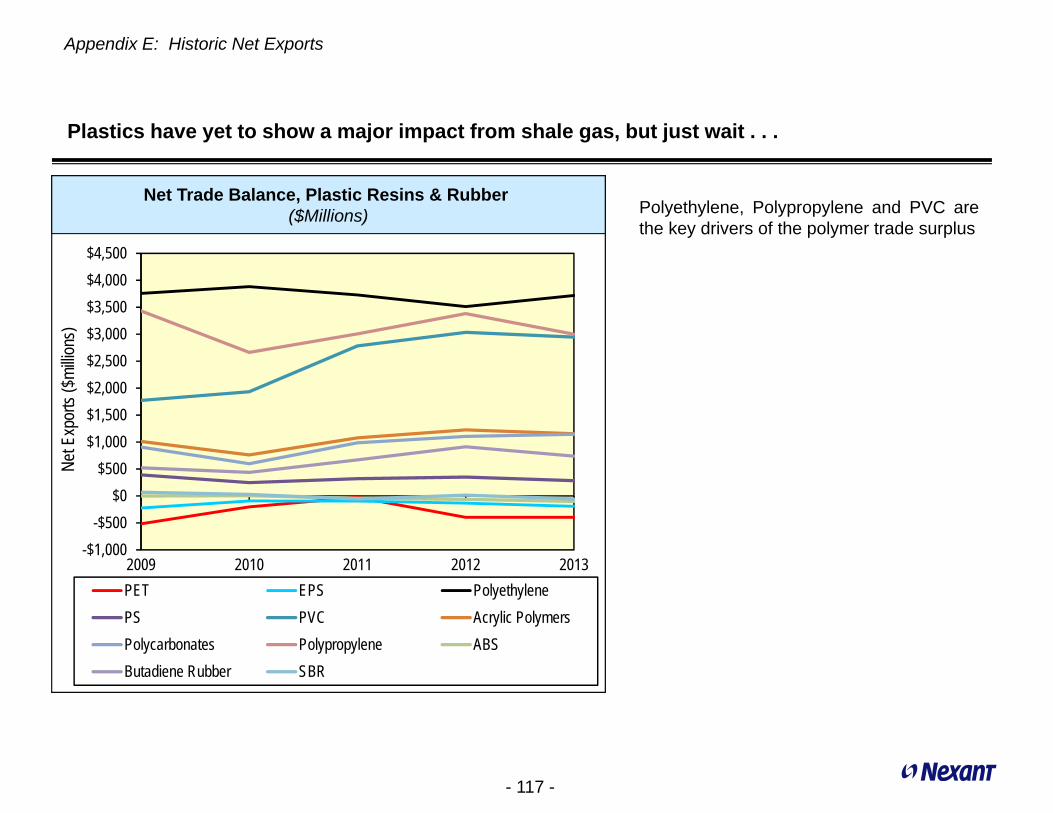
- 117 -
Appendix E: Historic Net Exports
Polyethylene, Polypropylene and PVC arethe key drivers of the polymer trade surplus
Plastics have yet to show a major impact from shale gas, but just wait . . .
Net Trade Balance, Plastic Resins & Rubber ($Millions)
-$1,000-$500
$0$500
$1,000$1,500$2,000$2,500$3,000$3,500$4,000$4,500
2009 2010 2011 2012 2013
Net E
xpor
ts ($
millio
ns)
PET EPS PolyethylenePS PVC Acrylic PolymersPolycarbonates Polypropylene ABSButadiene Rubber SBR

- 118 -
Appendix E: Historic Net Exports
Only DAP/MAP are running a trade surplus
Fertilizers of interest are running a $5 billion trade deficit
Net trade balance, Fertilizers($Millions)
-$6,000
-$4,000
-$2,000
$0
$2,000
$4,000
$6,000
2009 2010 2011 2012 2013
Net E
xpor
ts ($
millio
ns)
Ammonia Urea DAP and MAP

- 119 -
Appendix E: Historic Net Exports
Sulfuric acid is in deficit
Inorganics have a positive trade balance, driven by TiO2, soda ash and NaOH
Net Trade Balance, Inorganics($Millions)
-$1,000
-$500
$0
$500
$1,000
$1,500
$2,000
2009 2010 2011 2012 2013
Net E
xpor
ts ($
millio
ns)
Soda Ash Sodium Hydroxide Sulfuric Acid Titanium Dioxide

Nexant, Inc.
San FranciscoLondonNew YorkBangkokBahrainHoustonWashingtonSingaporePhoenixMadisonBoulderDusseldorfShanghaiBeijing
www.nexant.com