Embed Size (px)
DESCRIPTION
Speech by Mathis Wackemagel at the 2012 ISEE Conference for the Boulding Award.
Citation preview
June 19, 2012RAW version
Contacts:
Dr. Mathis Wackernagel
Global Footprint Network
Oakland, CA, USA
+1 510 839 8879
www.footprintnetwork.org

I receive the Kenneth Boulding Award with enormous joy and gratitude. Thank you all. Both
my dear friend Bill Rees and I are not only humbled. We accept this magnificent honor also my dear friend Bill Rees and I are not only humbled. We accept this magnificent honor also
with a great sense of responsibility. Humanity’s growing resource hunger has moved us into
global overshoot. Yet so many people in the world are deprived of sufficient opportunities for
a dignified life. This spectacular double challenge is confronting us – and there is little
evidence that our past efforts have been effective in redirect our destiny onto a sustainable
path. Ecological Economics is the prime discipline that has taken on this challenge, and I am
particularly indebted to the Ecological Economics family, starting with Herman Daly who posed
this simple scale question, and who has through kindness, clarity and perseverance inspired us
all. And I am scared thinking about how few have taken up Herman’s call to action, in spite of
his charming and deeply convincing invitation. I would like to thank all amazing family
members. Just to name a few of you – Elinore Ostrom, Charlie Hall, Hazel Henderson, Fander
Falconi, Sigrid Stagl, Juan Martinez-Alier, and many many more who really are the small group
that Margret Mead was talking about when wondering who is changing the world.
This wonderful prize is truly a gift to a larger community including many dedicated individuals
at Global Footprint Network and its partner organizations across the globe, the indispensible
community of funders, supporters, teachers, enablers as well as all the others who have
dedicated themselves to the most fundamental and so utterly necessary dream of flourishing
lives for all on our great Planet.
Many younger people stand out such as Kyle Gracey I am lucky enough to work with or Nicola
van Moon, a fifth grader who, when asking her in a presentation to her class how to measure
nature said: square miles? So why would you need to measure? I asked. She said: so we know
how much we have and if we have enough. Why that, I asked. She said, if we use more than
what we have, all there is left are imaginary cookies. So what happens when an infinite
growth economy runs into a finite planet?
2

Debt boils over
One of the hidden drivers behind Europe’s financial turmoil is the dramatic increase in
resource prices over the last 10 years. Historically, cheap resources have helped fuel
economic growth, but the situation has now changed. Increasing costs impose a burden on
economic performance that is often reflected in rising debt levels. This, at a time when the
ability of many countries to service this debt is being called into question.
3

The majority is left out.
As prices rise, many countries must spend larger portions of their budgets on essential
resources from abroad, often forgoing expenditures on health, education, infrastructure or
other productive capacity building. People find it more difficult to make ends meet. The
socio-economic impact of ecological overshoot, including climate change,
disproportionately affects the most vulnerable.
4
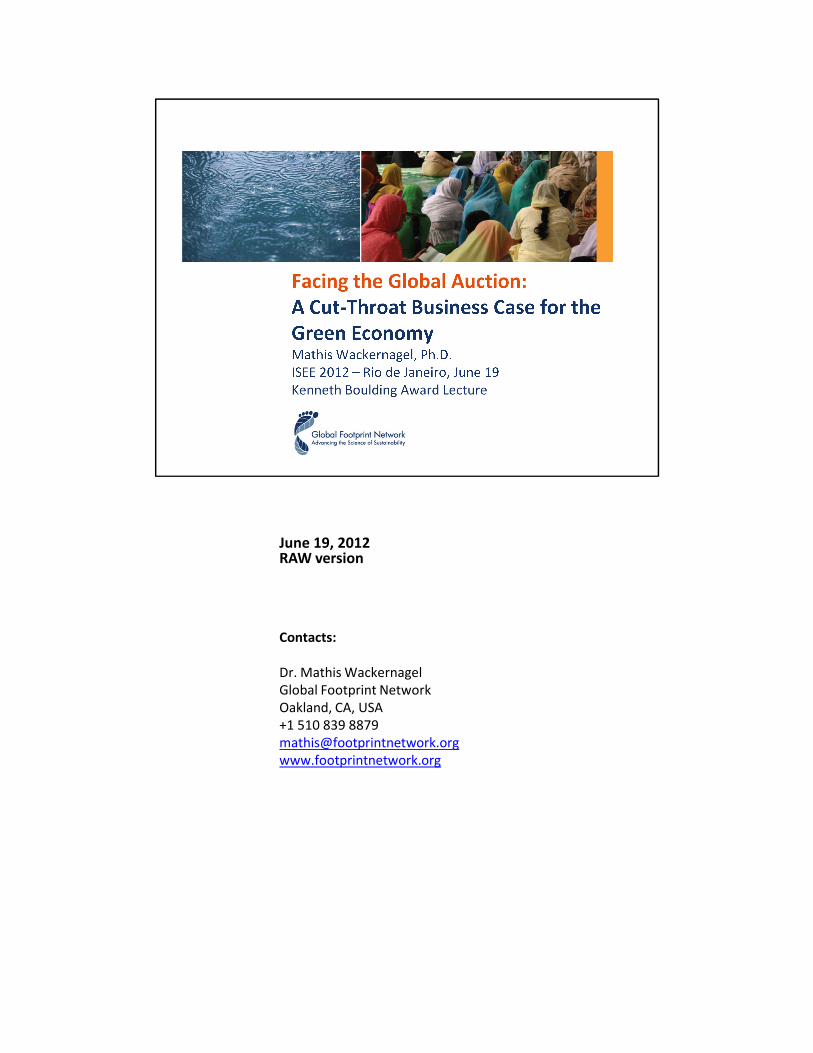
Biodiversity is for sale.
The threats facing plant and animal life on the planet are greater than at any time in
recorded history. Human pressure in the form of overharvesting and habitat loss is driving
down wildlife populations worldwide. In our economic system, wild species have little
value. As long as trees, for example, are worth more cut than they are standing, the
pressures to liquidate natural resources will be overwhelming.
5

Food turns into a luxury.
Soil erosion, rising fertilizer prices, and severe weather brought on by climate change have
all contributed to the volatility of crop yields and food prices. This is particularly harsh in
countries where most people depend on basic foods, such as unrefined grains and rice,
which are more directly linked to global commodity prices than are the refined foods found
in supermarkets.
6

Herman Daly called this new world we are entering the full world. Today I would like to
discuss the economic implications of living in a full world.discuss the economic implications of living in a full world.
Essentially – it turns the global economy into a global auction, at best. At best, because not
everybody has equal and full access. Many contracts are already signed, some countries
have bigger armies than others etc.
But this is the essence:
An empty world allows for unlimited production of goods.
A full world turns the economy into a global auction.
In the past, seemingly unlimited resources fueled our economies.
But humanity now demands over 50 percent more than what the planet can regenerate.
We have entered a global auction, with more people bidding for fewer resources. In this
world, managing our use of natural capital — and not overusing it—is the recipe for
economic success.
Let me elaborate.
But first, how can we measure whether we are in a full or empty world? Let me give you a
quick introduction to the Footprint.
7

How do we know? By using Ecological Footprint accounting
The Ecological Footprint is the area of land and water it takes for a human population to generate the renewable resources
they consume and degrade the waste it produces in a given technological context. In other words, it measures the "quantity
of nature" that we use, and compares it with how much we have (biocapacity). This accounting supports decision makers
when it comes to making difficult choices, managing conflicts of objectives and placing themselves in an optimal situation for
the future. The accounts can be applied to the global, country, region, individual or product.
Cropland: Cropland is the most bioproductive of all the land-use types and consists of areas used to produce food and fiber
for human consumption, feed for livestock, oil crops, and rubber. Due to lack of globally consistent data sets, current cropland
Footprint calculations do not yet take into account the extent to which farming techniques or unsustainable agricultural
practices may cause long-term degradation of soil. The cropland Footprint includes crop products allocated to livestock and
aquaculture feed mixes, and those used for fibers and materials.
Forest land: The forest Footprint is calculated based on the amount of lumber, pulp, timber products, and fuel wood
consumed by a country on a yearly basis.
Grazing land: Grazing land is used to raise livestock for meat, dairy, hide, and wool products. The grazing land Footprint is
calculated by comparing the amount of livestock feed available in a country with the amount of feed required for all livestock
in that year, with the remainder of feed demand assumed to come from grazing land.
Carbon Footprint: Carbon dioxide emissions from burning fossil fuels are currently the only waste product included in the
National Footprint Accounts. The carbon Footprint includes embodied carbon in imported goods. The carbon Footprint
component of the Ecological Footprint is calculated as the amount of forest land needed to absorb these carbon dioxide
emissions. Currently, it is the largest portion of humanity’s Footprint.
Fishing grounds: The fishing grounds Footprint is calculated based on estimates of the maximum sustainable catch for a
variety of fish species. These sustainable catch estimates are converted into an equivalent mass of primary production based
on the various species’ trophic levels. This estimate of maximum harvestable primary production is then divided amongst the
continental shelf areas of the world. Fish caught and used in aquaculture feed mixes are included.
Built-up land: The built-up land Footprint is calculated based on the area of land covered by human infrastructure —
transportation, housing, industrial structures, and reservoirs for hydro-power. Built-up land may occupy what would
previously have been cropland.
8

In my short lifetime, resource demand has expanded dramatically. Now humanity is using
more than 1.5 planets. This means it takes over one year and 6 months to regenerate what more than 1.5 planets. This means it takes over one year and 6 months to regenerate what
humanity uses in one year.
The Carbon Footprint has grown particularly rapidly, allowing to contain the other areas by
using them more intensively. Technology has also changed. The flat biocapacity line only
indicates that it has consistently been one planet we have. But a changing planet. It is
changing through climate change, technology and management practice.
The carbon Footprint is a unique singularity in human history, and while we currently do
not dedicate areas for sequestering excess CO2, it indicates how much capacity is required
were it necessary to replace fossil fuel with biomass.
Looking at this trend, any computer would draw clear policy implications.
Shrink and share.
But for people and political leaders, these are among the most inattractive propositions.
For politicians it turns into this challenging dilemma: taking on shrinking and sharing and
commit political suicide, or not taking it on and commit (long-term) ecological suicide. The
choice is obvious for politicians. Therefore, how can we reframe this same information to
make it actionable?
9
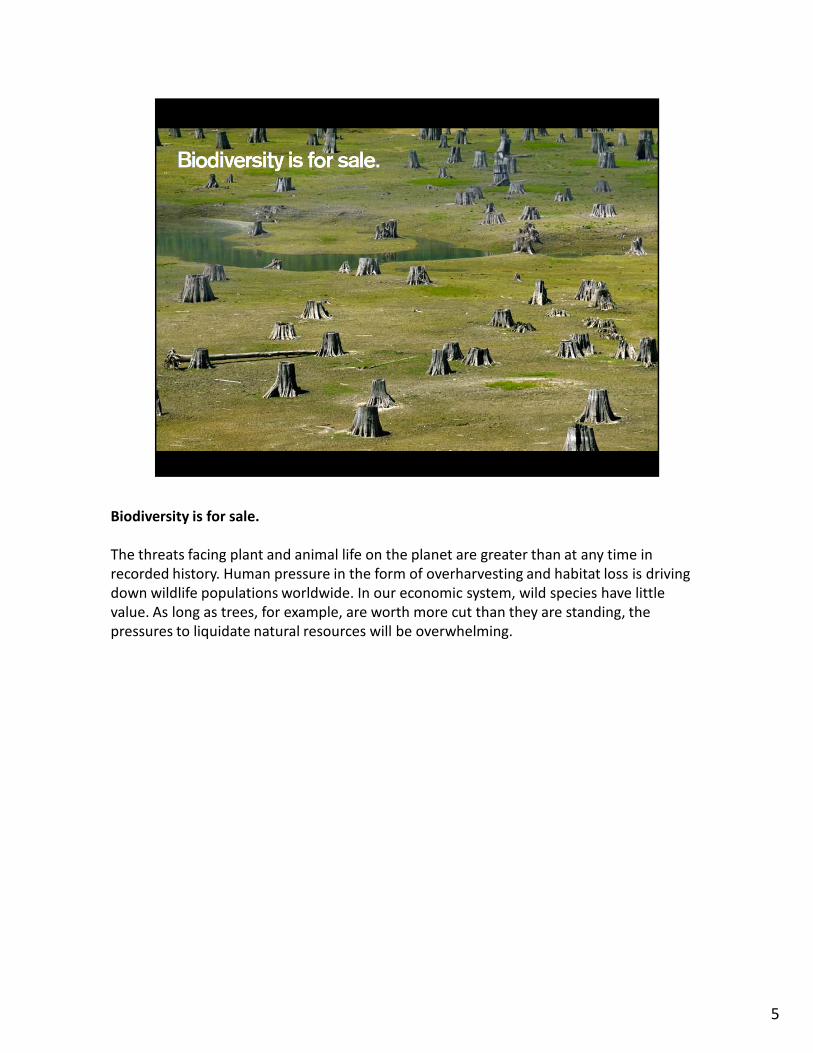
Let’s consider this:
Today, we are in a new era, defined by biocapacity constraints.
In the old era, as shown on this map here for 1961, most countries were ecological
creditors. Resources were not constraining economies. They seemed plenty.
Residents of ecological creditor countries consume on average less resources than their
countries’ ecosystems can regenerate (the darker the green the higher the ratio). Note:
since there is trade among all countries, both demand and supply are calculated from the
perspective of net imports (or net exports).
Ecological debtor countries are in the opposite situation. They run a biocapacity deficit.
They use, in net terms, more than what their countries’ ecosystems can renew.
FURTHER EXPLANATIONS:
● Ecological Creditors: Residents of ecological creditor countries use less ecological
services than are available within their national borders, and therefore are endowed with a
reserve of natural assets. This reserve, in an increasingly resource-constrained world, give
those countries an economic advantage and strengthens their strategic positions.
● Ecological Debtors: In contrast, countries with ecological deficits depend on net imports
of such resources or on liquidating their ecological assets. Both are an economic drain on
those countries.
10

The new era has begunThe new era has begun
With global overshoot, and rapidly increasing resource costs since 2000, the
situation has shifted. As a whole, humanity’s resource demand now exceeds the
planet’s supply by over 50 percent (2008 data). This ecological deficit means that it
takes a year and six months to regenerate what humanity used in 2008.
As global overshoot increases, the gap between ecological creditors – countries that
have more biocapacity than they use – and ecological debtors – those using more
biocapacity than they have is becoming more pronounced, and is turning into an
economically a more and more significant divide. Today, 83 percent of the world’s
people live in countries that run an ecological deficit.
As a result, Global Footprint Network focuses on the economically ever more acute
Ecological Creditors and Debtors dilemma since it makes obvious the self-interest of
countries to react to biocapacity constraints.
“We are not facing a ‘global problem’ but a ‘global storm’. The question is: is your ‘boat’
ready? In a world of resource constrained world, can you, as a country, afford to run an
ecological deficit? Can you afford ‘not to fix your boat’?”
11

Rather than assuming we are sitting in one big global boat, we in many different boats. Like
countries, or cities.countries, or cities.

In reality, we are sitting in our own boat with our own hole. There is no advantage in
waiting for all others to agree first to fix their own boat as well. What are we waiting for?
Maybe we are waiting to get rescued? Good luck!

Here’s the good news. All countries can win. But turn your fate around. Look at our
resource trends! We do not need to wait for others. That’s why we work directly with resource trends! We do not need to wait for others. That’s why we work directly with
national governments.
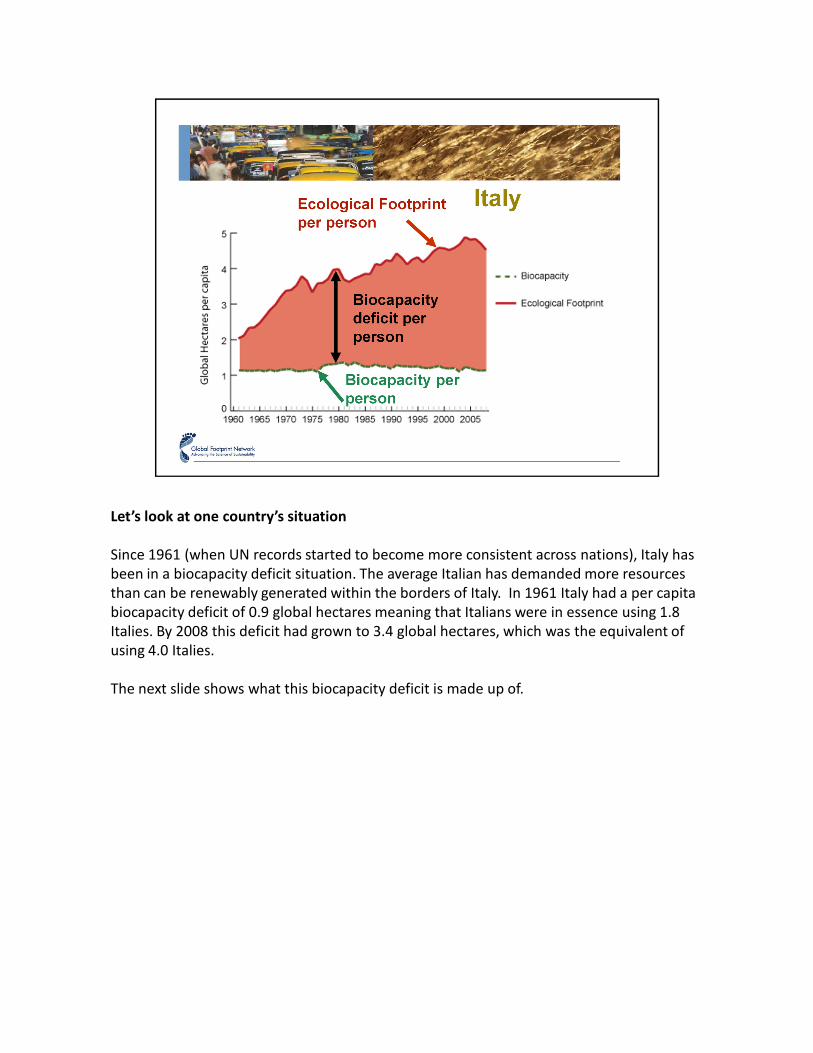
Let’s look at one country’s situation
Since 1961 (when UN records started to become more consistent across nations), Italy has
been in a biocapacity deficit situation. The average Italian has demanded more resources
than can be renewably generated within the borders of Italy. In 1961 Italy had a per capita
biocapacity deficit of 0.9 global hectares meaning that Italians were in essence using 1.8
Italies. By 2008 this deficit had grown to 3.4 global hectares, which was the equivalent of
using 4.0 Italies.
The next slide shows what this biocapacity deficit is made up of.

Biocapacity Deficit Breakdown for Italy
Italy’s biocapacity deficit can be disaggregated into the individual land use type components that
make up the Footprint. The majority of this deficit has been driven by the carbon Footprint, but
the cropland and forest land deficits have also been growing in the last few decades.
This biocapacity deficit due to three main causes: 1) Importing resources from external sources,
2) Degrading domestic biocapacity and 3) Placing pressure on the global commons, for example
for carbon sequestration.
Such a deficit is not sustainable as humanity's demands on the planet are already requiring the
resource supply equivalent to 1.5 planets. As such, many countries find themselves in a
biocapacity deficit situation and are becoming more and more reliant on external sourcing to
meet the demands of their residents.
What are the economic implications? Up to the year 2000, resource and commodity prices went
down faster (according to World Bank pink sheet) than Italy’s biocapacity deficit went up. Hence
the net costs for Italy did not increase. The growing biocapacity deficit for Italy did not seem to be
a problem. But this has changed since 2000. Resource costs have nearly tripled. Therefore the
costs for Italy are rising: more precisely, the costs for resources Italy cannot renew domestically
and needs to get from elsewhere.
16

Global Footprint Network can calculate the net resource costs for Italy over time – and it
shows a level of costs that even rapid economic expansion cannot overcome. shows a level of costs that even rapid economic expansion cannot overcome.
Essentially it is amounts times prices.
Recently, the resource costs have been growing so rapidly that Italy has not been able to
compensate these rising costs through other means.
This pfinancial ressure enticed Italy into deficit spending. It thereby can overcome the
stress in the short run, but it is leading to a debt crisis in the medium run.
Is Italy alone? See next slide.

Italy is not alone – 24 European countries compared:
Why the Euro Crisis has been in the making for a while:
Here are 24 large(r) European countries, 19 of which are part of the European Union. All
results are presented in PER CAPITA terms - on the same time scale, but the y-axis is
different. Y-axis is adjusted to better show each country’s historical path.
Source Global Footprint Network, National Footprint Accounts edition 2008
(1961- 2005) [Note: newer data are now available].
All 24 countries have their own paths. There are some similarities: for instance that many
European countries run significant biocapacity deficits.
What is striking is that Spain, Greece, Italy and Portugal show quite similar dynamics: rapid
increase of their biocapacity deficit over the last years. Combined with economic analysis,
it becomes clear that this trend caused significant, and rapidly rising cost pressures on
those four countries, making them more vulnerable than other countries to economic
fragility.
Using Global Footprint Network data (including the cost analysis), it becomes quite
obvious, that the Euro crisis in Southern Europe cannot be divorced from the resource
performance of those countries.
18

What to track in a resource constrained world?
What is the situation of various countries around the world?
Y- AXIS: One key performance indicator is income. How much income are economies able
to generate in a given year? Income is seen as a proxy for the potential to resolve any
problem. More income opens more options. GDP (or GNI) is an approximation of how
much income people are able to generate, on average, within an economy. (Note GDP does
not indicate how much income the country can produce in the future – it does not
distinguish between regenerated income, and income from liquidation).
X- AXIS: In a resource constrained world, resource performance is becoming another key
indicator. Here the x-Axis tracks: is the country in an ecological creditor or debtor situation?
19

How have countries performed over the last 25 years?
This graph shoes absolute income and biocapacity deficits of countries increased For most countries, their income (measured in purchasing power adjusted income per capita or -ppp) has increased. At the same time their biocapacity deficit has increased as well (or countries’ biocapacity remainders have shrunk). [note: the arrows stretch over a 27 year period – also note that 1.8 global hectares per person is the amount of biocapacity available per person in the world, or about as much as many featured countries have lost per person over this 27 year time span].
Many might interpret this graph as a sign that countries’ residents have been able to increase their household consumption – as economies have used more resources. Is a growing biocapacity deficit just an unfortunate cost of business? Others may interpret that the growing biocapacity deficits may call in question country’s ability to expand their economies in the future. Maybe, larger biocapacity deficits is an unfortunate but possibly necessary part of doing business. This biocapacity deficit does not seem to impact the countries’ income either. It may be seen as lamentable, but not fundamentally linked to economic performance. Overall, this graph may give the (misleading) impression that it is inconclusive whether resource dimensions have anything to do with whether countries are on a fundamentally positive or negative track. Data source: Income data from the World Bank ; Biocapacity deficit from Global Footprint Network.
But are we looking at this from the right angle? Consider: Which World Are We in?
Are we really in a “factory world”? A world of unlimited resources? In such a world, additional demand will stimulate additional supply. If more books and chairs are purchased, more books and chairs are produced. The limit to supply is demand. All that matters is your absolute income – more income will give you access to more products and services. But the world we are in is a different world…
20
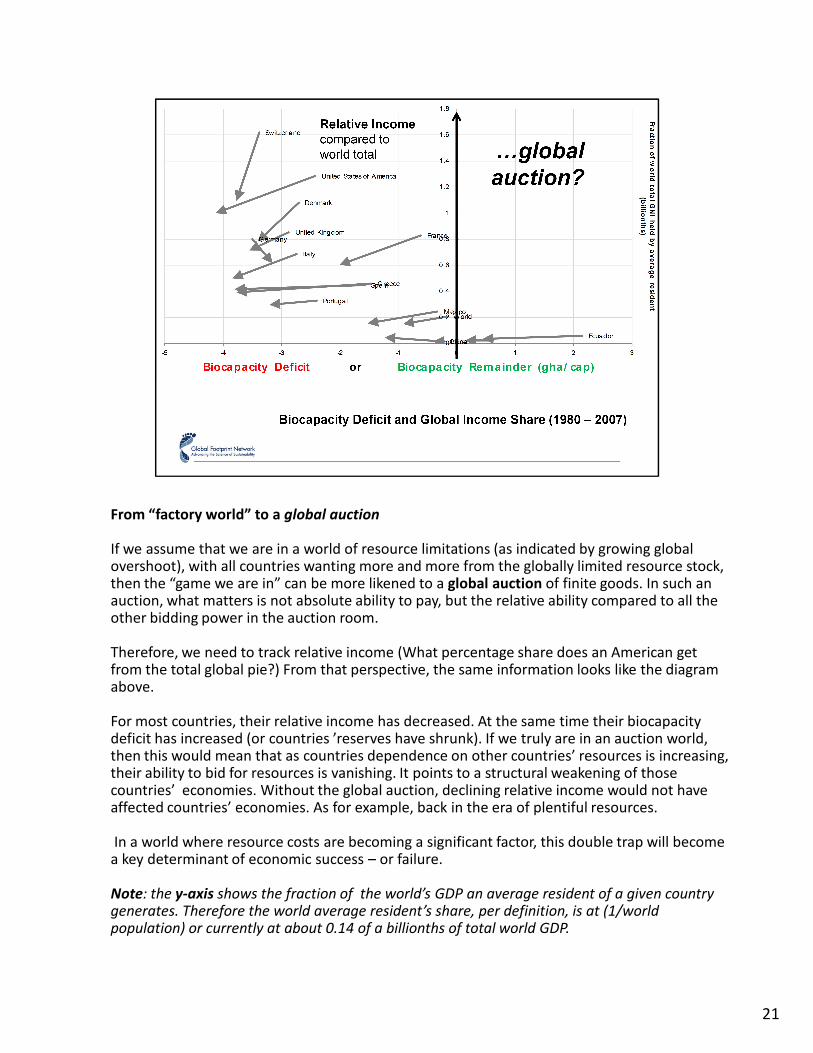
From “factory world” to a global auction
If we assume that we are in a world of resource limitations (as indicated by growing global overshoot), with all countries wanting more and more from the globally limited resource stock, then the “game we are in” can be more likened to a global auction of finite goods. In such an auction, what matters is not absolute ability to pay, but the relative ability compared to all the other bidding power in the auction room.
Therefore, we need to track relative income (What percentage share does an American get from the total global pie?) From that perspective, the same information looks like the diagram above.
For most countries, their relative income has decreased. At the same time their biocapacity deficit has increased (or countries ’reserves have shrunk). If we truly are in an auction world, then this would mean that as countries dependence on other countries’ resources is increasing, their ability to bid for resources is vanishing. It points to a structural weakening of those countries’ economies. Without the global auction, declining relative income would not have affected countries’ economies. As for example, back in the era of plentiful resources.
In a world where resource costs are becoming a significant factor, this double trap will become a key determinant of economic success – or failure.
Note: the y-axis shows the fraction of the world’s GDP an average resident of a given country generates. Therefore the world average resident’s share, per definition, is at (1/world population) or currently at about 0.14 of a billionths of total world GDP.
21

More countries in the “global auction diagram”
This graph includes more countries that have significant biocapacity reserves. They too
have shown very rapid loss of biocapacity over the last 25 years. In other words, they have
weakened their position as well, but it is less fatal to them, since they are not dependent
on foreign resources. In the cases of ecological creditors, they are mainly losing out on
opportunities.
22

Where Global Footprint Network works:
Yellow dots indicate countries where government agencies have performed reviews of
Global Footprint Network’s Ecological Footprint assessments. The green dots show where
discussions towards a collaboration are well on their way.
Various international agencies have taken up the Footprint. The World Business Council for
Sustainable Development has used the Footprint as the foundation for its “Vision 2050”,
UNEP’s Green Economy initiative builds on Global Footprint Network’s HDI-Footprint
approach, and UNDP’s Human Development Report (as well as The Economist’s World in
Figures) list the Footprint in their data tables.
23

In summary:
For most of the 20th century, resources were relatively cheap and easily available. As a result
most countries have become increasingly dependent on large amounts of natural resources
they do not have – both fossil fuels and biological resources. While resources are still relatively
cheap, this increasing global demand is meeting a supply crunch. It takes now more effort to
harvest the fossil fuels and the minerals, and in some places the fresh water. Also agricultural
production is becoming increasingly fuel dependent. As a result, basic commodities such as
food and fibers are becoming costlier.
These resource dynamics are turning into an ever more significant driver of economic
performance. Economic planners ignoring these trends may put their country’s economy at
peril.
Global Footprint Network has comprehensive risk assessment tools to document these
changing trends and asses their economic impact for 200 other countries around the world,
(and by extension each country’s trading partners). Some overarching trends are presented on
our website at www.footprintnetwork.org. The Network’s bio-physical assessment of countries’
resource performance, coupled with economic analysis, can show structural challenges for
countries that are already shaping present economic realities in many locations around the
world – and opportunities for overcoming them.
24