Embed Size (px)
Citation preview

Beyond GDP: Towards a composite
well-being indexThe case of the Green Economy Index
Anton Nahman, CSIR
Beyond GDP in Africa: Innovative Ideas for a
Regional Dashboard” University of Pretoria, 28-29 October 2014
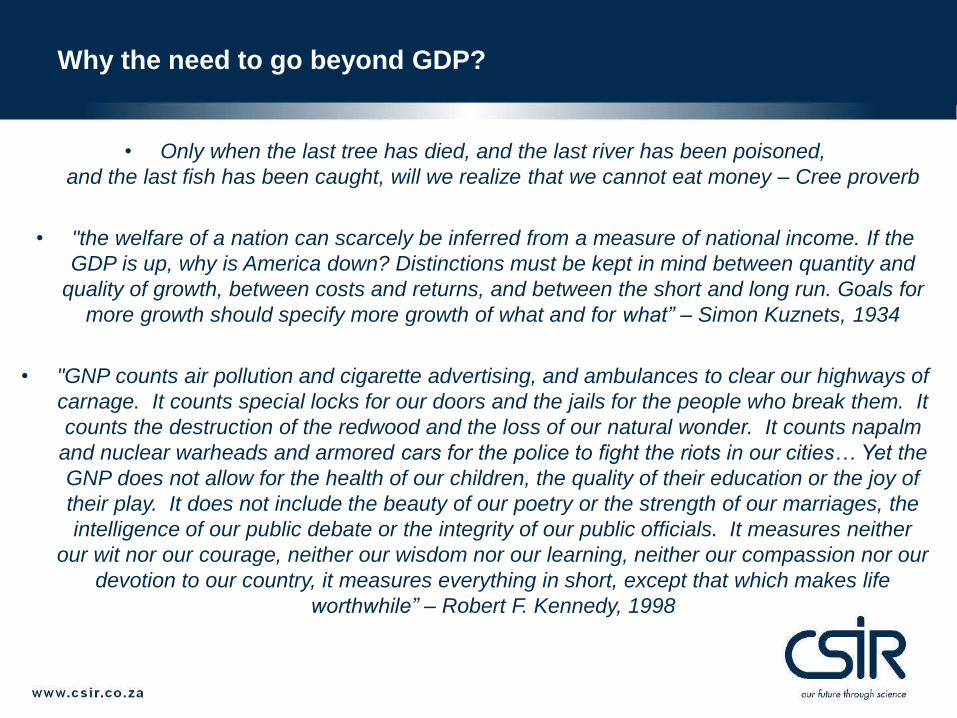
Why the need to go beyond GDP?
• Only when the last tree has died, and the last river has been poisoned,
and the last fish has been caught, will we realize that we cannot eat money – Cree proverb
• "the welfare of a nation can scarcely be inferred from a measure of national income. If the
GDP is up, why is America down? Distinctions must be kept in mind between quantity and
quality of growth, between costs and returns, and between the short and long run. Goals for
more growth should specify more growth of what and for what” – Simon Kuznets, 1934
• "GNP counts air pollution and cigarette advertising, and ambulances to clear our highways of
carnage. It counts special locks for our doors and the jails for the people who break them. It
counts the destruction of the redwood and the loss of our natural wonder. It counts napalm
and nuclear warheads and armored cars for the police to fight the riots in our cities… Yet the
GNP does not allow for the health of our children, the quality of their education or the joy of
their play. It does not include the beauty of our poetry or the strength of our marriages, the
intelligence of our public debate or the integrity of our public officials. It measures neither
our wit nor our courage, neither our wisdom nor our learning, neither our compassion nor our
devotion to our country, it measures everything in short, except that which makes life
worthwhile” – Robert F. Kennedy, 1998
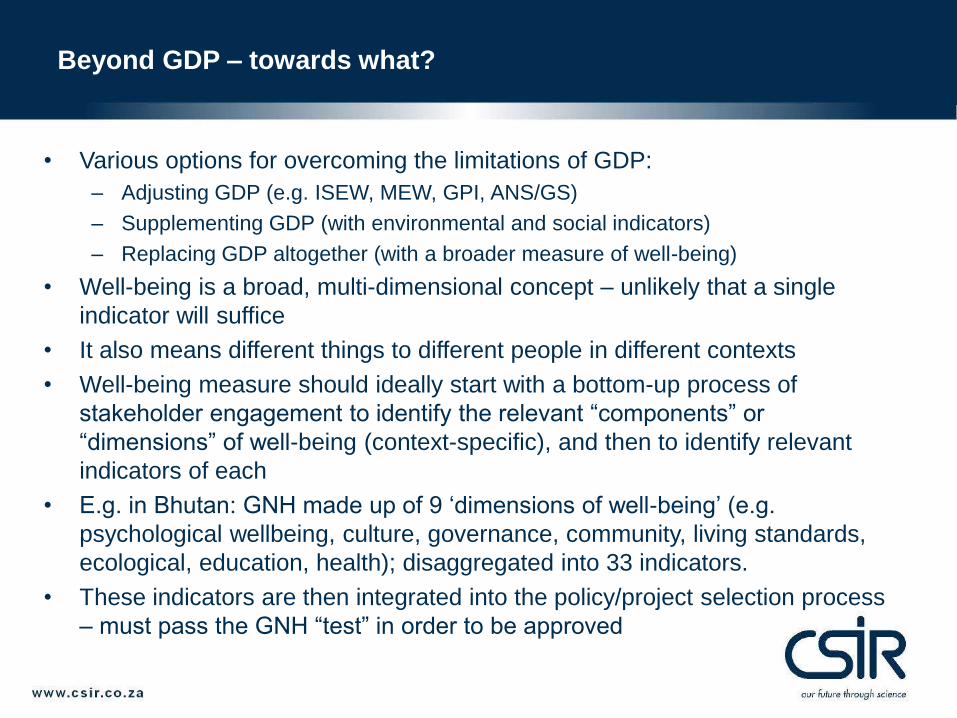
Beyond GDP – towards what?
• Various options for overcoming the limitations of GDP:
– Adjusting GDP (e.g. ISEW, MEW, GPI, ANS/GS)
– Supplementing GDP (with environmental and social indicators)
– Replacing GDP altogether (with a broader measure of well-being)
• Well-being is a broad, multi-dimensional concept – unlikely that a single
indicator will suffice
• It also means different things to different people in different contexts
• Well-being measure should ideally start with a bottom-up process of
stakeholder engagement to identify the relevant “components” or
“dimensions” of well-being (context-specific), and then to identify relevant
indicators of each
• E.g. in Bhutan: GNH made up of 9 ‘dimensions of well-being’ (e.g.
psychological wellbeing, culture, governance, community, living standards,
ecological, education, health); disaggregated into 33 indicators.
• These indicators are then integrated into the policy/project selection process
– must pass the GNH “test” in order to be approved
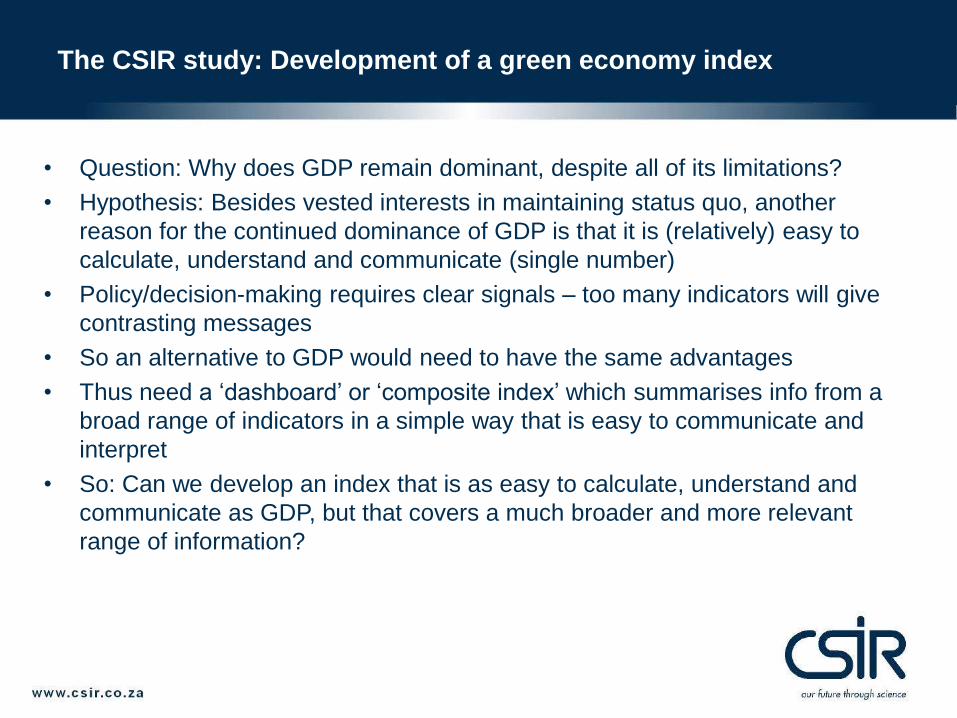
The CSIR study: Development of a green economy index
• Question: Why does GDP remain dominant, despite all of its limitations?
• Hypothesis: Besides vested interests in maintaining status quo, another
reason for the continued dominance of GDP is that it is (relatively) easy to
calculate, understand and communicate (single number)
• Policy/decision-making requires clear signals – too many indicators will give
contrasting messages
• So an alternative to GDP would need to have the same advantages
• Thus need a ‘dashboard’ or ‘composite index’ which summarises info from a
broad range of indicators in a simple way that is easy to communicate and
interpret
• So: Can we develop an index that is as easy to calculate, understand and
communicate as GDP, but that covers a much broader and more relevant
range of information?
The CSIR study: Development of a green economy index
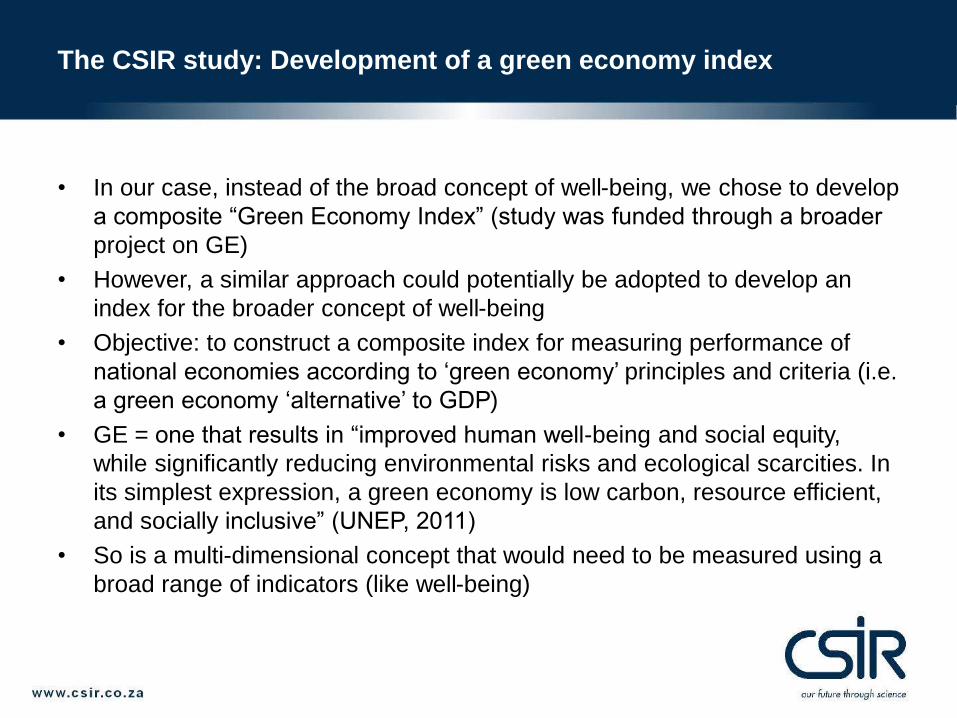
• In our case, instead of the broad concept of well-being, we chose to develop
a composite “Green Economy Index” (study was funded through a broader
project on GE)
• However, a similar approach could potentially be adopted to develop an
index for the broader concept of well-being
• Objective: to construct a composite index for measuring performance of
national economies according to ‘green economy’ principles and criteria (i.e.
a green economy ‘alternative’ to GDP)
• GE = one that results in “improved human well-being and social equity,
while significantly reducing environmental risks and ecological scarcities. In
its simplest expression, a green economy is low carbon, resource efficient,
and socially inclusive” (UNEP, 2011)
• So is a multi-dimensional concept that would need to be measured using a
broad range of indicators (like well-being)
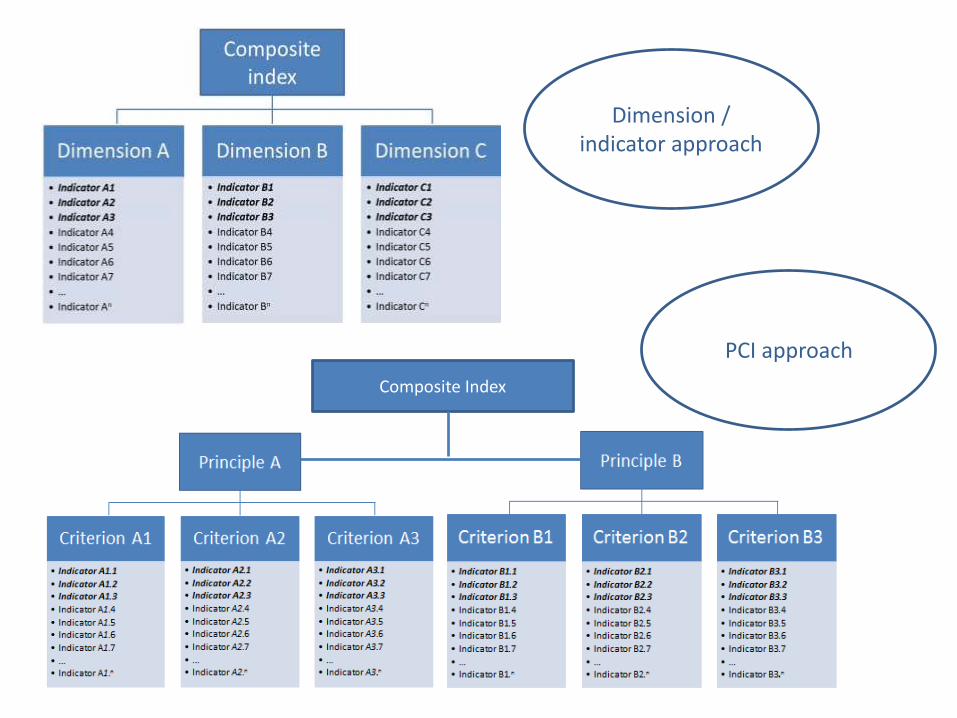
Composite Index
Dimension / indicator approach
PCI approach
Approach
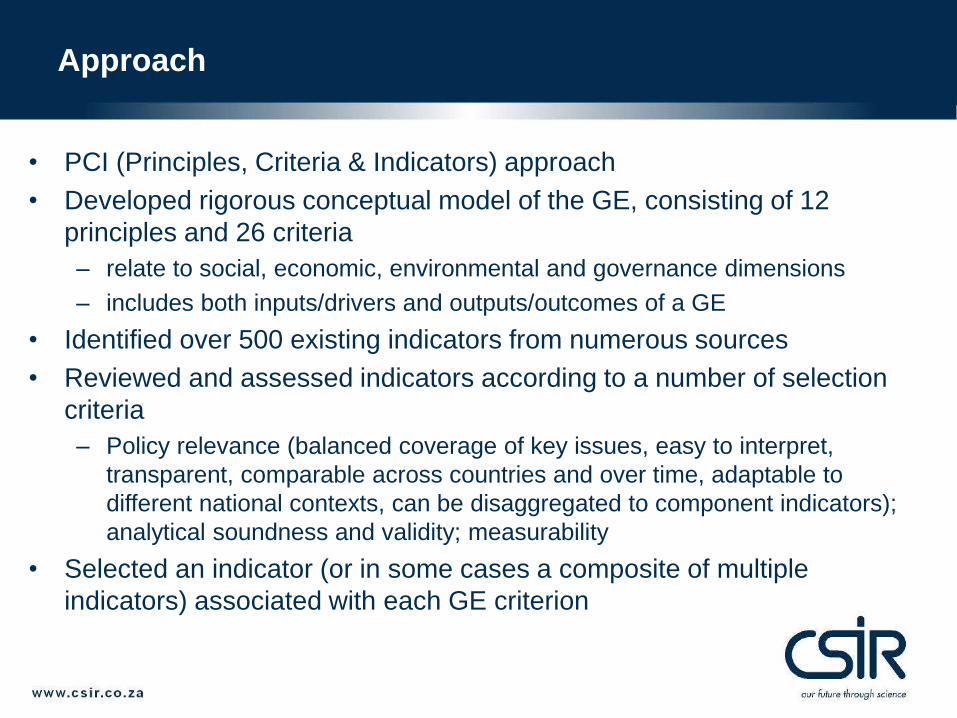
• PCI (Principles, Criteria & Indicators) approach
• Developed rigorous conceptual model of the GE, consisting of 12
principles and 26 criteria
– relate to social, economic, environmental and governance dimensions
– includes both inputs/drivers and outputs/outcomes of a GE
• Identified over 500 existing indicators from numerous sources
• Reviewed and assessed indicators according to a number of selection
criteria
– Policy relevance (balanced coverage of key issues, easy to interpret,
transparent, comparable across countries and over time, adaptable to
different national contexts, can be disaggregated to component indicators);
analytical soundness and validity; measurability
• Selected an indicator (or in some cases a composite of multiple
indicators) associated with each GE criterion

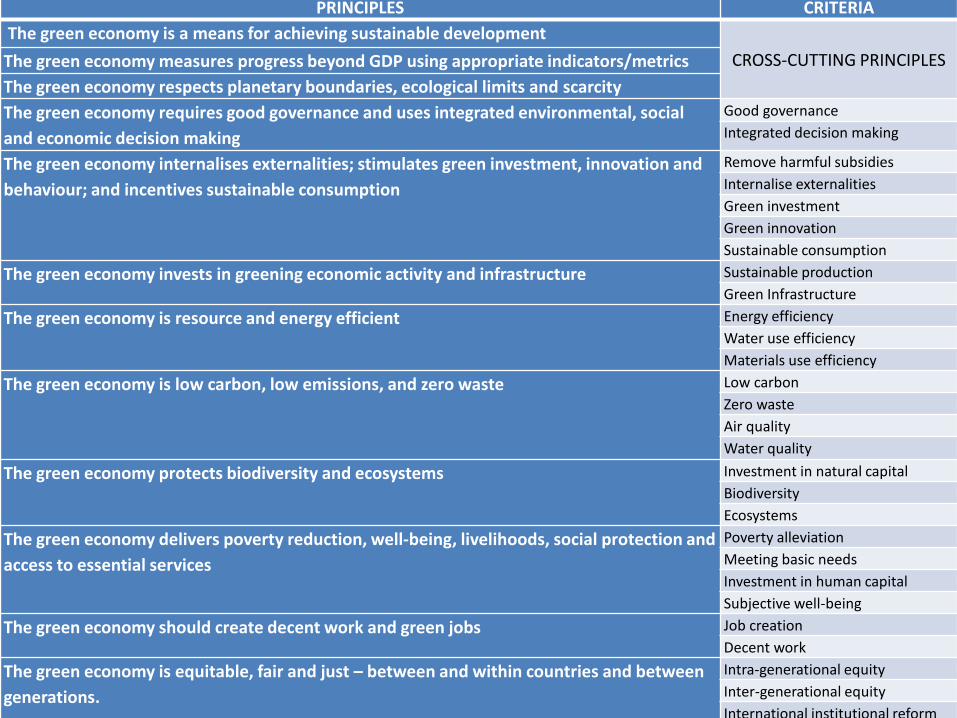
PRINCIPLES CRITERIA INDICATORS
The green economy is a means for achieving sustainable
development
CROSS-CUTTING PRINCIPLESThe green economy measures progress beyond GDP using
appropriate indicators/metrics
The green economy respects planetary boundaries, ecological
limits and scarcity (absolute decoupling)
The green economy requires good governance (inclusive;
democratic; participatory; accountable; transparent; and stable)
and uses integrated environmental, social and economic
decision making
Good governance Average across the World Bank’s 6 Governance Indicators
Integrated decision making
*N/A (Cross-cutting criterion)
The green economy internalises externalities; stimulates green
investment, innovation and behaviour; and incentives
sustainable consumption
Remove harmful subsidies Fossil fuel subsidies as a % of GDP
Internalise externalities Environment-related subsidies as a % of total subsidies or GDP
Green investment Environment-related/renewable energy investment as a % of total
Green innovation Patents in environment-related technologies as a % of total
Sustainable consumption Ecological footprint (global hectares per capita)
The green economy invests in greening economic activity and
infrastructure
Sustainable production Organic farming area as % of total agricultural area
Green Infrastructure Share of renewable energy in Total Primary Energy Supply (TPES) (%)
The green economy is resource and energy efficient Energy efficiency Energy consumption per capita (gigajoules per capita per annum)
Water use efficiency Water withdrawals per capita (m3 per capita per annum)
Materials use efficiency Domestic materials consumption (per capita or per unit GDP)
The green economy is low carbon, low emissions, and zero
waste
Low carbon Greenhouse gas emissions per capita (tCO2e per capita per annum)
Zero waste Waste disposal per capita (kg per capita per annum)
Air quality Index based on indoor air pollution, particulate matter and SO2
emissions
Water quality Index based on Dissolved O2, Electrical Conductivity, pH, Phosphorus,
and Nitrogen
The green economy protects biodiversity and ecosystems Investment in natural capital Marine and terrestrial protected areas as a % of total territorial area
Biodiversity Proportion of species threatened with extinction
Ecosystems Area under agriculture and commercial forestry as % of total land area
The green economy delivers poverty reduction, well‐being,
livelihoods, social protection and access to essential services
Poverty alleviation Poverty gap at $2 a day
Meeting basic needs Average score over Millennium Development Goal (MDG) indicators
relating to adequate nutrition, water and sanitation
Investment in human capital Human Development Index (HDI)
Subjective well-being Self-reported overall life satisfaction
The green economy should create decent work and green jobs Job creation Employment to working age population ratio
Decent work Index of relevant International Labour Organisation (ILO) Decent Work
indicators
The green economy is equitable, fair and just – between and
within countries and between generations.
Intra-generational equity Gini coefficient of income distribution
Inter-generational equity Adjusted Net Savings (aka Genuine Savings) as % of Gross National
PRINCIPLES CRITERIA
The green economy is a means for achieving sustainable development
CROSS-CUTTING PRINCIPLESThe green economy measures progress beyond GDP using appropriate indicators/metrics
The green economy respects planetary boundaries, ecological limits and scarcity
The green economy requires good governance and uses integrated environmental, social
and economic decision making
Good governance
Integrated decision making
The green economy internalises externalities; stimulates green investment, innovation and
behaviour; and incentives sustainable consumption
Remove harmful subsidies
Internalise externalities
Green investment
Green innovation
Sustainable consumption
The green economy invests in greening economic activity and infrastructure Sustainable production
Green Infrastructure
The green economy is resource and energy efficient Energy efficiency
Water use efficiency
Materials use efficiency
The green economy is low carbon, low emissions, and zero waste Low carbon
Zero waste
Air quality
Water quality
The green economy protects biodiversity and ecosystems Investment in natural capital
Biodiversity
Ecosystems
The green economy delivers poverty reduction, well‐being, livelihoods, social protection and
access to essential services
Poverty alleviation
Meeting basic needs
Investment in human capital
Subjective well-being
The green economy should create decent work and green jobs Job creation
Decent work
The green economy is equitable, fair and just – between and within countries and between
generations.
Intra-generational equity
Inter-generational equity
International institutional reform

Criterion IndicatorGood governance Average across the World Bank’s 6 Governance Indicators
Remove harmful subsidies Fossil fuel subsidies as a % of GDP
Internalise externalities Environment-related subsidies as a % of total subsidies or GDP
Green investment Environment-related/renewable energy investment as a % of total
Green innovation Patents in environment-related technologies as a % of total
Sustainable production Organic farming area as % of total agricultural area
Green infrastructure Share of renewable energy in Total Primary Energy Supply (TPES) (%)
Sustainable consumption Ecological footprint (global hectares per capita)
Energy efficiency Energy consumption per capita (gigajoules per capita per annum)
Water use efficiency Water withdrawals per capita (m3 per capita per annum)
Materials use efficiency Domestic materials consumption (per capita or per unit GDP)
Low carbon Greenhouse gas emissions per capita (tCO2e per capita per annum)
Zero waste Waste disposal per capita (kg per capita per annum)
Air quality Index based on indoor air pollution, particulate matter and SO2 emissions
Water quality Index of Dissolved O2, Electrical Conductivity, pH, Phosphorus, and Nitrogen
Investment in natural capital Marine and terrestrial protected areas as a % of total territorial area
Biodiversity Proportion of species threatened with extinction
Ecosystems Area under agriculture and commercial forestry as % of total land area
Poverty alleviation Poverty gap at $2 a day
Meeting basic needs Average score over MDG indicators on adequate nutrition, water and sanitation
Investment in human capital Human Development Index (HDI)
Subjective well-being Self-reported overall life satisfaction
Job creation Employment to working age population ratio
Decent work Index of relevant International Labour Organisation (ILO) Decent Work indicators
Intra-generational equity Gini coefficient of income distribution
Inter-generational equity Adjusted Net Savings (aka Genuine Savings) as % of Gross National Income (GNI)
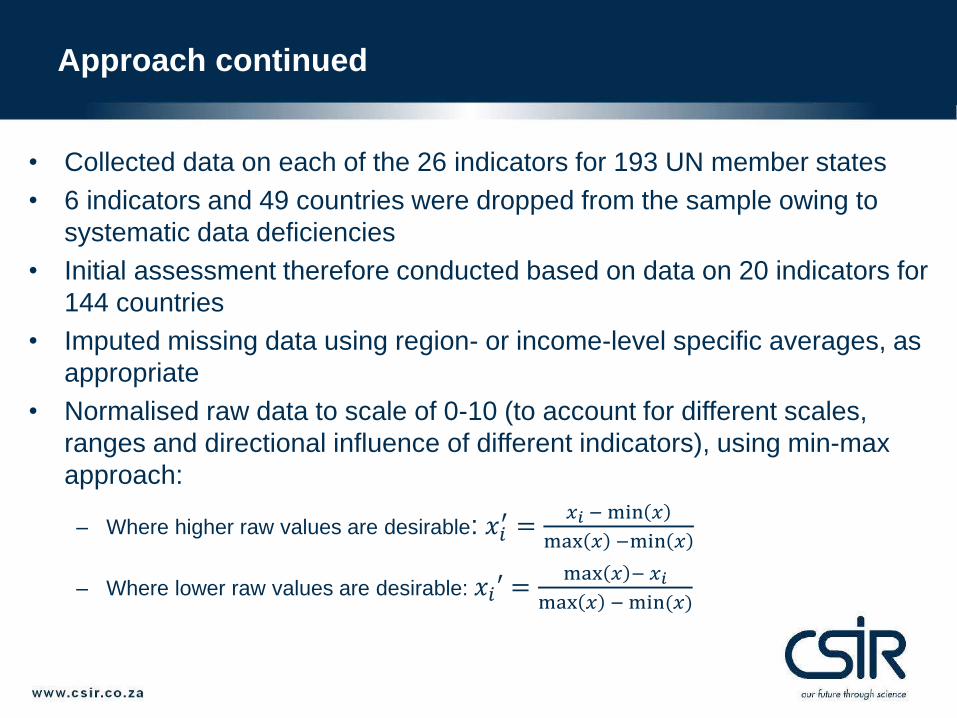
Approach continued
• Collected data on each of the 26 indicators for 193 UN member states
• 6 indicators and 49 countries were dropped from the sample owing to
systematic data deficiencies
• Initial assessment therefore conducted based on data on 20 indicators for
144 countries
• Imputed missing data using region- or income-level specific averages, as
appropriate
• Normalised raw data to scale of 0-10 (to account for different scales,
ranges and directional influence of different indicators), using min-max
approach:
– Where higher raw values are desirable: 𝑥𝑖′ =
𝑥𝑖 −min 𝑥
max 𝑥 −min 𝑥
– Where lower raw values are desirable: 𝑥𝑖′ =max 𝑥 − 𝑥𝑖
max 𝑥 −min(𝑥)
Approach continued
• Weighting of indicators:
– Necessary to reflect differences in importance of each component to the
concept as a whole, and to ensure appropriate balance across dimensions
– Should be based on extensive stakeholder engagement
– In this case, ‘stakeholders’ would include citizens of all countries, with vastly
differing contexts – universally applicable set of weights not possible
– Therefore assumed an equal weighting of indicators
– However, if intention is to develop a composite well-being index for Africa,
then weighting process would be appropriate and potentially achievable
• Aggregation of normalised scores across the indicators to composite
index score
• Ranking and disaggregation

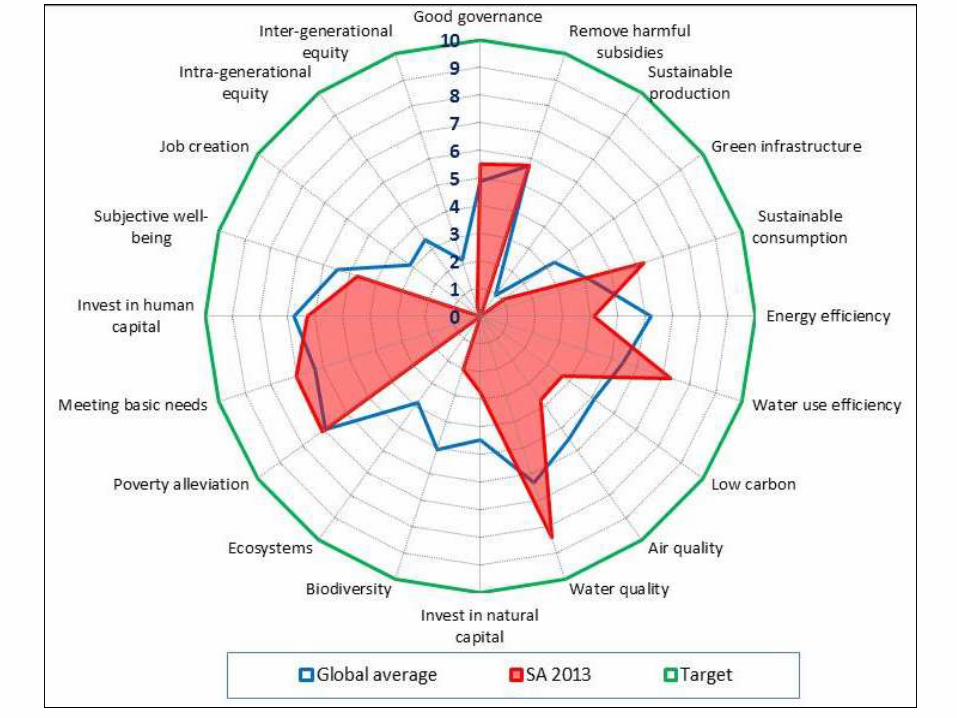
Preliminary rankings – how does SA measure up?
Rank
Over
all
score
(0-
10)
Go
od
go
vern
ance
Re
mo
ve h
arm
ful s
ub
sid
ies
Sust
ain
able
pro
du
ctio
n
Gre
en
infr
astr
uct
ure
Sust
ain
able
co
nsu
mp
tio
n
Ene
rgy
effi
cie
ncy
Wat
er
use
eff
icie
ncy
Low
car
bo
n
Air
qu
alit
y
Wat
er
qu
alit
y
Inve
st in
nat
ura
l cap
ital
Bio
div
ers
ity
Eco
syst
em
s
Po
vert
y al
levi
atio
n
Me
etin
g b
asic
ne
ed
s
Inve
st in
hu
man
cap
ital
Sub
ject
ive
we
ll-b
ein
g
Job
cre
atio
n
Intr
a-ge
ner
atio
nal
eq
uit
y
Inte
r-ge
ner
atio
nal
eq
uit
y
Switzerland 1 6.49 8.4 8.1 5.8 1.9 3.3 3.3 6.4 5.7 8.6 8.7 9.9 6.6 2.9 9.9 9.6 9.1 7.5 4.2 4.4 5.5
Austria 2 6.36 8.0 9.6 9.8 2.7 1.9 1.8 5.5 4.3 8.5 9.5 9.2 4.6 3.6 9.9 9.6 9.0 7.5 3.0 5.1 4.0
Sweden 3 6.32 8.6 8.0 7.7 3.4 0.0 0.0 7.1 5.1 8.3 9.6 4.0 7.4 7.4 9.9 9.6 9.2 7.5 3.2 5.8 4.7
Latvia 4 6.02 6.2 7.6 5.2 3.6 0.0 5.5 8.2 6.7 7.0 9.1 6.6 7.8 5.1 9.9 7.9 8.1 5.0 1.9 4.2 4.6
Norway 5 5.96 8.4 8.1 2.7 3.6 0.0 0.0 3.8 4.5 8.3 9.5 4.3 6.6 8.4 9.9 9.6 9.6 7.6 4.0 5.7 4.8
South Africa 137 3.81 5.5 5.8 0.0 1.1 6.3 4.1 7.3 3.7 3.7 8.4 2.8 2.0 0.0 7.1 7.0 6.3 4.7 0.0 0.0 0.4
Uzbekistan 140 3.58 2.4 0.0 0.0 0.2 7.7 6.6 0.0 5.1 3.5 3.8 0.9 5.4 2.0 5.6 8.6 6.5 5.1 2.4 3.9 1.8
Madagascar 141 3.53 3.6 6.9 0.0 8.6 3.6 9.2 0.0 6.9 5.0 4.8 1.0 0.0 1.5 0.0 0.0 4.8 4.4 7.3 2.6 0.4
Kazakhstan 142 3.53 3.8 3.0 0.0 0.1 4.6 0.1 0.0 2.1 3.3 4.3 1.0 5.6 0.8 9.9 9.0 7.5 5.5 4.6 5.2 0.0
Yemen 143 3.48 2.3 0.1 0.9 0.1 7.8 9.3 8.4 7.8 3.1 4.5 0.3 1.6 4.6 5.8 0.8 4.6 3.7 0.2 3.7 0.0
Turkmenistan 144 3.00 2.2 0.0 0.9 0.0 4.7 0.0 0.0 0.4 5.7 4.5 1.2 6.3 1.7 4.7 7.4 7.0 5.8 2.4 3.2 1.8

Lessons
• Results are sensitive to selection (and weighting) of indicators; and
quality of the data (outdated in some cases)
• Need to better differentiate between ‘input’ and ‘outcome’ indicators
• Overall score and rank are less important than progress over time and
scores on individual indicators (identifying strengths and weaknesses)
• Composite measures designed to be universally applicable are useful for
ranking/comparison purposes only
• Policy/decision making should be based on measures of well-being that
take into account what matters to people in that context – not on how well
we are doing on a global ‘league table’
• Need for thorough stakeholder engagement to identify and weight
dimensions & indicators / PCIs
• Should be able to be integrated into policy/project planning & decision
making processes (design, assessment and monitoring), at various levels
(national/provincial/local/project)

Conclusions
• Point here is not the specific PCI’s used in the GEI, but rather to
discuss a potential process that can be followed in developing a
dashboard or index of wellbeing for Africa
• Assuming that consensus can be reached on what constitutes
well-being in the context of Africa, and assuming that each
component or dimension can be measured by one or more
indicators, it is in principle possible to develop a composite well-
being index for Africa
• Similar process could perhaps be followed as was the case in
Bhutan – i.e. identify the dimensions of well-being (with
stakeholders) and identify or develop suitable indicators
• Could then be integrated into the policy/project decision making
process to ensure that all new proposed policies/ projects will in
fact contribute towards improving well-being
Thank you!
Questions / Discussion
Anton Nahman
Tel: +27 (0) 21 888 2403
Email: [email protected]
Senior environmental economist
CSIR