Embed Size (px)
Citation preview

@stekenwright
Second-screensearch
Stephen Kenwright @stekenwright

@stekenwright
“I want to be buried with a mobile phone,just in case I’m not dead.”
Amanda Holden
Tom Dymond/SYCO/THAMES TV/PA Wire
@stekenwright
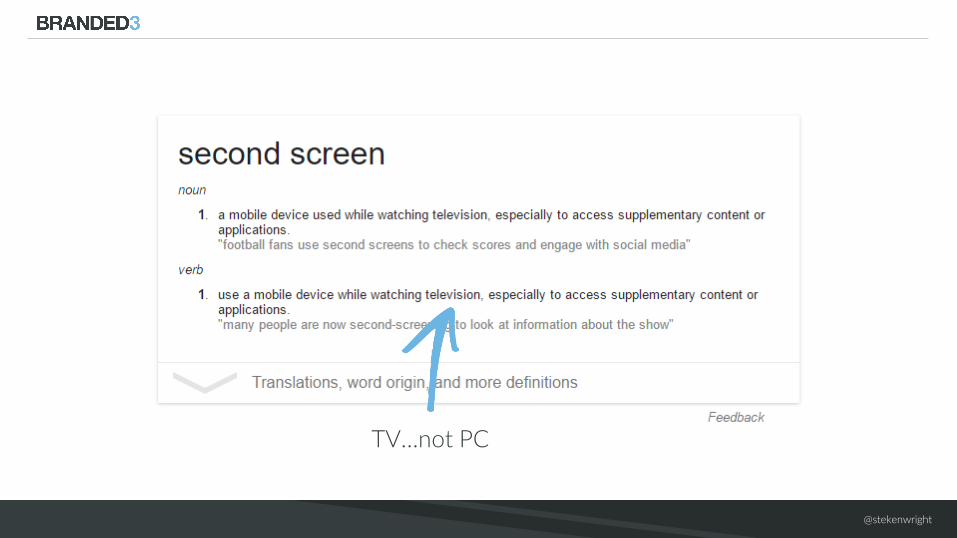
TV…not PC
@stekenwright
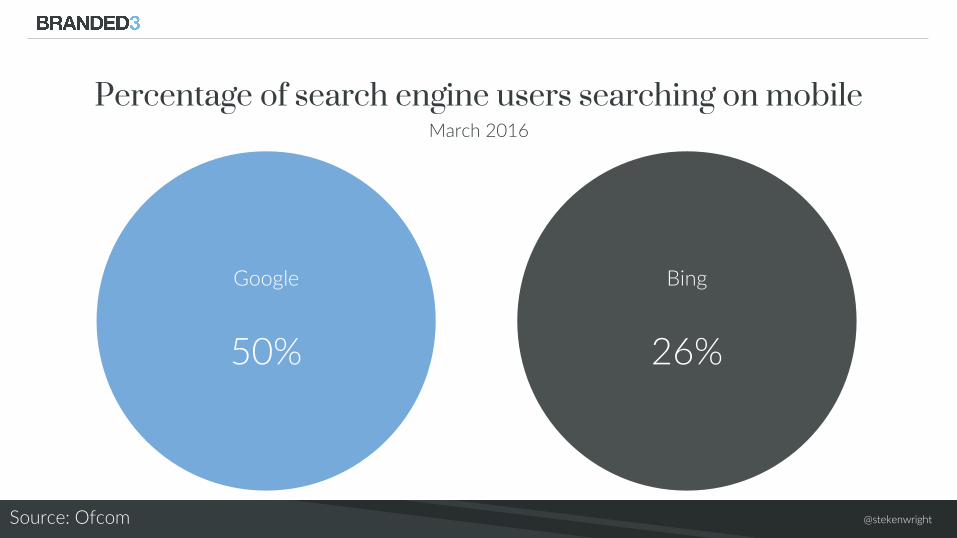
Percentage of search engine users searching on mobileMarch 2016
50%
Bing
26%
Source: Ofcom
@stekenwright
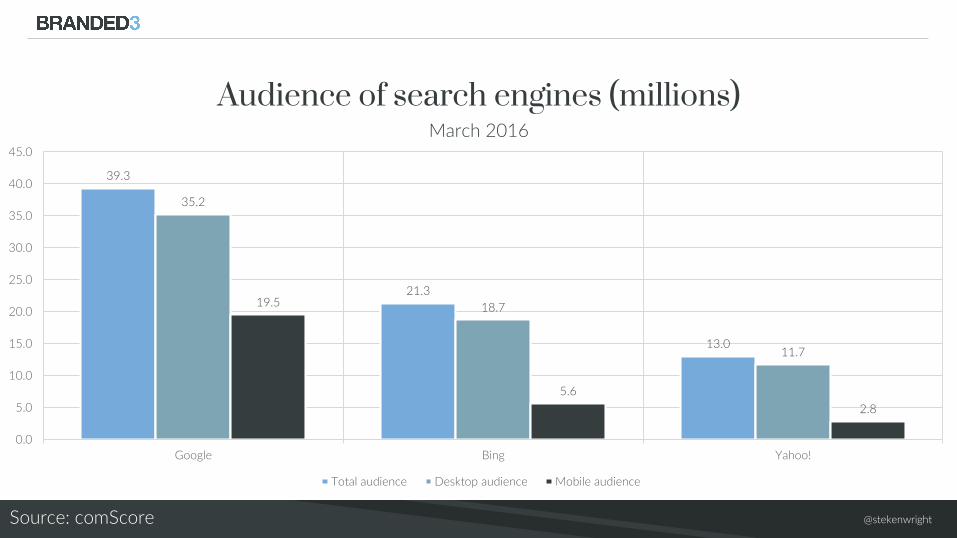
39.3
21.3
13.0
35.2
18.7
11.7
19.5
5.6
2.8
0.0
5.0
10.0
15.0
20.0
25.0
30.0
35.0
40.0
45.0
Google Bing Yahoo!
Total audience Desktop audience Mobile audience
Audience of search engines (millions)March 2016
Source: comScore
@stekenwright
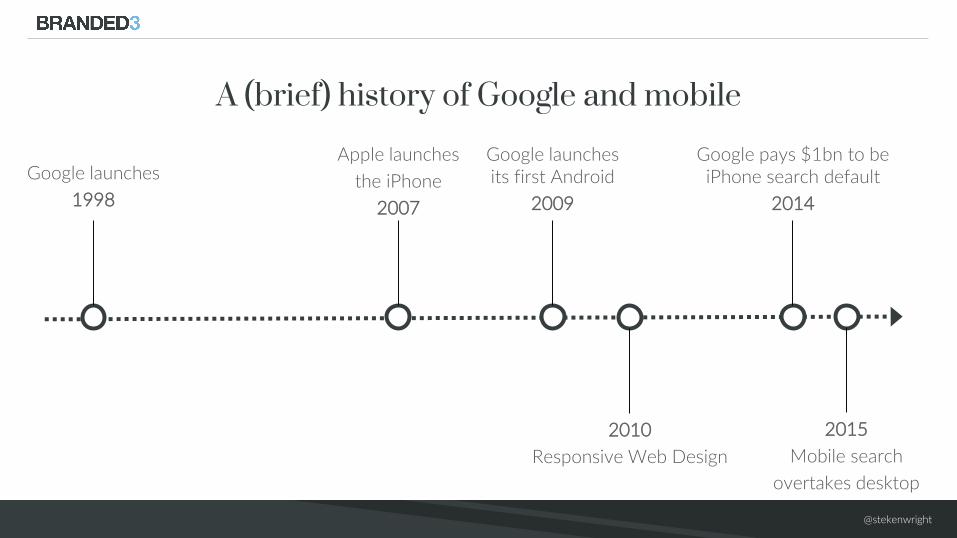
A (brief) history of Google and mobileApple launches
the iPhone
2007
2010
Responsive Web Design
Google launches
1998
Google launchesits first Android
2009
2015
Mobile search
overtakes desktop
Google pays $1bn to be iPhone search default
2014
@stekenwright
The iPhone predates Responsive Web Designby at least 3 years

@stekenwright
“Get your content to go anywhere,because it’s going to go everywhere.”
Brad Frost
Don Clark / Brand New
@stekenwright
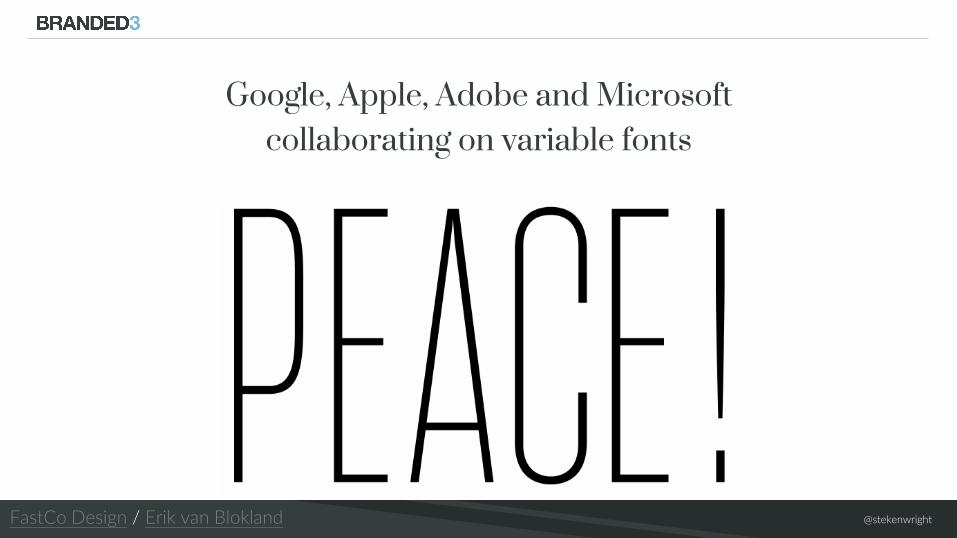
Google, Apple, Adobe and Microsoft collaborating on variable fonts
FastCo Design / Erik van Blokland
@stekenwright
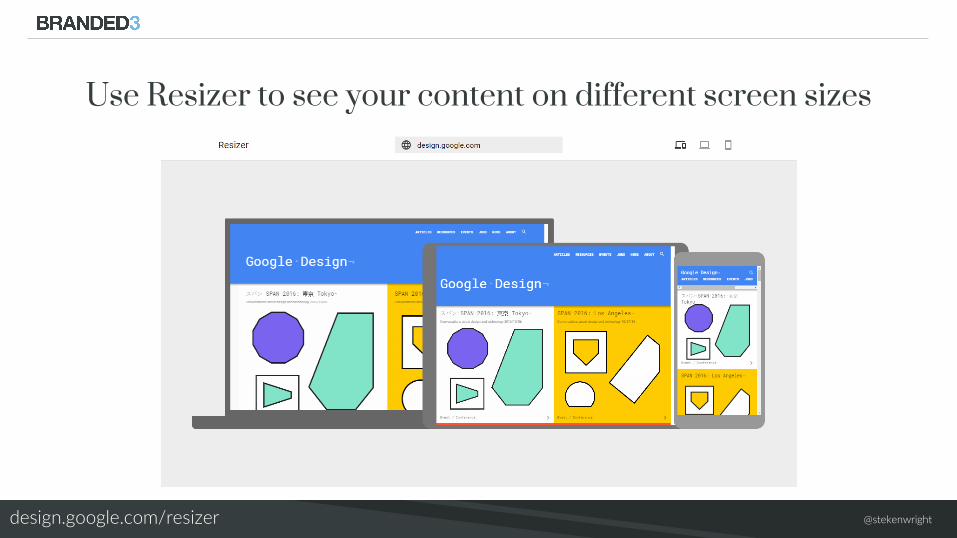
Use Resizer to see your content on different screen sizes
design.google.com/resizer
@stekenwright
@stekenwright
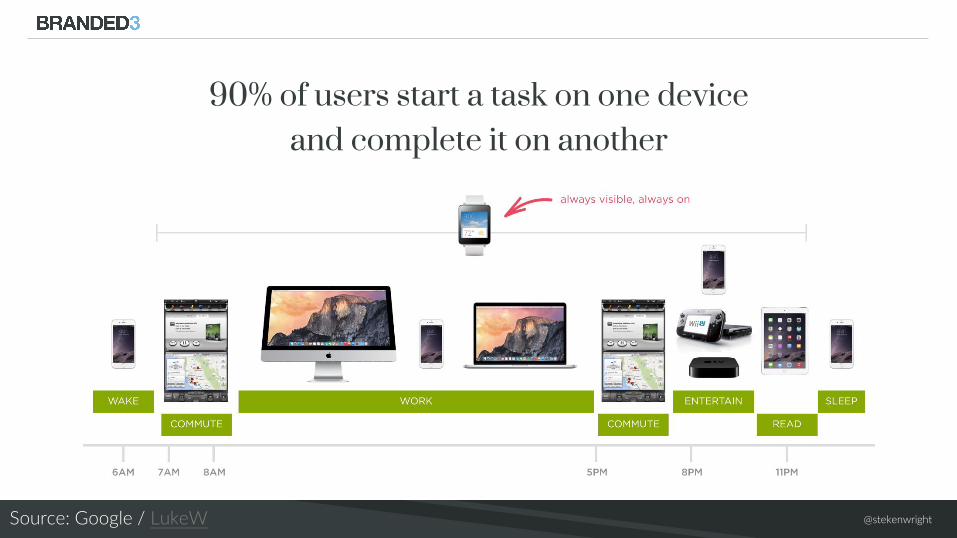
90% of users start a task on one deviceand complete it on another
Source: Google / LukeW
@stekenwright
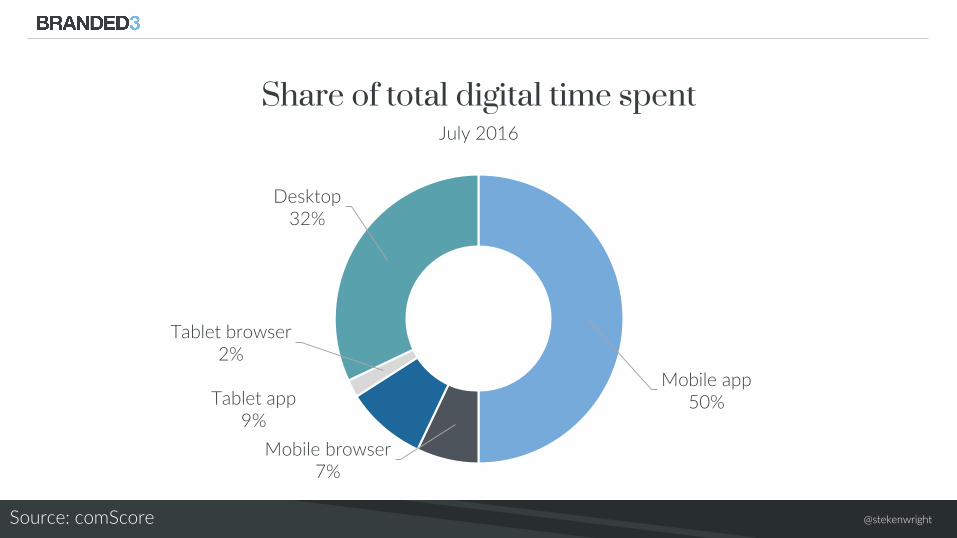
Mobile app50%
Mobile browser7%
Tablet app9%
Tablet browser2%
Desktop32%
Share of total digital time spentJuly 2016
Source: comScore
@stekenwright
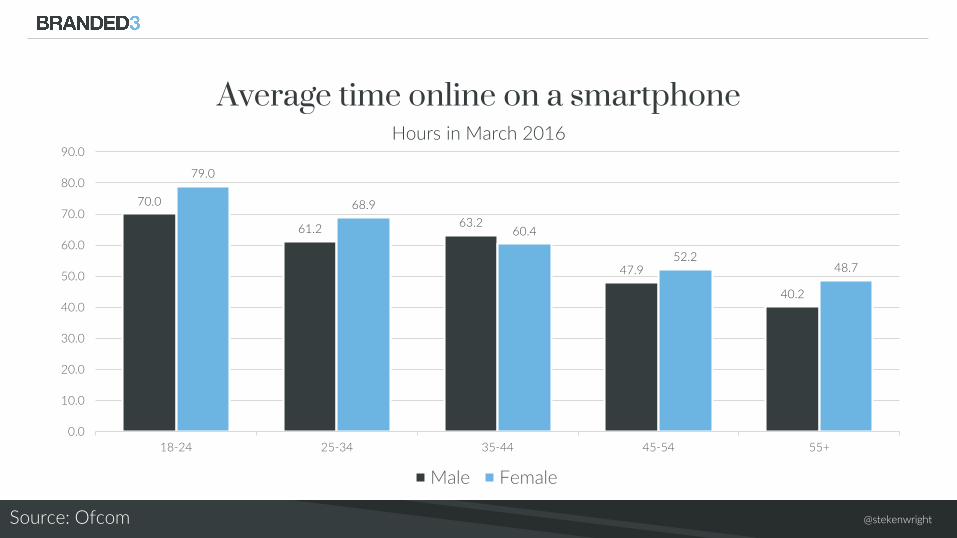
70.0
61.263.2
47.9
40.2
79.0
68.9
60.4
52.248.7
0.0
10.0
20.0
30.0
40.0
50.0
60.0
70.0
80.0
90.0
18-24 25-34 35-44 45-54 55+
Male Female
Average time online on a smartphoneHours in March 2016
Source: Ofcom
@stekenwright
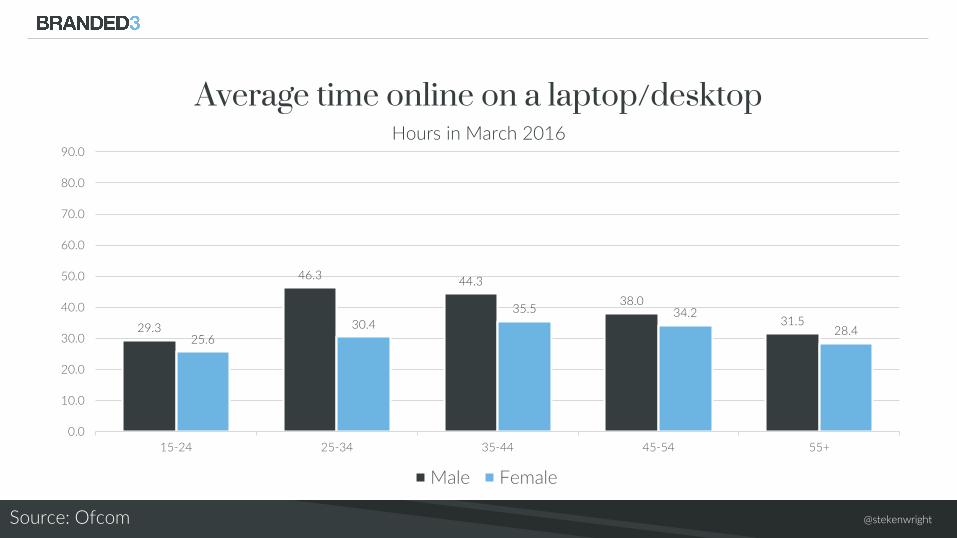
29.3
46.344.3
38.0
31.5
25.630.4
35.5 34.2
28.4
0.0
10.0
20.0
30.0
40.0
50.0
60.0
70.0
80.0
90.0
15-24 25-34 35-44 45-54 55+
Male Female
Average time online on a laptop/desktopHours in March 2016
Source: Ofcom
@stekenwright
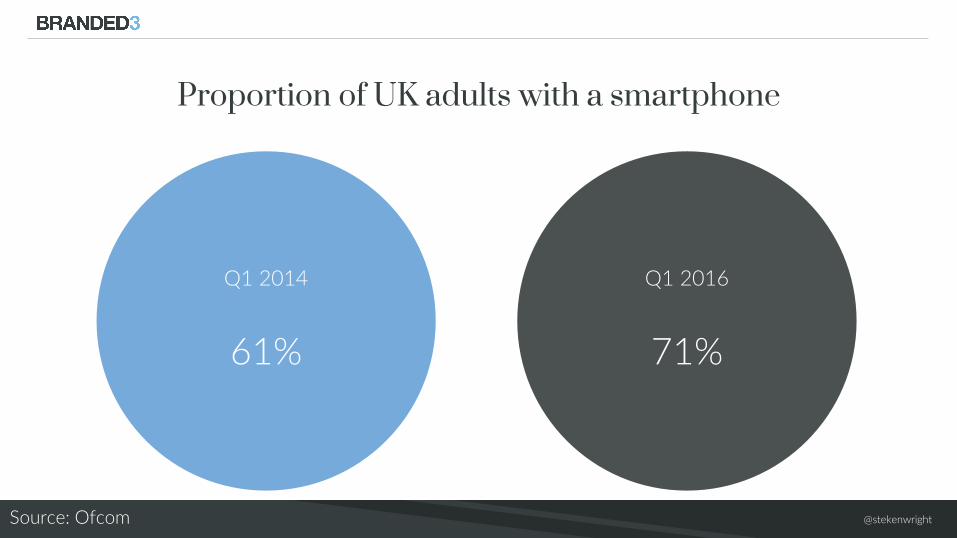
Proportion of UK adults with a smartphone
Q1 2014
61%
Q1 2016
71%
Source: Ofcom
@stekenwright
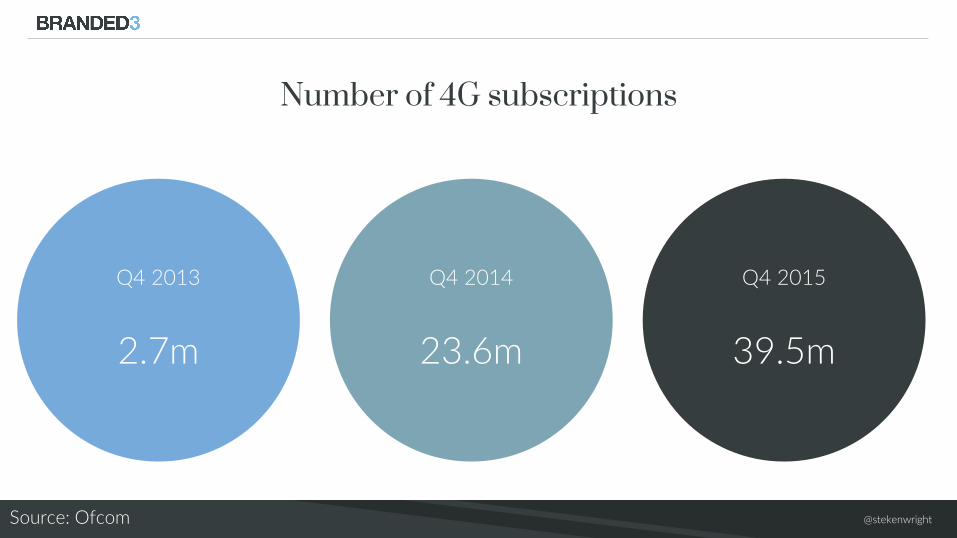
Number of 4G subscriptions
Q4 2013
2.7m
Source: Ofcom
Q4 2014
23.6m
Q4 2015
39.5m
@stekenwright
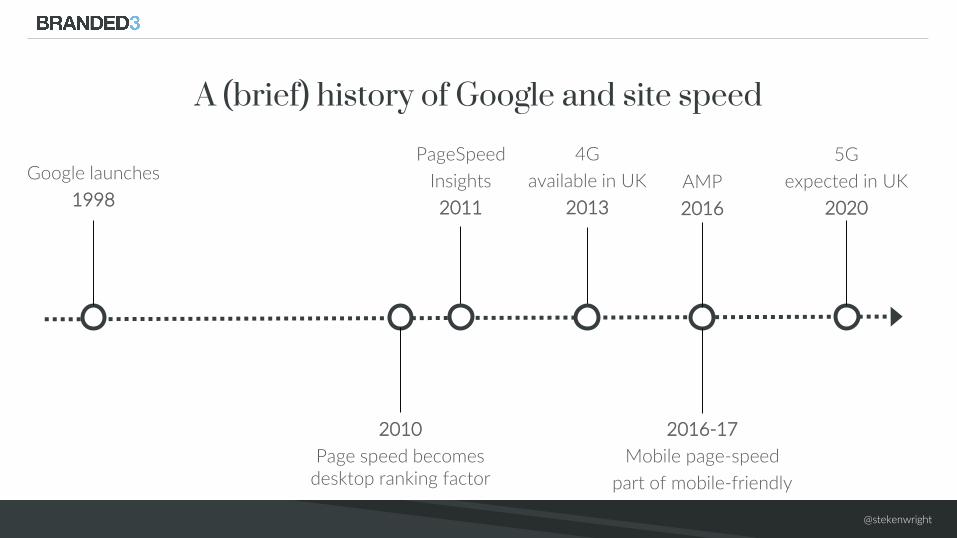
A (brief) history of Google and site speed
2010
Page speed becomes desktop ranking factor
Google launches
1998
2016-17
Mobile page-speed
part of mobile-friendly
5G
expected in UK
2020
4G
available in UK
2013
PageSpeed
Insights
2011
AMP
2016
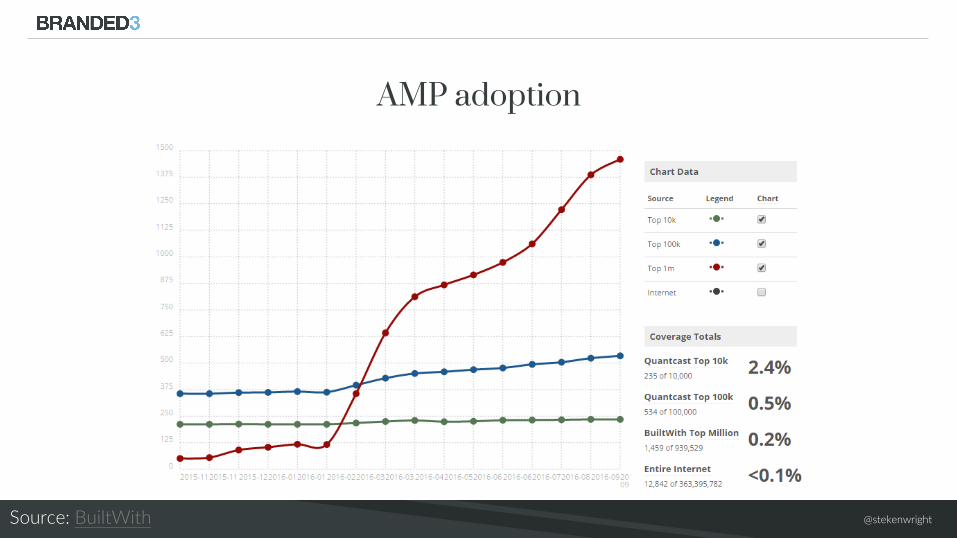
@stekenwrightSource: BuiltWith
AMP adoption
@stekenwright
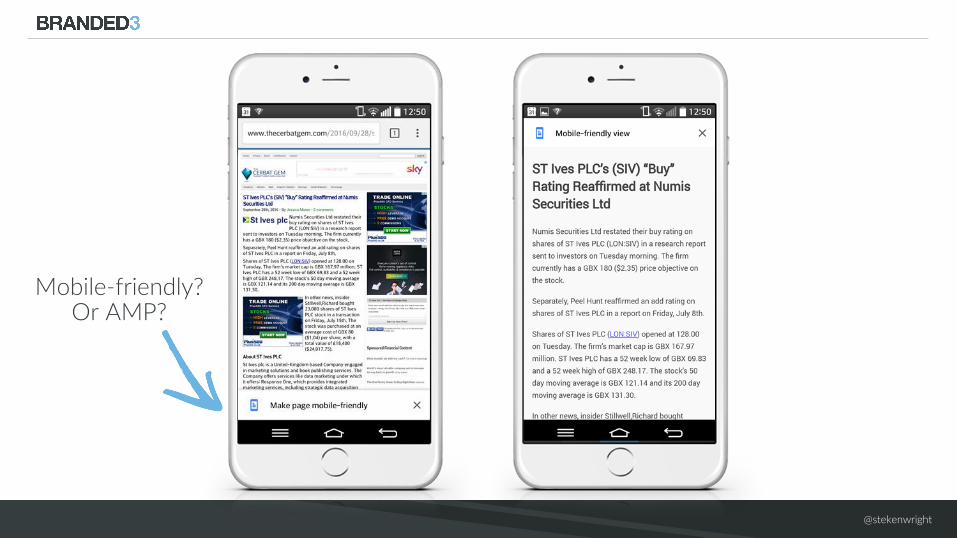
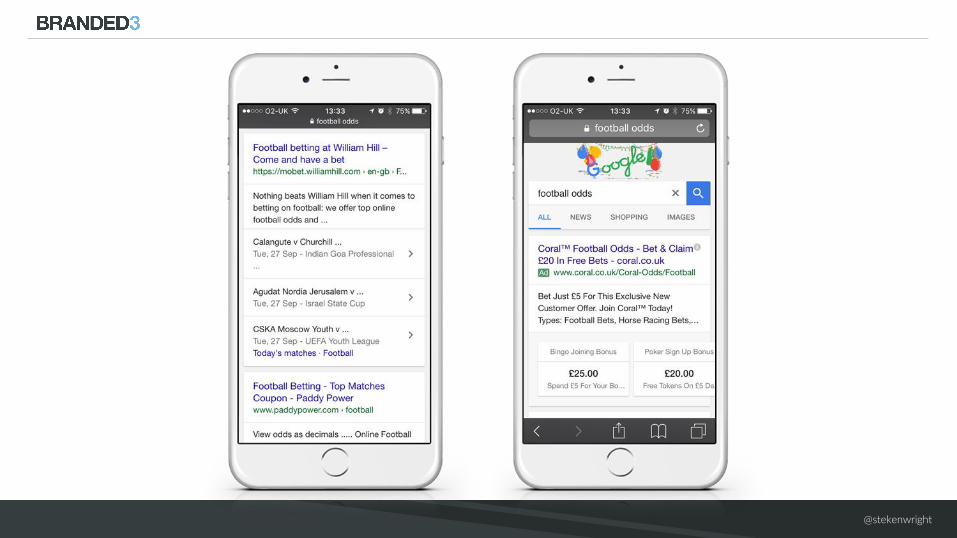
Mobile-friendly? Or AMP?
@stekenwright
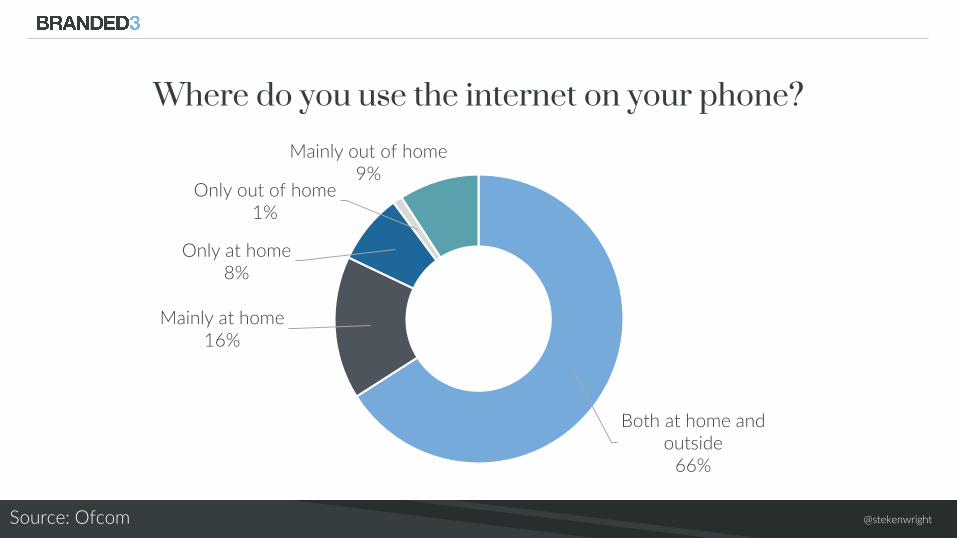
Both at home and outside
66%
Mainly at home16%
Only at home8%
Only out of home1%
Mainly out of home9%
Where do you use the internet on your phone?
Source: Ofcom
@stekenwright
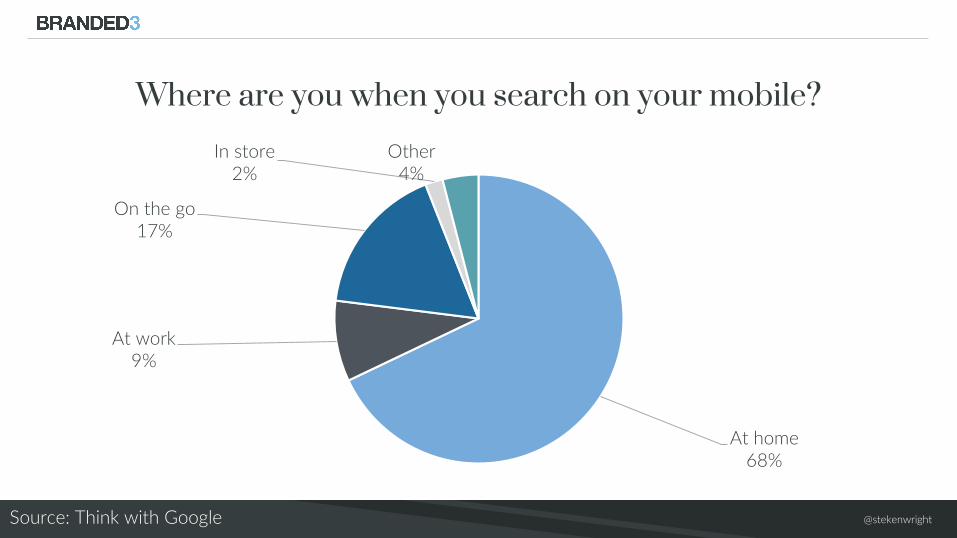
At home68%
At work9%
On the go17%
In store2%
Other4%
Where are you when you search on your mobile?
Source: Think with Google
@stekenwright
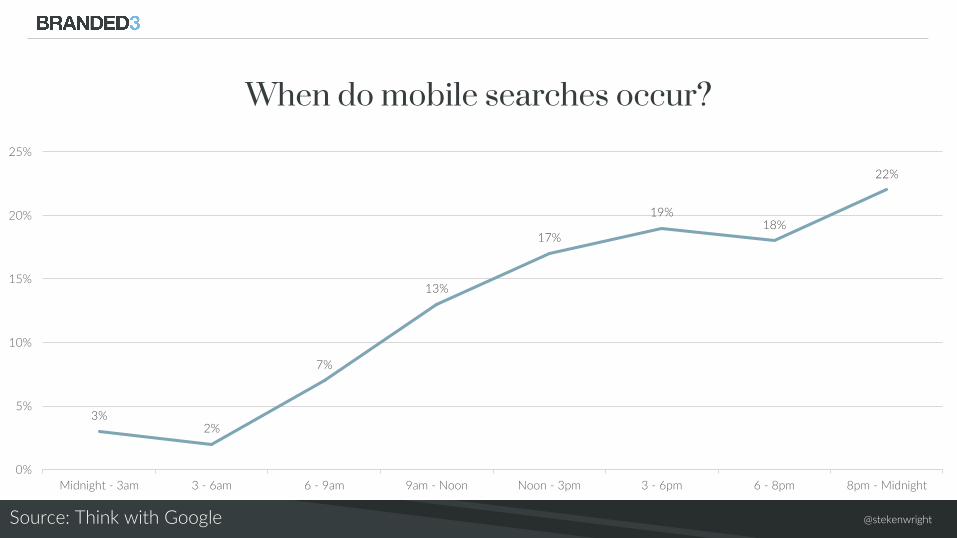
3%2%
7%
13%
17%
19%18%
22%
0%
5%
10%
15%
20%
25%
Midnight - 3am 3 - 6am 6 - 9am 9am - Noon Noon - 3pm 3 - 6pm 6 - 8pm 8pm - Midnight
When do mobile searches occur?
Source: Think with Google
@stekenwright
36.1% used their smartphone while watching TV
Source: comScore
@stekenwright
8.6% research products or services advertisedon TV programme
Source: comScore
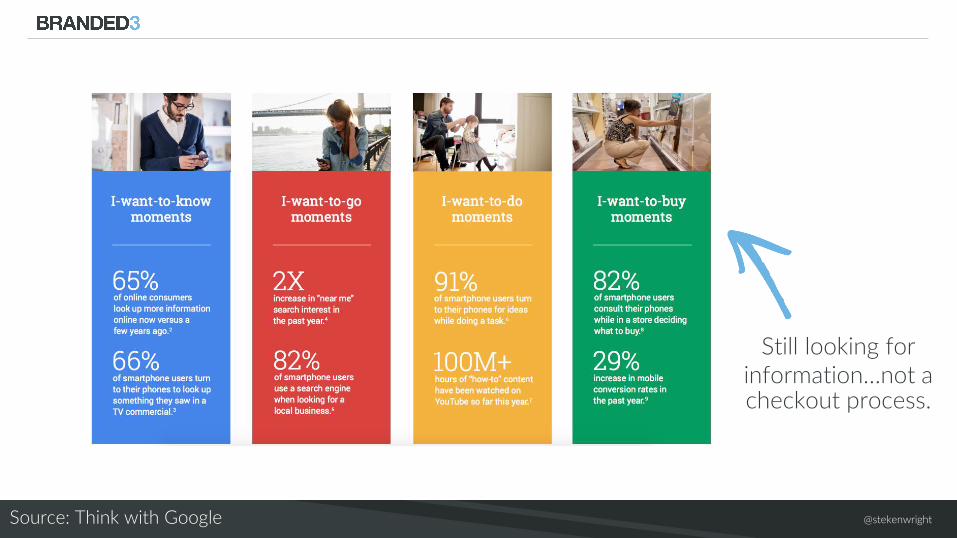
@stekenwrightSource: Think with Google
Still looking for information…not a checkout process.
@stekenwright
@stekenwright
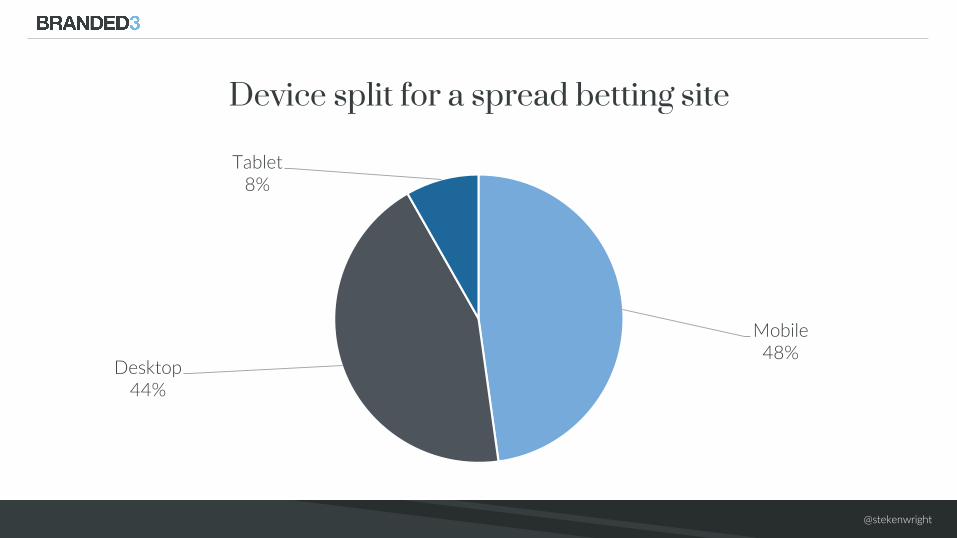
Mobile48%
Desktop44%
Tablet8%
Device split for a spread betting site

@stekenwright
Conversion rateLead gen website
Mobile
6.79%
Desktop
4.30%
Tablet
4.57%
@stekenwright
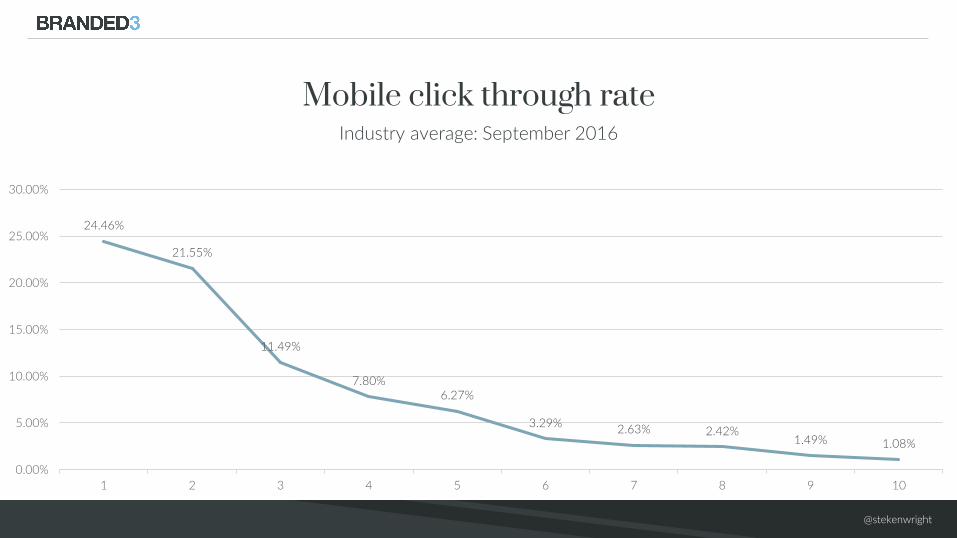
24.46%
21.55%
11.49%
7.80%6.27%
3.29%2.63% 2.42%
1.49% 1.08%
0.00%
5.00%
10.00%
15.00%
20.00%
25.00%
30.00%
1 2 3 4 5 6 7 8 9 10
Mobile click through rateIndustry average: September 2016
@stekenwright
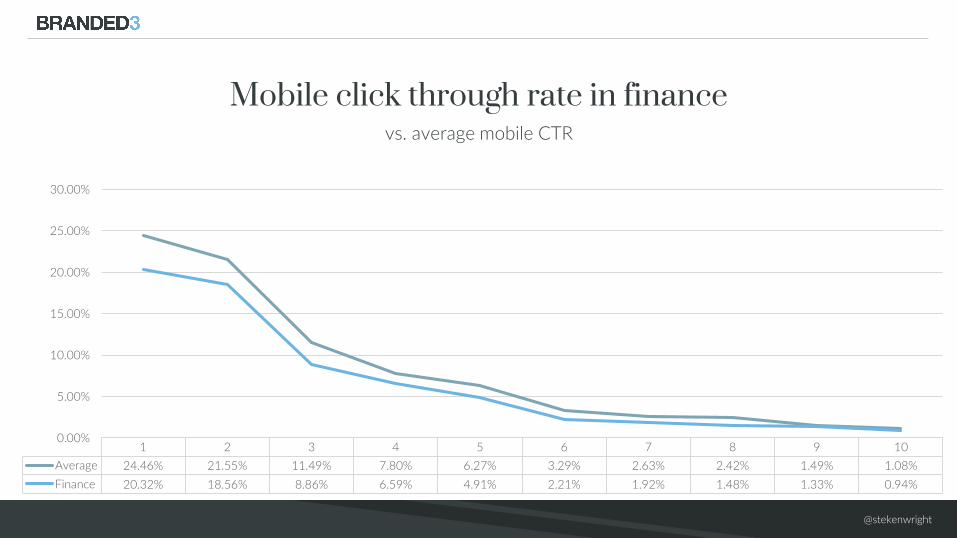
1 2 3 4 5 6 7 8 9 10
Average 24.46% 21.55% 11.49% 7.80% 6.27% 3.29% 2.63% 2.42% 1.49% 1.08%
Finance 20.32% 18.56% 8.86% 6.59% 4.91% 2.21% 1.92% 1.48% 1.33% 0.94%
0.00%
5.00%
10.00%
15.00%
20.00%
25.00%
30.00%
Mobile click through rate in financevs. average mobile CTR
@stekenwright
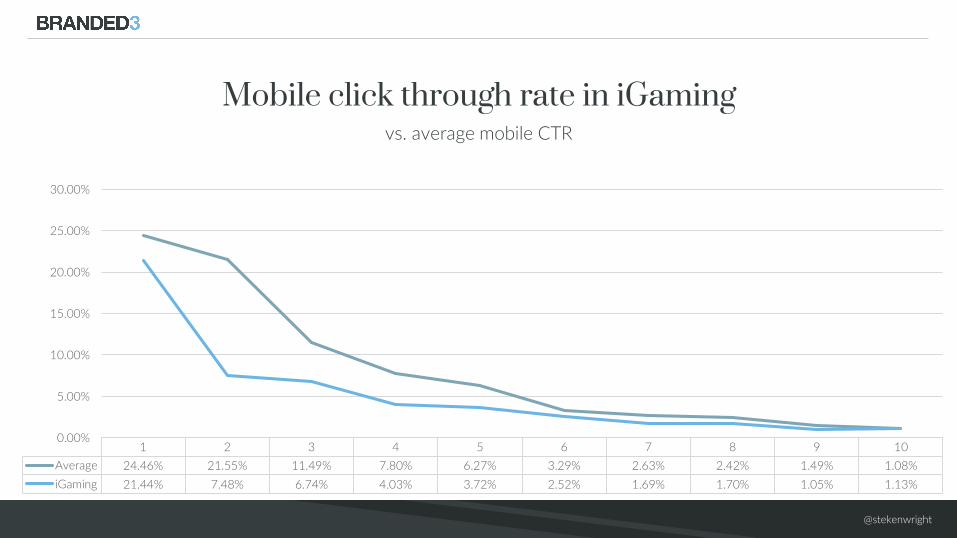
1 2 3 4 5 6 7 8 9 10
Average 24.46% 21.55% 11.49% 7.80% 6.27% 3.29% 2.63% 2.42% 1.49% 1.08%
iGaming 21.44% 7.48% 6.74% 4.03% 3.72% 2.52% 1.69% 1.70% 1.05% 1.13%
0.00%
5.00%
10.00%
15.00%
20.00%
25.00%
30.00%
Mobile click through rate in iGamingvs. average mobile CTR
@stekenwright
@stekenwright
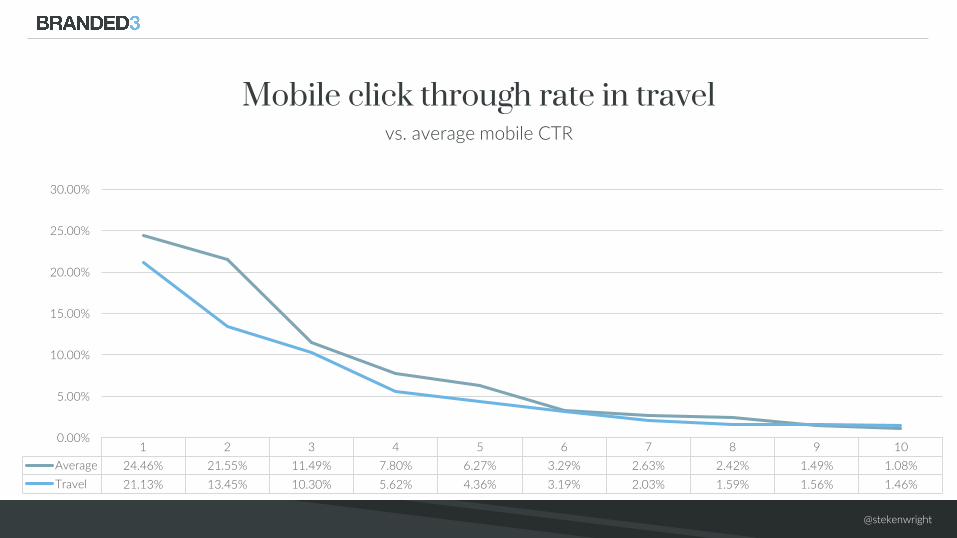
1 2 3 4 5 6 7 8 9 10
Average 24.46% 21.55% 11.49% 7.80% 6.27% 3.29% 2.63% 2.42% 1.49% 1.08%
Travel 21.13% 13.45% 10.30% 5.62% 4.36% 3.19% 2.03% 1.59% 1.56% 1.46%
0.00%
5.00%
10.00%
15.00%
20.00%
25.00%
30.00%
Mobile click through rate in travelvs. average mobile CTR

@stekenwright
Morebranded3.com/blog/mobile-ctr
@stekenwright
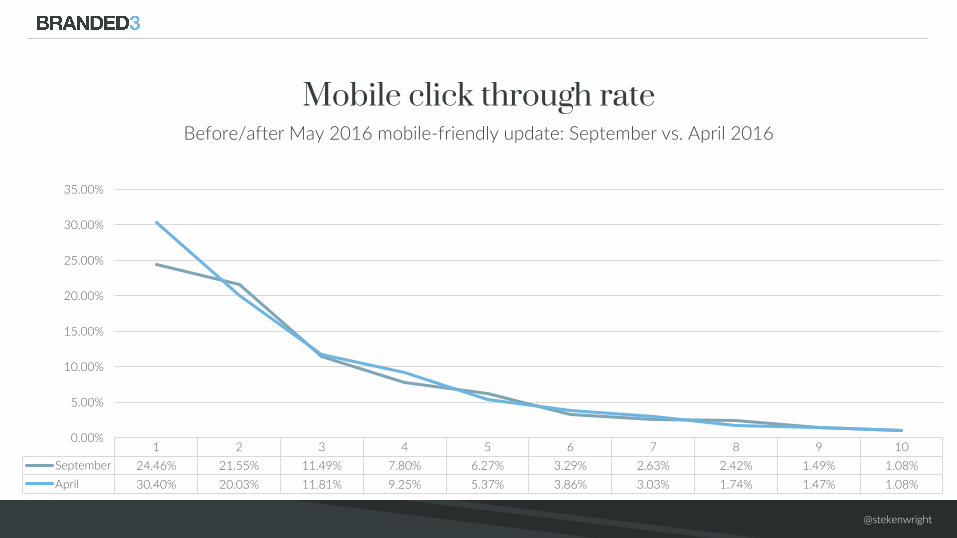
1 2 3 4 5 6 7 8 9 10
September 24.46% 21.55% 11.49% 7.80% 6.27% 3.29% 2.63% 2.42% 1.49% 1.08%
April 30.40% 20.03% 11.81% 9.25% 5.37% 3.86% 3.03% 1.74% 1.47% 1.08%
0.00%
5.00%
10.00%
15.00%
20.00%
25.00%
30.00%
35.00%
Mobile click through rateBefore/after May 2016 mobile-friendly update: September vs. April 2016
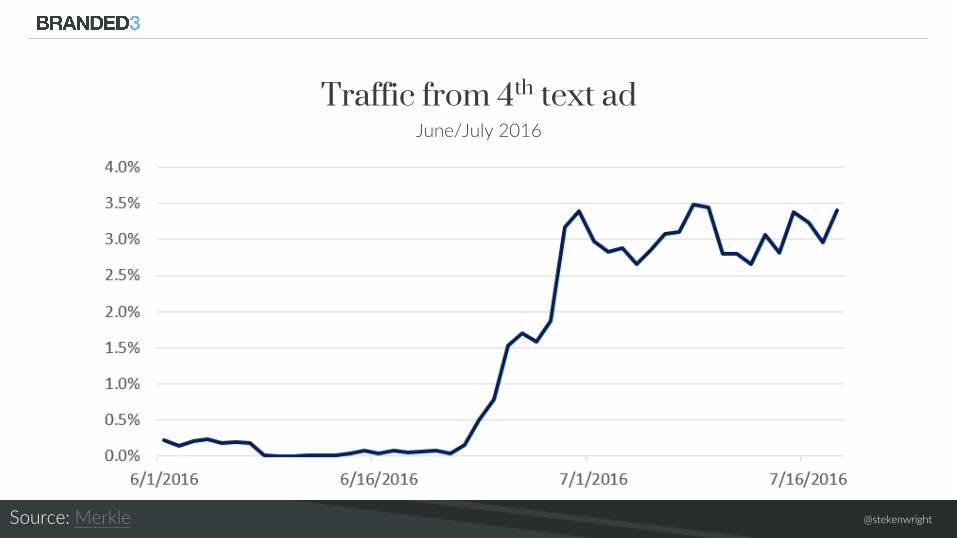
@stekenwrightSource: Merkle
Traffic from 4th text adJune/July 2016
@stekenwright
85% of all pages in the mobile search resultsmeet mobile-friendly criteria
Source: Google
@stekenwright
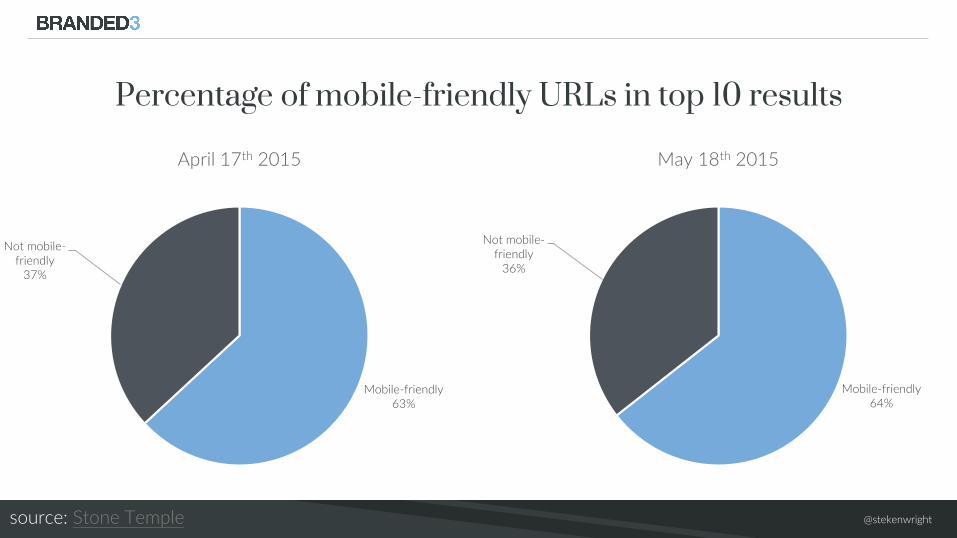
Mobile-friendly63%
Not mobile-friendly
37%
April 17th 2015
Percentage of mobile-friendly URLs in top 10 results
Mobile-friendly64%
Not mobile-friendly
36%
May 18th 2015
source: Stone Temple
@stekenwright
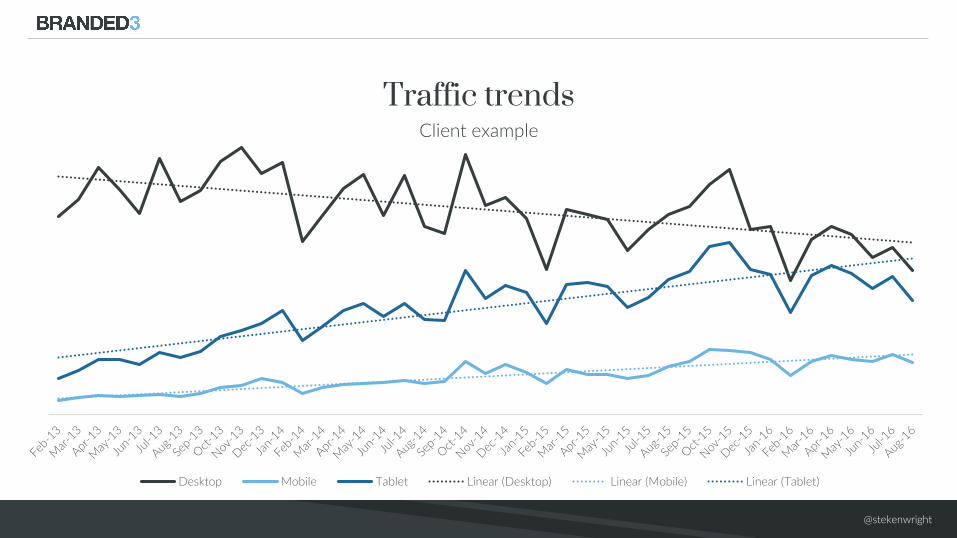
Traffic trendsClient example
Desktop Mobile Tablet Linear (Desktop) Linear (Mobile) Linear (Tablet)
@stekenwright
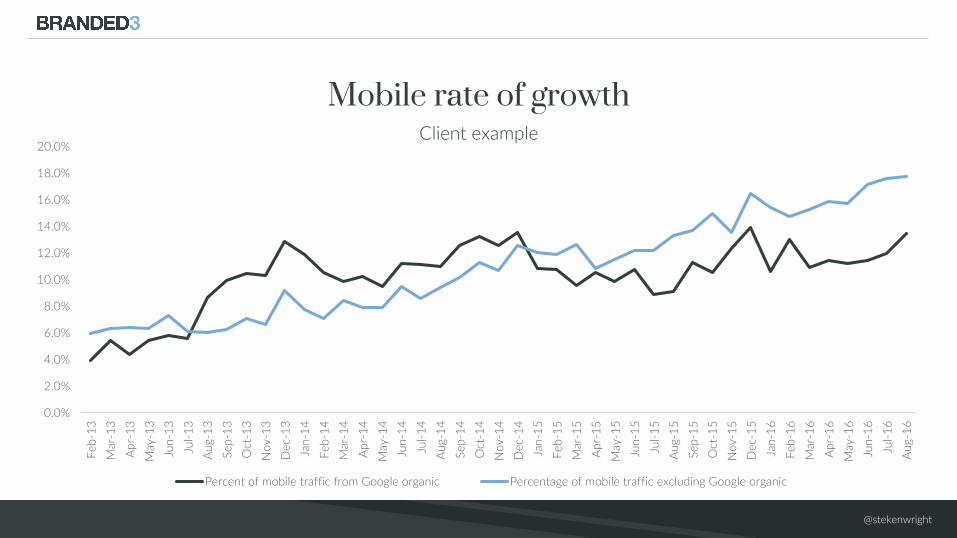
Mobile rate of growthClient example
0.0%
2.0%
4.0%
6.0%
8.0%
10.0%
12.0%
14.0%
16.0%
18.0%
20.0%
Feb
-13
Mar
-13
Ap
r-1
3
May
-13
Jun
-13
Jul-
13
Au
g-1
3
Sep
-13
Oct
-13
No
v-1
3
Dec-
13
Jan
-14
Feb
-14
Mar
-14
Ap
r-1
4
May
-14
Jun
-14
Jul-
14
Aug-1
4
Sep
-14
Oct
-14
No
v-1
4
Dec-
14
Jan
-15
Feb
-15
Mar
-15
Ap
r-1
5
May
-15
Jun
-15
Jul-
15
Aug-1
5
Sep
-15
Oct
-15
No
v-1
5
Dec-
15
Jan
-16
Feb
-16
Mar
-16
Ap
r-1
6
May
-16
Jun
-16
Jul-
16
Aug-1
6
Percent of mobile traffic from Google organic Percentage of mobile traffic excluding Google organic
@stekenwright
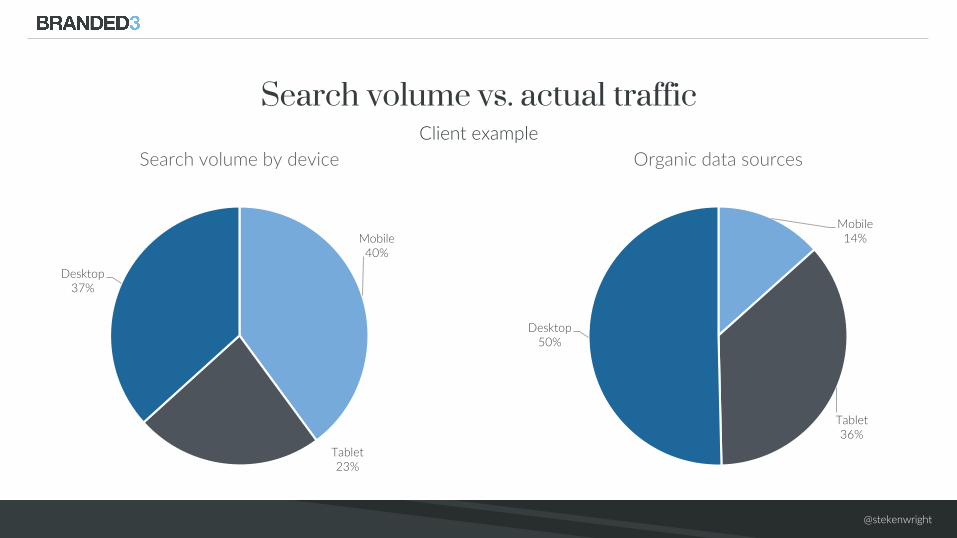
Mobile40%
Tablet23%
Desktop37%
Search volume by device
Search volume vs. actual trafficClient example
Mobile14%
Tablet36%
Desktop50%
Organic data sources
@stekenwright
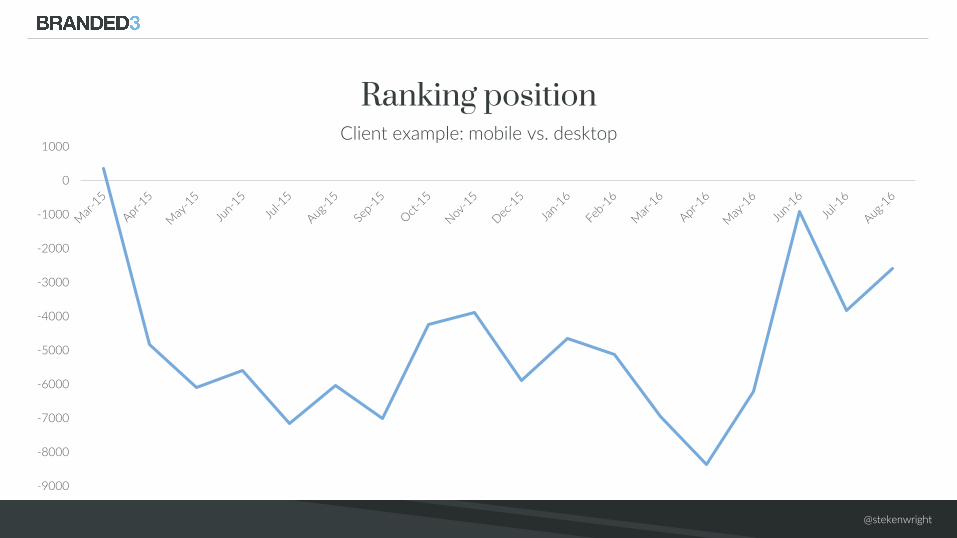
Ranking positionClient example: mobile vs. desktop
-9000
-8000
-7000
-6000
-5000
-4000
-3000
-2000
-1000
0
1000
@stekenwright
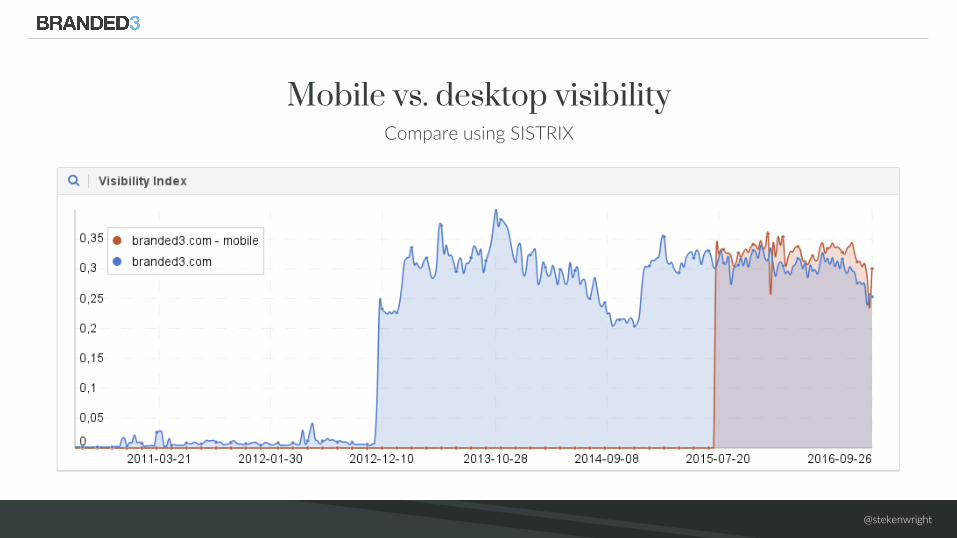
Mobile vs. desktop visibilityCompare using SISTRIX
@stekenwright
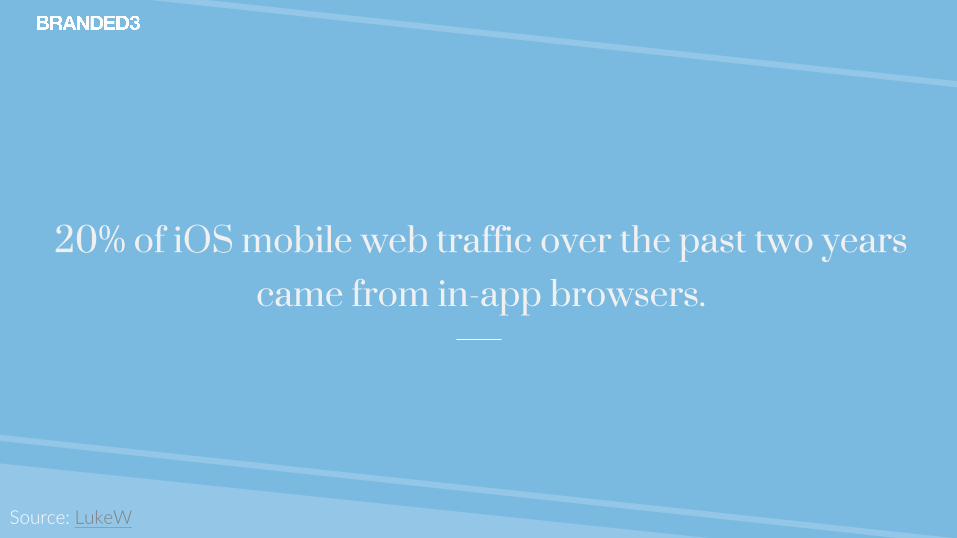
20% of iOS mobile web traffic over the past two years came from in-app browsers.
Source: LukeW
@stekenwright
0.00%
10.00%
20.00%
30.00%
40.00%
50.00%
60.00%
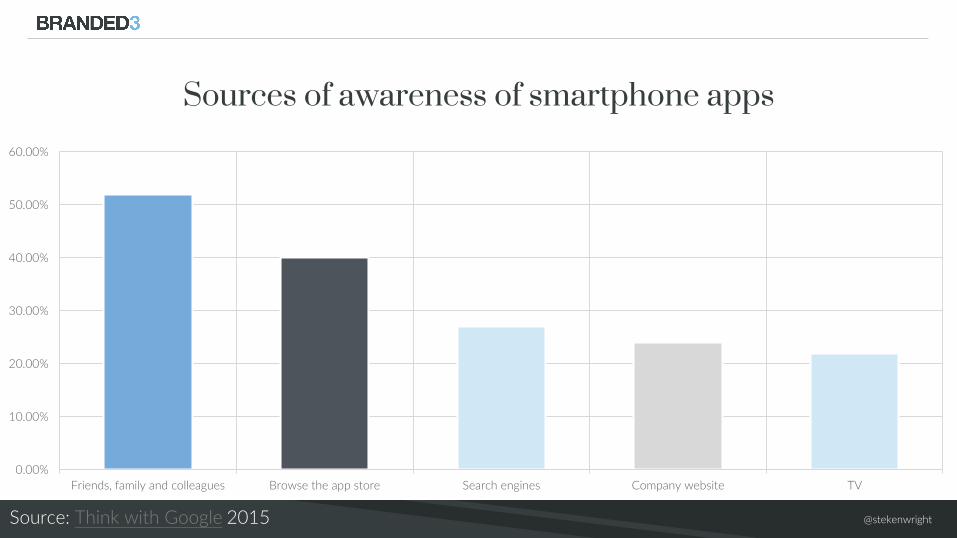
Friends, family and colleagues Browse the app store Search engines Company website TV
Sources of awareness of smartphone apps
Source: Think with Google 2015
@stekenwright
38.00%
40.00%
42.00%
44.00%
46.00%
48.00%
50.00%
52.00%
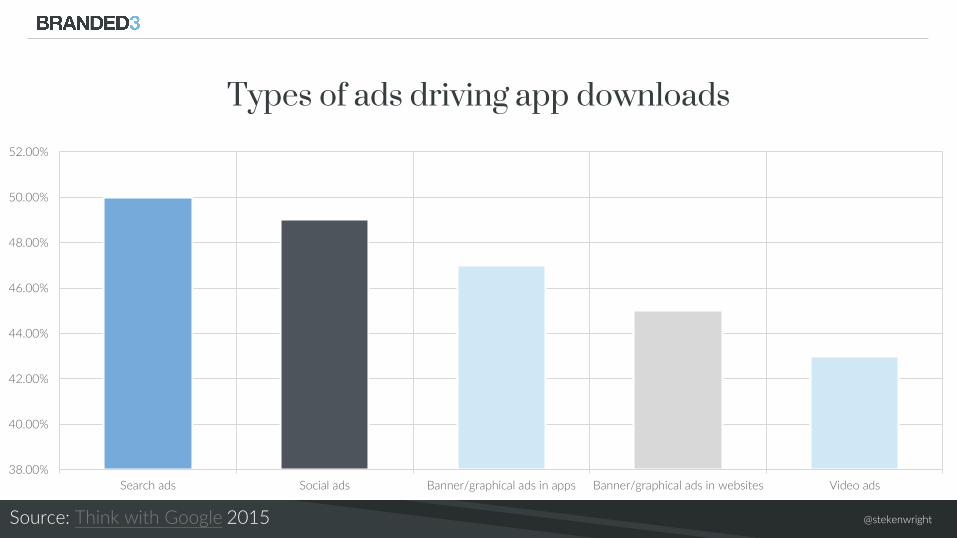
Search ads Social ads Banner/graphical ads in apps Banner/graphical ads in websites Video ads
Types of ads driving app downloads
Source: Think with Google 2015
@stekenwright
@stekenwright
@stekenwright
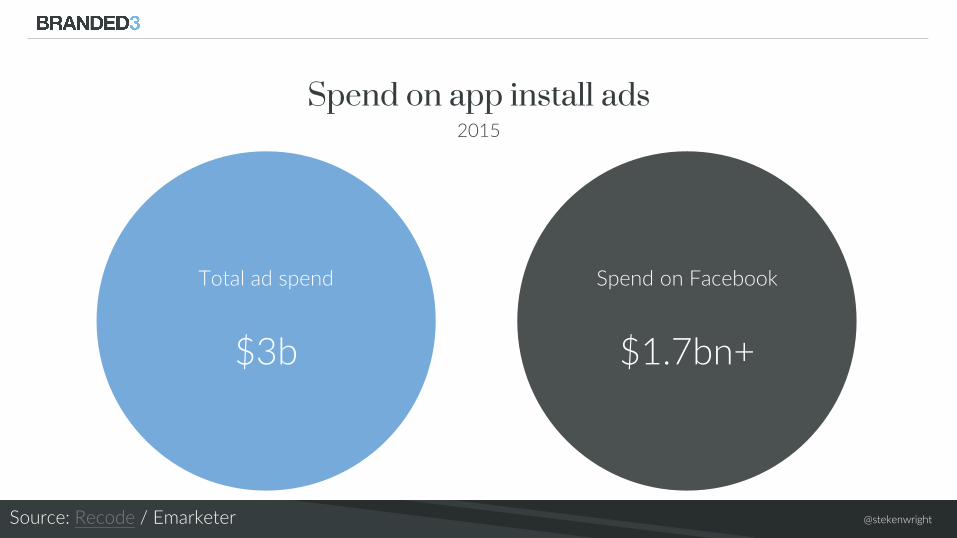
Spend on app install ads2015
Total ad spend
$3b
Spend on Facebook
$1.7bn+
Source: Recode / Emarketer
@stekenwright
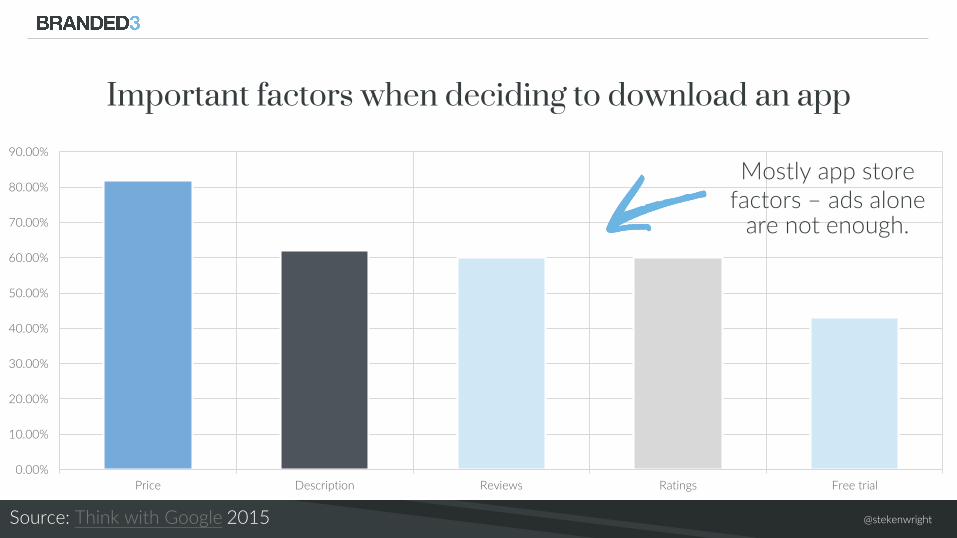
0.00%
10.00%
20.00%
30.00%
40.00%
50.00%
60.00%
70.00%
80.00%
90.00%
Price Description Reviews Ratings Free trial
Important factors when deciding to download an app
Source: Think with Google 2015
Mostly app store factors – ads alone
are not enough.
@stekenwright
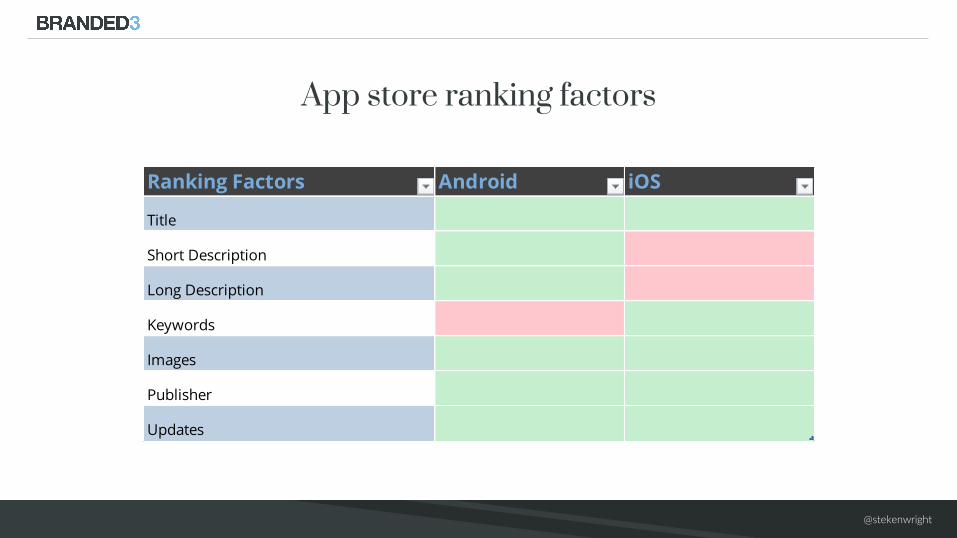
App store ranking factorsRanking Factors Android iOS
Title
Short Description
Long Description
Keywords
Images
Publisher
Updates
@stekenwright
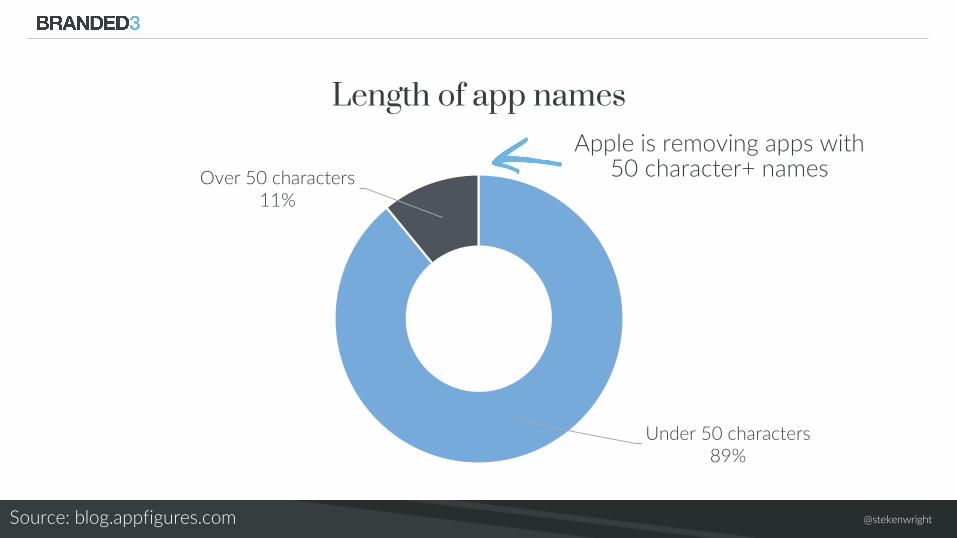
Under 50 characters89%
Over 50 characters11%
Length of app names
Source: blog.appfigures.com
Apple is removing apps with 50 character+ names
@stekenwright
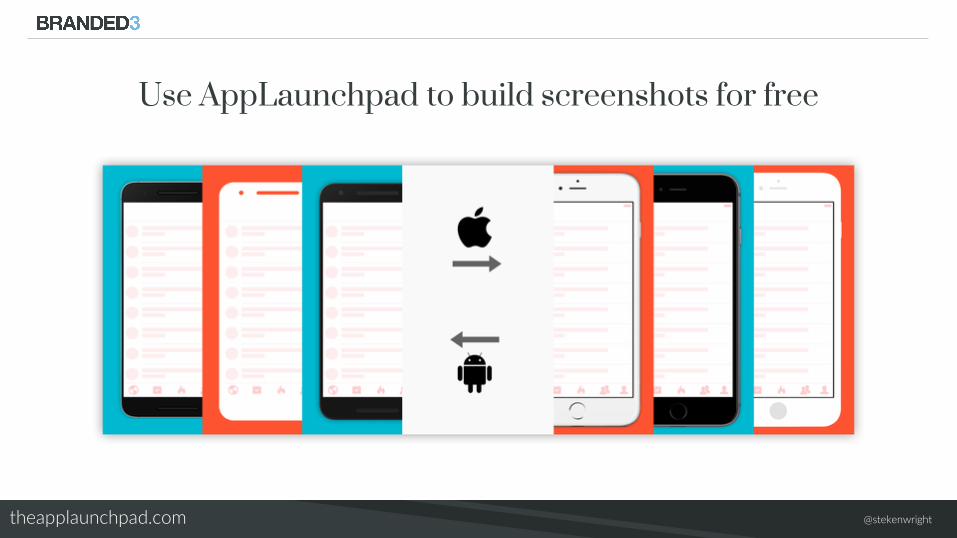
Use AppLaunchpad to build screenshots for free
theapplaunchpad.com
@stekenwright
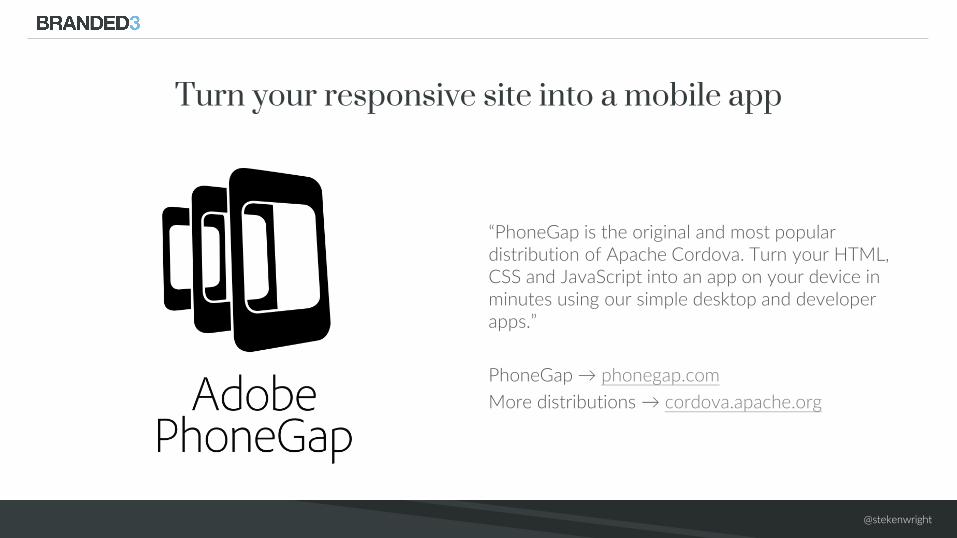
Turn your responsive site into a mobile app
“PhoneGap is the original and most popular distribution of Apache Cordova. Turn your HTML, CSS and JavaScript into an app on your device in minutes using our simple desktop and developer apps.”
PhoneGap → phonegap.com
More distributions → cordova.apache.org

@stekenwright
Downloadbranded3.com/blog/app-store-optimisation-checklist
@stekenwright
1 in 4 installed smartphone apps are never used
Source: Think with Google 2015
@stekenwright
“Money spent developing a pretty but limitediPhone app only benefits […] the few, but money spent on the
website UI would have benefitted everyone.”Gary Marshall
Credit: Anna Dahlström / clement127