Embed Size (px)
Citation preview
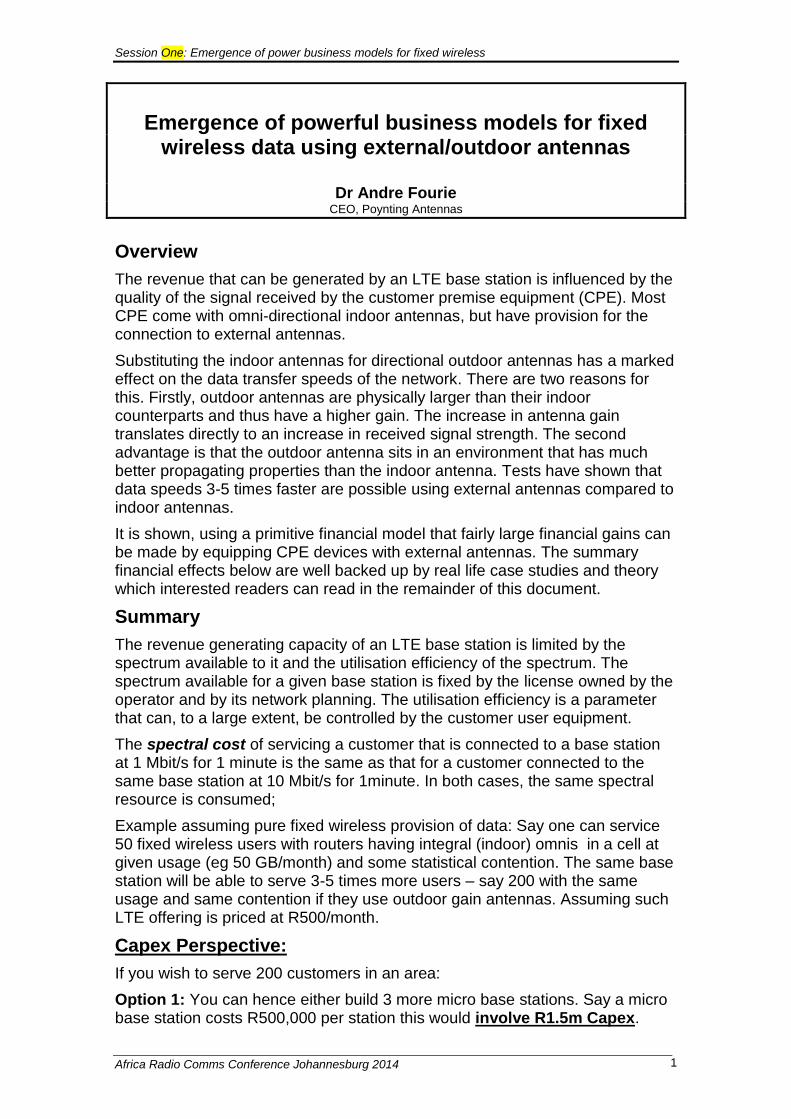
Session One: Emergence of power business models for fixed wireless
Africa Radio Comms Conference Johannesburg 2014 1
Emergence of powerful business models for fixed
wireless data using external/outdoor antennas
Dr Andre Fourie CEO, Poynting Antennas
Overview
The revenue that can be generated by an LTE base station is influenced by the quality of the signal received by the customer premise equipment (CPE). Most CPE come with omni-directional indoor antennas, but have provision for the connection to external antennas.
Substituting the indoor antennas for directional outdoor antennas has a marked effect on the data transfer speeds of the network. There are two reasons for this. Firstly, outdoor antennas are physically larger than their indoor counterparts and thus have a higher gain. The increase in antenna gain translates directly to an increase in received signal strength. The second advantage is that the outdoor antenna sits in an environment that has much better propagating properties than the indoor antenna. Tests have shown that data speeds 3-5 times faster are possible using external antennas compared to indoor antennas.
It is shown, using a primitive financial model that fairly large financial gains can be made by equipping CPE devices with external antennas. The summary financial effects below are well backed up by real life case studies and theory which interested readers can read in the remainder of this document.
Summary
The revenue generating capacity of an LTE base station is limited by the spectrum available to it and the utilisation efficiency of the spectrum. The spectrum available for a given base station is fixed by the license owned by the operator and by its network planning. The utilisation efficiency is a parameter that can, to a large extent, be controlled by the customer user equipment.
The spectral cost of servicing a customer that is connected to a base station at 1 Mbit/s for 1 minute is the same as that for a customer connected to the same base station at 10 Mbit/s for 1minute. In both cases, the same spectral resource is consumed;
Example assuming pure fixed wireless provision of data: Say one can service 50 fixed wireless users with routers having integral (indoor) omnis in a cell at given usage (eg 50 GB/month) and some statistical contention. The same base station will be able to serve 3-5 times more users – say 200 with the same usage and same contention if they use outdoor gain antennas. Assuming such LTE offering is priced at R500/month.
Capex Perspective:
If you wish to serve 200 customers in an area:
Option 1: You can hence either build 3 more micro base stations. Say a micro base station costs R500,000 per station this would involve R1.5m Capex.
Session One: Emergence of power business models for fixed wireless
Africa Radio Comms Conference Johannesburg 2014 2
Option 2: Installing an outdoor antenna including installation is about R2500/user. Rather allocate the Capex to the users and equip them with antennas which will cost R2500x200 requiring R500,00 Capex.
Gross Revenue Perspective:
Option 1: Indoor router and antennas: Operator can supply maximum of, say, 50 consumers in an existing cell with a certain fixed wireless offer. Typical subscription would be around R500/month. Annual revenue: R300,000/annum and over three years: R900,000
Option 2: Outdoor antenna linked to indoor router: Quite simply the same offer at same service can now be supplied to 200 users per base station. Annual Revenue R1,200,000/annum with a first year additional cost (antenna+installation) of R500,000 giving. Three year income of: R3,100,00.
BOTTOM LINE:
Outdoor gain antennas can reduce Capex by 66% and provides same income from Capex perspective after including COST OF EXTERNAL ANTENNA + INSTALLATION into Capex.
From revenue perspective operators can increase net revenue by 200% per cell AFTER COST OF EXTERNAL ANTENNA + INSTALLATION subtracted.
In addition outdoor antenna usage offers following benefits:
Gives better user experience, reliable link and higher instantaneous
speeds
Radio planning involving “cells within cells”, interference and other
propagation issues avoided.
Maintenance, site acquisition, power consumption and other OPEX
reduced
Clearly the numbers above will change depending on operator real figures, but these are fairly representative and real life numbers can be substituted which likely will provide similar values.
Session One: Emergence of power business models for fixed wireless
Africa Radio Comms Conference Johannesburg 2014 3
Measurement and Theory to substantiate the business case above.
Testing the effect external directional antennas have on LTE data transfer speeds
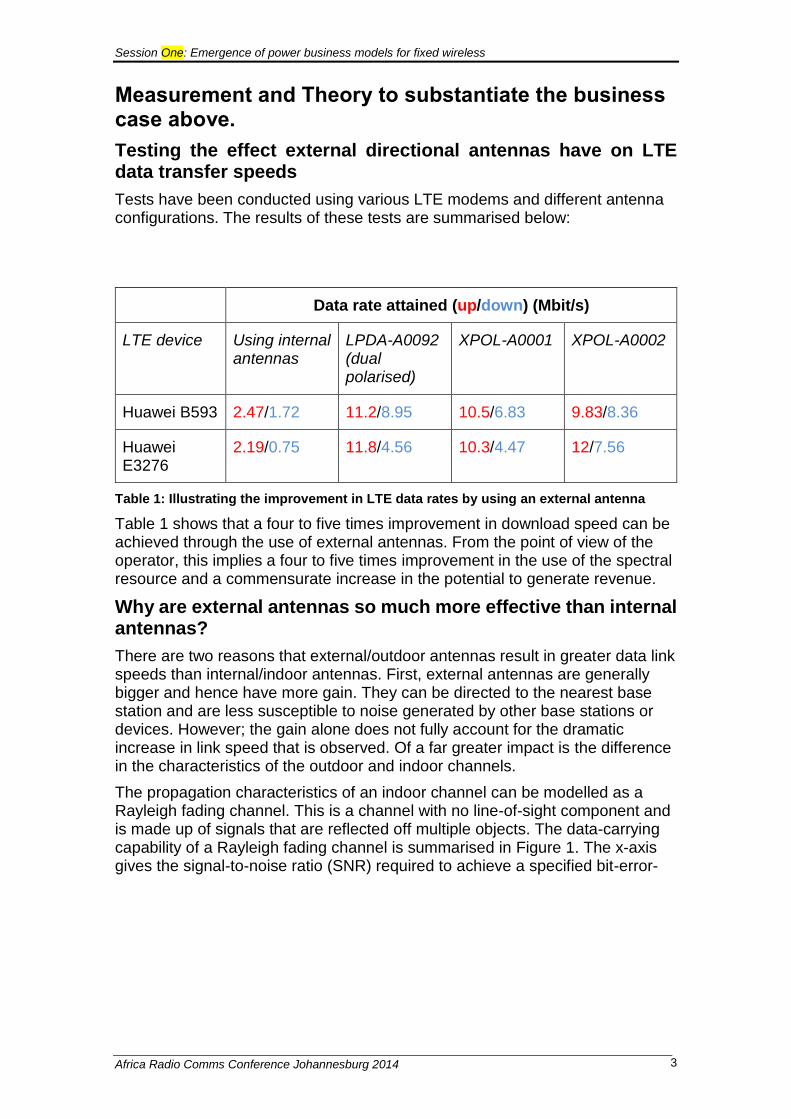
Tests have been conducted using various LTE modems and different antenna configurations. The results of these tests are summarised below:
Data rate attained (up/down) (Mbit/s)
LTE device Using internal antennas
LPDA-A0092 (dual polarised)
XPOL-A0001 XPOL-A0002
Huawei B593 2.47/1.72 11.2/8.95 10.5/6.83 9.83/8.36
Huawei E3276
2.19/0.75 11.8/4.56 10.3/4.47 12/7.56
Table 1: Illustrating the improvement in LTE data rates by using an external antenna
Table 1 shows that a four to five times improvement in download speed can be achieved through the use of external antennas. From the point of view of the operator, this implies a four to five times improvement in the use of the spectral resource and a commensurate increase in the potential to generate revenue.
Why are external antennas so much more effective than internal antennas?
There are two reasons that external/outdoor antennas result in greater data link speeds than internal/indoor antennas. First, external antennas are generally bigger and hence have more gain. They can be directed to the nearest base station and are less susceptible to noise generated by other base stations or devices. However; the gain alone does not fully account for the dramatic increase in link speed that is observed. Of a far greater impact is the difference in the characteristics of the outdoor and indoor channels.
The propagation characteristics of an indoor channel can be modelled as a Rayleigh fading channel. This is a channel with no line-of-sight component and is made up of signals that are reflected off multiple objects. The data-carrying capability of a Rayleigh fading channel is summarised in Figure 1. The x-axis gives the signal-to-noise ratio (SNR) required to achieve a specified bit-error-
Session One: Emergence of power business models for fixed wireless
Africa Radio Comms Conference Johannesburg 2014 4
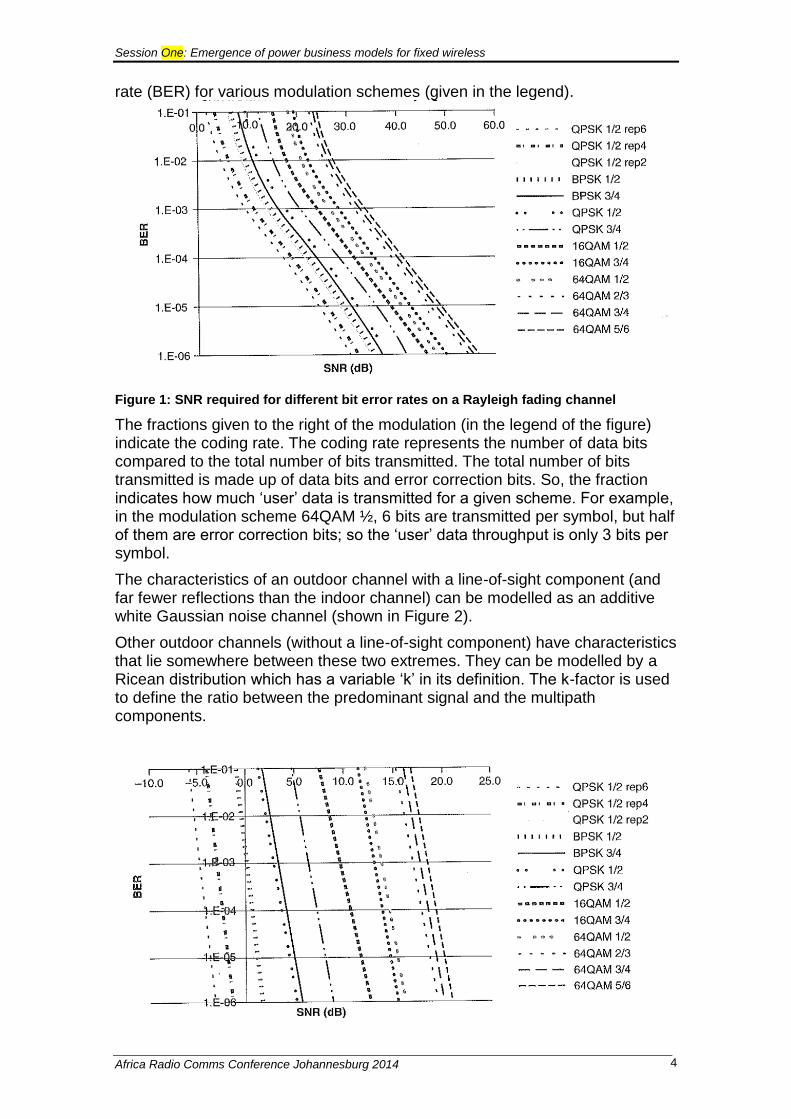
rate (BER) for various modulation schemes (given in the legend).
Figure 1: SNR required for different bit error rates on a Rayleigh fading channel
The fractions given to the right of the modulation (in the legend of the figure) indicate the coding rate. The coding rate represents the number of data bits compared to the total number of bits transmitted. The total number of bits transmitted is made up of data bits and error correction bits. So, the fraction indicates how much ‘user’ data is transmitted for a given scheme. For example, in the modulation scheme 64QAM ½, 6 bits are transmitted per symbol, but half of them are error correction bits; so the ‘user’ data throughput is only 3 bits per symbol.
The characteristics of an outdoor channel with a line-of-sight component (and far fewer reflections than the indoor channel) can be modelled as an additive white Gaussian noise channel (shown in Figure 2).
Other outdoor channels (without a line-of-sight component) have characteristics that lie somewhere between these two extremes. They can be modelled by a Ricean distribution which has a variable ‘k’ in its definition. The k-factor is used to define the ratio between the predominant signal and the multipath components.
Session One: Emergence of power business models for fixed wireless
Africa Radio Comms Conference Johannesburg 2014 5
Figure 2: SNR required for different bit error rates on an Additive White Gaussian Noise (AWGN) channel
The BER is a parameter that is chosen by the network operator. If it is assumed that a BER of 1E-3 is chosen (i.e., one bit in a thousand is expected to be in error) and that the signal-to-noise ratio at the receiver is 20dB, then 64QAM 5/6 can be used in an outdoor channel whereas QPSK ¾ must be used in the indoor channel.
The effective ‘user’ data rate for 64QAM 5/6 is 5 bits per symbol whilst the effective ‘user’ data rate for QPSK ¾ is 1.5 bit per symbol. Thus the data rate
for the outdoor environment is 5
1.5= 3.3 time faster than the indoor environment.
Another way of looking at the advantage of an outdoor installation is in terms of effective gain. In order to use 64QAM 5/6 in an outdoor environment (assuming a BER of 1E-3) a SNR of 18 dB is required. In order to use the same modulation scheme in an indoor environment a SNR of 34 dB is required. Thus, just by moving the antenna outdoors one has already obtained a 16 dB signal improvement. Add to this the additional gain that an outdoor antenna can offer and one has achieved a considerable signal quality advantage.
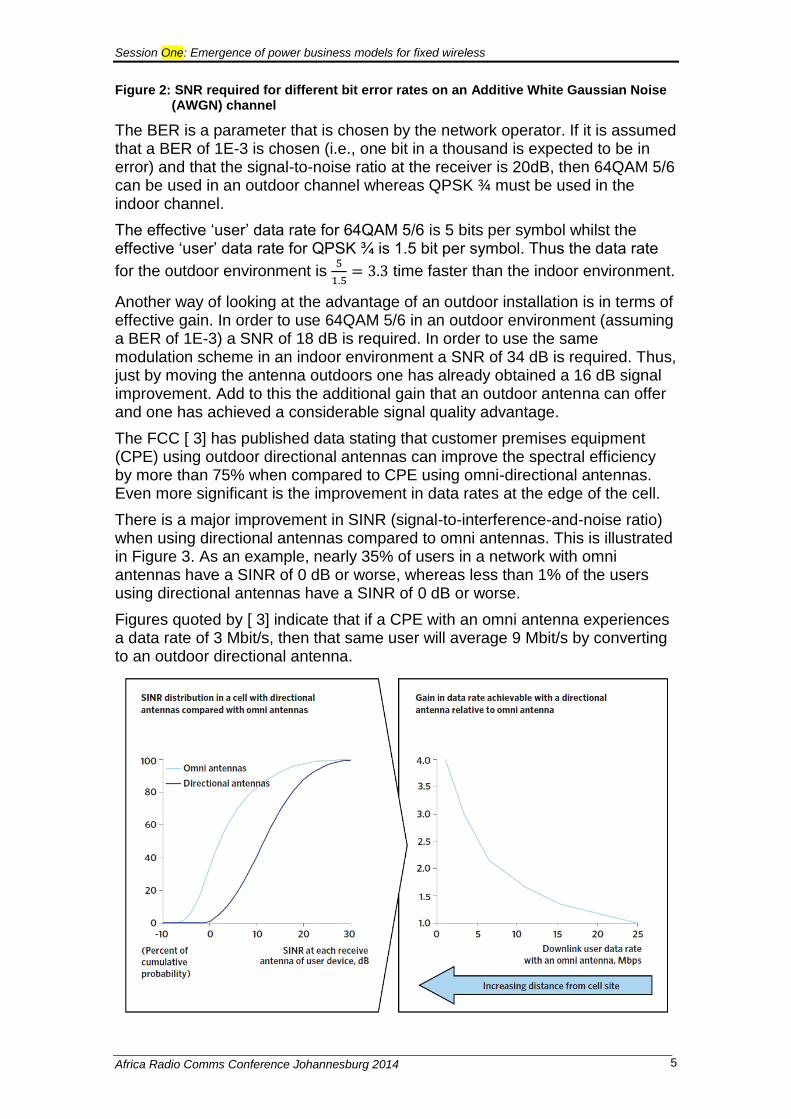
The FCC [ 3] has published data stating that customer premises equipment (CPE) using outdoor directional antennas can improve the spectral efficiency by more than 75% when compared to CPE using omni-directional antennas. Even more significant is the improvement in data rates at the edge of the cell.
There is a major improvement in SINR (signal-to-interference-and-noise ratio) when using directional antennas compared to omni antennas. This is illustrated in Figure 3. As an example, nearly 35% of users in a network with omni antennas have a SINR of 0 dB or worse, whereas less than 1% of the users using directional antennas have a SINR of 0 dB or worse.
Figures quoted by [ 3] indicate that if a CPE with an omni antenna experiences a data rate of 3 Mbit/s, then that same user will average 9 Mbit/s by converting to an outdoor directional antenna.
Session One: Emergence of power business models for fixed wireless
Africa Radio Comms Conference Johannesburg 2014 6
Figure 3: Illustrating the impact of directional antennas at the CPE on SINR and data rates
Measurements on a live network have indicated that a four to five times improvement in data link throughput is possible (Table 1). The above analysis gives some justification for expecting such an improvement. The next step in the argument is to consider the actual / ‘useful’ data throughput of an LTE base station.
The practical system capacity of an LTE cell
There is a significant difference between the peak throughput that can be achieved by a technology and the real (user) throughput of a cell.
Of the data transmitted over the air, only a small proportion is allocated to ‘user’ data. The rest of the data is assigned to assuring data integrity; often called, carrier and data overhead.
By way of example, Korowajczuk has analysed the carrier and data overhead for WiMAX. The data overhead is the overhead attributable to the error coding rate.
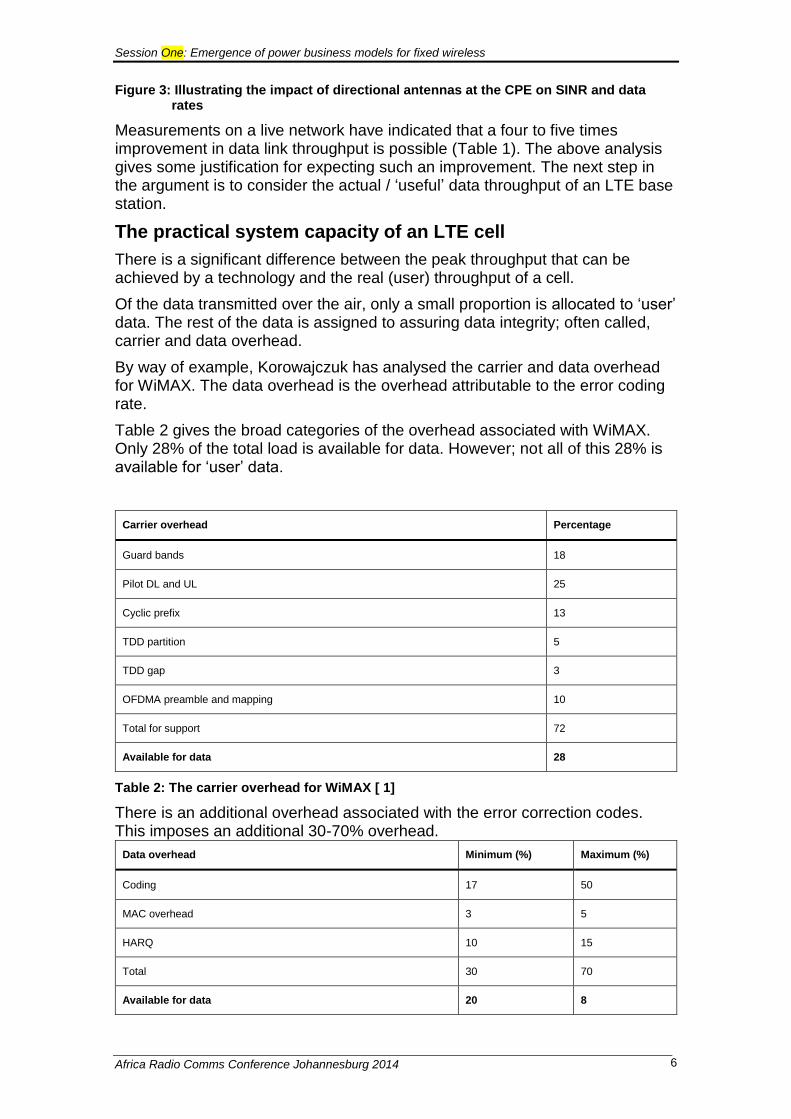
Table 2 gives the broad categories of the overhead associated with WiMAX. Only 28% of the total load is available for data. However; not all of this 28% is available for ‘user’ data.
Carrier overhead Percentage
Guard bands 18
Pilot DL and UL 25
Cyclic prefix 13
TDD partition 5
TDD gap 3
OFDMA preamble and mapping 10
Total for support 72
Available for data 28
Table 2: The carrier overhead for WiMAX [ 1]
There is an additional overhead associated with the error correction codes. This imposes an additional 30-70% overhead.
Data overhead Minimum (%) Maximum (%)
Coding 17 50
MAC overhead 3 5
HARQ 10 15
Total 30 70
Available for data 20 8
Session One: Emergence of power business models for fixed wireless
Africa Radio Comms Conference Johannesburg 2014 7
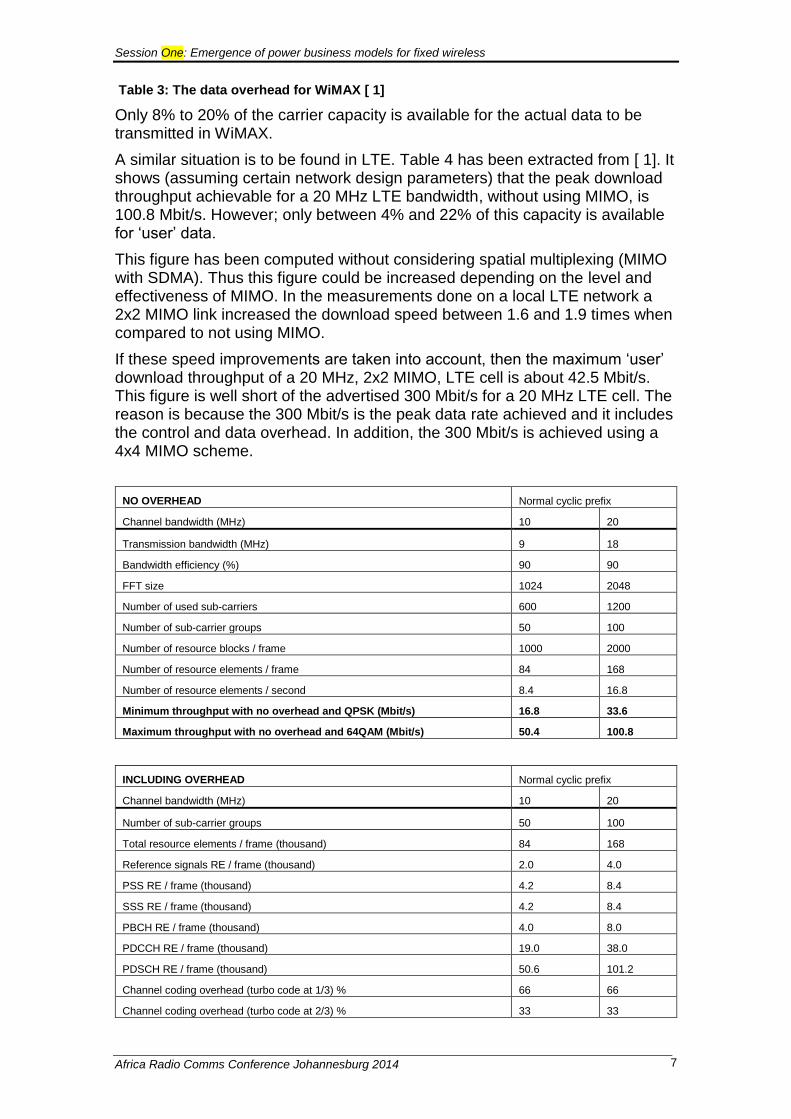
Table 3: The data overhead for WiMAX [ 1]
Only 8% to 20% of the carrier capacity is available for the actual data to be transmitted in WiMAX.
A similar situation is to be found in LTE. Table 4 has been extracted from [ 1]. It shows (assuming certain network design parameters) that the peak download throughput achievable for a 20 MHz LTE bandwidth, without using MIMO, is 100.8 Mbit/s. However; only between 4% and 22% of this capacity is available for ‘user’ data.
This figure has been computed without considering spatial multiplexing (MIMO with SDMA). Thus this figure could be increased depending on the level and effectiveness of MIMO. In the measurements done on a local LTE network a 2x2 MIMO link increased the download speed between 1.6 and 1.9 times when compared to not using MIMO.
If these speed improvements are taken into account, then the maximum ‘user’ download throughput of a 20 MHz, 2x2 MIMO, LTE cell is about 42.5 Mbit/s. This figure is well short of the advertised 300 Mbit/s for a 20 MHz LTE cell. The reason is because the 300 Mbit/s is the peak data rate achieved and it includes the control and data overhead. In addition, the 300 Mbit/s is achieved using a 4x4 MIMO scheme.
NO OVERHEAD Normal cyclic prefix
Channel bandwidth (MHz) 10 20
Transmission bandwidth (MHz) 9 18
Bandwidth efficiency (%) 90 90
FFT size 1024 2048
Number of used sub-carriers 600 1200
Number of sub-carrier groups 50 100
Number of resource blocks / frame 1000 2000
Number of resource elements / frame 84 168
Number of resource elements / second 8.4 16.8
Minimum throughput with no overhead and QPSK (Mbit/s) 16.8 33.6
Maximum throughput with no overhead and 64QAM (Mbit/s) 50.4 100.8
INCLUDING OVERHEAD Normal cyclic prefix
Channel bandwidth (MHz) 10 20
Number of sub-carrier groups 50 100
Total resource elements / frame (thousand) 84 168
Reference signals RE / frame (thousand) 2.0 4.0
PSS RE / frame (thousand) 4.2 8.4
SSS RE / frame (thousand) 4.2 8.4
PBCH RE / frame (thousand) 4.0 8.0
PDCCH RE / frame (thousand) 19.0 38.0
PDSCH RE / frame (thousand) 50.6 101.2
Channel coding overhead (turbo code at 1/3) % 66 66
Channel coding overhead (turbo code at 2/3) % 33 33
Session One: Emergence of power business models for fixed wireless
Africa Radio Comms Conference Johannesburg 2014 8
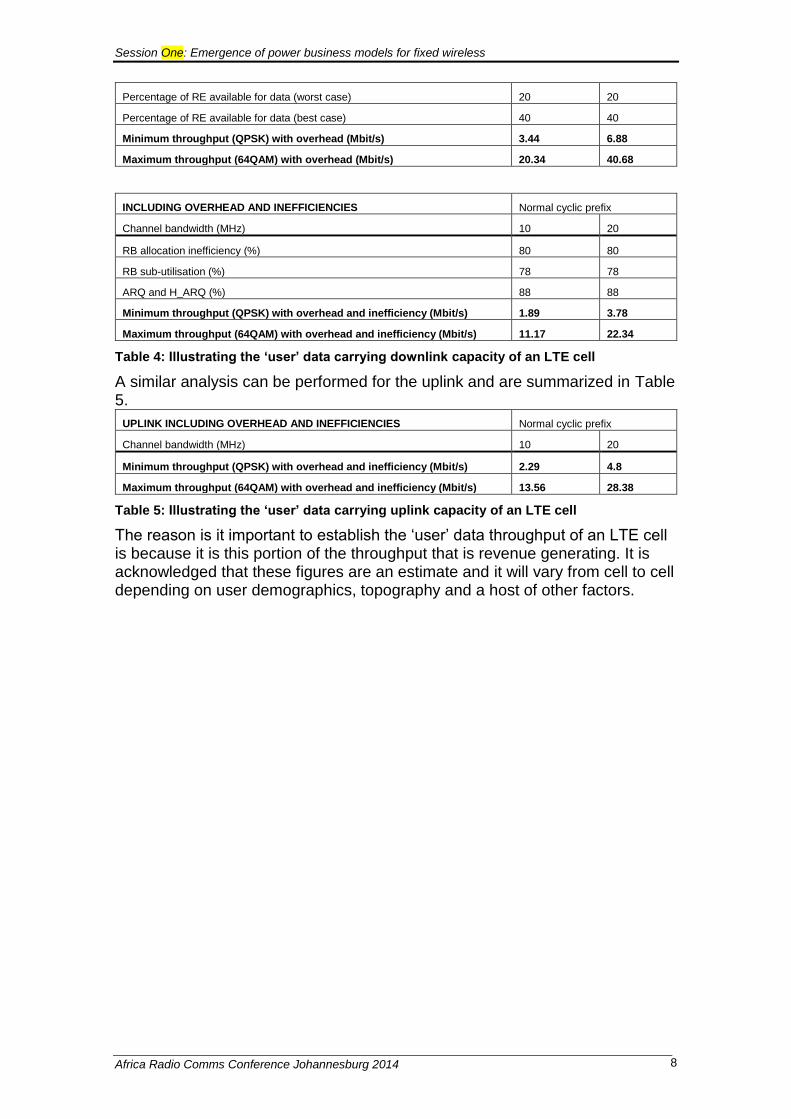
Percentage of RE available for data (worst case) 20 20
Percentage of RE available for data (best case) 40 40
Minimum throughput (QPSK) with overhead (Mbit/s) 3.44 6.88
Maximum throughput (64QAM) with overhead (Mbit/s) 20.34 40.68
INCLUDING OVERHEAD AND INEFFICIENCIES Normal cyclic prefix
Channel bandwidth (MHz) 10 20
RB allocation inefficiency (%) 80 80
RB sub-utilisation (%) 78 78
ARQ and H_ARQ (%) 88 88
Minimum throughput (QPSK) with overhead and inefficiency (Mbit/s) 1.89 3.78
Maximum throughput (64QAM) with overhead and inefficiency (Mbit/s) 11.17 22.34
Table 4: Illustrating the ‘user’ data carrying downlink capacity of an LTE cell
A similar analysis can be performed for the uplink and are summarized in Table 5.
UPLINK INCLUDING OVERHEAD AND INEFFICIENCIES Normal cyclic prefix
Channel bandwidth (MHz) 10 20
Minimum throughput (QPSK) with overhead and inefficiency (Mbit/s) 2.29 4.8
Maximum throughput (64QAM) with overhead and inefficiency (Mbit/s) 13.56 28.38
Table 5: Illustrating the ‘user’ data carrying uplink capacity of an LTE cell
The reason is it important to establish the ‘user’ data throughput of an LTE cell is because it is this portion of the throughput that is revenue generating. It is acknowledged that these figures are an estimate and it will vary from cell to cell depending on user demographics, topography and a host of other factors.
Session One: Emergence of power business models for fixed wireless
Africa Radio Comms Conference Johannesburg 2014 9
The business case
Thus far we have established the following:
Parameter Value
LTE billable spectrum 4-42.5 Mbit/s
Improvement in data speeds due to external directional antennas rather than internal omni antennas
3-5 times
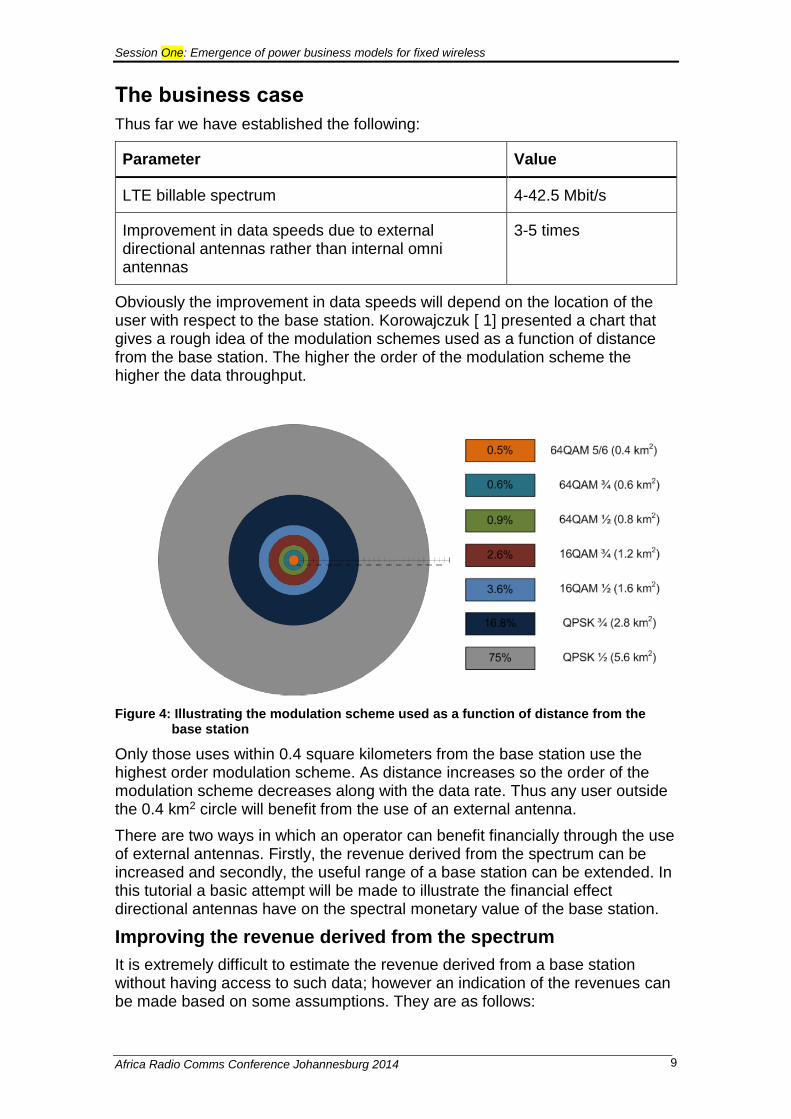
Obviously the improvement in data speeds will depend on the location of the user with respect to the base station. Korowajczuk [ 1] presented a chart that gives a rough idea of the modulation schemes used as a function of distance from the base station. The higher the order of the modulation scheme the higher the data throughput.
Figure 4: Illustrating the modulation scheme used as a function of distance from the base station
Only those uses within 0.4 square kilometers from the base station use the highest order modulation scheme. As distance increases so the order of the modulation scheme decreases along with the data rate. Thus any user outside the 0.4 km2 circle will benefit from the use of an external antenna.
There are two ways in which an operator can benefit financially through the use of external antennas. Firstly, the revenue derived from the spectrum can be increased and secondly, the useful range of a base station can be extended. In this tutorial a basic attempt will be made to illustrate the financial effect directional antennas have on the spectral monetary value of the base station.
Improving the revenue derived from the spectrum
It is extremely difficult to estimate the revenue derived from a base station without having access to such data; however an indication of the revenues can be made based on some assumptions. They are as follows:
Session One: Emergence of power business models for fixed wireless
Africa Radio Comms Conference Johannesburg 2014 10
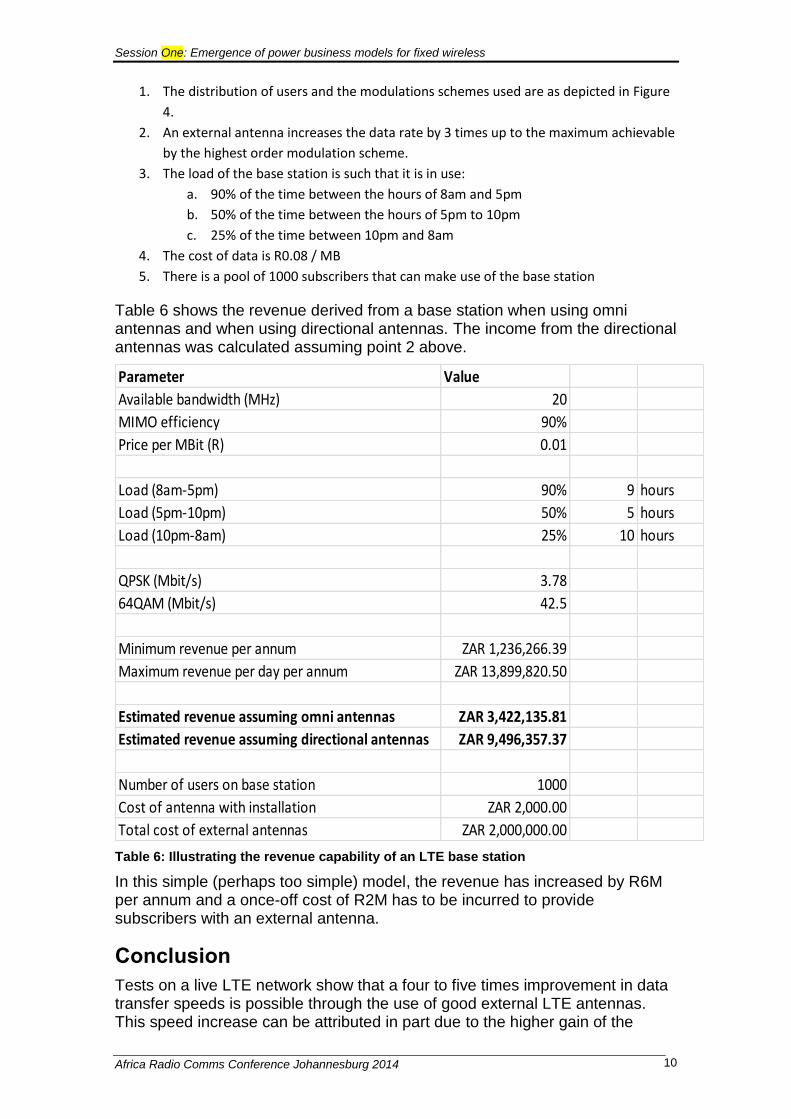
1. The distribution of users and the modulations schemes used are as depicted in Figure
4.
2. An external antenna increases the data rate by 3 times up to the maximum achievable
by the highest order modulation scheme.
3. The load of the base station is such that it is in use:
a. 90% of the time between the hours of 8am and 5pm
b. 50% of the time between the hours of 5pm to 10pm
c. 25% of the time between 10pm and 8am
4. The cost of data is R0.08 / MB
5. There is a pool of 1000 subscribers that can make use of the base station
Table 6 shows the revenue derived from a base station when using omni antennas and when using directional antennas. The income from the directional antennas was calculated assuming point 2 above.
Parameter Value
Available bandwidth (MHz) 20
MIMO efficiency 90%
Price per MBit (R) 0.01
Load (8am-5pm) 90% 9 hours
Load (5pm-10pm) 50% 5 hours
Load (10pm-8am) 25% 10 hours
QPSK (Mbit/s) 3.78
64QAM (Mbit/s) 42.5
Minimum revenue per annum ZAR 1,236,266.39
Maximum revenue per day per annum ZAR 13,899,820.50
Estimated revenue assuming omni antennas ZAR 3,422,135.81
Estimated revenue assuming directional antennas ZAR 9,496,357.37
Number of users on base station 1000
Cost of antenna with installation ZAR 2,000.00
Total cost of external antennas ZAR 2,000,000.00
Table 6: Illustrating the revenue capability of an LTE base station
In this simple (perhaps too simple) model, the revenue has increased by R6M per annum and a once-off cost of R2M has to be incurred to provide subscribers with an external antenna.
Conclusion
Tests on a live LTE network show that a four to five times improvement in data transfer speeds is possible through the use of good external LTE antennas. This speed increase can be attributed in part due to the higher gain of the

Session One: Emergence of power business models for fixed wireless
Africa Radio Comms Conference Johannesburg 2014 11
external antenna compared to an omni antenna; but the greatest affect is due to the nature of the propagation path (indoor compared to outdoor environment). The outdoor environment is far more data-transfer friendly than the indoor environment.
The published peak throughput of a 20 MHz LTE link is 300 Mbit/s. This figure is not the ‘useful’ data throughput of the link as it includes the transmission of the error codes and control data. It is also assumed that 4x4 MIMO is used. A more realistic value for the maximum billable/useful data throughput of an LTE 20 MHz link is 42.5 Mbit/s, which assumes that external antennas with good MIMO capability are employed.
A very rough calculation was performed to show that it is very likely that equipping users with outdoor directional antennas could have a large impact on the revenue capabilities of a base station.
References
[ 1] Leonhard Korowajczuk, “LTE, WiMAX and WLAN network design, optimisation and performance analysis”, Wiley and Sons Ltd., 2011
[ 2] Celplan technologies, Inc., www.celplan.com.
[ 3] “OBI technical paper No.1, chapter 4”, http://www.fcc.gov/national-broadband-plan