Embed Size (px)
Citation preview

BUILDING ABUSINESSCASE
BALIHOO.COM | THE NATIONAL MARKETER’S GUIDE TO LOCAL
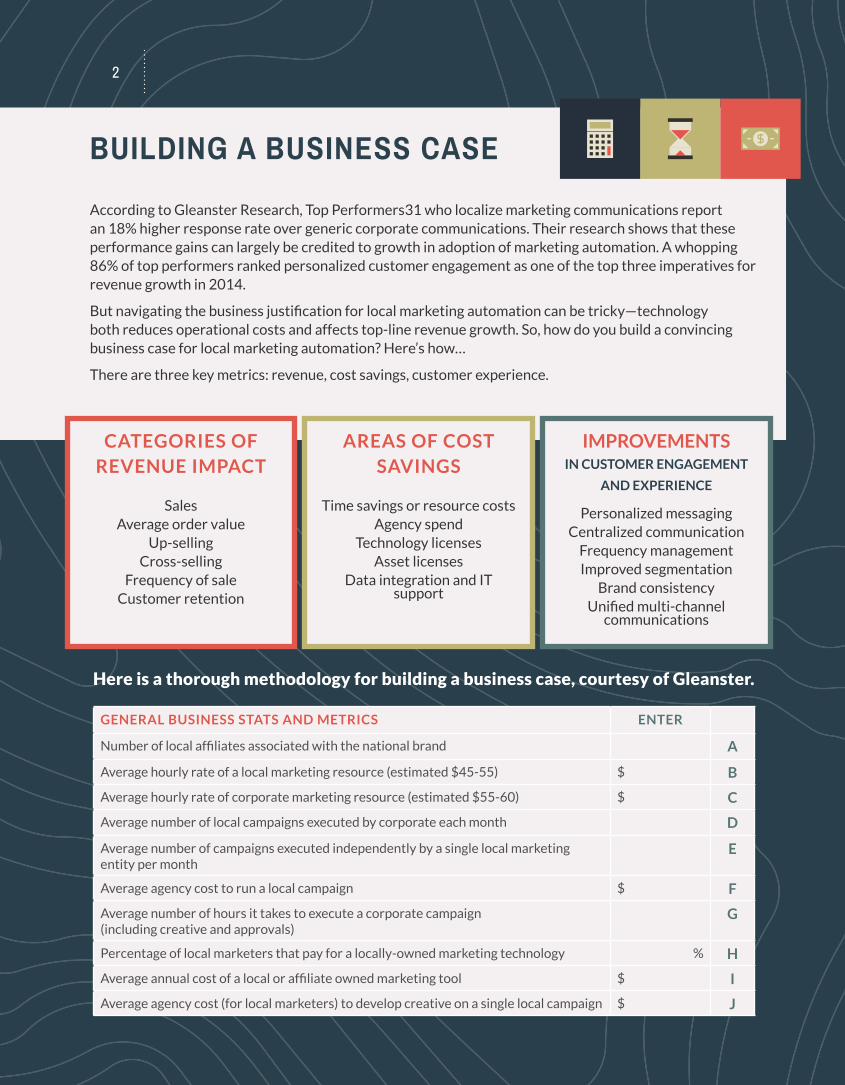
According to Gleanster Research, Top Performers31 who localize marketing communications report an 18% higher response rate over generic corporate communications. Their research shows that these performance gains can largely be credited to growth in adoption of marketing automation. A whopping 86% of top performers ranked personalized customer engagement as one of the top three imperatives for revenue growth in 2014.
But navigating the business justification for local marketing automation can be tricky—technology both reduces operational costs and affects top-line revenue growth. So, how do you build a convincing business case for local marketing automation? Here’s how…
There are three key metrics: revenue, cost savings, customer experience.
BUILDING A BUSINESS CASE
Here is a thorough methodology for building a business case, courtesy of Gleanster.
GENERAL BUSINESS STATS AND METRICS ENTER
Number of local affiliates associated with the national brand A
Average hourly rate of a local marketing resource (estimated $45-55) $ B
Average hourly rate of corporate marketing resource (estimated $55-60) $ C
Average number of local campaigns executed by corporate each month D
Average number of campaigns executed independently by a single local marketing entity per month
E
Average agency cost to run a local campaign $ F
Average number of hours it takes to execute a corporate campaign (including creative and approvals)
G
Percentage of local marketers that pay for a locally-owned marketing technology % H
Average annual cost of a local or affiliate owned marketing tool $ I
Average agency cost (for local marketers) to develop creative on a single local campaign $ J
CATEGORIES OF REVENUE IMPACT
SalesAverage order value
Up-sellingCross-selling
Frequency of saleCustomer retention
IMPROVEMENTS IN CUSTOMER ENGAGEMENT
AND EXPERIENCE
Personalized messagingCentralized communication
Frequency managementImproved segmentation
Brand consistencyUnified multi-channel
communications
AREAS OF COST SAVINGS
Time savings or resource costsAgency spend
Technology licensesAsset licenses
Data integration and IT support
2
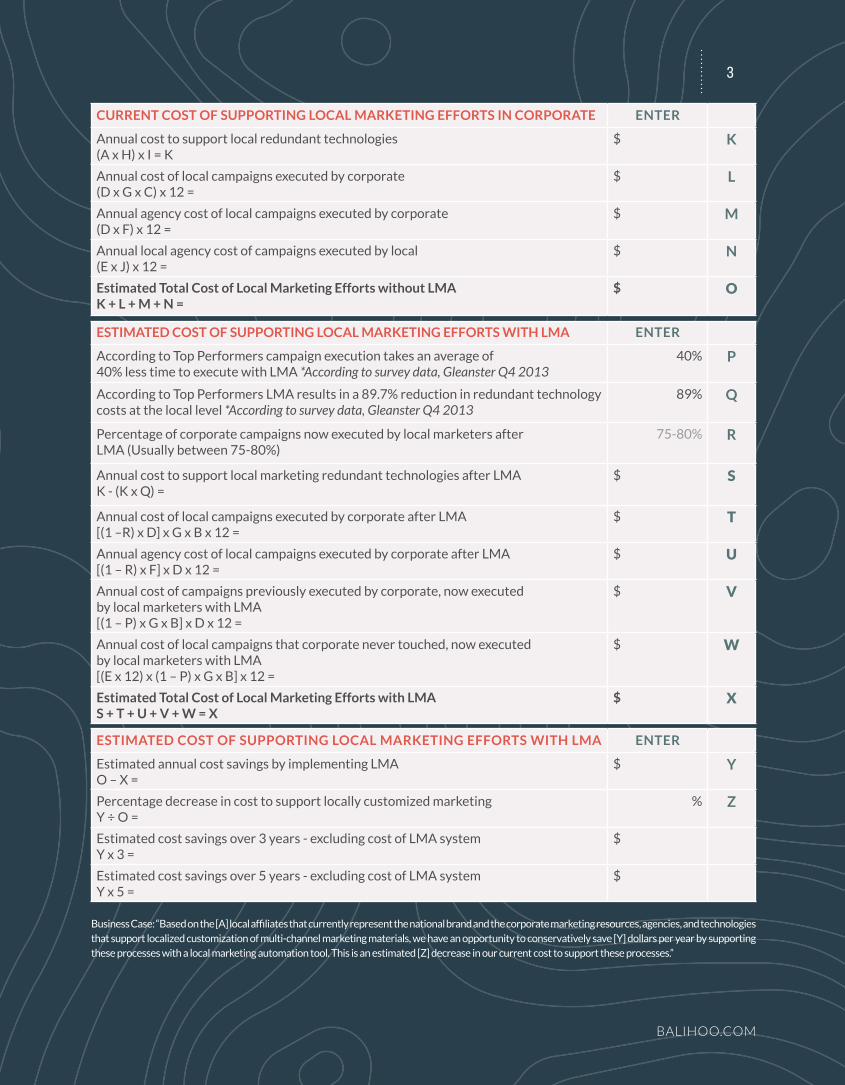
CURRENT COST OF SUPPORTING LOCAL MARKETING EFFORTS IN CORPORATE ENTER
Annual cost to support local redundant technologies(A x H) x I = K
$ K
Annual cost of local campaigns executed by corporate(D x G x C) x 12 =
$ L
Annual agency cost of local campaigns executed by corporate(D x F) x 12 =
$ M
Annual local agency cost of campaigns executed by local(E x J) x 12 =
$ N
Estimated Total Cost of Local Marketing Efforts without LMAK + L + M + N =
$ O
ESTIMATED COST OF SUPPORTING LOCAL MARKETING EFFORTS WITH LMA ENTER
Estimated annual cost savings by implementing LMAO – X =
$ Y
Percentage decrease in cost to support locally customized marketingY ÷ O =
% Z
Estimated cost savings over 3 years - excluding cost of LMA systemY x 3 =
$
Estimated cost savings over 5 years - excluding cost of LMA systemY x 5 =
$
ESTIMATED COST OF SUPPORTING LOCAL MARKETING EFFORTS WITH LMA ENTER
According to Top Performers campaign execution takes an average of40% less time to execute with LMA *According to survey data, Gleanster Q4 2013
40% P
According to Top Performers LMA results in a 89.7% reduction in redundant technology costs at the local level *According to survey data, Gleanster Q4 2013
89% Q
Percentage of corporate campaigns now executed by local marketers afterLMA (Usually between 75-80%)
75-80% R
Annual cost to support local marketing redundant technologies after LMAK - (K x Q) =
$ S
Annual cost of local campaigns executed by corporate after LMA[(1 –R) x D] x G x B x 12 =
$ T
Annual agency cost of local campaigns executed by corporate after LMA[(1 – R) x F] x D x 12 =
$ U
Annual cost of campaigns previously executed by corporate, now executedby local marketers with LMA[(1 – P) x G x B] x D x 12 =
$ V
Annual cost of local campaigns that corporate never touched, now executedby local marketers with LMA[(E x 12) x (1 – P) x G x B] x 12 =
$ W
Estimated Total Cost of Local Marketing Efforts with LMAS + T + U + V + W = X
$ X
Business Case: “Based on the [A] local affiliates that currently represent the national brand and the corporate marketing resources, agencies, and technologies that support localized customization of multi-channel marketing materials, we have an opportunity to conservatively save [Y] dollars per year by supporting these processes with a local marketing automation tool. This is an estimated [Z] decrease in our current cost to support these processes.”
BALIHOO.COM
3

ESTIMATED REVENUE FROM CORPORATE EXECUTED EMAIL ENTER
Total Emails Sent Per Month (Corporate) A
Average Click-Through Rate on Corporate Email (2-4% is a good estimate) % B
Average Conversion-To-Sale rate on Click-Through (1-3% is a good estimate) % C
Average Order Value on Email Engaged Customers $ D
Estimated Revenue Per Month from “A” EmailsA x B x C x D = E
$ E
ESTIMATED REVENUE FROM CORPORATE EXECUTED MOBILE AD CAMPAIGNS ENTER
Total Mobile Ad Impressions (Corporate) F
Average Click-Through Rate on Mobile Ads (0.01-0.03% is a good estimate) % G
Average Conversion-To-Sale rate on Click-Through (0.5-2% is a good estimate) % H
Average Order Value on Email Engaged Customers $ I
Estimated Revenue Per Month from “A” Mobile CampaignsF x G x H x I = J
$ J
Revenue from Corporate Executed Email and Mobile CampaignsE + J = K
$ K
METRICS FOR ESTIMATING RETURN ON LOCAL MARKETING EFFORTS WITH LMA ENTER
Estimated benefit of allowing local marketers to execute email campaigns.Choose a click-through rate of between 6.44% and 9.56%Top Performers using LMA report an average click-through rate on email campaigns executed from the local level at 8% with a standard deviation of 1.56%. That means you have a choice in how conservative you want to be when benchmarking performance. Your options are to pick a click-through percentage between 6.44 and 9.56%. Write that percentage to the right.
% L
Estimated benefit of allowing local marketers to execute mobile campaigns.Choose a click-through multiple of 3-9xAccording to survey data from StreetFight Summit West, January 2013.
M
Estimated benefit of allowing local marketers to execute campaigns via LMAA x L x C x D = N
$ N
Estimated benefit of local marketers executing mobile campaigns via LMAF x (G x M) x D x H x I = P
$ O
Revenue from Corporate Executed Email and Mobile Campaigns with LMAN + O = P
$ P
ESTIMATED RETURN ON SALES AS A RESULT OF LMA ENTER
Estimated monthly increase in revenue from executing local managedcampaigns via LMAP – K = Q
$ Q
Estimated monthly percentage increase in revenue based on improved LMAengagementQ ÷ K = R
% R
Business Case: “Data from Top Performing companies surveyed by Gleanster Research suggests use of LMA tools has a directional impact on top line revenue growth because the tools help power optimal personalized multi-channel engagement at the local level. If we emulate the tactics, processes, and best practices these organizations deploy we can reasonably expect to replicate their success. Estimating our potential top line sales growth requires a few assumptions and some benchmark metrics from Top Performing organizations. Based on [A] number of monthly emails and [F] mobile ad impressions per month, we can expect to see an increase in sales of [Q] dollars by leveraging a LMA tool for local marketing execution. By offloading some of the execution to local marketers and managing this in a centralized tool we can expect to see a percentage increase in revenue of [R] over our current sales performance if local marketers deliver more targeted and personalized communications.”
4 BUILDING A BUSINESS CASE
BALIHOO.COM

31 Gleanster uses 2-3 key performance indicators (KPIs) to distinguish “Top Performers” from all other companies (“Everyone Else”) within a given data set, thereby establishing a basis for benchmarking best practices. By definition, Top Performers are comprised of the top quartile of qualified survey respondents (QSRs).
PROJECT YOUR COST SAVINGS: $
This is where you estimate the impact of improving your relationship with your customers. While it is difficult to quantify customer experience, you can use some basic rules of thumb. The CMO Council survey we cited earlier, “Localize to Optimize Sales Channel Effectiveness,” can help quantify your results as follows:
5
BALIHOO.COM
BUILDING A BUSINESS CASE