Embed Size (px)
Citation preview
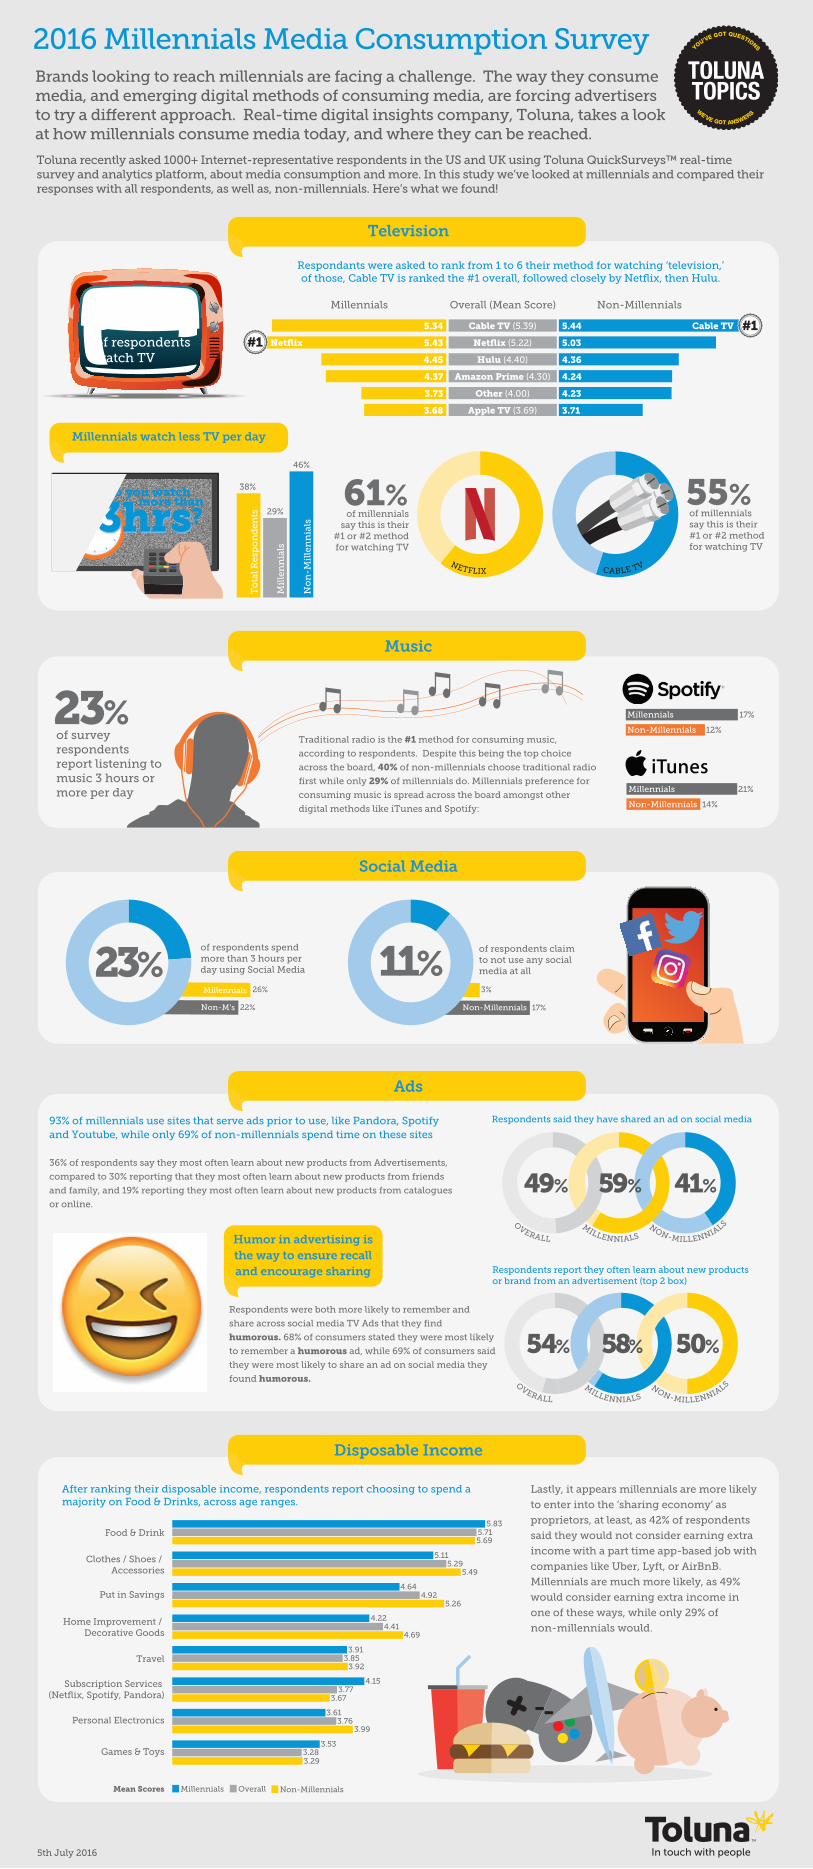
of survey respondents report listening to music 3 hours or more per day
23%Traditional radio is the #1 method for consuming music,
according to respondents. Despite this being the top choice
across the board, 40% of non-millennials choose traditional radio
first while only 29% of millennials do. Millennials preference for
consuming music is spread across the board amongst other
digital methods like iTunes and Spotify:
2016 Millennials Media Consumption SurveyBrands looking to reach millennials are facing a challenge. The way they consume media, and emerging digital methods of consuming media, are forcing advertisers to try a di�erent approach. Real-time digital insights company, Toluna, takes a look at how millennials consume media today, and where they can be reached.
Toluna recently asked 1000+ Internet-representative respondents in the US and UK using Toluna QuickSurveys™ real-time survey and analytics platform, about media consumption and more. In this study we’ve looked at millennials and compared their responses with all respondents, as well as, non-millennials. Here’s what we found!
5th July 2016
Respondants were asked to rank from 1 to 6 their method for watching ‘television,’ of those, Cable TV is ranked the #1 overall, followed closely by Netflix, then Hulu.
of millennials say this is their
#1 or #2 method for watching TV
61%
NETFLIX
of millennials say this is their #1 or #2 method for watching TV
55%
CABLE TV
Humor in advertising is the way to ensure recall and encourage sharing
Television
Music
Social Media
Ads
Disposable Income
To
tal R
esp
on
den
ts
Mil
len
nia
ls
38%
29%
46%
No
n-M
ille
nn
ials3hrs3hrs
Do you watch more than
?
Millennials watch less TV per day
Respondents report they often learn about new products or brand from an advertisement (top 2 box)
Respondents said they have shared an ad on social media
After ranking their disposable income, respondents report choosing to spend a majority on Food & Drinks, across age ranges.
Non-MillennialsOverallMillennialsMean Scores
Lastly, it appears millennials are more likely
to enter into the ‘sharing economy’ as
proprietors, at least, as 42% of respondents
said they would not consider earning extra
income with a part time app-based job with
companies like Uber, Lyft, or AirBnB.
Millennials are much more likely, as 49%
would consider earning extra income in
one of these ways, while only 29% of
non-millennials would.
Respondents were both more likely to remember and
share across social media TV Ads that they find
humorous. 68% of consumers stated they were most likely
to remember a humorous ad, while 69% of consumers said
they were most likely to share an ad on social media they
found humorous.
of respondents watch TV
94%
21%
14%
Millennials
Non-Millennials
Millennials
Non-Millennials
17%
12%
of respondents claim to not use any social media at all11% 3%
17%Non-Millennials
of respondents spend more than 3 hours per day using Social Media23% Millennials 26%
22%Non-M’s
93% of millennials use sites that serve ads prior to use, like Pandora, Spotify and Youtube, while only 69% of non-millennials spend time on these sites
36% of respondents say they most often learn about new products from Advertisements,
compared to 30% reporting that they most often learn about new products from friends
and family, and 19% reporting they most often learn about new products from catalogues
or online.
49% 59% 41% NON-MILLENNIA
LSMILLENNIALS
OVERALL
54% 58% 50% NON-MILLENNIA
LSMILLENNIALS
OVERALL
Millennials Overall (Mean Score) Non-Millennials
Apple TV (3.69)
Other (4.00)
Amazon Prime (4.30)
Hulu (4.40)
Netflix (5.22)Netflix
Cable TV (5.39) Cable TV
3.68
3.73
4.37
4.45
5.43
5.34
3.71
4.23
4.24
4.36
5.03
5.44 #1#1
Games & Toys
Personal Electronics
Subscription Services (Netflix, Spotify, Pandora)
Travel
Home Improvement / Decorative Goods
Put in Savings
Clothes / Shoes / Accessories
Food & Drink5.83
5.715.69
5.115.29
5.49
4.644.92
5.26
4.224.41
4.69
3.913.85
3.92
4.153.77
3.67
3.613.76
3.99
3.533.283.29
TOLUNA TOPICS
YOU’VE GOT QUESTIONS
WE’VE GO ANSWERS
T