Embed Size (px)
Citation preview
Understanding Hispanics’
Back-to-School Shopping Behavior
August 2015
Source: ThinkNow Research Hispanic
Omnibus Study – July 2014, July 2015
Outline
2
Methodology
Key Findings
Detailed Findings
Appendix
Methodology
Source: ThinkNow Research Hispanic
Omnibus Study – July 2014, July 2015
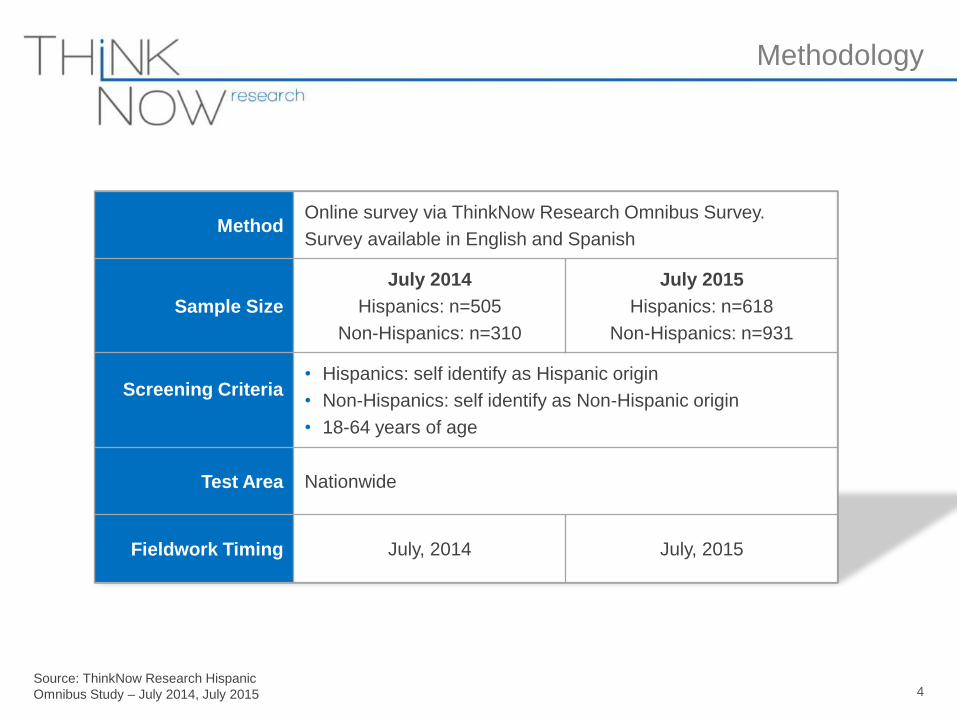
MethodOnline survey via ThinkNow Research Omnibus Survey.
Survey available in English and Spanish
Sample Size
July 2014
Hispanics: n=505
Non-Hispanics: n=310
July 2015
Hispanics: n=618
Non-Hispanics: n=931
Screening Criteria• Hispanics: self identify as Hispanic origin
• Non-Hispanics: self identify as Non-Hispanic origin
• 18-64 years of age
Test Area Nationwide
Fieldwork Timing July, 2014 July, 2015
Methodology
4
Key Findings
Source: ThinkNow Research Hispanic
Omnibus Study – July 2014, July 2015
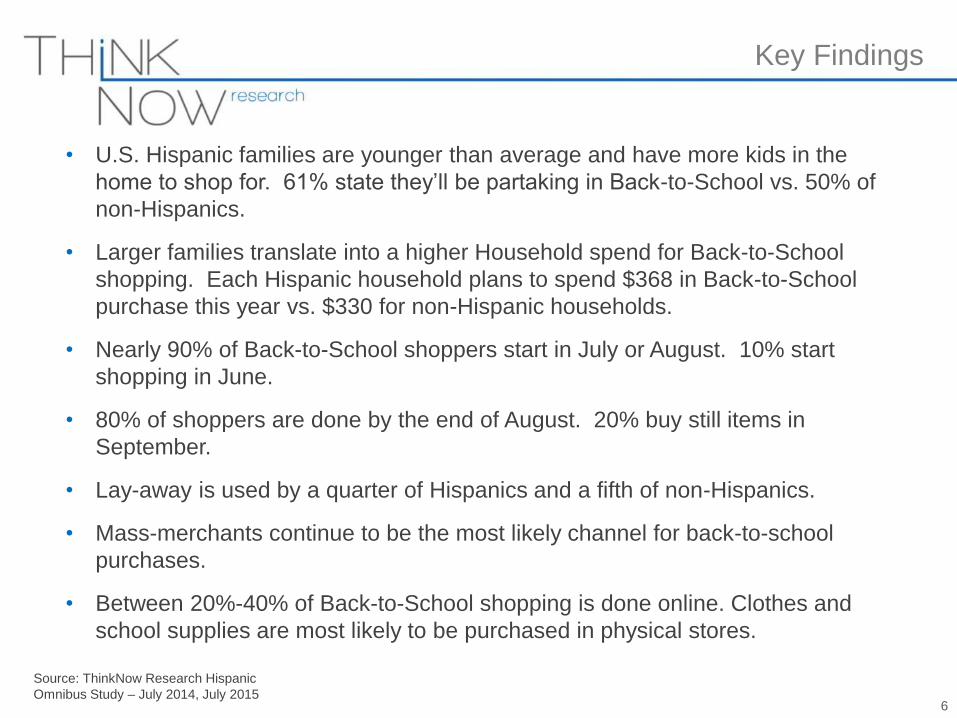
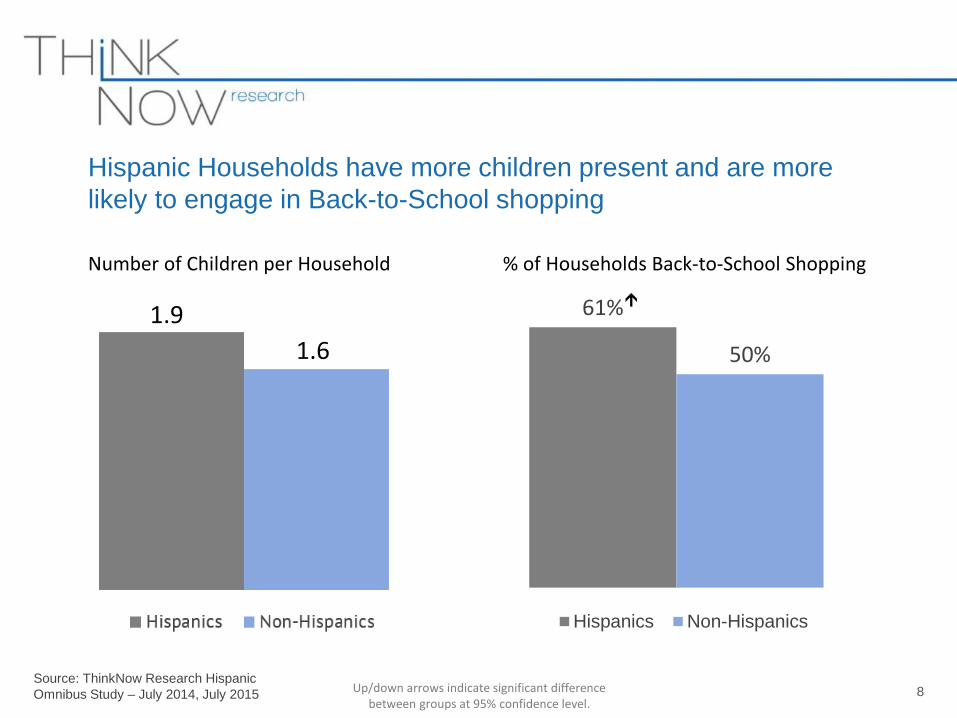
• U.S. Hispanic families are younger than average and have more kids in the
home to shop for. 61% state they’ll be partaking in Back-to-School vs. 50% of
non-Hispanics.
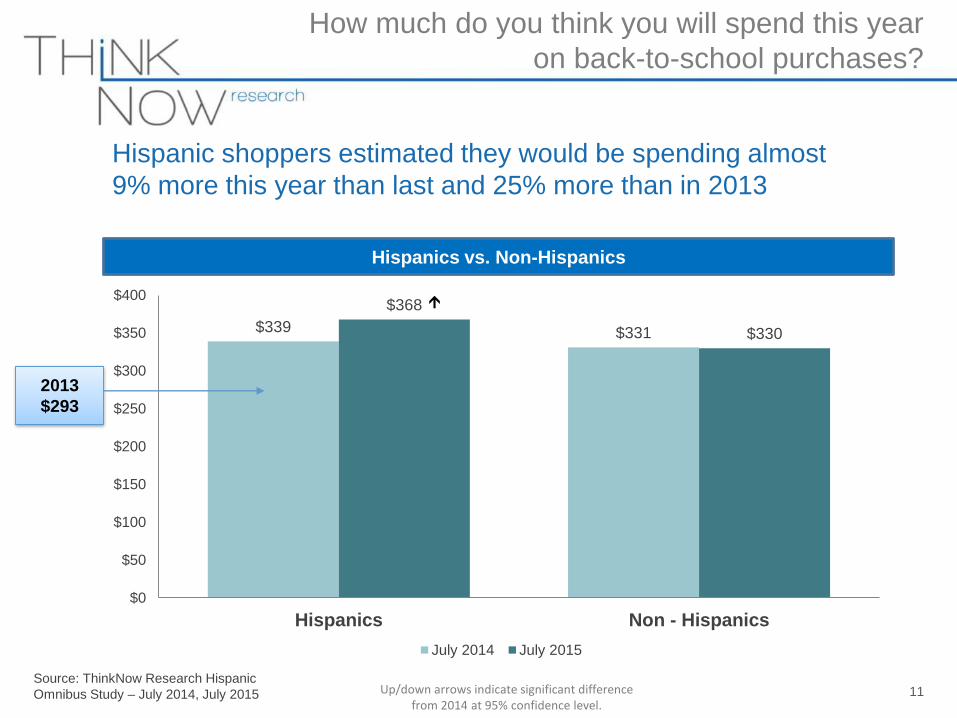
• Larger families translate into a higher Household spend for Back-to-School
shopping. Each Hispanic household plans to spend $368 in Back-to-School
purchase this year vs. $330 for non-Hispanic households.
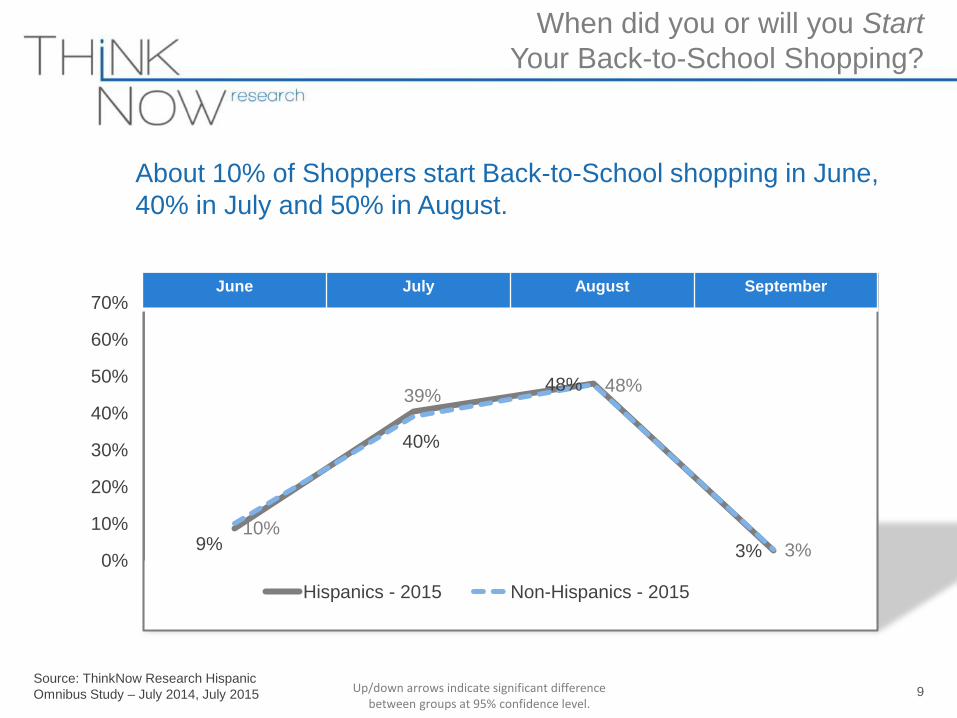
• Nearly 90% of Back-to-School shoppers start in July or August. 10% start
shopping in June.
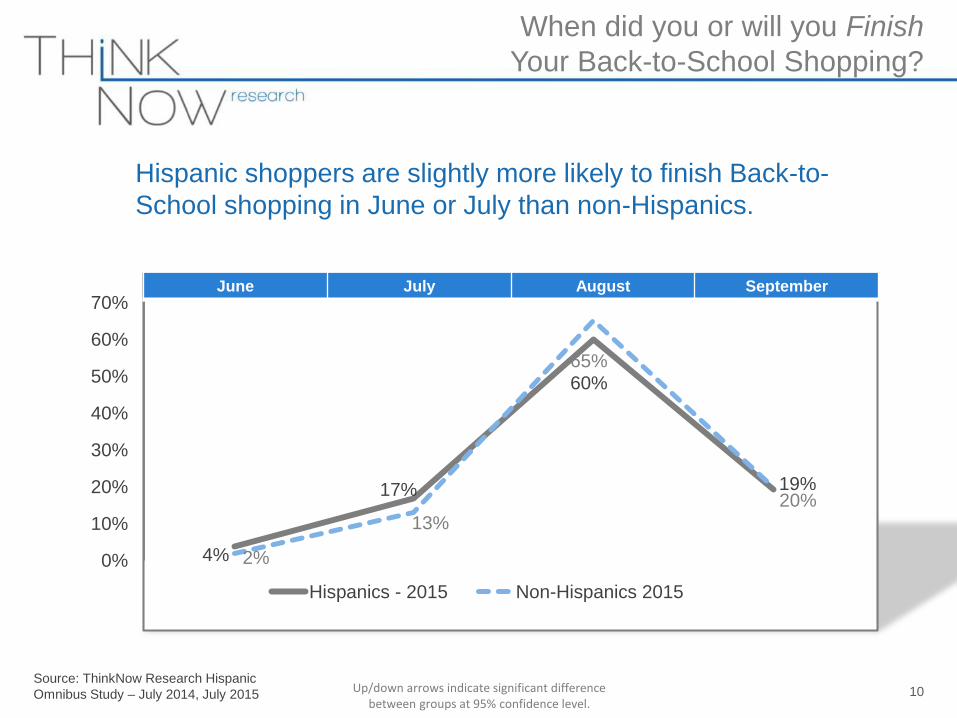
• 80% of shoppers are done by the end of August. 20% buy still items in
September.
• Lay-away is used by a quarter of Hispanics and a fifth of non-Hispanics.
• Mass-merchants continue to be the most likely channel for back-to-school
purchases.
• Between 20%-40% of Back-to-School shopping is done online. Clothes and
school supplies are most likely to be purchased in physical stores.
Key Findings
6
Detailed Findings
Source: ThinkNow Research Hispanic
Omnibus Study – July 2014, July 2015
Hispanic Households have more children present and are more
likely to engage in Back-to-School shopping
8
61%
50%
Hispanics Non-Hispanics
1.9
1.6
Number of Children per Household % of Households Back-to-School Shopping
Up/down arrows indicate significant difference between groups at 95% confidence level.
Source: ThinkNow Research Hispanic
Omnibus Study – July 2014, July 2015
9%
40%
48%
3%
10%
39%48%
3%0%
10%
20%
30%
40%
50%
60%
70%
80%
90%
100%
Hispanics - 2015 Non-Hispanics - 2015
When did you or will you Start
Your Back-to-School Shopping?
9
June July August September
More Back-To-School shopping shifted from
About 10% of Shoppers start Back-to-School shopping in June,
40% in July and 50% in August.
Up/down arrows indicate significant difference between groups at 95% confidence level.
Source: ThinkNow Research Hispanic
Omnibus Study – July 2014, July 2015 10
When did you or will you Finish
Your Back-to-School Shopping?
4%
17%
60%
19%
2%
13%
65%
20%
0%
10%
20%
30%
40%
50%
60%
70%
80%
90%
100%
Hispanics - 2015 Non-Hispanics 2015
June July August September
More Back-To-School shopping shifted from
Hispanic shoppers are slightly more likely to finish Back-to-
School shopping in June or July than non-Hispanics.
Up/down arrows indicate significant difference between groups at 95% confidence level.
Source: ThinkNow Research Hispanic
Omnibus Study – July 2014, July 2015
$339 $331
$368
$330
$0
$50
$100
$150
$200
$250
$300
$350
$400
Hispanics Non - Hispanics
July 2014 July 2015
How much do you think you will spend this year
on back-to-school purchases?
11
Hispanics vs. Non-Hispanics
2013
$293
Hispanic shoppers estimated they would be spending almost
9% more this year than last and 25% more than in 2013
Up/down arrows indicate significant difference from 2014 at 95% confidence level.
Source: ThinkNow Research Hispanic
Omnibus Study – July 2014, July 2015
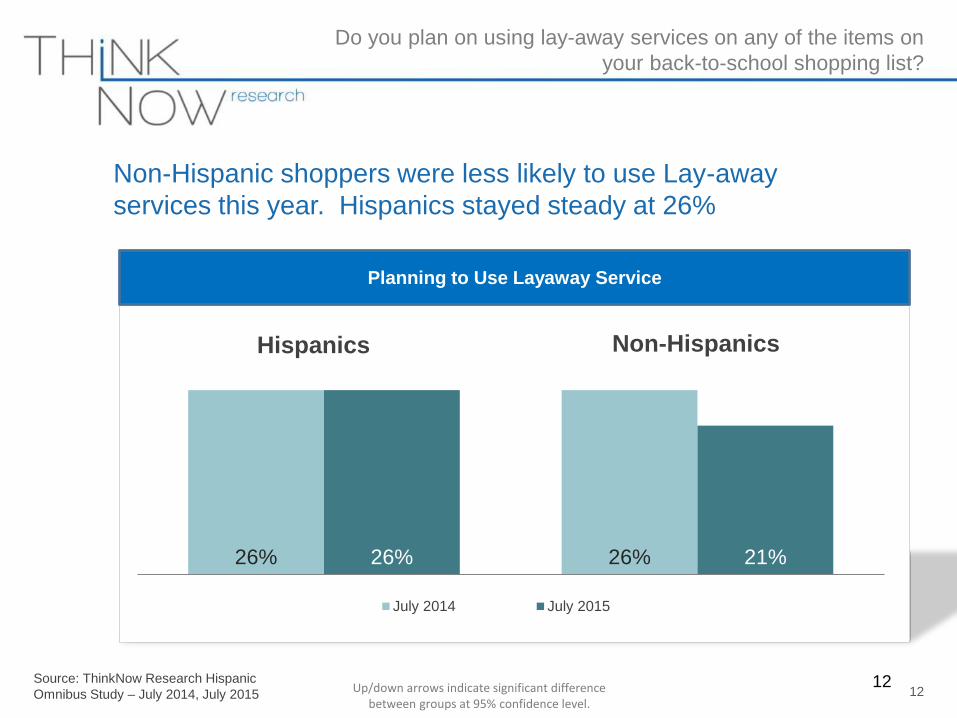
26% 26%26% 21%
July 2014 July 2015
Do you plan on using lay-away services on any of the items on
your back-to-school shopping list?
1212
Planning to Use Layaway Service
Hispanics Non-Hispanics
Non-Hispanic shoppers were less likely to use Lay-away
services this year. Hispanics stayed steady at 26%
Up/down arrows indicate significant difference between groups at 95% confidence level.
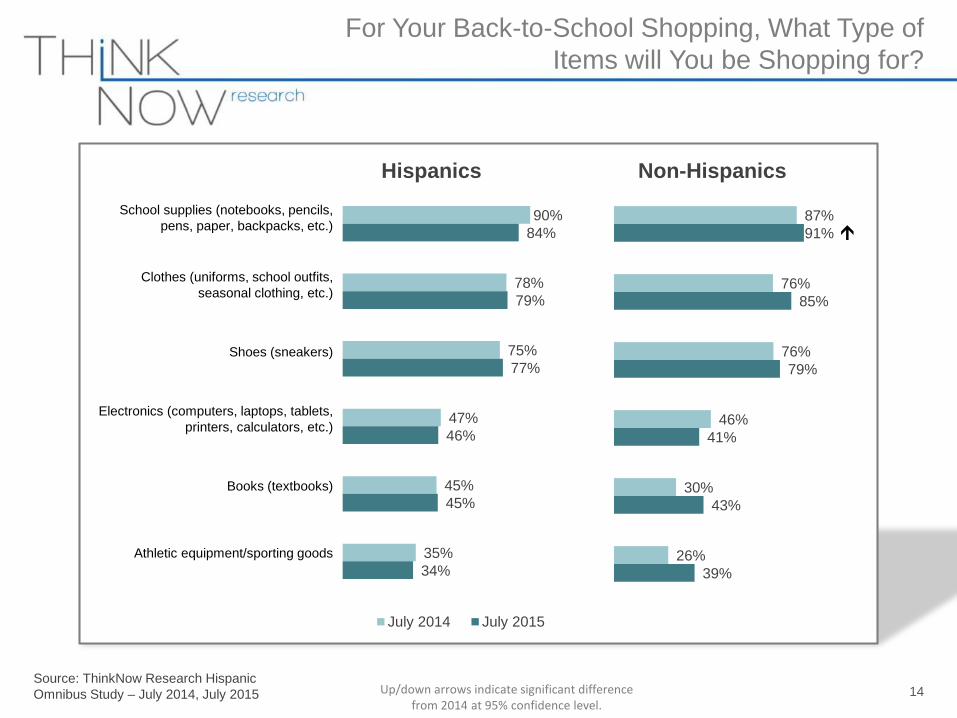
Types of items purchased for Back-to-
School stayed the same for Hispanics
this year vs. last. General school
supplies, clothes and shoes are the
most common items Hispanics
purchased, in 2015. Non-Hispanics will
increase their purchase of clothes,
books and athletic equipment
significantly this year.
13
Source: ThinkNow Research Hispanic
Omnibus Study – July 2014, July 2015
90%
78%
75%
47%
45%
35%
84%
79%
77%
46%
45%
34%
July 2014 July 2015
For Your Back-to-School Shopping, What Type of
Items will You be Shopping for?
14
School supplies (notebooks, pencils,
pens, paper, backpacks, etc.)
Clothes (uniforms, school outfits,
seasonal clothing, etc.)
Shoes (sneakers)
Electronics (computers, laptops, tablets,
printers, calculators, etc.)
Books (textbooks)
Athletic equipment/sporting goods
Hispanics Non-Hispanics
87%
76%
76%
46%
30%
26%
91%
85%
79%
41%
43%
39%
Up/down arrows indicate significant difference from 2014 at 95% confidence level.
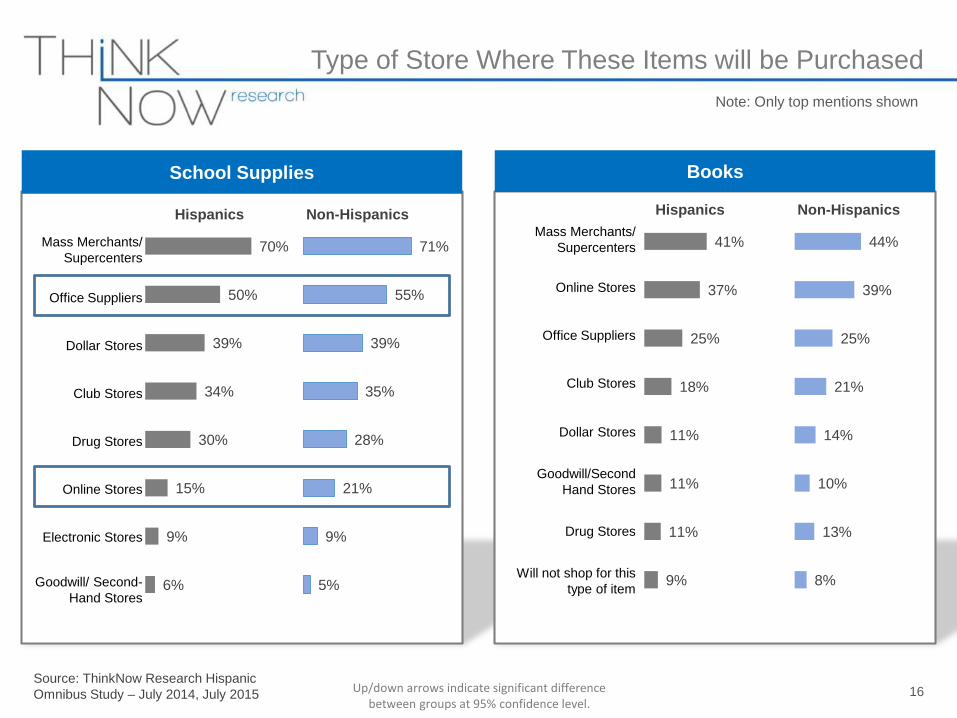
Mass merchants continue to be the most
important channel for school supplies,
followed by office suppliers.
15
Source: ThinkNow Research Hispanic
Omnibus Study – July 2014, July 2015
70%
50%
39%
34%
30%
15%
9%
6%
Type of Store Where These Items will be Purchased
16
School Supplies Books
Note: Only top mentions shown
Mass Merchants/
Supercenters
Office Suppliers
Dollar Stores
Club Stores
Drug Stores
Online Stores
Electronic Stores
Goodwill/ Second-
Hand Stores
71%
55%
39%
35%
28%
21%
9%
5%
Hispanics Non-HispanicsMass Merchants/
Supercenters
Online Stores
Office Suppliers
Club Stores
Dollar Stores
Goodwill/Second
Hand Stores
Drug Stores
Will not shop for this
type of item
41%
37%
25%
18%
11%
11%
11%
9%
44%
39%
25%
21%
14%
10%
13%
8%
Hispanics Non-Hispanics
Up/down arrows indicate significant difference between groups at 95% confidence level.
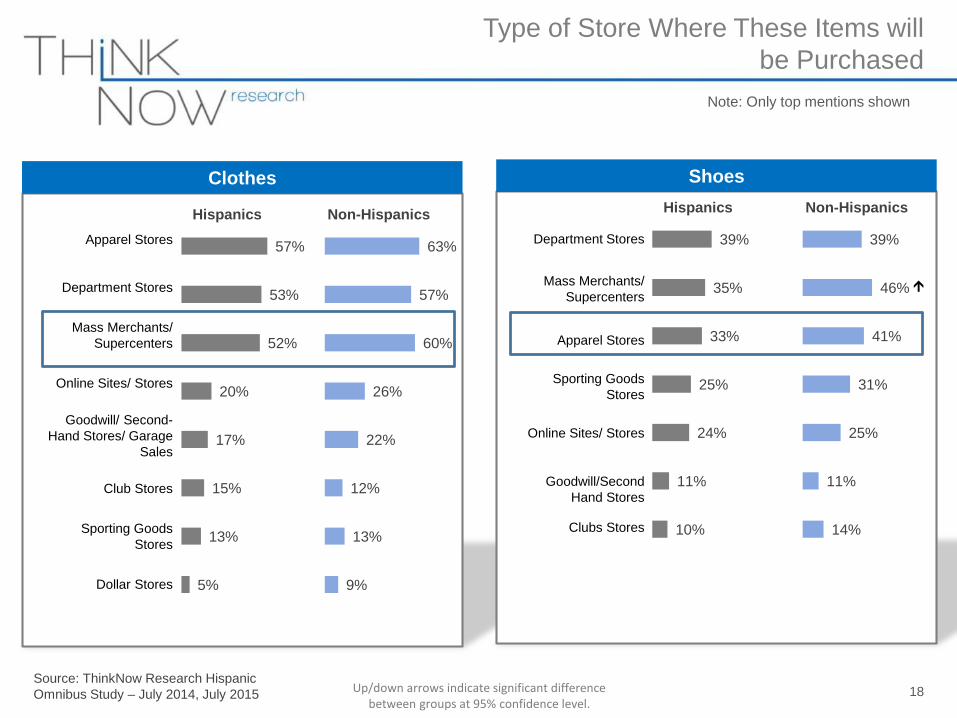
Apparel stores, Departments stores and
Mass merchants are the most popular
retailers for back-to-school clothes
and shoes.
17
Source: ThinkNow Research Hispanic
Omnibus Study – July 2014, July 2015
Type of Store Where These Items will
be Purchased
18
Clothes Shoes
Note: Only top mentions shown
Apparel Stores
Department Stores
Mass Merchants/
Supercenters
Online Sites/ Stores
Goodwill/ Second-
Hand Stores/ Garage
Sales
Club Stores
Sporting Goods
Stores
Dollar Stores
57%
53%
52%
20%
17%
15%
13%
5%
63%
57%
60%
26%
22%
12%
13%
9%
Hispanics Non-Hispanics
39%
35%
33%
25%
24%
11%
10%
39%
46%
41%
31%
25%
11%
14%
Hispanics Non-Hispanics
Department Stores
Mass Merchants/
Supercenters
Apparel Stores
Sporting Goods
Stores
Online Sites/ Stores
Goodwill/Second
Hand Stores
Clubs Stores
Up/down arrows indicate significant difference between groups at 95% confidence level.
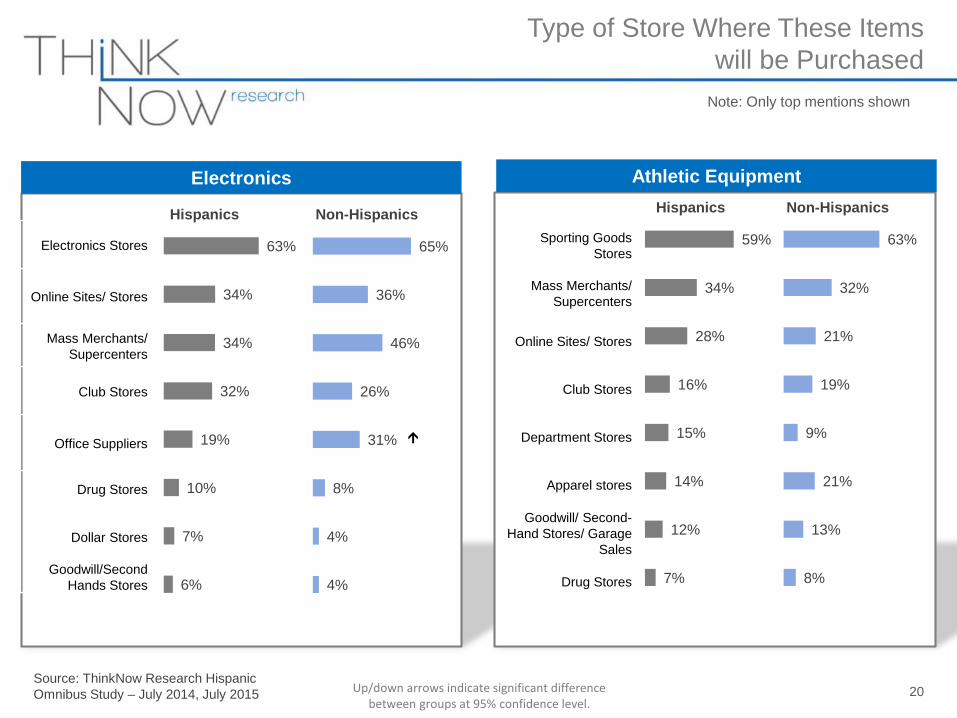
Non-Hispanics are significantly more likely
to shop for electronics at Office Supply
Stores compared to non-Hispanics.
19
Source: ThinkNow Research Hispanic
Omnibus Study – July 2014, July 2015
Type of Store Where These Items
will be Purchased
20
Electronics Athletic Equipment
Note: Only top mentions shown
63%
34%
34%
32%
19%
10%
7%
6%
65%
36%
46%
26%
31%
8%
4%
4%
Hispanics Non-Hispanics
59%
34%
28%
16%
15%
14%
12%
7%
63%
32%
21%
19%
9%
21%
13%
8%
Hispanics Non-Hispanics
Electronics Stores
Online Sites/ Stores
Mass Merchants/
Supercenters
Club Stores
Office Suppliers
Drug Stores
Dollar Stores
Goodwill/Second
Hands Stores
Sporting Goods
Stores
Mass Merchants/
Supercenters
Online Sites/ Stores
Club Stores
Department Stores
Apparel stores
Goodwill/ Second-
Hand Stores/ Garage
Sales
Drug Stores
Up/down arrows indicate significant difference between groups at 95% confidence level.
Physical stores are still the primary Back-
to-School mode of purchase for both
Hispanics and Non-Hispanics.
21
Source: ThinkNow Research Hispanic
Omnibus Study – July 2014, July 2015
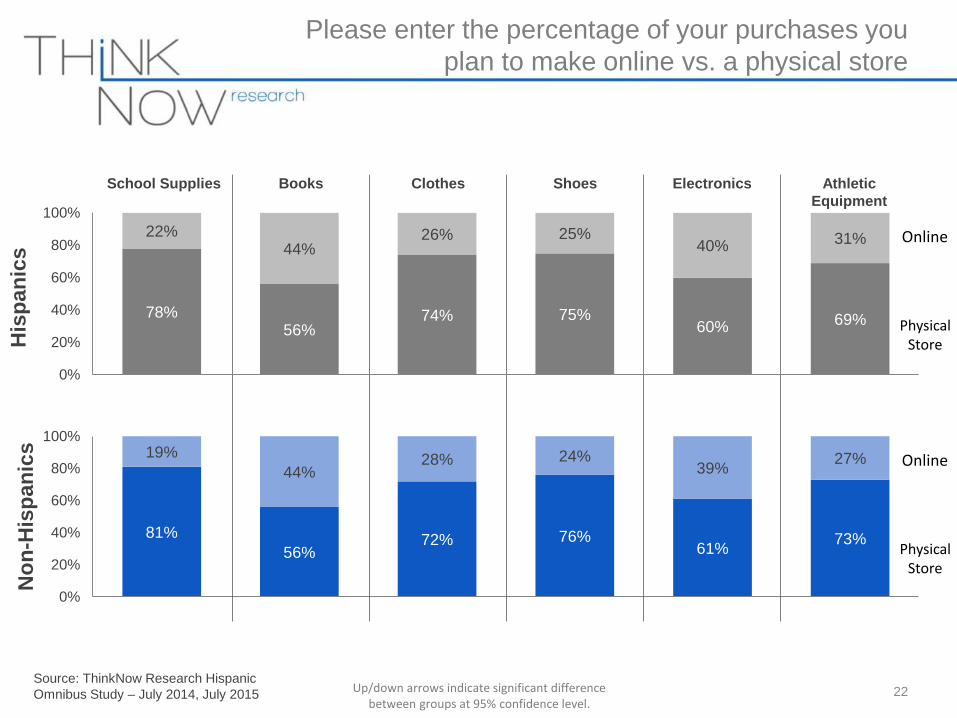
81%
56%72% 76%
61%73%
19%
44%28% 24%
39%27%
0%
20%
40%
60%
80%
100%
Jul'15 Jul'15 Jul'15 Jul'15 Jul'15 Jul'15
School Supplies Books Clothes Shoes Electronics Athletic
Equipment
78%56%
74% 75%60% 69%
22%44%
26% 25%40% 31%
0%
20%
40%
60%
80%
100%
Jul'15 Jul'15 Jul'15 Jul'15 Jul'15 Jul'15
22
Please enter the percentage of your purchases you
plan to make online vs. a physical store
His
pan
ics
No
n-H
isp
an
ics
Online
Physical Store
Online
Physical Store
Up/down arrows indicate significant difference between groups at 95% confidence level.
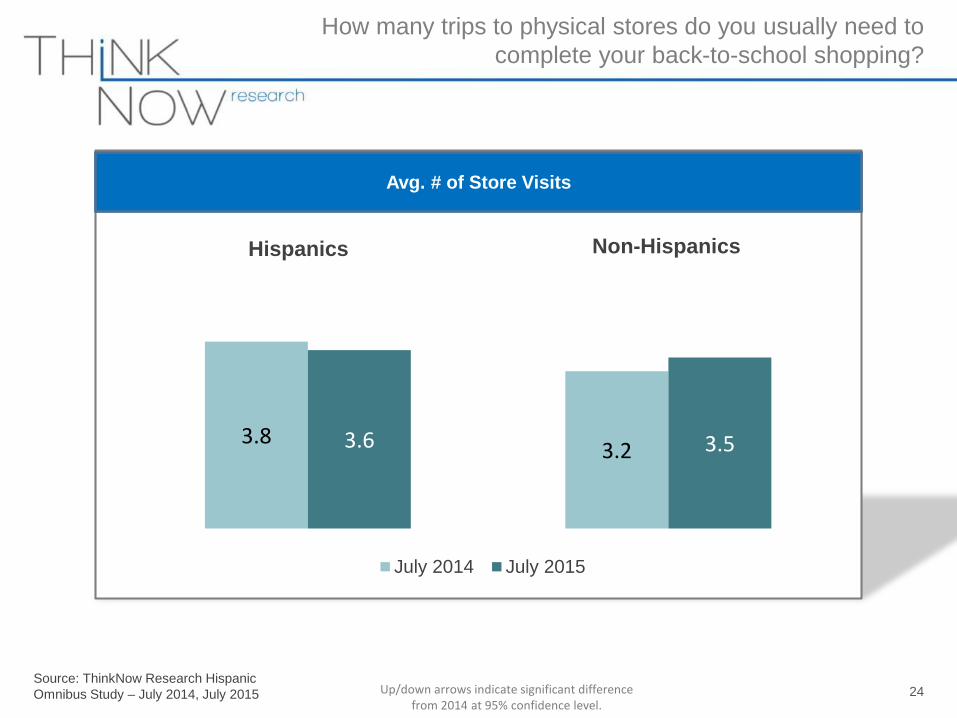
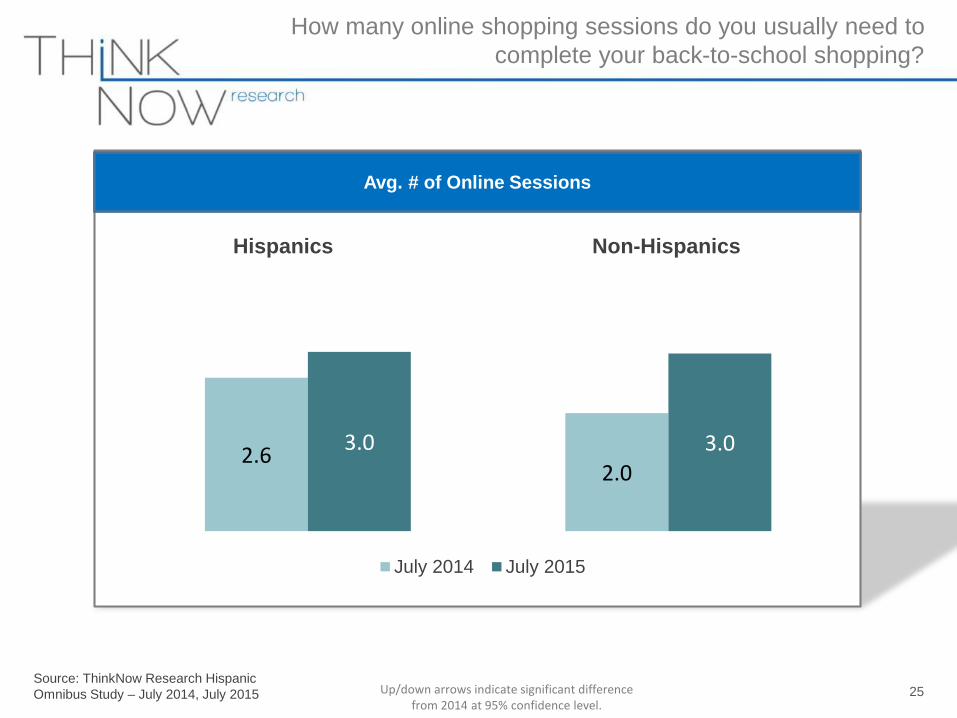
Both targets tend to make at least 3
visits/sessions in average when buying
back-to-school supplies, online or store
purchases.
23
Source: ThinkNow Research Hispanic
Omnibus Study – July 2014, July 2015
How many trips to physical stores do you usually need to
complete your back-to-school shopping?
24
Avg. # of Store Visits
3.83.23.6 3.5
July 2014 July 2015
Hispanics Non-Hispanics
Up/down arrows indicate significant difference from 2014 at 95% confidence level.
Source: ThinkNow Research Hispanic
Omnibus Study – July 2014, July 2015
How many online shopping sessions do you usually need to
complete your back-to-school shopping?
25
Avg. # of Online Sessions
2.62.0
3.0 3.0
July 2014 July 2015
Hispanics Non-Hispanics
Up/down arrows indicate significant difference from 2014 at 95% confidence level.
Appendix
Source: ThinkNow Research Hispanic
Omnibus Study – July 2014, July 2015
July 2014 July 2015 July 2014 July 2015
Metric
Hispanics
n=505
Non-
Hispanics
n=310
Hispanics
N=618
Non-
Hispanics
N=931 Metric
Hispanics
n=505
Non-
Hispanics
n=310
Hispanics
N=618
Non-
Hispanics
N=931
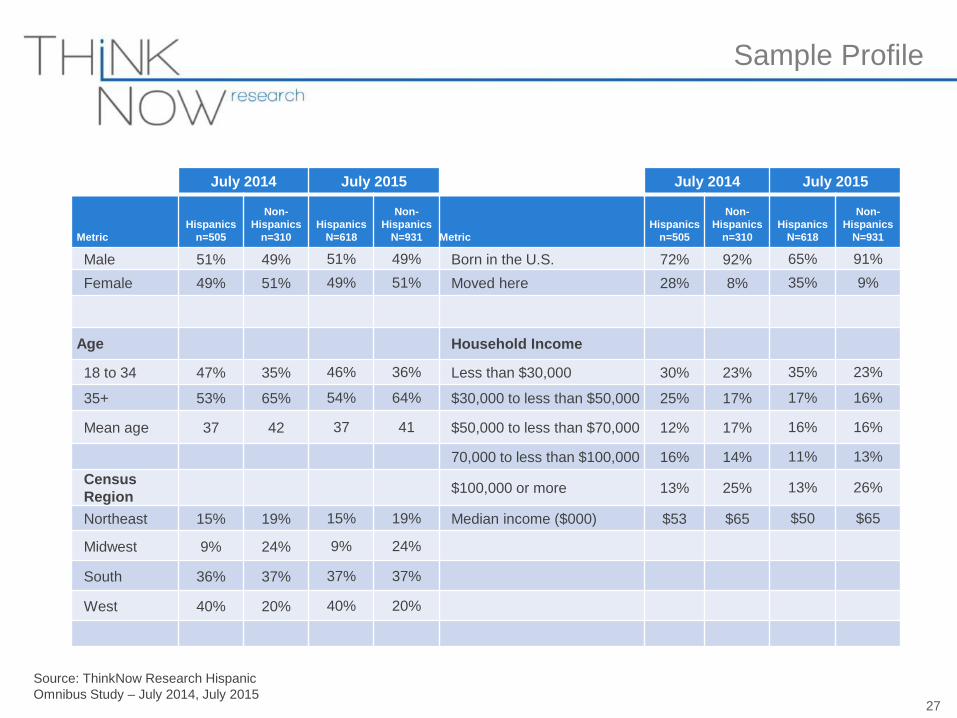
Male 51% 49% 51% 49% Born in the U.S. 72% 92% 65% 91%
Female 49% 51% 49% 51% Moved here 28% 8% 35% 9%
Age Household Income
18 to 34 47% 35% 46% 36% Less than $30,000 30% 23% 35% 23%
35+ 53% 65% 54% 64% $30,000 to less than $50,000 25% 17% 17% 16%
Mean age 37 42 37 41 $50,000 to less than $70,000 12% 17% 16% 16%
70,000 to less than $100,000 16% 14% 11% 13%
Census
Region$100,000 or more 13% 25% 13% 26%
Northeast 15% 19% 15% 19% Median income ($000) $53 $65 $50 $65
Midwest 9% 24% 9% 24%
South 36% 37% 37% 37%
West 40% 20% 40% 20%
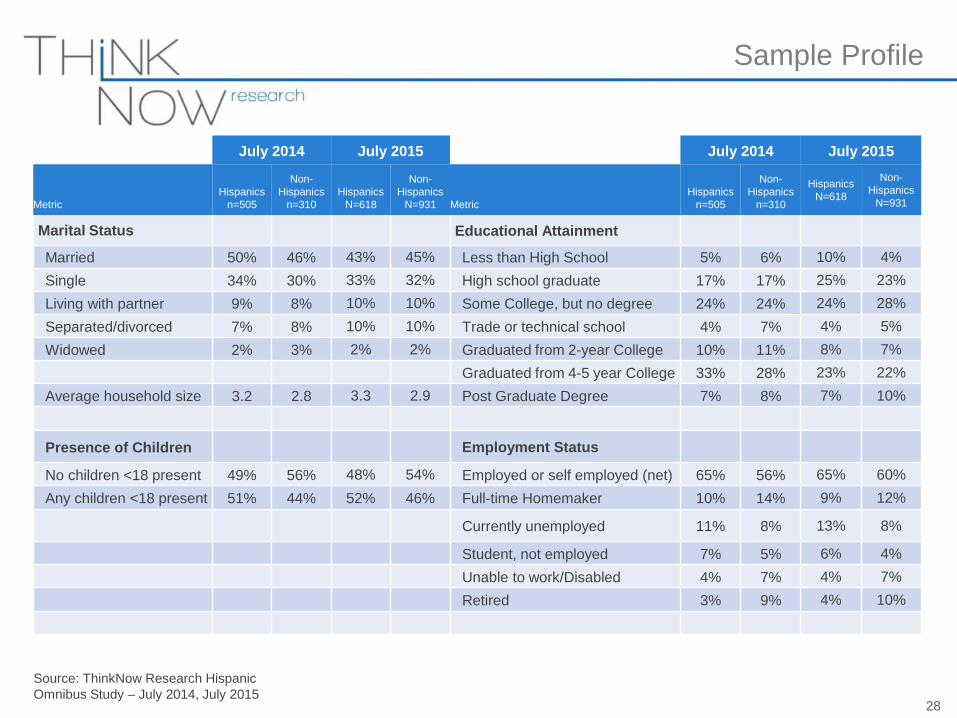
Sample Profile
27
Source: ThinkNow Research Hispanic
Omnibus Study – July 2014, July 2015
July 2014 July 2015 July 2014 July 2015
Metric
Hispanics
n=505
Non-
Hispanics
n=310
Hispanics
N=618
Non-
Hispanics
N=931 Metric
Hispanics
n=505
Non-
Hispanics
n=310
Hispanics
N=618
Non-
Hispanics
N=931
Marital Status Educational Attainment
Married 50% 46% 43% 45% Less than High School 5% 6% 10% 4%
Single 34% 30% 33% 32% High school graduate 17% 17% 25% 23%
Living with partner 9% 8% 10% 10% Some College, but no degree 24% 24% 24% 28%
Separated/divorced 7% 8% 10% 10% Trade or technical school 4% 7% 4% 5%
Widowed 2% 3% 2% 2% Graduated from 2-year College 10% 11% 8% 7%
Graduated from 4-5 year College 33% 28% 23% 22%
Average household size 3.2 2.8 3.3 2.9 Post Graduate Degree 7% 8% 7% 10%
Presence of Children Employment Status
No children <18 present 49% 56% 48% 54% Employed or self employed (net) 65% 56% 65% 60%
Any children <18 present 51% 44% 52% 46% Full-time Homemaker 10% 14% 9% 12%
Currently unemployed 11% 8% 13% 8%
Student, not employed 7% 5% 6% 4%
Unable to work/Disabled 4% 7% 4% 7%
Retired 3% 9% 4% 10%
Sample Profile
28
Source: ThinkNow Research Hispanic
Omnibus Study – July 2014, July 2015
Metric
Hispanics
2014
n=505
Hispanics
2015
N=618
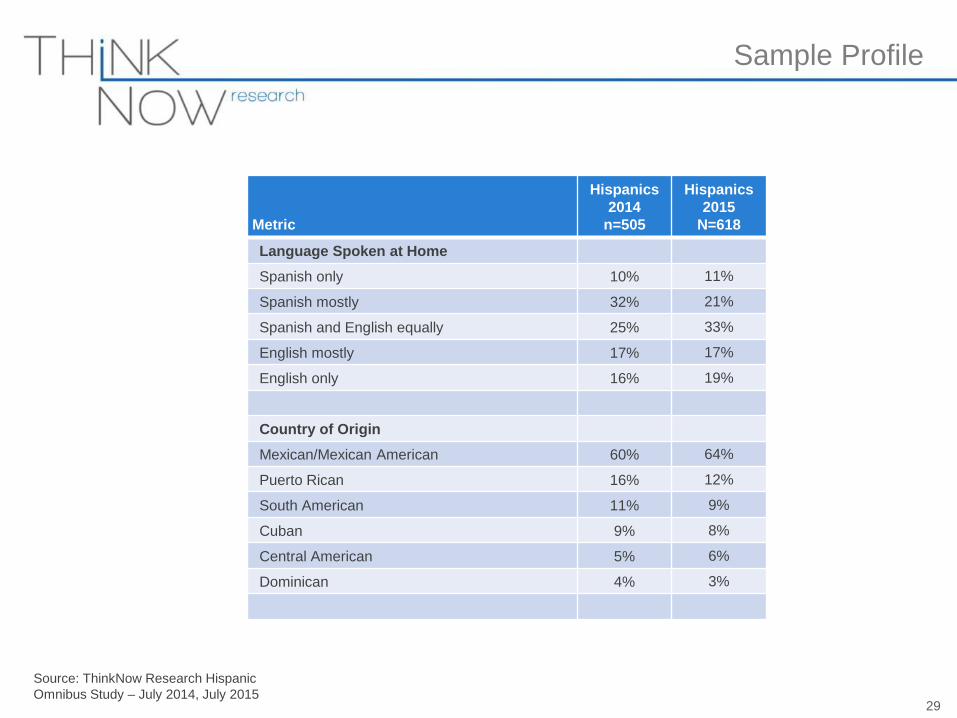
Language Spoken at Home
Spanish only 10% 11%
Spanish mostly 32% 21%
Spanish and English equally 25% 33%
English mostly 17% 17%
English only 16% 19%
Country of Origin
Mexican/Mexican American 60% 64%
Puerto Rican 16% 12%
South American 11% 9%
Cuban 9% 8%
Central American 5% 6%
Dominican 4% 3%
Sample Profile
29


![[Survey] Vietnam mom's shopping behavior change](https://img.pdfslide.us/doc/110x75/5a64b4db7f8b9ac21c8b4a6f/survey-vietnam-moms-shopping-behavior-change.jpg)