Embed Size (px)
Citation preview

2014 MEDIA MARKET REPORT FOR LATIN AMERICA

CONTENTS
Print: Market indicators of growth
TV: Trends in ad spend & pay TV
penetration
Internet: Audience size, future growth, sites
with most reach, user attitudes toward
Internet advertising
E-commerce: Total sales for 2013, projections
for 2014, growth since 2003, most popular
products
Mobile Market: Penetration of mobile phones,
smartphones & tablets, the triple-digit growth
of mobile Internet in Latin America and
response to mobile advertising
A Growing Consumer Class:
The surge of the class C middle class in
the region
Media Penetration & Consumption
in Latin America
Ad Spend Projections for Latam: 2013 and 2014
Social Media: Use, most popular sites, reach,
influence on consumer purchase decisions, social
TV
Online Videos: The audience, consumption trends
and advertising potencial

A GROWING CONSUMER CLASS: THE SURGE OF CLASS C

Source: The World Bank, Economic Mobility and the Rise of the Latin American Middle Class
1 in 3
Families in Latin America are middle class
IN THE PAST DECADE, MORE THAN 50 MILLION PEOPLE HAVE JOINED
THE MIDDLE CLASS IN LATIN AMERICA.

Sources: 1United Nations, 2World Bank, 3Cetelam report O Observador Brasil 2013, 4Consultora W, 5Departamento Administrativo Nacional de Estadística, 6Asociacion Mexicana de Agencias de Investigacion de Mercados y Opinión Pública, 7Asociación Peruana de Empresas de Investigación de Mercados, 8Novomerc Chile
7%
21%
3%
31%
7%
13%
47%
55% 52%
33% 32% 28%
0%
10%
20%
30%
40%
50%
60%
Argentina Brazil Chile Colombia Mexico Peru
Classes AB
Class C
LATIN AMERICA’S MIDDLE CLASS (CLASS C) HAS BECOME A SIGNIFICANT PORTION OF THE POPULATION IN SEVERAL KEY MARKETS…

…PARTICULARLY IN BRAZIL. WHY IS THIS SIGNIFICANT? FIRST, CLASS C IS GROWING QUICKLY.
105,000,000 Brazilians were Class C in 2011
55% of the population
In 2014
58% of the population
will be Class C
40,000,000
Brazilians joined Class C between 2003-2011
Source: Cetelem BGN Observador Brasil, Fecomercio SP, Data Popular

SECOND, CLASS C IS SPENDING HUGELY:
R$1.089 trillion
2012
Sources: IPC Target, FecomercioSP
R$1.4 trillion*
2015
*more than classes A and B combined!

MEDIA PENETRATION IN LATIN AMERICA

Source: IBOPE Media Book 2013 except Mexico numbers, which are from IBOPE Media Book 2012
Free TV Pay TV Radio Newspapers Magazines OOH Internet
Argentina 93% 74% 62% 40% 19% 90% 56%
Brazil 96% 40% 73% 31% 36% 83% 60%
Chile 97% 63% 58% 45% 21% 91% 64%
Colombia 95% 86% 75% 78% 41% 99% 50%
Costa Rica 97% 64% 65% 77% 8% 91% 71%
Ecuador 97% 27% 69% 48% 30% 96% 57%
Guatemala 77% 53% 82% 78% 6% 88% 30%
Honduras 92% 84% 77% 76% 36% 82% 41%
Mexico 97% 36% 54% 27% 27% 98% 48%
Panama 94% 50% 60% 73% 19% 75% 53%
Peru 98% 64% 81% 67% 15% 100% 56%
Penetration by Medium
TV, OUT-OF-HOME AND RADIO HAVE THE DEEPEST PENETRATION—BUT INTERNET IS GROWING SIGNIFICANTLY.

Available data for media consumption, by country
TV IS THE MOST-CONSUMED MEDIUM IN LATIN AMERICA BUT INTERNET IS TAKING UP MORE TIME.
TV RADIO NEWSPAPERS INTERNET
Argentina 6 hrs./day 56% listen daily 70% buy newspapers 26 hrs./month
Brazil 3 hrs, 29 min/day 69% listen daily 31% read newspapers 3 hrs, 39 min/day
Chile 3 hrs., 52 min./day
48% listen daily 20% read newspapers 11 hrs./week
Colombia 4 hrs./day 2.4 hrs./day 13% read newspapers 4.3 hrs./day
Mexico 2 - 4 hrs./day 56% listen daily 27% read newspapers 5 hrs./day
Peru 3 hrs., 20 min/day
2 hrs., 53 min/day 30 min./day 2 hrs., 40 min/day
Uruguay No data available 61% listen daily 12% read them every
day No data available
Sources: IBOPE, LAMAC, Notimex, Consejo Nacional de Lectura, ENTIC, Secretaria de Comunicação Social da Presidência da República, comScore, Target Group Index, Fundação Perseu Abramo, Encuesta UDP, UM Chile, DANE, EGM 2013, Google, AMIPCI, Consejo Consultivo de Radio y Televisión, Kantar Media Research , Opción Consultores

Source: TGI Latina
ANOTHER 2014 STUDY FROM TGI SHOWS INCREASES IN CONSUMPTION IN CERTAIN TRADITIONAL MEDIA:
Pay TV consumption has gone up by 5%
in Argentina, by 12% in Brazil and by
11% in Mexico
Newspaper consumption has gone up by 5% in Argentina, by 6% in Brazil and by 15% in Mexico
Magazine consumption has gone up by 7% in
Argentina, by 11% in Brazil and by 8% in
Mexico

AD SPEND PROJECTIONS FOR LATAM: 2013 AND
2014

Magna Global projects nearly 13% growth in ad spend for Latin America in 2014—more than double the growth of North America and Western Europe
2013 2014
Latin America 9.5% 12.7%
North America 1.5% 5.5%
Western Europe -0.8% 5.7%
Central & Eastern Europe 7.9% 10.5%
Asia Pacific 6.3% 8.7%
Middle East, North Africa 2.8% 6.3%
Rest of World 9.3% 10%
LATIN AMERICA IS THE WORLD’S FASTEST-GROWING REGION IN AD SPEND...

IN 2014, BRAZIL WILL BECOME THE #5 AD MARKET IN THE WORLD.
Source: Zenith Optimedia
Rank Country
Ad Spend in 2014 (billions)
#1 United States 173,593
#2 Japan 53,434
#3 China 48,755
#4 Germany 27,548
#5 Brazil 22,216

Argentina: up 30% in 2013 after growing by 19.6% in 20121
Sources: 1Cámara Argentina de Agencias de Medios, 2Projeto Inter-Meios, 3Asomedios and Andiarios, 4IAB Colombia, 5Confederación de la Industria de la Comunicación Mercadotécnica, 6Compañía Peruana de Estudios de Mercados, 7Asociación Uruguaya de Agencias de Publicidad, 8Magna Global, 9Asociación Chilena de Agencias de Publicidad
LATIN AMERICA’S AD SPEND IS GROWING STRONGLY IN ALL MAJOR MARKETS.
Brazil: up 7% in 2013 after growing by 10.7% in 20122
Colombia: offline media up 12.7% in 20133, online ad spend up 31%4
Mexico: up 38% in 2012 (no numbers for 2013 yet)5
Peru: up 8% in 20136
Uruguay: up 2.6% in 20137
Venezuela: up 19% in 20138
Chile: up 2.5% in 20139

Source: Cámara Argentina de Agencias de Medios
AD SPEND IN ARGENTINA, 2013
36.4%
28.6%
7.3%
6.4%
3.9%
3.8%
3.6% 1.1%
Free TV
Newspapers
Internet
Pay TV
OOH
Magazines
Radio
Cinema

Source: Projeto Inter-Meios* *This source shows only Internet display investment, not social or search; IAB Brasil indicates that Internet ad spend is about 11% of total spend when search and social are factored in
AD SPEND IN BRAZIL, 2013
66.5%
10.1%
5.5%
5%
4.5%
4.0% 3.5% 0.62% 0.32%
Free TV
Newspapers
Pay TV
Magazines
Internet
Radio
OOH
Guides
Cinema

Source: Asociación Chilena de Agencias de Publicidad
AD SPEND IN CHILE, 2013
42.7%
24.2%
9.3%
9.1%
7.0%
5.4%
2.2% 0.3%
Open TV
Newspapers
Internet
OOH
Radio
Pay TV
Magazines
Cinema

Source: ASOMEDIOS, IAB Colombia
AD SPEND IN COLOMBIA, 2013
49.2%
14.8%
11%
11.0%
9.9%
5.5%
2% 2.0%
Free TV
Newspapers
Radio
Internet
OOH
Pay TV
Magazines
Cinema

Source: Confederación de la Industria de la Comunicación Mercadotécnica
AD SPEND IN MEXICO, 2012
53%
9%
9%
8%
8%
4% 3%
2%
Free TV
Internet
Radio
Newspapers
Pay TV
OOH
Magazines
Cinema

Source: Compañía Peruana de Estudios de Mercados y Opinión Pública
AD SPEND IN PERU, 2013
49.2%
14.8%
11.0%
9.9%
6.2%
5.5% 2.0% 2.0%
Free TV
Newspapers
Radio
OOH
Internet
Pay TV
Magazines
Cinema
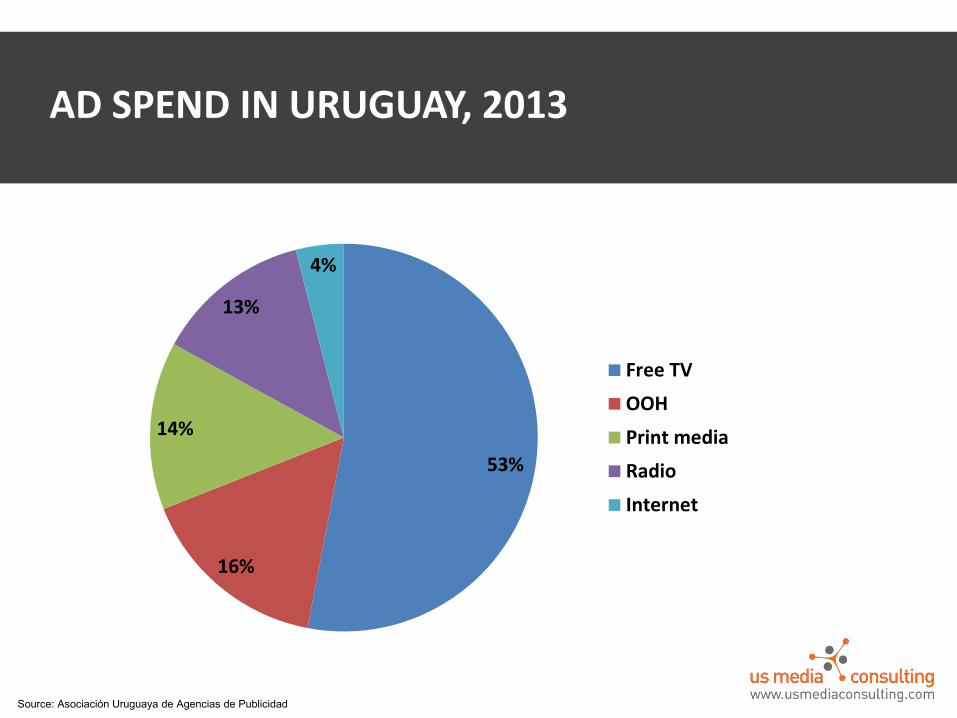
Source: Asociación Uruguaya de Agencias de Publicidad
AD SPEND IN URUGUAY, 2013
53%
16%
14%
13%
4%
Free TV
OOH
Print media
Radio
Internet

PRINT MEDIA IN LATIN AMERICA

Latin American newspapers will grow in revenue by 5.5% per year through 2016 to reach a total of US$10.4 billion2
Sources: 1WAN-INFRA, 2PriceWaterhouseCoopers Global Entertainment Media Outlook 2013-2017, 3Instituto Verificador de Circulação, 4KPMG
PRINT IS STILL A STRONG MEDIUM THROUGHOUT LATIN AMERICA. MARKET INDICATORS THAT SUGGEST THIS INCLUDE:
Newspaper circulation went up by 2.56% in Latin America in 2013 and by 6.26% over the past 5 years1
In 2009 magazine ad spend dropped in every region— EXCEPT for Latin America, and it’s forecast to grow through 20162
Latin American newspaper revenues went up by 65% between 2006 and 2011 and by 9.1% in 20121
Newspaper circulation in Brazil grew by 1.8% in 20123, magazine will grow by 7% between 2013 and 20172
11.9% CAGR growth is forecast for newspaper ad spend in Argentina through 20161
Newspapers grew by 50% in circulation in Peru between 2007 and 20124

Sources: Cámara Argentina de Agencias de Medios, Projeto Inter-Meios, Asociación Chilena de Agencias de Publicidad, Asomedios, Ipsa Group Latin America, Compañía Peruana de Estudios de Mercados y Opinión Pública, Comité Certificador de Medios ANDA-FEVAP
Argentina Brazil Chile Colombia Ecuador Peru Uruguay Venezuela
32%
15%
27% 26%
10%
17%
14%
28%
Print ranks #1 in ad spend share in Argentina and #2 (after free TV) in Brazil, Chile, Colombia, Ecuador, Perú, Uruguay and Venezuela
PRINT ALSO COMMANDS A MAJOR PORTION OF AD SPEND IN MANY LATAM MARKETS.
Print's Share of Ad Spend in Key Latam Markets, 2013

TV IN LATIN AMERICA

40%
66%
44%
48%
52% 49%
56%
Argentina Brazil Chile Colombia Mexico Peru Uruguay
Percentage of TV’s Ad Spend Share, 2011
FREE TV RULES AD SPEND IN MOST OF LATIN AMERICA…
Sources (left to right): Cámara Argentina de Agencias de Medios, Projeto Inter-Meios, Asociación Chilena de Agencias de Publicidad, Asomedios, Confederación de la Industria de la Comunicación Mercadotécnica, Compañía Peruana de Estudios de Mercados, Asociación Uruguaya de Agencias de Publicidad
Free TV Ad Spend Share in Major Latam Markets, 2013

Sources: 1Dataxis, 2Anatel, 3Centro de Investigación en Innovación en Telecomunicaciones, 4Business Bureau
pay TV penetration
in Latam by 20171
of homes in Brazil will be subscribed to pay TV by 2018—potential audience of 173 million2
11 million pay TV subscribers in Argentina4
Penetration of pay TV
in Mexico in
December 20133
7.9 million pay TV subscribers in Colombia4
Percentage of TV’s Ad Spend Share, 2011
…BUT PAY TV PENETRATION IS AT 53% IN ALL OF LATAM4 AND IS GROWING RAPIDLY.
68%
90%
50%

PAY TV HAS STRONG REACH IN SEVERAL LATIN AMERICAN MARKETS.
Source: Business Bureau, June 2014 market estimates
Levels of Pay TV Reach in Latin American Countries
0.0%
10.0%
20.0%
30.0%
40.0%
50.0%
60.0%
70.0%
80.0%
90.0%
100.0%
84.5%
70.3% 63%
62.1% 61.2% 61% 58.8% 56.7%
42.7%
38.9%
33.5%

THERE ARE ALSO NEW GROWTH MARKETS FOR PAY TV IN LATIN AMERICA.
Source: Business Bureau
1.6 million subscribers 45% growth between 2012 and 2013
753,787 subscribers Projected 85% penetration by 2017 with 1,000,000 subscribers
3.2 million subscribers 18% growth since 2012
Chile
Ecuador
Uruguay

INTERNET IN LATIN AMERICA

Sources: *estimate from eMarketer, other figures from Internet WorldStats and World Internet Project
Percentage of TV’s Ad Spend Share, 2011
AS OF DECEMBER 2014, INTERNET WILL COMMAND A HUGE AUDIENCE IN LATIN AMERICA: 330 MILLION*. CURRENT AMOUNTS OF INTERNET USERS BELOW:
32,000,000 4,199,000
109,773,650 11,546,000
28,475560 2,185,506
6,054,013 6,316,555
1,649,980 2,885,475
1,530,543 64,200,000
906,539 1,548,016 2,473,724
11,817,991 2,675,843 1,936,000
13,000,000
Argentina
Bolivia
Brazil
Chile
Colombia
Costa Rica
Dominican Republic
Ecuador
El Salvador
Guatemala
Honduras
Mexico
Nicaragua
Panama
Paraguay
Peru
Puerto Rico
Uruguay
Venezuela

Growth projections for specific markets:
Sources: 1LACNIC, 2Comitê Gestor da Internet, 3Pyramid Group, 4Latin America & Caribbean Network Information Centre, 5Comisión Nacional de Telecomunicaciones de Paraguay
Percentage of TV’s Ad Spend Share, 2011
BY 2015, THERE WILL BE 60% INTERNET PENETRATION IN LATIN AMERICA AND 120 MILLION ADDITIONAL USERS.1
Brazil 168 million by 2014, up from 105 million in 20132
Chile 16.4 million by 2015, up from 10 million in 20123
Ecuador 7.5 million by 2015, up from 6.6 million in 20134
Mexico 65 million by 2015, up from 52 million in 20134
Paraguay 3.4 million by 2015, up from 1.5 million in 20125

Types of Web Sites with Deepest Reach among
the Region’s Internautas:
Source: Futuro Digital, comScore, March 2013
Percentage of TV’s Ad Spend Share, 2011
HERE’S WHERE TO REACH LATIN AMERICA’S INTERNET USERS.
98.8% 97.5% 97.3% 96.9% 94.0%
85.5%
0%
10%
20%
30%
40%
50%
60%
70%
80%
90%
100%

• 67% of Brazilian consumers use the Internet as a source before going shopping1
• 95% of Brazilian conusmers look for information online before buying a car2
• 68% of Brazilian Internet users say that online ads influence their purchase decisions3
• 57% of Brazilian Internet users say that online ads motivate them to buy the advertised products4
Sources: 1Oh! Panel, 2IDG, 3Deloitte Media Democracy, 4IAB Brasil, 5Asociación Mexicana de Internet, 6Estudio Colombiano del Internet 2011
• 75% of Mexican Internet users stop to look at online ads5
• 83% of Mexican Internet users recall online ads5
• The categories with the largest recall include computer accessories (50%), movies (46%), mobile phones (45%), banks (32%) and software (32%)5
• 53% like to see ads in social media sites and 61% recall they ads they see on those social sites5
• Among the ad formats preferred by Colombian Internet users are banners (37%), videos (35%) and sponsored links6
• 7 of 10 Colombians look for opinions and recommendations on social media before buying a product1
• Internet is the #2 medium that motivates Colombians to buy products6
STUDIES SHOW THAT LATIN AMERICANS ARE VERY RECEPTIVE TO ONLINE ADVERTISING IN SEVERAL MARKETS.

Sources: 1Ipsos, 2Google, 3Asociación Mexicana del Internet, 4comScore, 5Oh! Panel
Internet closes sales in Latin America.
80% of Brazilian Internet users say that the Internet is how they first find out about new products1
73% of Mexican Internet users research products online before shopping2 and 75% stop to view online ads3
8 of 10 Internet users in Latin America research products online before buying4
89% of Colombian Internet users do online research before buying a car5

PROGRAMMATIC BUYING IS ANOTHER IMPORTANT ONLINE TREND IN LATIN AMERICA.
Source: International Data Corporation
600% The amount by which programmatic ad spend will grow in 2015 in Latin America

AND IT WILL KEEP GROWING…
Source: International Data Corporation
2018 US$54M
2016 US$12M
2017 US$27M Between 2014 and 2018,
programmatic ad spend in Latin America will go up by
8.900%

SOCIAL MEDIA IN LATIN AMERICA

Of Latin American Internet users are on
social media11
Sources: 1comScore, 2Socialbakers, Facebook press release August 2013
SOCIAL MEDIA HAVE DEEP PENETRATION AND HEAVY ENGAGEMENT IN THE REGION.
Growth in Facebook users in 2012 in Latin America: more
than 200 million users around the region2
Latin American Internet users spend an average of
10 hours per month on social media sites, more than double the amount spent on other popular
types of sites1
95% 19% 10

• 73% of Latin Americans regularly read comments about brands on social media
• 66.9% trust these comments • 62% say these comments influence their
purchase decisions
Source: Oh! Panel study, May 2011
SOCIAL MEDIA INFLUENCE THE PURCHASE DECISIONS OF 62% OF LATIN AMERICANS.
• 58.9% of Latin Americans go on social media to find product information
• 36.8% of Latin Americans follow brands on social media
• 78.6% follow brands to learn about new products offered by that brand

Source: comScore
ALTHOUGH FACEBOOK IS BY FAR LATAM’S MOST POPULAR SITE, OTHER SOCIAL SITES HAVE GROWN ENORMOUSLY IN THE REGION.
300%
81%
Increase in unique visitors, Jan 2013 to March 2014
43% 63%
434%

Source: Ericsson
ANOTHER RECENT TREND IN LATIN AMERICA IS SOCIAL TV:
A large study of 12,000 TV viewers around the world found that 67% of viewers in Mexico, Brazil and Chile use tablets, smartphones and laptops while they watch TV

Source: Ericsson
OTHER STUDIES SUPPORT THIS TREND:
A UM survey of Mexicans found that 50% combine watching TV with using smartphones
Google Brazil found that 37% of Brazilian Internet users watch TV with a mobile device in their hands
More than 5 million Argentines go online with their smartphones while they watch TV
41% of Chilean digital users end up using 3 or more screens a day

ONLINE VIDEOS IN LATIN AMERICA

11.5 million videos watched every month in Argentina, Brazil, Chile and Mexico
Source: comScore
ONLINE VIDEO CONSUMPTION HAS SPIKED SIGNIFICANTLY IN LATIN AMERICA.
95.5%: online videos have the deepest reach in Argentina, followed by Chile (91.6%), Brazil (85.9%) and Mexico (81.3%)
156 online videos a month are watched by Brazilians, while Chileans watch 144 per month, Mexicans watch 125 per month and Argentines watch 105 per month
E-COMMERCE IN LATIN AMERICA

Source: 1América Economía & Visa Latin America E-Commerce study, 2012, 2Instituto Latinoamericano de Comercio Electrónico
E-COMMERCE IN LATIN AMERICA HAS GROWN BY 27 TIMES SINCE 2003.
E-commerce sales in Latam
in 2003: US$1.6 billion1
E-commerce sales in Latam
in 2013:
US$70 billion2

Clothes
Computer electronics
Music, movies or videos
Appliances
Computer hardware
Source: comScore
OVERALL, CLOTHES ARE THE PRODUCT THAT LATIN AMERICANS BUY THE MOST ONLINE. A 2012 comScore e-commerce study of Latin America revealed the most popular products among online shoppers in the region:
1
2
3
4
5
6
7
8
9
10
Entertainment tickets
Vacation/travel
Health and beauty care
Books and magazines
Sports and fitness

Sources: 1América Economía & Visa E-Commerce Study, Latin America, 2012, 2e-bit
The percentage of e-commerce sales in
Latin America that are generated in Brazil1
2013 e-commerce sales in Brazil2
Projected 2014 e-commerce sales in Brazil2
BRAZIL IS THE LEADING E-COMMERCE MARKET IN LATIN AMERICA…
59% US$ 13.4
billion
US$ 16 billion

…BUT OTHER LATIN AMERICAN MARKETS ARE POSTING STRONG E-COMMERCE NUMBERS.
Sources: 1América Economía & Visa Latam E-commerce study, 2012, 2Asociación Mexicana de Internet, 3eMarketer, 3Cámara Argentina de Comercio Electrónico, 4Cámara Colombiana de Comercio Electrónico, 5Cámara de Comercio de Santiago
Mexico • #2 e-commerce market in Latam1
• US$9.2 billion in sales in 20132
• 20% projected growth in 20142
• Top 5 selling products are (#1) Music/movies, (#2) computers, (#3) clothes & accessories, (#4) tickets to shows, (#5) hotel reservations2
Argentina • US$3.1 billion in sales in 2013, 50%
projected growth in 20143
• 5 best-selling products are (#1) smartphones, (#2) women’s clothes, (#3) car accessories, (#4) men’s clothes, (#5) home decor3
Colombia • US$2.1 billion in sales in 20121
• US$3 billion in sales in 20134
Chile • US$1.3 billion in sales in 20121
• US$1.6 billion in sales in 20135
LATIN AMERICA’S MOBILE MARKET

MOBILE PENETRATION IN LATIN AMERICA IS AT 105% AND WILL REACH 130% BY 20151.
Sources: 1GSMA, Comisión Nacional de Comunicaciones de Argentina, Anatel, Subsecretaría de Telecomunicaciones, Ministerio de Tecnologías de la Información y las Comunicaciones, Ministerio de Ambiente, Energía y Telecomunicaciones, Superintendencia de Telecomunicaciones, Pyramid Research, Superintendencia de Telecomunicaciones, Unión Internacional de Telecomunicaciones, Everis, Oficina de Desarrollo de las Telecomunicaciones de la UIT, El Ministerio de Transportes y Comunicaciones, Instituto Nacional de Estadísticas, Comisión Nacional de Telecomunicaciones, Vision Mobile, Google, 3D Chile, LG Mobile Colombia, IDC, Futuro Labs
142% 136% 134%
106% 101%
87% 98%
20% 23% 30%
7% 10%
35%
17%
0%
20%
40%
60%
80%
100%
120%
140%
Argentina Brazil Chile Colombia Costa Rica Mexico Peru
Mobile penetration Smartphone penetration

SMARTPHONE SALES CONTINUE TO SPIKE IN LATIN AMERICA1.
45% growth in new users of smartphones
in Latin America during
20131
55%
Source: eMarketer

INDIVIDUAL LATAM MARKETS ALSO POSTING STRONG SMARTPHONE SALES. GROWTH IN 2013:
Sources: 1IDC, 2Samsung Peru, projected growth for all of 2013, 3GK Retail y Technology
122% in Brazil1
59% in Mexico1
98% in Peru2
96% in Chile3

LATIN AMERICANS ALSO ARE BUYING MORE TABLETS THAN EVER BEFORE.
234% increase in Latam
tablet sales between Q1 2012
& Q1 2013
Source: IDC

Argentina: 125% increase in tablet sales in 2013: 900,000 units sold1
Sources: 1Carrier y Asociados, 2IDC, 3IDC and Dominio Consultores, 4IDC Mexico
SEVERAL LATAM MARKETS ARE ADOPTING TABLETS AT SIGNIFICANT RATES.
Brazil: Tablet sales reached 8 million in 2013 and are projected to reach 10.7 million in 20142
Chile: 1.5 million sold in 2014, more than 2 million units projected for 20142
Peru: Projected tablet sales of 1.6 million in 2013, a 132% increase compared to 20123
Mexico: Tablet sales reached 4.3 million in 2013 and will reach 6.2 million units by 20144

Increase in the use of mobile Internet in Brazil in
20132
Increase in the use of mobile Internet in Costa
Rica in 20131
Increase in the use of mobile Internet in Colombia in 2013
Increase in the use of mobile Internet in Argentina in 2013
Increase in the use of mobile Internet in
Mexico in 2013
Increase in the sue of mobile Internet in
Chile in 2013
MOBILE INTERNET IS GROWING SIGNIFICANTLY IN LATIN AMERICA.
332% 244% 221%
216% 213% 185%
Source: Invasión Mobile Latinoamérica 2013, a report from Guialocal.com

LATIN AMERICANS ARE SHOWING STRONG RESPONSE TO MOBILE ADS.
Sources: 1MediaMinds, 2Hunt Mobile Ads
Average CTR for mobile banners in Latin America, higher than that of Australia, Eastern Europe and most of Asia1
Of Latam mobile device users respond favorably to geo-targeted ads1
Mobile ad CTR for Colombia2
Mobile ad CTR for Mexico2
Mobile ad CTR for Brazil2
Mobile ad CTR for Argentina2
.60% .56% .61% .52%
33% .48%

MOBILE AD SPEND KEEPS GROWING IN LATIN AMERICA.
Sources: Telefónica, eMarketer
In Brazil mobile ad spend will
reach $132 million in 2014
and $731 million by 2017
Mexico leads Latam mobile ad spend and in 2014 advertisers in the country will invest
$173 million in mobile ads
70%
Until 2017 mobile ad
spend in Latam will keep growing by

Launched 2003, US Media Consulting is a leading media services agency that specializes in increasing the efficiencies of agencies in Latin America—and in turn their profits. We do this by:
• Crafting media plans that deliver significant ROI through strategic media selection and efficient campaign implementation
• Innovating media technologies like MediaDesk—the leading programmatic buying platform in Latin America—that spike the effectiveness of the digital campaigns that agencies run
• Bringing new media, firms and technology to Latin America that agencies can use to deliver even better results for their clients
• Increasing agency profitability through financial operations and campaign management through both experienced staff and leading-edge technology
Visit www.usmediaconsulting.com to learn more
About US Media Consulting