Embed Size (px)
Citation preview
GLOBAL BENCHMARK ENTERTAINMENT 2014 - 2015
Summary
• Methodology
• Glossary
• Key Take-Outs
• Video Length per sub-category
• CTRs per genre across sub-category
• Metrics across genres
• Campaigns per country: sub-category & genre
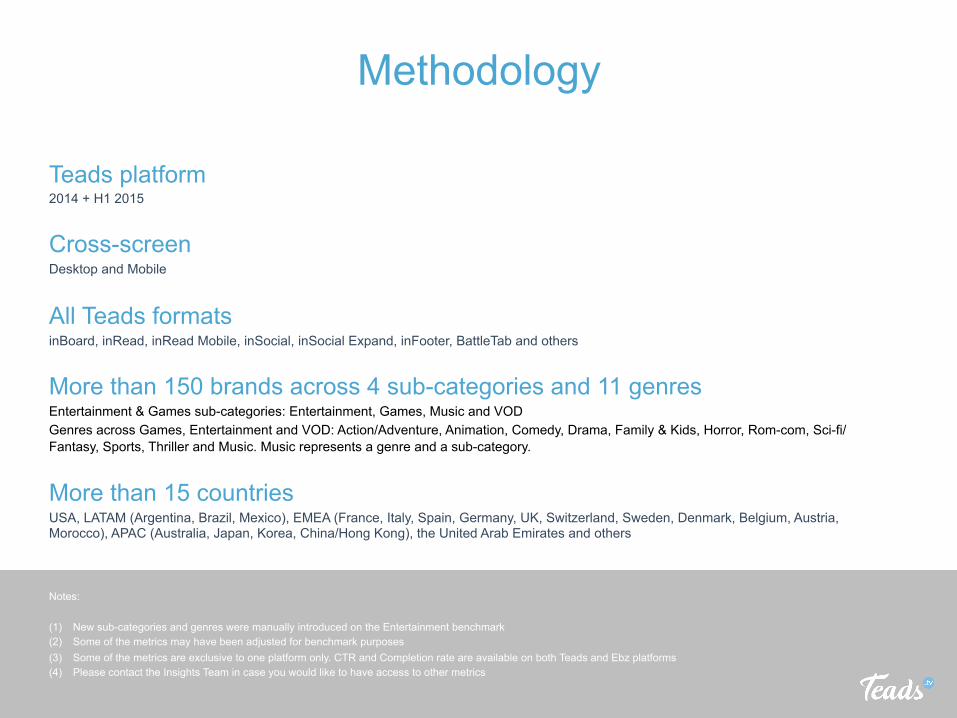
Teads platform 2014 + H1 2015
Cross-screen Desktop and Mobile
All Teads formats inBoard, inRead, inRead Mobile, inSocial, inSocial Expand, inFooter, BattleTab and others
More than 150 brands across 4 sub-categories and 11 genres Entertainment & Games sub-categories: Entertainment, Games, Music and VOD Genres across Games, Entertainment and VOD: Action/Adventure, Animation, Comedy, Drama, Family & Kids, Horror, Rom-com, Sci-fi/Fantasy, Sports, Thriller and Music. Music represents a genre and a sub-category.
More than 15 countries USA, LATAM (Argentina, Brazil, Mexico), EMEA (France, Italy, Spain, Germany, UK, Switzerland, Sweden, Denmark, Belgium, Austria, Morocco), APAC (Australia, Japan, Korea, China/Hong Kong), the United Arab Emirates and others Notes: (1) New sub-categories and genres were manually introduced on the Entertainment benchmark (2) Some of the metrics may have been adjusted for benchmark purposes (3) Some of the metrics are exclusive to one platform only. CTR and Completion rate are available on both Teads and Ebz platforms (4) Please contact the Insights Team in case you would like to have access to other metrics
Methodology
Action/Adventure
Animation
Comedy
Drama
Family & kids
Horror
Music
Rom com
Sci-fi/Fantasy
Sports
Thriller
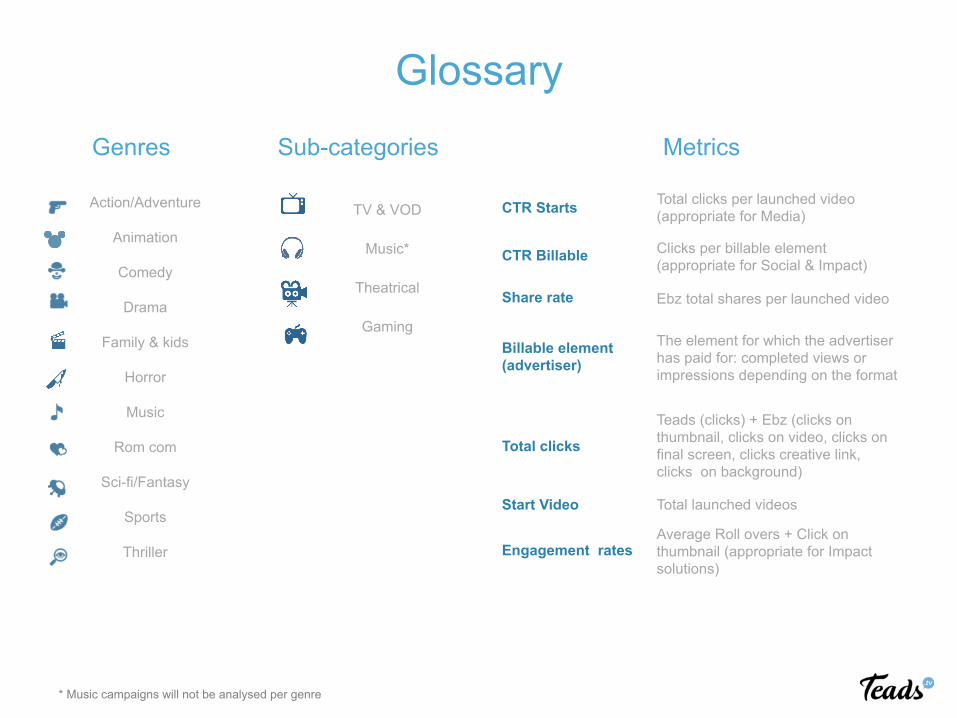
CTR Starts Total clicks per launched video (appropriate for Media)
CTR Billable Clicks per billable element (appropriate for Social & Impact)
Share rate Ebz total shares per launched video
Billable element (advertiser)
The element for which the advertiser has paid for: completed views or impressions depending on the format
Total clicks
Teads (clicks) + Ebz (clicks on thumbnail, clicks on video, clicks on final screen, clicks creative link, clicks on background)
Start Video Total launched videos
Engagement rates Average Roll overs + Click on thumbnail (appropriate for Impact solutions)
Glossary Genres Sub-categories Metrics
TV & VOD
Music*
Theatrical
Gaming
* Music campaigns will not be analysed per genre
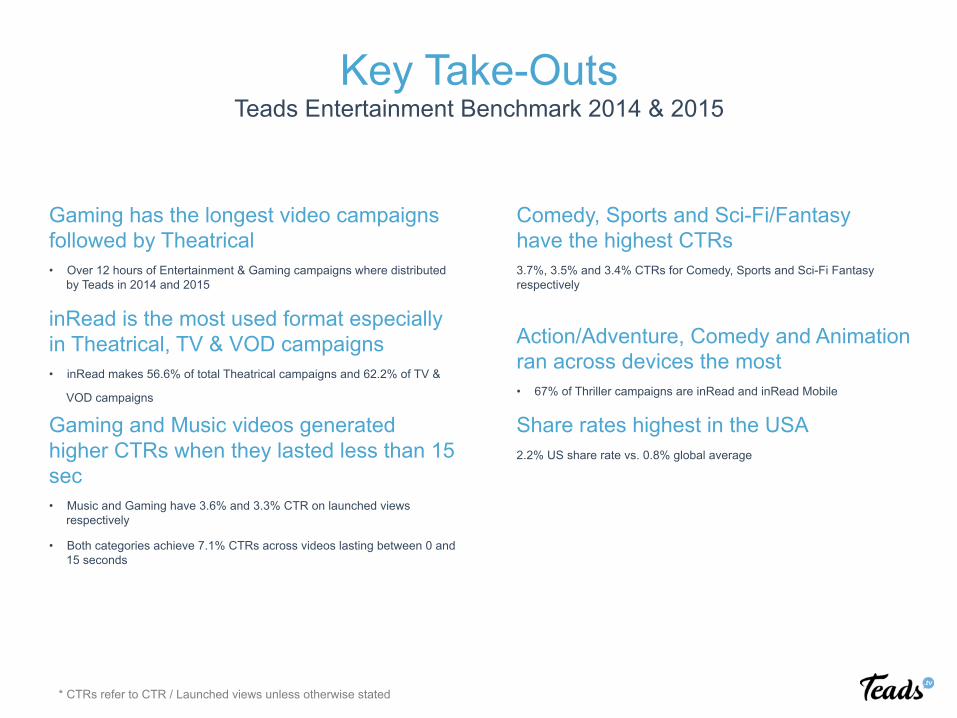
Key Take-Outs Teads Entertainment Benchmark 2014 & 2015
Gaming has the longest video campaigns followed by Theatrical • Over 12 hours of Entertainment & Gaming campaigns where distributed
by Teads in 2014 and 2015
inRead is the most used format especially in Theatrical, TV & VOD campaigns
• inRead makes 56.6% of total Theatrical campaigns and 62.2% of TV &
VOD campaigns Gaming and Music videos generated higher CTRs when they lasted less than 15 sec • Music and Gaming have 3.6% and 3.3% CTR on launched views
respectively
• Both categories achieve 7.1% CTRs across videos lasting between 0 and 15 seconds
Comedy, Sports and Sci-Fi/Fantasy have the highest CTRs 3.7%, 3.5% and 3.4% CTRs for Comedy, Sports and Sci-Fi Fantasy respectively
Action/Adventure, Comedy and Animation ran across devices the most • 67% of Thriller campaigns are inRead and inRead Mobile
Share rates highest in the USA 2.2% US share rate vs. 0.8% global average
* CTRs refer to CTR / Launched views unless otherwise stated
7.1%
3.7%
3.5%
3.3%
7.1%
3.6%
2.4%
3.5%
16.9%
10.0%
16.2%
12.0%
38.8%
16.0%
13.5%
16.1%
0.4%
0.8%
1.8%
0.2%
30.8%
0.1%
4.4%
0.2%
0% 10% 20% 30% 40% 50% 60% 70% 80% 90%
0 - 15 sec
15-30 sec
0 - 15 sec
15-30 sec
0 - 15 sec
15-30 sec
0 - 15 sec
15-30 sec
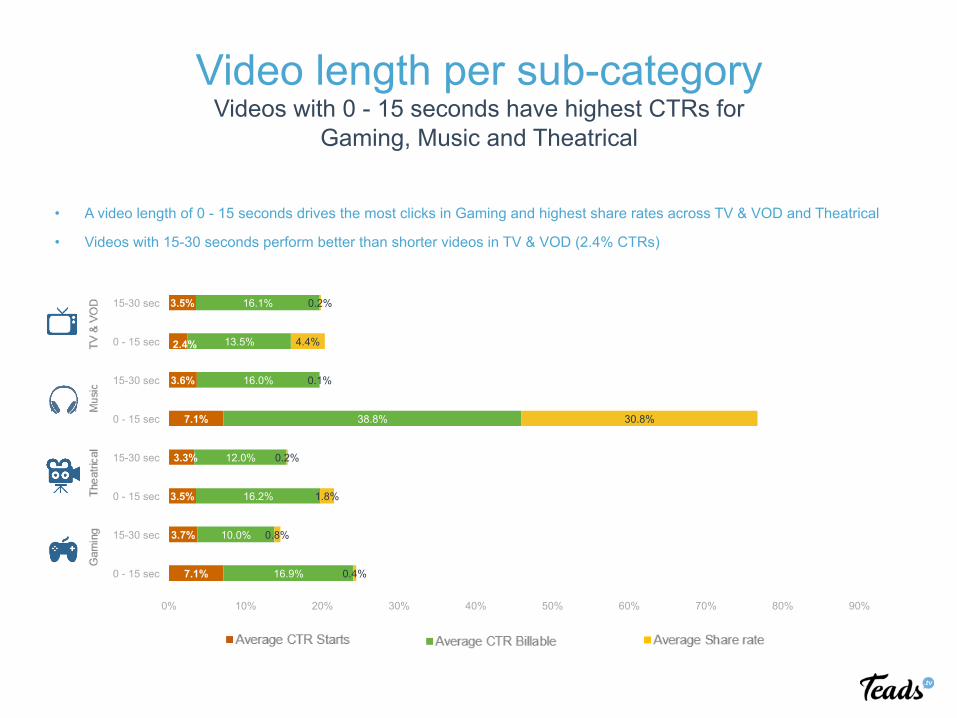
• A video length of 0 - 15 seconds drives the most clicks in Gaming and highest share rates across TV & VOD and Theatrical
• Videos with 15-30 seconds perform better than shorter videos in TV & VOD (2.4% CTRs)
Video length per sub-category Videos with 0 - 15 seconds have highest CTRs for
Gaming, Music and Theatrical
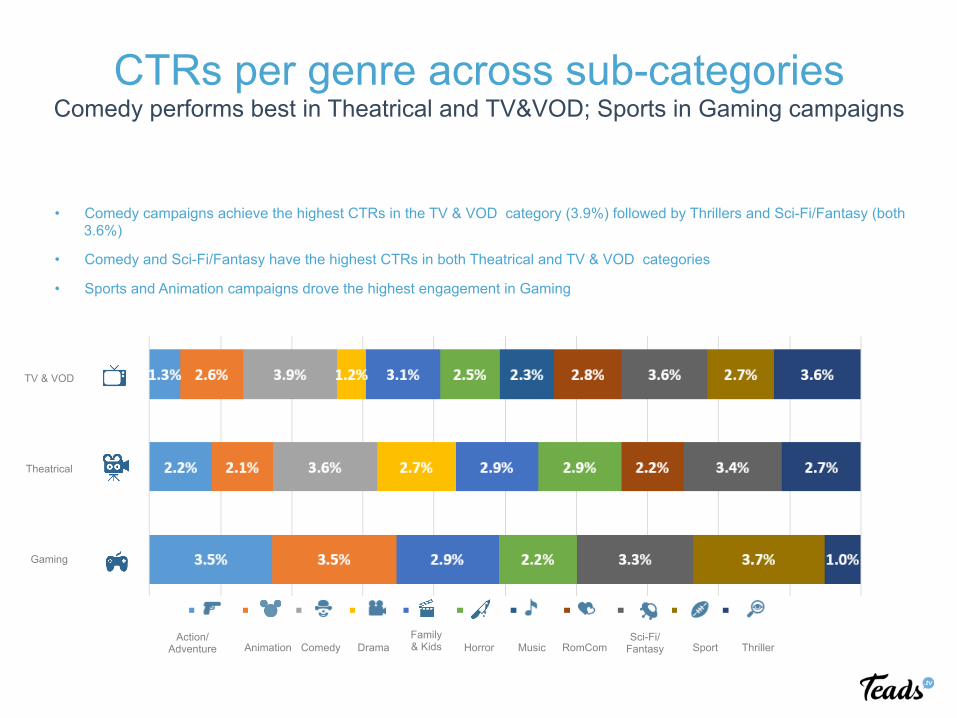
CTRs per genre across sub-categories Comedy performs best in Theatrical and TV&VOD; Sports in Gaming campaigns
• Comedy campaigns achieve the highest CTRs in the TV & VOD category (3.9%) followed by Thrillers and Sci-Fi/Fantasy (both 3.6%)
• Comedy and Sci-Fi/Fantasy have the highest CTRs in both Theatrical and TV & VOD categories
• Sports and Animation campaigns drove the highest engagement in Gaming
Action/Adventure Animation Comedy Drama
Family & Kids Horror Music RomCom
Sci-Fi/ Fantasy Sport Thriller
TV & VOD
Theatrical
Gaming
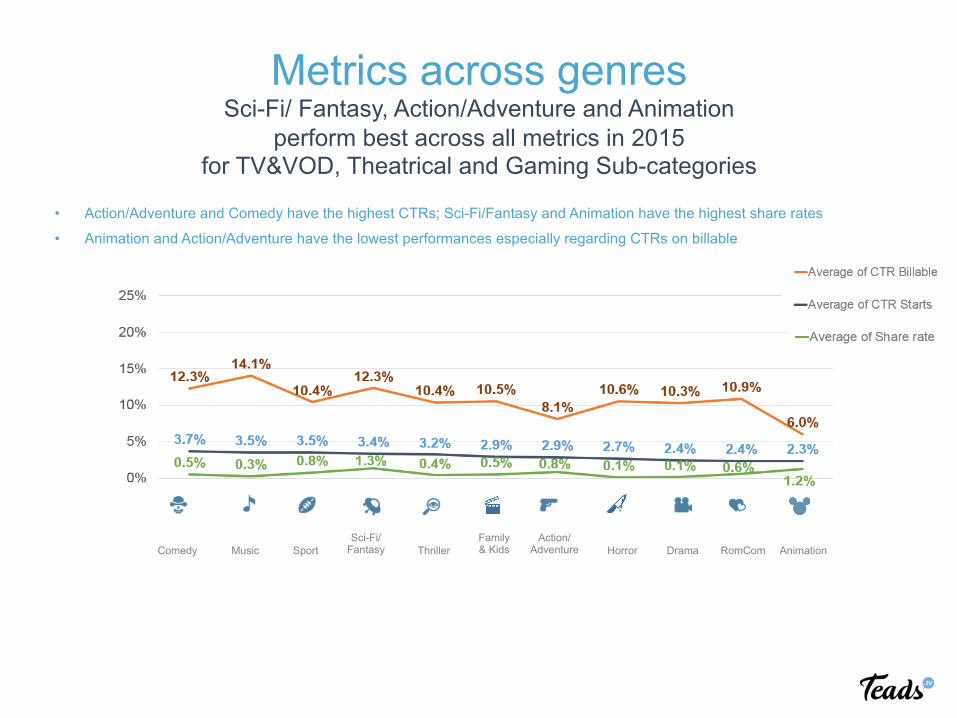
Metrics across genres Sci-Fi/ Fantasy, Action/Adventure and Animation
perform best across all metrics in 2015 for TV&VOD, Theatrical and Gaming Sub-categories
• Action/Adventure and Comedy have the highest CTRs; Sci-Fi/Fantasy and Animation have the highest share rates
• Animation and Action/Adventure have the lowest performances especially regarding CTRs on billable
Action/ Adventure Animation Comedy Drama
Family & Kids Horror Music RomCom
Sci-Fi/ Fantasy Sport Thriller
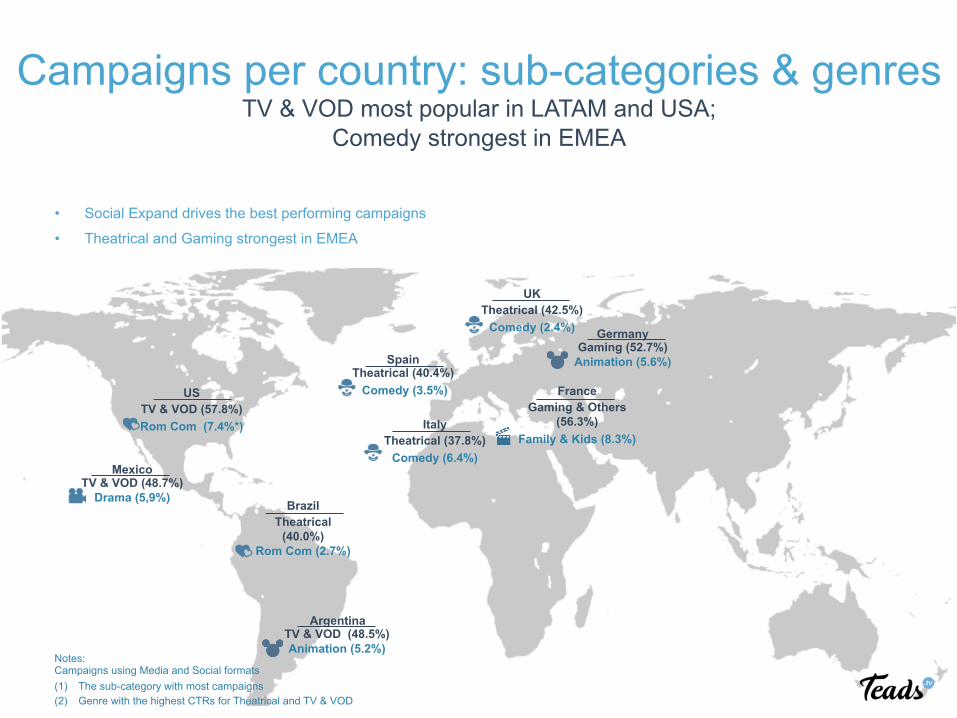
Italy Theatrical (37.8%)
Comedy (6.4%)
Spain Theatrical (40.4%) Comedy (3.5%)
UK Theatrical (42.5%)
Comedy (2.4%)
Brazil Theatrical
(40.0%) Rom Com (2.7%)
US TV & VOD (57.8%) Rom Com (7.4%*)
France Gaming & Others
(56.3%) Family & Kids (8.3%)
Argentina TV & VOD (48.5%) Animation (5.2%)
Mexico TV & VOD (48.7%)
Drama (5,9%)
Germany Gaming (52.7%)
Animation (5.6%)
Notes: Campaigns using Media and Social formats (1) The sub-category with most campaigns (2) Genre with the highest CTRs for Theatrical and TV & VOD
Campaigns per country: sub-categories & genres TV & VOD most popular in LATAM and USA;
Comedy strongest in EMEA
• Social Expand drives the best performing campaigns
• Theatrical and Gaming strongest in EMEA

Please contact : [email protected]