Embed Size (px)
Citation preview
• The SQAD® suite of products represent the Industry Standard in Media Cost Forecasting:
• National TV- Netcosts• Spot TV- Spotcosts• Spot Radio- Spotcosts Radio• Online- Webcosts• Hispanic TV- Spotcosts Hispanic• WRAP- analyzing Nielsen Local TV data
• SQAD® also offers the Industry Standard Media Planning Solution • Mediatools
• SQAD is the industry standard and only supplier of transaction-based media cost databases for – Local broadcast (spot TV and radio)– National TV (network, cable and syndication) – Internet (display and video advertising)
• SQAD has a unique ability to manage large amounts of disparate data, creating advanced analytical models that deliver consistent and reliable media cost estimates (“cost per point”) and meaningful insights to clients
• SQAD has been a long time trusted, neutral third party partner to media buyers (advertising agencies, media buying services, advertisers) and sellers (television and radio stations and rep firms, cable companies, program syndicators and Internet publishers)
Industry Standard Contributor Databases
Methodology in Brief
• SQAD receives actual media cost data from agencies and media buying companies
• Data filtered through to eliminate special programming that inappropriately alters the current and future CPPs (i.e., Thanksgiving Day Parade, Super Bowl, etc.)
• Using this information, plus additional (and weighted) historical data from 16 rolling quarters , SQAD builds estimates for the future
• Using the current quarter’s actual estimates, projections for subsequent quarters are directionally based on movement noted in the current quarter
• With nearly $30 billion of national and spot media cost data for TV, Radio and Hispanic TV, SQAD creates forecasting algorithms, which allow users to budget and plan up to four quarters into the future
Confidentiality
• All data is collected without client name or brand information
• Data is collected and updated regularly from all contributors, data is always current
• No single source data is ever displayed
• Our annual Ernst &Young NetCosts audit collects confidential brand information from all our contributors and then compares that with the category information in Nielsen Monitor plus
• This data is correlated with each brands’ estimated market coverage which certifies SQAD’s total marketplace coverage
Spot TV and Radio- Spotcosts
• Agencies, Media Buying Services use Spotcosts to:– Establish media budgets– Improve negotiations– Monitor and review local spending– Save time through instant access to actual market prices
• Hispanic Market SQAD offers Hispanic Spot TV focused on the 19 Nielsen Hispanic Station Index DMA’s
• Spot cost projections based on actual, confidential purchased advertising transaction data
• Five quarters of data updated on a monthly basis for all 210 NSI local markets and all MSAs
• All Nielsen Local People Meter Markets, all Nielsen diary-based research DMAs
• Average, High, Low costs• TV: 67 demographics, 8 dayparts Radio: 38 demographics, 7 dayparts
National Television- Netcosts
• NetCosts is the largest database of National Cost information for Network, Cable, and Syndicated TV media buying – Contributor database of over $21 billion of actual transactions– Updated weekly– Advertisers representing almost half the national TV marketplace– Instant access to unit costs as well as CPMs and CPPs by program
category, program, network and daypart– Currently a “give to get” model: all NetCosts clients contribute their
confidential advertising transaction data to the NetCosts database
WebCosts Overview
• All CPMs reported are negotiated rates and before the ad is served• Reported display CPMs are primarily site and ad networks sponsorships, or
exchange pricing, at this time • Category classifications are based on the Nielsen Market View Dictionary • WebCosts In-stream video CPMs include: Pre, mid, and post roll, buys. Companion
Ads have zero value• The CPM Display database contains $6 billion of buys and growing• Video database 2013: $700 million• Rolling seven quarters, updated monthly for Display - Video is four quarters • No zero value records are included / No buys under $500• All reported CPMs are aggregated and multi-sourced • CPM data comes from subscribing agencies / marketers• Access to WebCosts is based on subscription • Cost per Click going live
SQAD’s Products, Actionable Market Intelligence
• Spot TV• The industry standard in benchmarking Local TV, collecting billions of dollars of
Local Buys to provide transparent CPP and CPM information• Projections across 5 quarters for all DMAs, 67 demos across 8 dayparts• Low, Average, High costs provided
• Spot Radio • Projections across 5 quarters for 276 Audio MSAs• Monthly updates on 38 demos across 7 dayparts
• Hispanic Spot TV Plus• Reporting across four quarters for 19 DMAs • Monthly updates on 9 demos across 6 dayparts
SQAD’s Products, Actionable Market Intelligence
• NetCosts• The only source of real unit costs, CPP/CPMs for Broadcast, Cable and National
TV Program data• Actual negotiated rates, Upfront and Scatter, information updated Weekly• NetCosts represents 47% of all national TV spending. $21 billion annually• 339 marketers, 2,229 brands, 38 agencies sending data, 27 direct advertisers
subscribe
• WebCosts • The only real cost and CPM database for Internet Display and In-Stream Video• Reduces proposal/budget time by providing negotiated CPMs for Websites/Ad
Networks• Provides a value baseline for discussion in the negotiation and post buy process
SQAD’s Trends and Observations
One of my favorite philosophers, I guess you could call him, was the great Yogi Berra, the remarkable Yankees catcher. He said, “If you don't know where you’re going, you might wind up someplace else.”
SQAD’s Trends and ObservationsNational Television
•The National Upfront is a futures markets and until there is more supply than demand we will have an upfront market
•The National marketplace will be around as long as ad inventory is scare and at a premium
•Television upfront markets will be robust into 2016
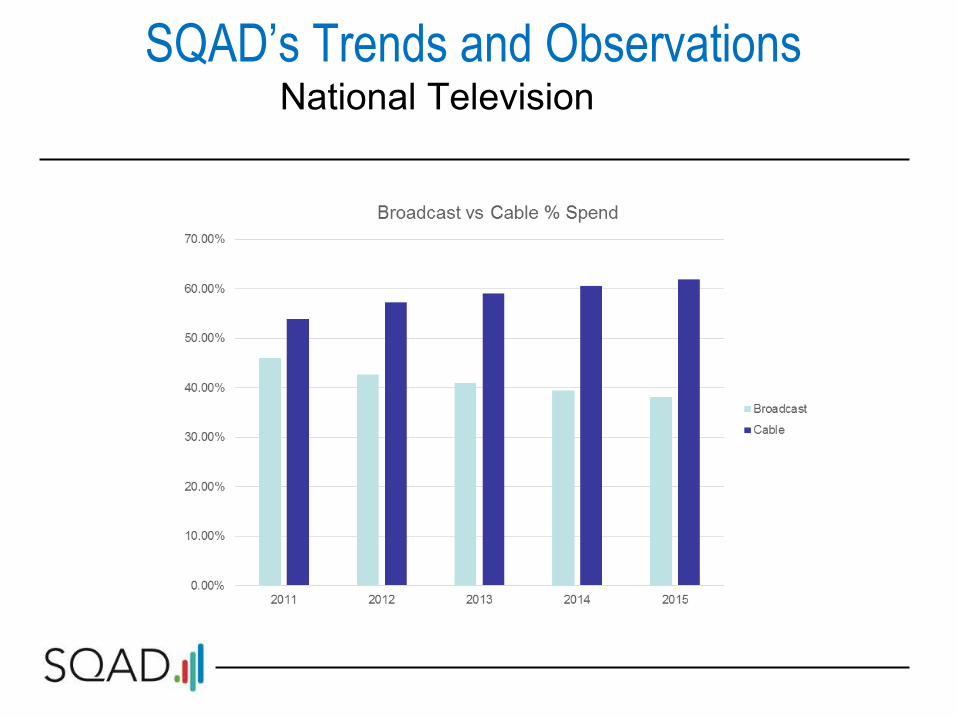
SQAD’s Trends and Observations National Television
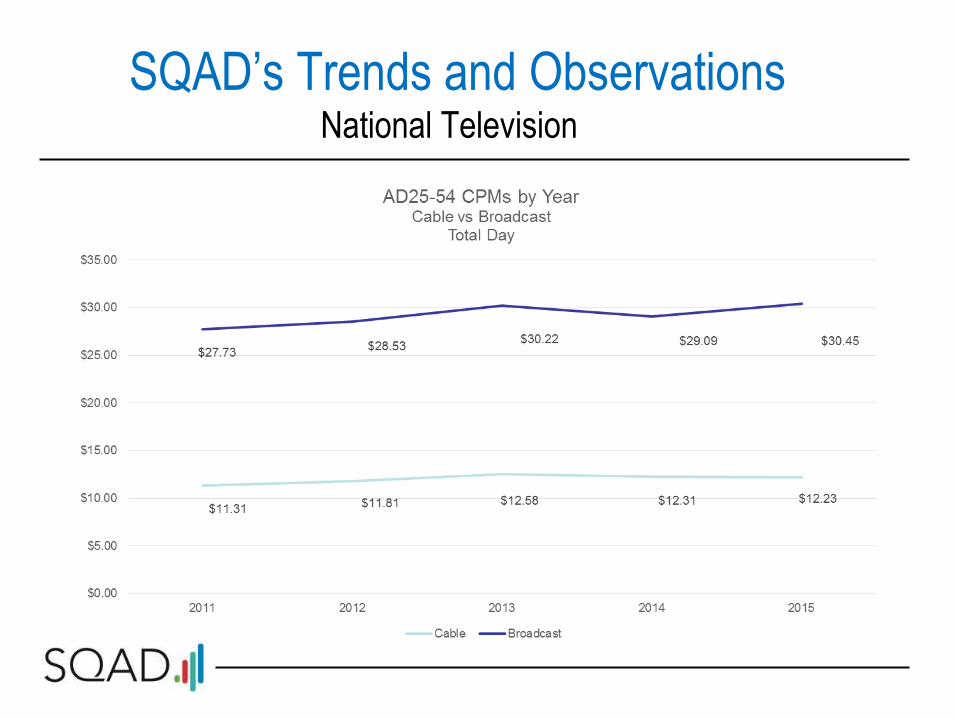
SQAD’s Trends and ObservationsNational Television
SQAD’s Trends and ObservationsLocal Marketplace
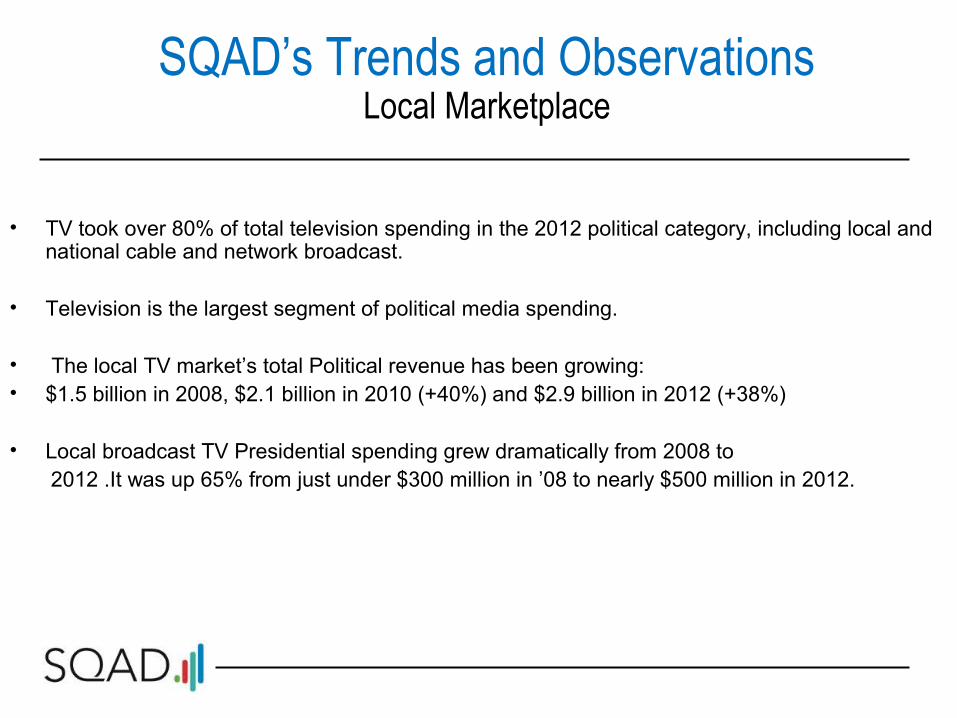
• TV took over 80% of total television spending in the 2012 political category, including local and national cable and network broadcast.
• Television is the largest segment of political media spending.
• The local TV market’s total Political revenue has been growing:• $1.5 billion in 2008, $2.1 billion in 2010 (+40%) and $2.9 billion in 2012 (+38%)
• Local broadcast TV Presidential spending grew dramatically from 2008 to 2012 .It was up 65% from just under $300 million in ’08 to nearly $500 million in 2012.
SQAD’s Trends and ObservationsLocal Marketplace
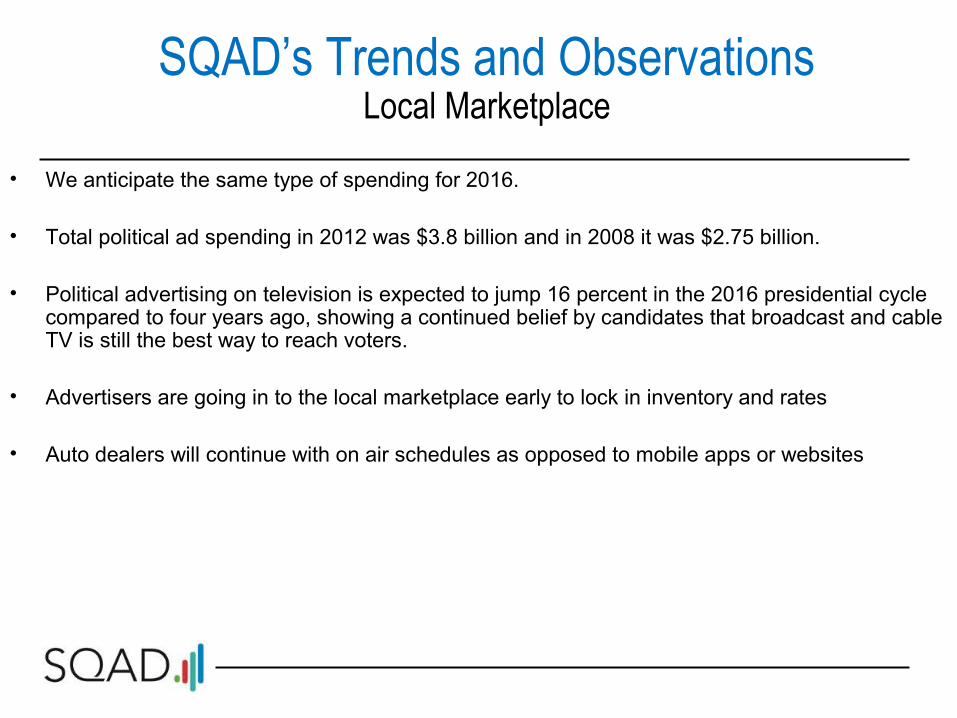
• We anticipate the same type of spending for 2016.
• Total political ad spending in 2012 was $3.8 billion and in 2008 it was $2.75 billion.
• Political advertising on television is expected to jump 16 percent in the 2016 presidential cycle compared to four years ago, showing a continued belief by candidates that broadcast and cable TV is still the best way to reach voters.
• Advertisers are going in to the local marketplace early to lock in inventory and rates
• Auto dealers will continue with on air schedules as opposed to mobile apps or websites
SQAD’s Trends and ObservationsLocal Marketplace
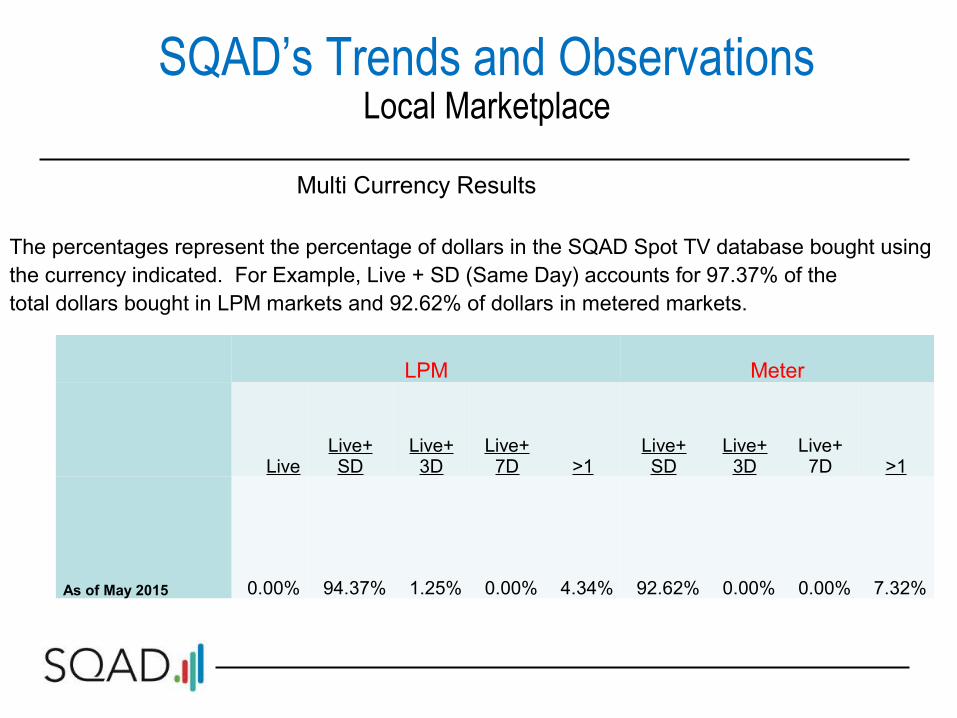
Multi Currency Results
The percentages represent the percentage of dollars in the SQAD Spot TV database bought using the currency indicated. For Example, Live + SD (Same Day) accounts for 97.37% of the total dollars bought in LPM markets and 92.62% of dollars in metered markets.
LPM Meter
LiveLive+ SD
Live+ 3D
Live+ 7D >1
Live+ SD
Live+ 3D
Live+ 7D >1
As of May 2015 0.00% 94.37% 1.25% 0.00% 4.34% 92.62% 0.00% 0.00% 7.32%
SQAD’s Trends and ObservationsLocal Marketplace
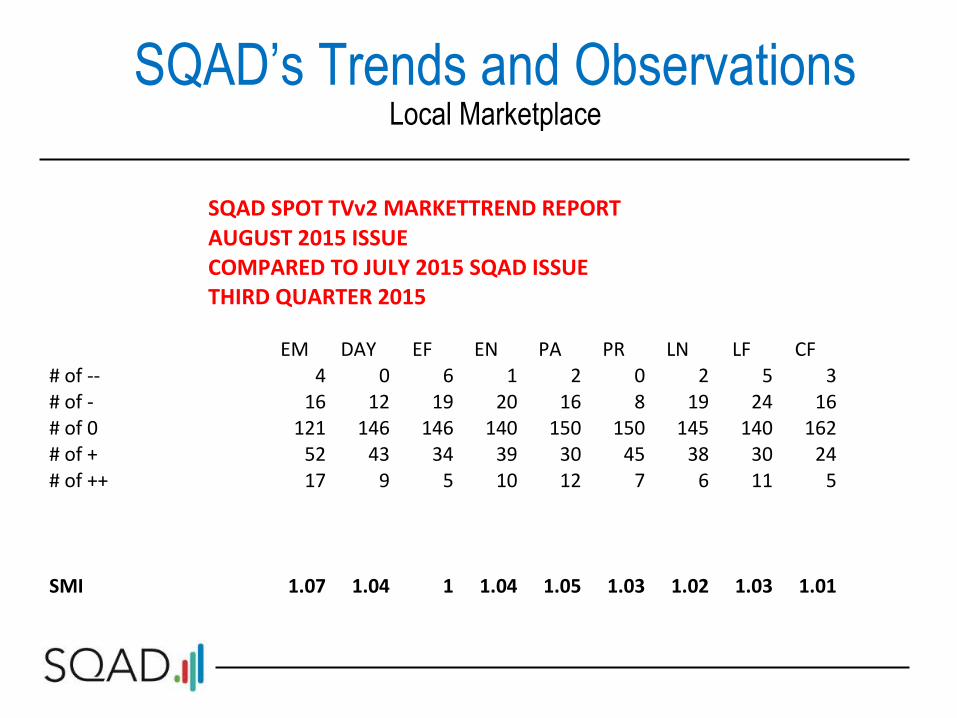
EM DAY EF EN PA PR LN LF CF# of -- 4 0 6 1 2 0 2 5 3# of - 16 12 19 20 16 8 19 24 16# of 0 121 146 146 140 150 150 145 140 162# of + 52 43 34 39 30 45 38 30 24# of ++ 17 9 5 10 12 7 6 11 5
SMI 1.07 1.04 1 1.04 1.05 1.03 1.02 1.03 1.01
SQAD SPOT TVv2 MARKETTREND REPORTAUGUST 2015 ISSUECOMPARED TO JULY 2015 SQAD ISSUETHIRD QUARTER 2015
SQAD’s Trends and Observations
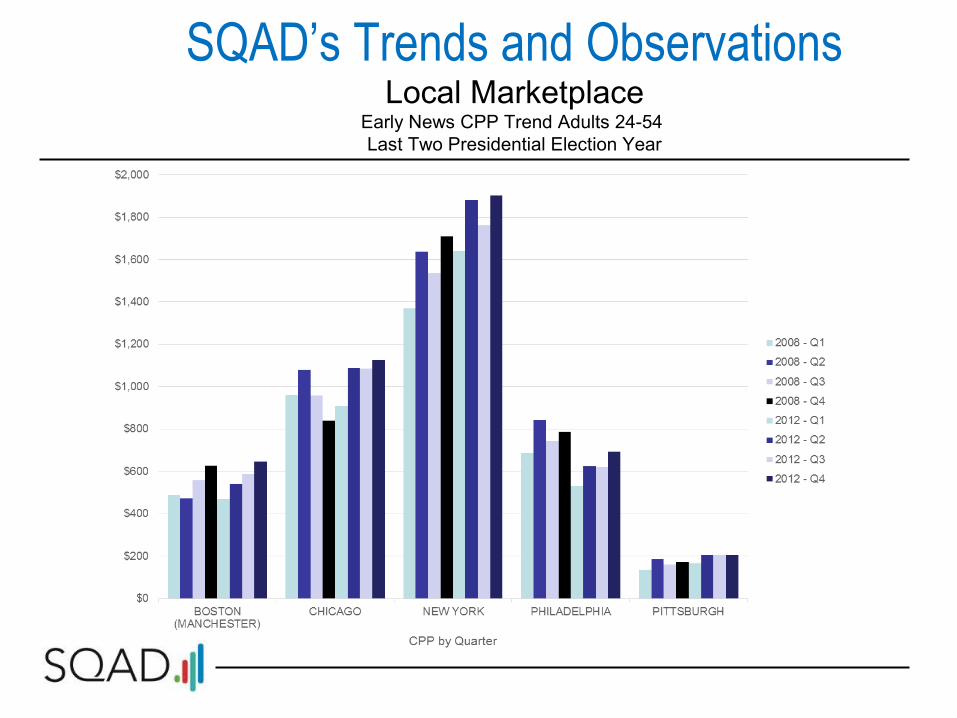
Local MarketplaceEarly News CPP Trend Adults 24-54 Last Two Presidential Election Year
SQAD’s Trends and Observations
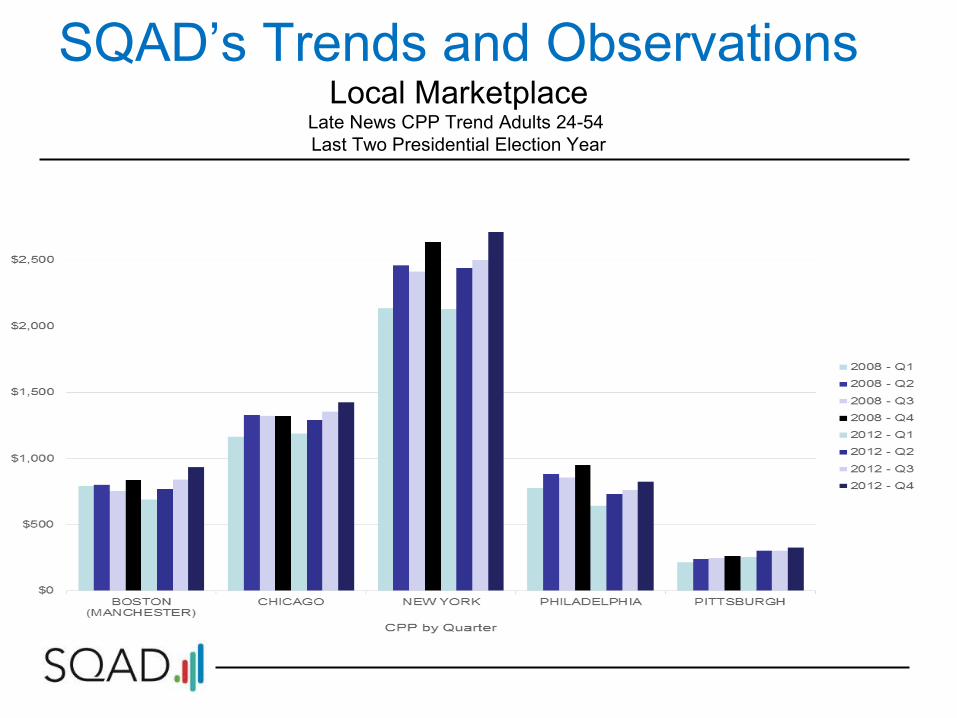
Local MarketplaceLate News CPP Trend Adults 24-54 Last Two Presidential Election Year
SQAD’s Trends and Observations
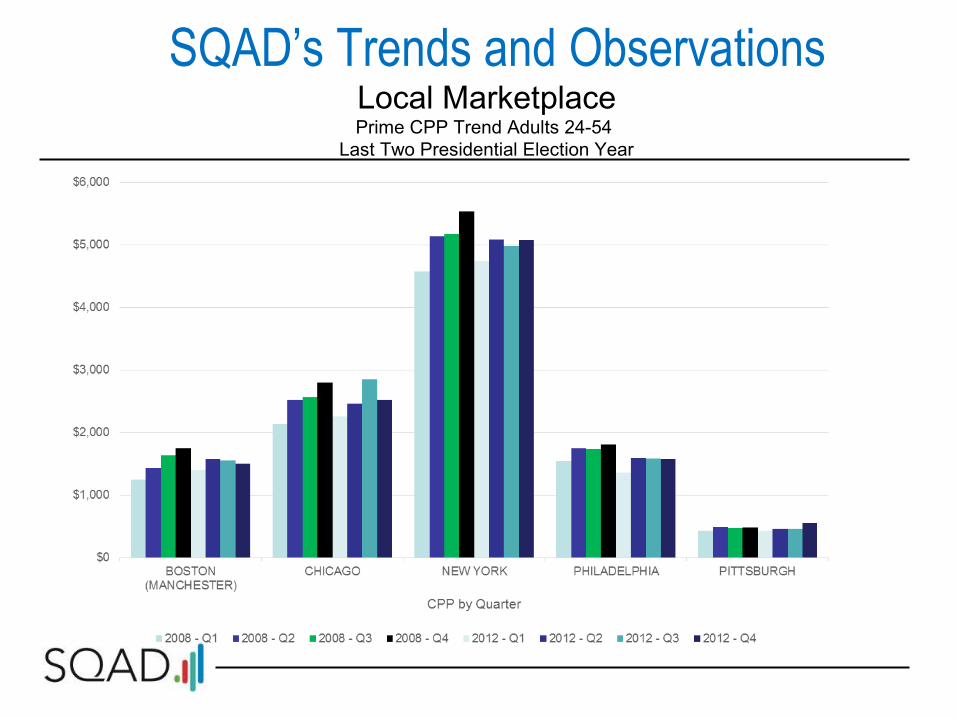
Local MarketplacePrime CPP Trend Adults 24-54
Last Two Presidential Election Year
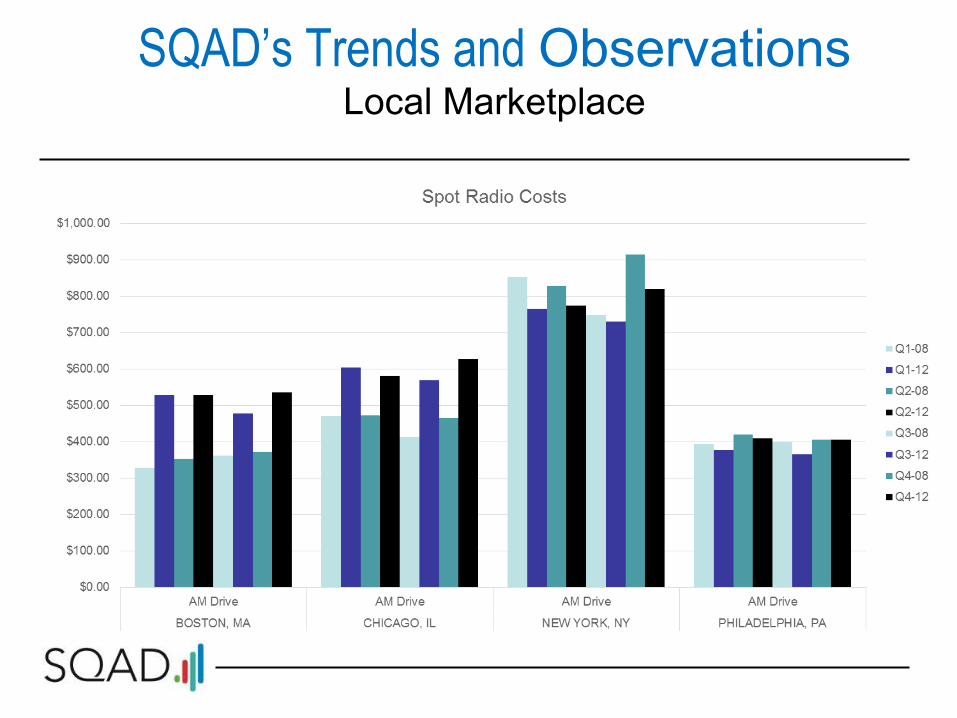
SQAD’s Trends and ObservationsLocal Marketplace
SQAD’s Trends and ObservationsDigital
• Digital advertising is about 10-15% of station’s revenues. Not likely to change in 2016.
• Digital audience measurements are not people but algorithms
• The amount of video watched on Facebook is astronomical
• Digital advertising is a challenge to TV and Radio industry:• 50% of TV revenues come from advertising• 100% of digital revenues come from advertising
SQAD’s Trends and ObservationsDigital
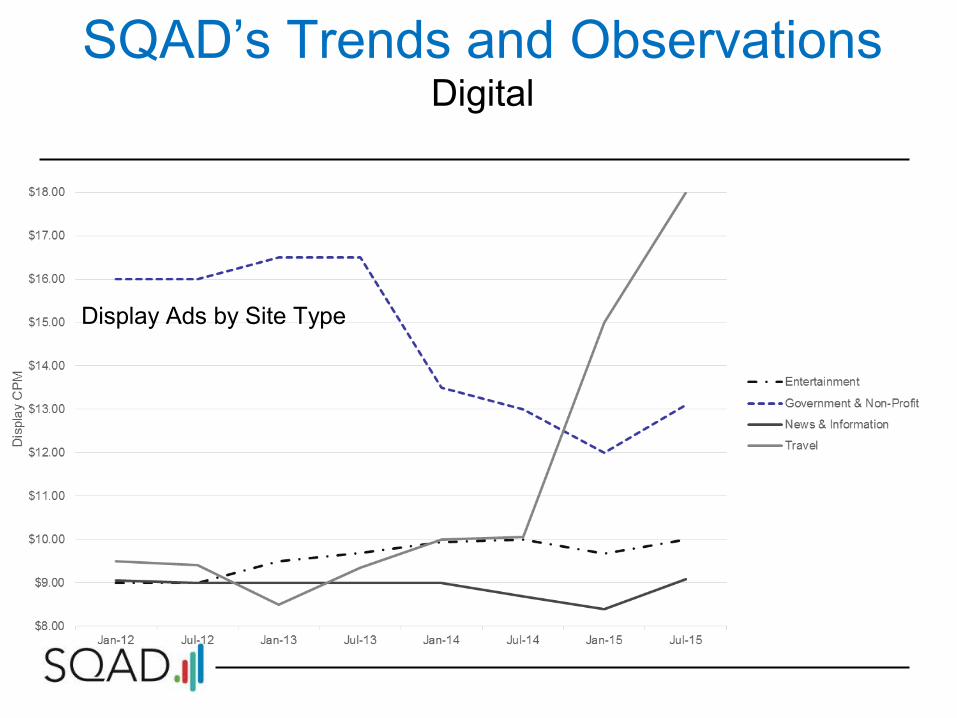
Display Ads by Site Type
SQAD’s Trends and ObservationsDigital
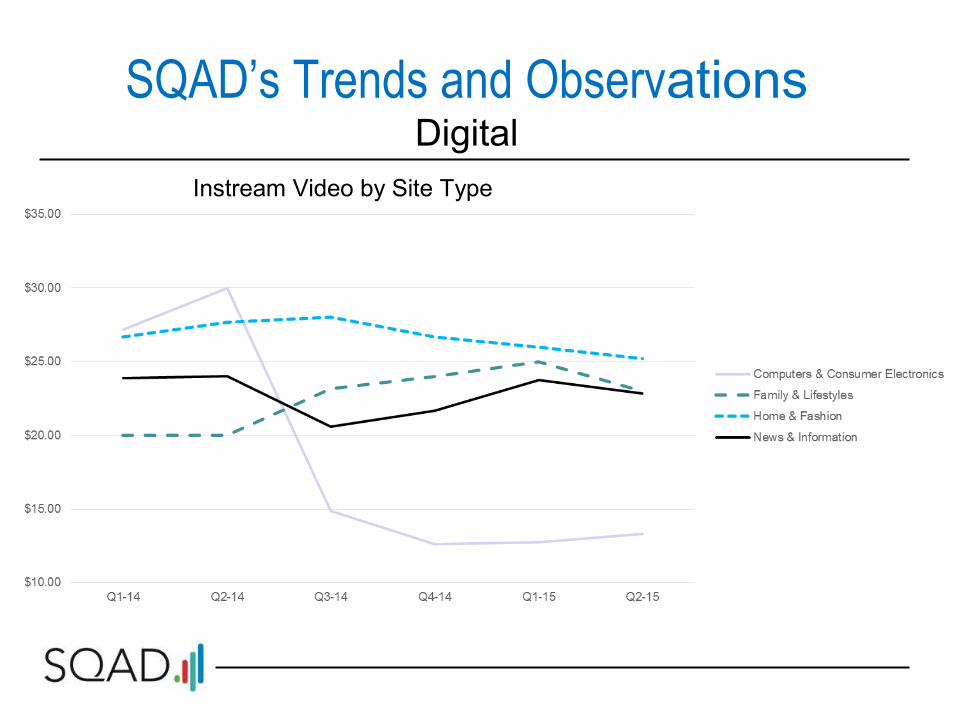
Instream Video by Site Type
SQAD’s Trends and ObservationsDigital
SQAD’s Trends and Observations
• The value of traditional media ,even with big losses in print and music grew dramatically in 2014.
• An Ernst and Young study found that traditional media and entertainment companies increased their lead as one of the most profitable industries with television margins as high as almost 50 percent.
• Television with its more limited audiences has become upscale media with its active selection and choice and digital with its mass reach and reflexive action has become the downscale side.
• Television is a measured choice and digital a passive choice with viewers shuttling between media prompts and headlines.
SQAD’s Trends and Observations
“If one thinks of the great business leaders and innovators, it is obvious that their strength is their ability to use research not as a crutch but as a starting point to provide lots of options. Collected facts are actionable. They tell you to apply the hammer to the nail and where the nail is.SQAD data is collected facts. It is the only source that is a large enough sample and is untouched by vested interests that allow stations/advertisers/agencies/ to do due diligence on their media costs.”
Jon Mandel, Chairman and CEO of PrecisionDemand