Embed Size (px)
Citation preview

#SMX @PlaceIQ
How Understanding Visitation Trends Can Power Marketing
Share of Visit:Focus on the
Customer Journey

#SMX @PlaceIQ
How Understanding Visitation Trends Can Power Marketing
Share of Visit:Focus on the
Customer Journey
Drew BreunigPlaceIQ

#SMX @PlaceIQ
Location helps you understand a moment.MOVEMENT helps you understand a life.

Building Audiences with Movement Data
Heads Home
Lifestyle: Gym Visitor
Lifestyle: Health Conscious
Commute Path: Commuter
Job: Finance
Shopping: Fashionista Dining: QSR Restaurant
Lifestyle: Bar Goer
Auto Ownership
CRM Segments
Demographic: Hispanic
Household Income: $100k+
Grabs Dinner & DrinksGoes ShoppingDrives to WorkWorks Out

Lifestyle: Gym Visitor
Lifestyle: Health Conscious
Commute Path: Commuter
Job: Finance
Shopping: Fashionista Dining: QSR Restaurant
Lifestyle: Bar Goer
Auto Ownership
CRM Segments
Building Audiences with Movement Data
Demographic: Hispanic
Household Income: $100k+
Demographic: HispanicCommute Path: Commuter
Fashionable Hispanic MillennialDemographic: Hispanic
Commute Path: Commuter
Shopping: Fashionista
Shopping: Fashionista

#SMX @PlaceIQ
Data Ingestion
Foreground Data
Background Data

#SMX @PlaceIQ
• Investigative snapshot of foot-traffic across a segment
• Assess overall traffic, store efficiency, and market health
• Prioritize competitors, market to market
Share of Visit Analysis

#SMX @PlaceIQ
Share of VisitDining Case Study
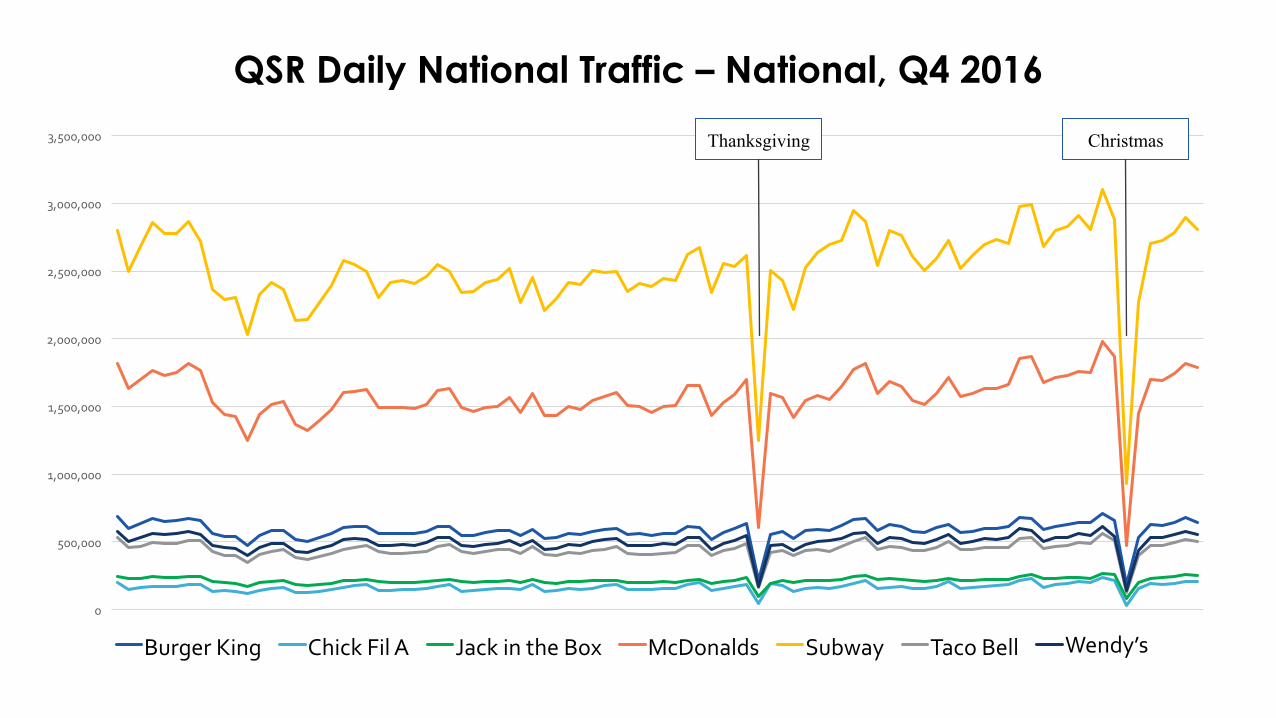
QSR Daily National Traffic – National, Q4 2016
0
500,000
1,000,000
1,500,000
2,000,000
2,500,000
3,000,000
3,500,000
Burger King Chick Fil A Jack in the Box McDonalds Subway Taco Bell Wendy’s
ChristmasThanksgiving

0%
10%
20%
30%
40%
50%
60%
70%
80%
90%
100%
Burger King Chick Fil A Jack in the Box McDonalds Subway Taco Bell Wendy’s
QSR Daily Share of Visit – National, Q4 2016

0
20
40
60
80
100
120
1 2 3 4 5 6 7 8 9 10 11 12 13 14 15 16 17 18 19 20 21 22 23 24 25 26 27 28 29 30 31 32 33 34 35 36 37 38 39 40 41 42 43 44 45 46 47 48 49 50 51 52 53 54 55 56 57 58 59 60 61 62 63 64 65 66 67 68 69 70 71 72 73 74 75 76 77 78 79 80 81 82 83 84 85 86 87 88 89 90 91 92 93
Burger King Chick Fil A Jack in the Box McDonalds Subway Taco Bell Wendy's
QSR Visitors Per Store, Per Week – National, Q4 2016

-
20.00
40.00
60.00
80.00
100.00
120.00
1 3 5 7 9 11 13 15 17 19 21 23 25 27 29 31 33 35 37 39 41 43 45 47 49 51 53 55 57 59 61 63 65 67 69 71 73 75 77 79 81 83 85 87 89 91 93
Burger King Chick Fil A Jack in the Box McDonalds Subway Taco Bell Wendy's Linear (Chick Fil A)
QSR Visitors Per Store, Per Week – National, Q4 2016
3% m/m gain
15% m/m gain

-
1,000
2,000
3,000
4,000
5,000
6,000
7,000
8,000
-
100,000
200,000
300,000
400,000
500,000
600,000
700,000
Vis
its P
er S
tore
(Dot
)
Vis
its (B
ar)
CFA Visitors QSR Visitors Per Location CFA Visitors Per Location
Chick Fil A Market Health Focus – Q4 2016

-
1,000
2,000
3,000
4,000
5,000
6,000
7,000
8,000
-
100,000
200,000
300,000
400,000
500,000
600,000
700,000
Vis
its P
er S
tore
(Dot
)
Vis
its (B
ar)
CFA Visitors QSR Visitors Per Location CFA Visitors Per Location
Chick Fil A Market Health Focus – Q4 201674%
53%
14%
56%
70%
0% 10% 20% 30% 40% 50% 60% 70% 80% 90% 100%
Atlanta, GA
Dallas, TX
Houston, TX
Charlotte, NC
Los Angeles, CA
Orlando, FL
Washington DC
Raleigh, NC
Tampa, FL
Philadelphia, PA
Baltimore, MD
Norfolk, VA
Greenville, SC
Phoenix, AZ
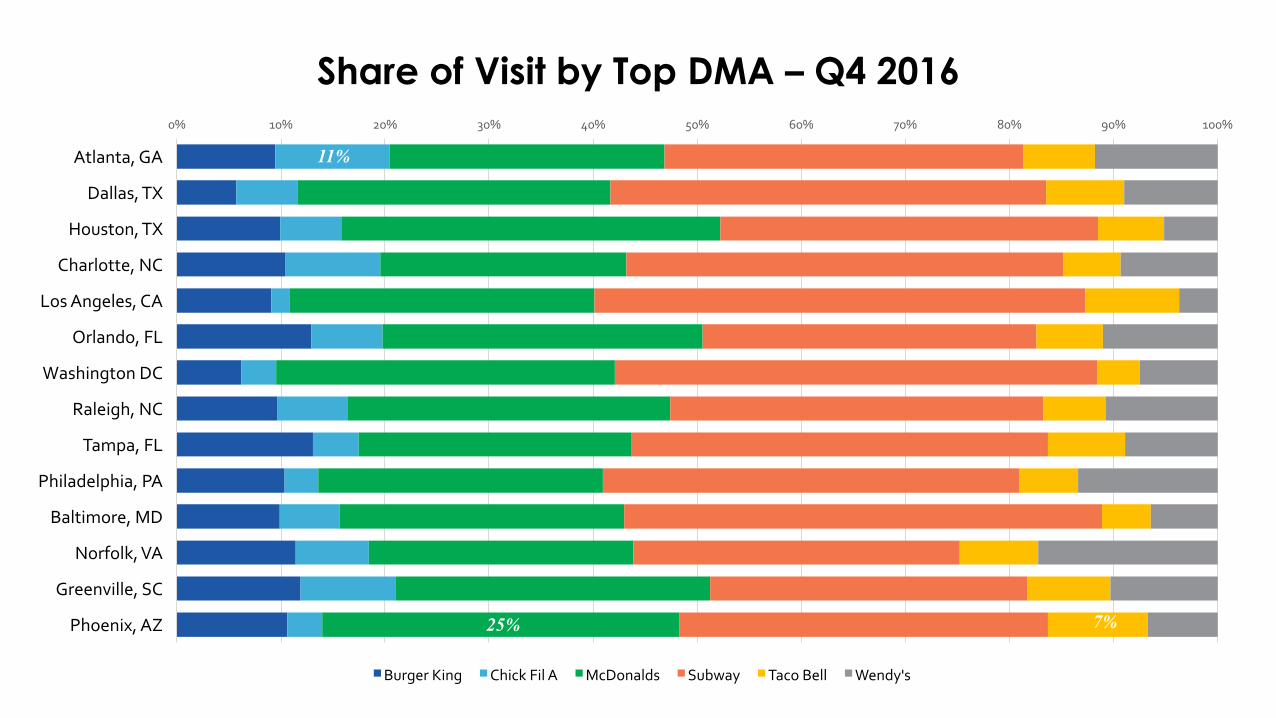
Burger King Chick Fil A McDonalds Subway Taco Bell Wendy's
Share of Visit by Top DMA – Q4 2016
11%
7%25%

Charlotte Activity – Q4 2016
QSR Locations by Foot Traffic, Q4 Chick Fil A Locations by Foot Traffic, Q4

#SMX @PlaceIQ
• Media: Build audiences specific to DMAs for more efficient media activation
• Measure: Track overall success in a market by store efficiency and share of market
• Analyze: Analyze the audience behaviors in under and over performing markets to diagnose trends
• Analyze: Determining new store locations and opportunity for growth
Applications
#SMX @PlaceIQ
LEARN MORE: UPCOMING @SMX EVENTS
THANK YOU! SEE YOU AT THE NEXT #SMX