Embed Size (px)
Citation preview
www.operamediaworks.comwww.operamediaworks.com [email protected]
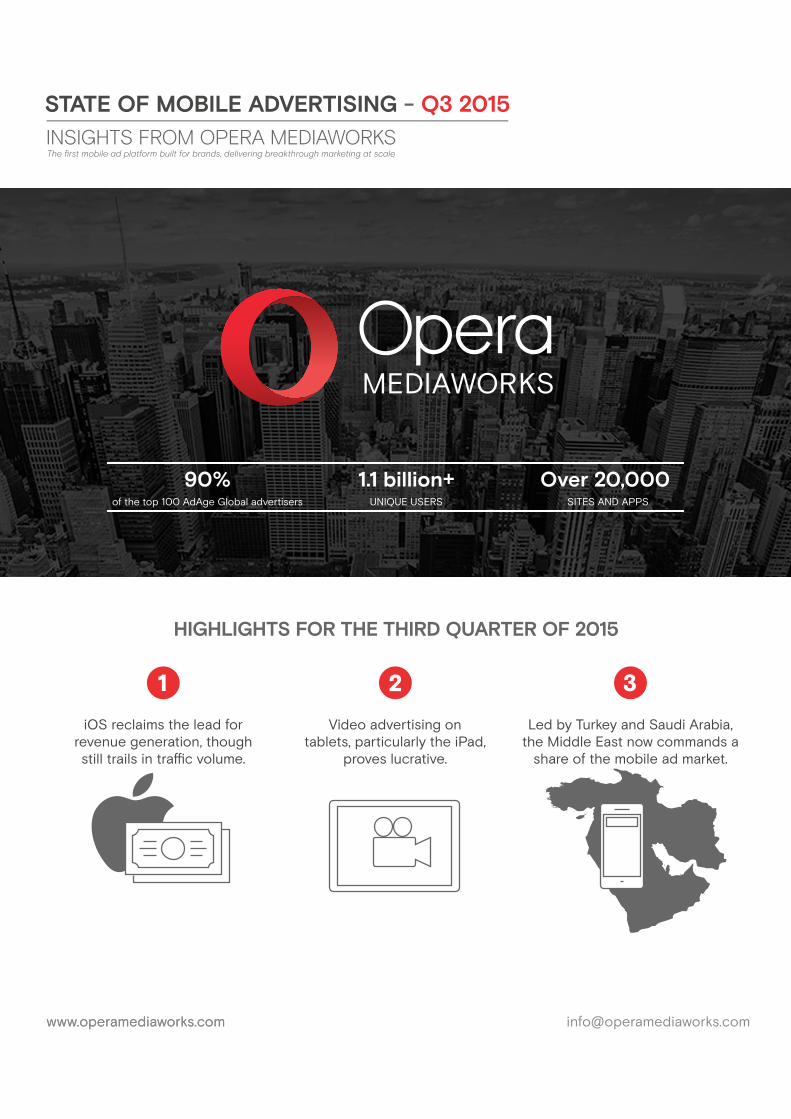
Over 20,000 SITES AND APPS
1.1 billion+UNIQUE USERS
90%of the top 100 AdAge Global advertisers
HIGHLIGHTS FOR THE THIRD QUARTER OF 2015
iOS reclaims the lead forrevenue generation, thoughstill trails in traffic volume.
Video advertising ontablets, particularly the iPad,
proves lucrative.
Led by Turkey and Saudi Arabia,the Middle East now commands a
share of the mobile ad market.
INSIGHTS FROM OPERA MEDIAWORKSThe first mobile ad platform built for brands, delivering breakthrough marketing at scale
p.2
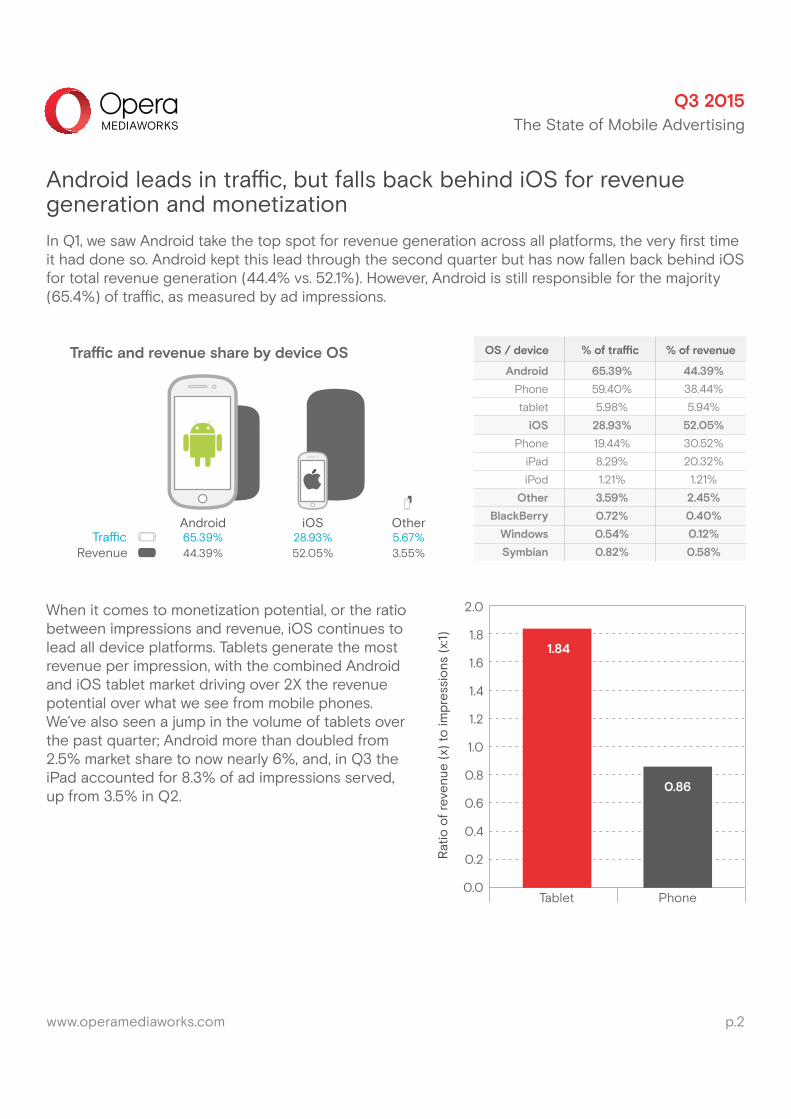
Android leads in traffic, but falls back behind iOS for revenue generation and monetizationIn Q1, we saw Android take the top spot for revenue generation across all platforms, the very first time it had done so. Android kept this lead through the second quarter but has now fallen back behind iOS for total revenue generation (44.4% vs. 52.1%). However, Android is still responsible for the majority (65.4%) of traffic, as measured by ad impressions.
When it comes to monetization potential, or the ratio between impressions and revenue, iOS continues to lead all device platforms. Tablets generate the most revenue per impression, with the combined Android and iOS tablet market driving over 2X the revenue potential over what we see from mobile phones. We’ve also seen a jump in the volume of tablets over the past quarter; Android more than doubled from 2.5% market share to now nearly 6%, and, in Q3 the iPad accounted for 8.3% of ad impressions served, up from 3.5% in Q2.
www.operamediaworks.com
Traffic and revenue share by device OS
Android65.39%
Other5.67%
iOS28.93%
44.39%Traffic
Revenue 3.55%52.05%
OS / device % of traffic % of revenue
44.39%
38.44%
5.94%
52.05%
30.52%
20.32%
1.21%
2.45%
0.40%
0.12%
Android
Phone
tablet
iOS
Phone
iPad
iPod
Other
BlackBerry
Windows
Symbian
65.39%
59.40%
5.98%
28.93%
19.44%
8.29%
1.21%
3.59%
0.72%
0.54%
0.82% 0.58%
2.0
1.8
1.6
1.4
1.2
1.0
0.8
0.6
0.4
0.2
0.0
Rat
io o
f rev
enue
(x)
to im
pre
ssio
ns (
x:1)
Tablet Phone
1.84
0.86
Q3 2015The State of Mobile Advertising
www.operamediaworks.com p.3
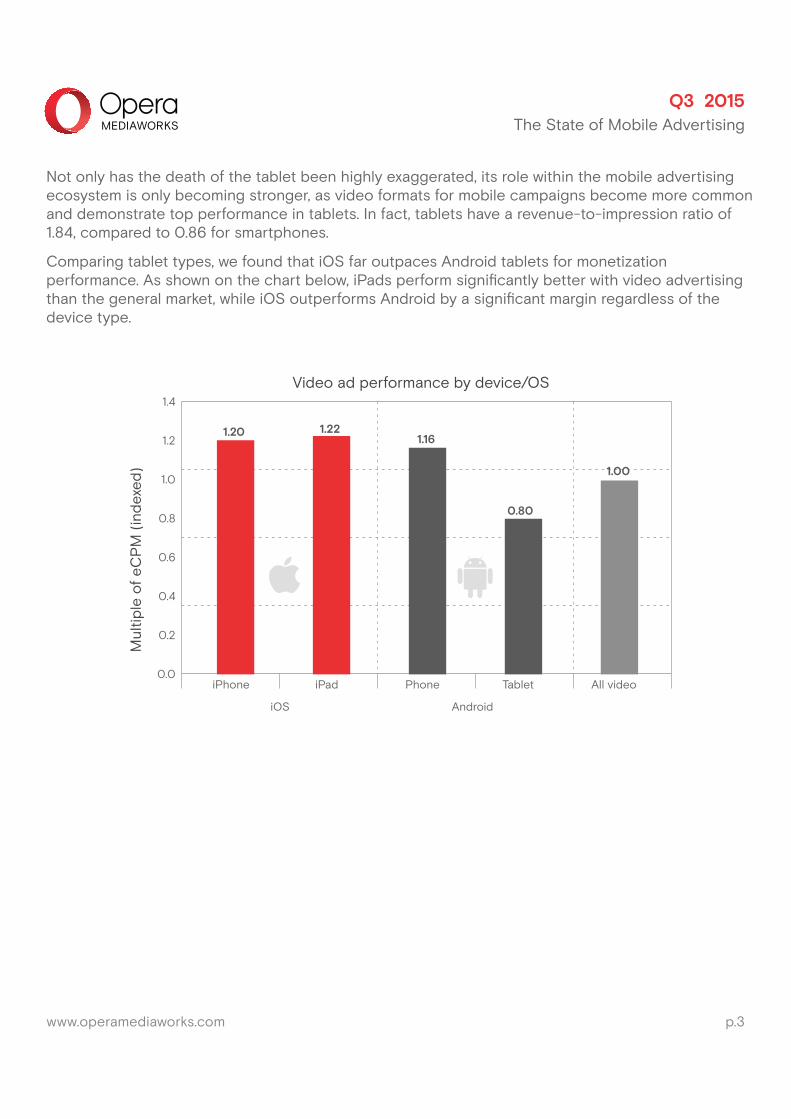
Not only has the death of the tablet been highly exaggerated, its role within the mobile advertising ecosystem is only becoming stronger, as video formats for mobile campaigns become more common and demonstrate top performance in tablets. In fact, tablets have a revenue-to-impression ratio of 1.84, compared to 0.86 for smartphones.
Comparing tablet types, we found that iOS far outpaces Android tablets for monetization performance. As shown on the chart below, iPads perform significantly better with video advertising than the general market, while iOS outperforms Android by a significant margin regardless of the device type.
Video ad performance by device/OS1.4
1.2
1.0
0.8
0.6
0.4
0.2
0.0iPhone
AndroidiOS
iPad TabletPhone All video
1.20
1.00
1.221.16
0.80
Mul
tiple
of e
CP
M (
inde
xed)
Q3 2015The State of Mobile Advertising
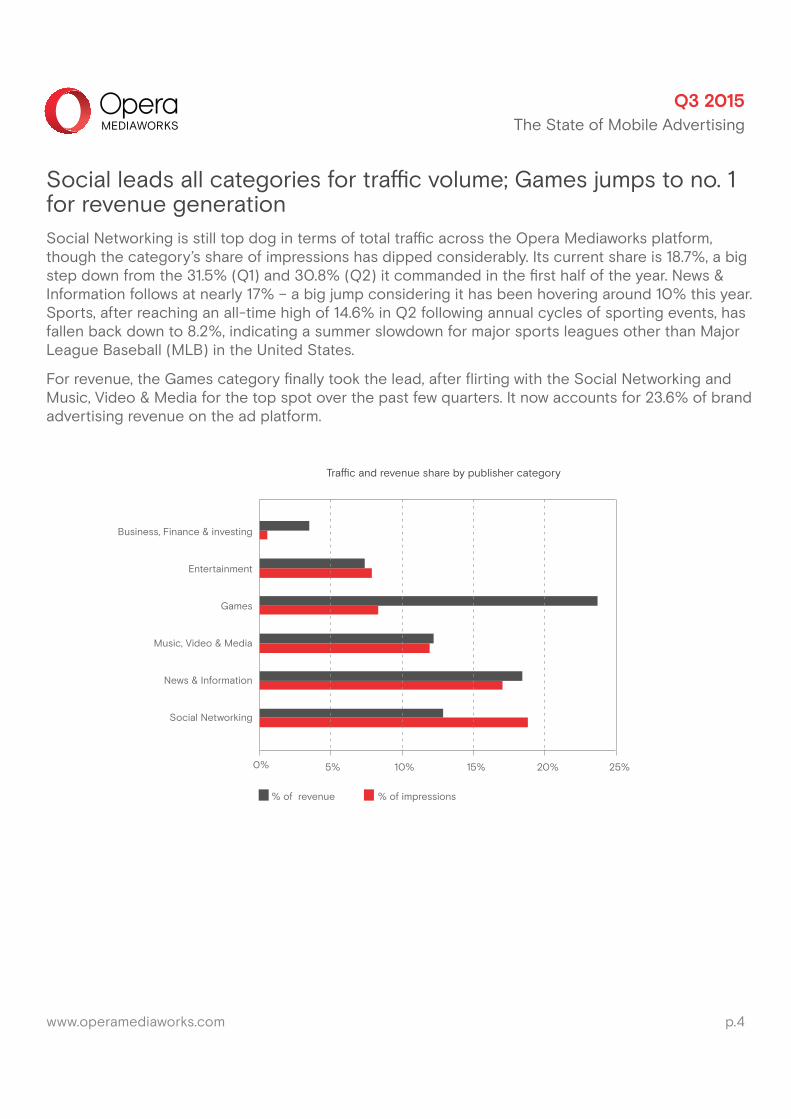
Social leads all categories for traffic volume; Games jumps to no. 1 for revenue generationSocial Networking is still top dog in terms of total traffic across the Opera Mediaworks platform, though the category’s share of impressions has dipped considerably. Its current share is 18.7%, a big step down from the 31.5% (Q1) and 30.8% (Q2) it commanded in the first half of the year. News & Information follows at nearly 17% – a big jump considering it has been hovering around 10% this year. Sports, after reaching an all-time high of 14.6% in Q2 following annual cycles of sporting events, has fallen back down to 8.2%, indicating a summer slowdown for major sports leagues other than Major League Baseball (MLB) in the United States.
For revenue, the Games category finally took the lead, after flirting with the Social Networking and Music, Video & Media for the top spot over the past few quarters. It now accounts for 23.6% of brand advertising revenue on the ad platform.
www.operamediaworks.com p.4
Social Networking
News & Information
Music, Video & Media
Games
Entertainment
Business, Finance & investing
Traffic and revenue share by publisher category
10%5%0% 20%15% 25%
% of impressions% of revenue
Q3 2015The State of Mobile Advertising
www.operamediaworks.com p.5
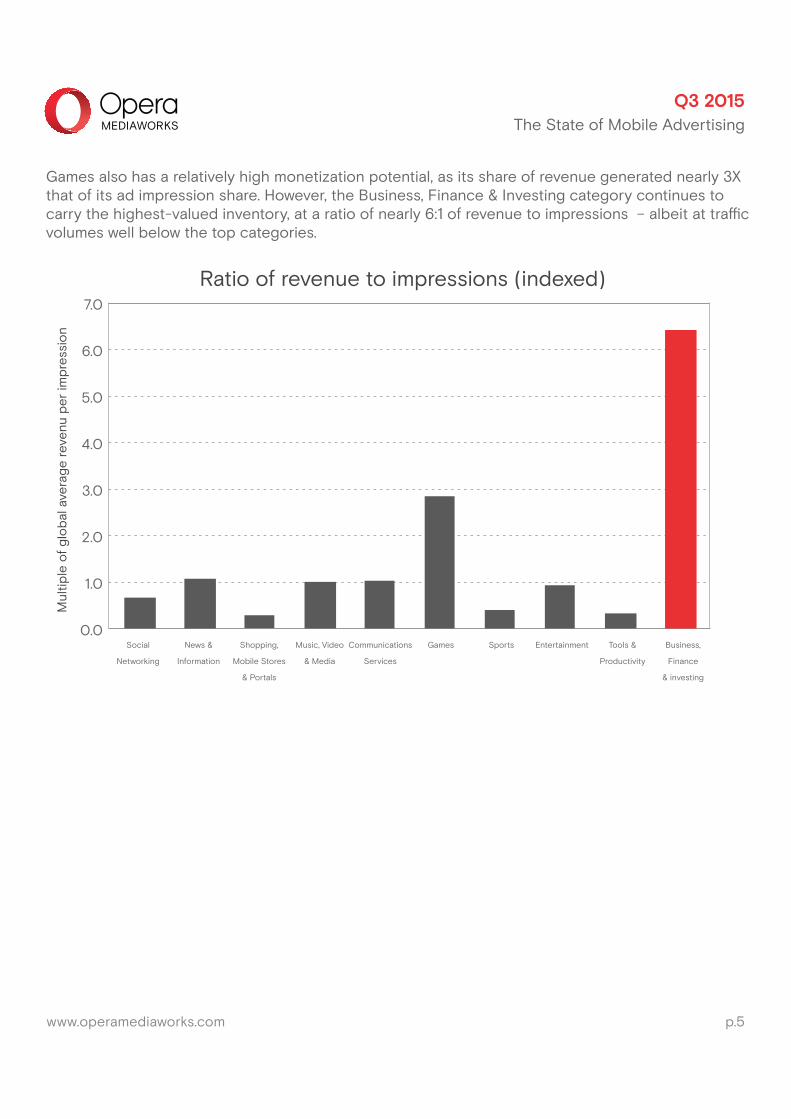
Games also has a relatively high monetization potential, as its share of revenue generated nearly 3X that of its ad impression share. However, the Business, Finance & Investing category continues to carry the highest-valued inventory, at a ratio of nearly 6:1 of revenue to impressions – albeit at traffic volumes well below the top categories.
7.0
6.0
5.0
4.0
3.0
2.0
1.0
0.0
Ratio of revenue to impressions (indexed)
Mul
tiple
of g
loba
l ave
rage
reve
nu p
er im
pre
ssio
n
Social
Networking
News &
Information
Shopping,
Mobile Stores
& Portals
Music, Video
& Media
Communications
Services
Games Sports Entertainment Tools &
Productivity
Business,
Finance
& investing
Q3 2015The State of Mobile Advertising
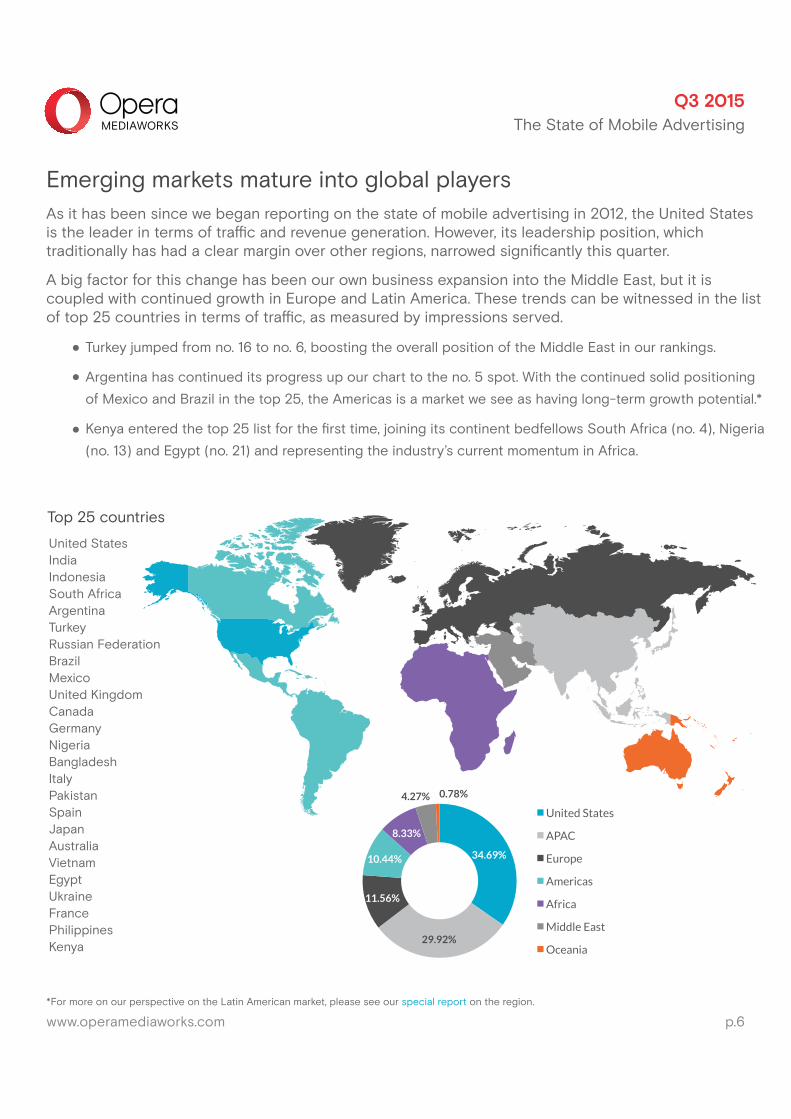
Emerging markets mature into global players As it has been since we began reporting on the state of mobile advertising in 2012, the United States is the leader in terms of traffic and revenue generation. However, its leadership position, which traditionally has had a clear margin over other regions, narrowed significantly this quarter.
A big factor for this change has been our own business expansion into the Middle East, but it is coupled with continued growth in Europe and Latin America. These trends can be witnessed in the list of top 25 countries in terms of traffic, as measured by impressions served.
Turkey jumped from no. 16 to no. 6, boosting the overall position of the Middle East in our rankings.
Argentina has continued its progress up our chart to the no. 5 spot. With the continued solid positioning
of Mexico and Brazil in the top 25, the Americas is a market we see as having long-term growth potential.*
Kenya entered the top 25 list for the first time, joining its continent bedfellows South Africa (no. 4), Nigeria
(no. 13) and Egypt (no. 21) and representing the industry’s current momentum in Africa.
Top 25 countries
United StatesIndiaIndonesiaSouth AfricaArgentinaTurkeyRussian FederationBrazilMexicoUnited KingdomCanadaGermanyNigeriaBangladeshItalyPakistanSpainJapanAustraliaVietnamEgyptUkraineFrancePhilippinesKenya
*For more on our perspective on the Latin American market, please see our special report on the region.
34.69%
29.92%
11.56%
10.44%
8.33%
4.27% 0.78%
United States
APAC
Europe
Americas
Africa
Middle East
Oceania
www.operamediaworks.com p.6
Q3 2015The State of Mobile Advertising
Rat
io x
:1 (1
:1 =
glob
al a
vera
ge)
0.0
0.5
1.0
1.5
2.0
2.5
Americas Middle East United States Global
0.700.75
1.92
1.00
Video advertising ratios by region
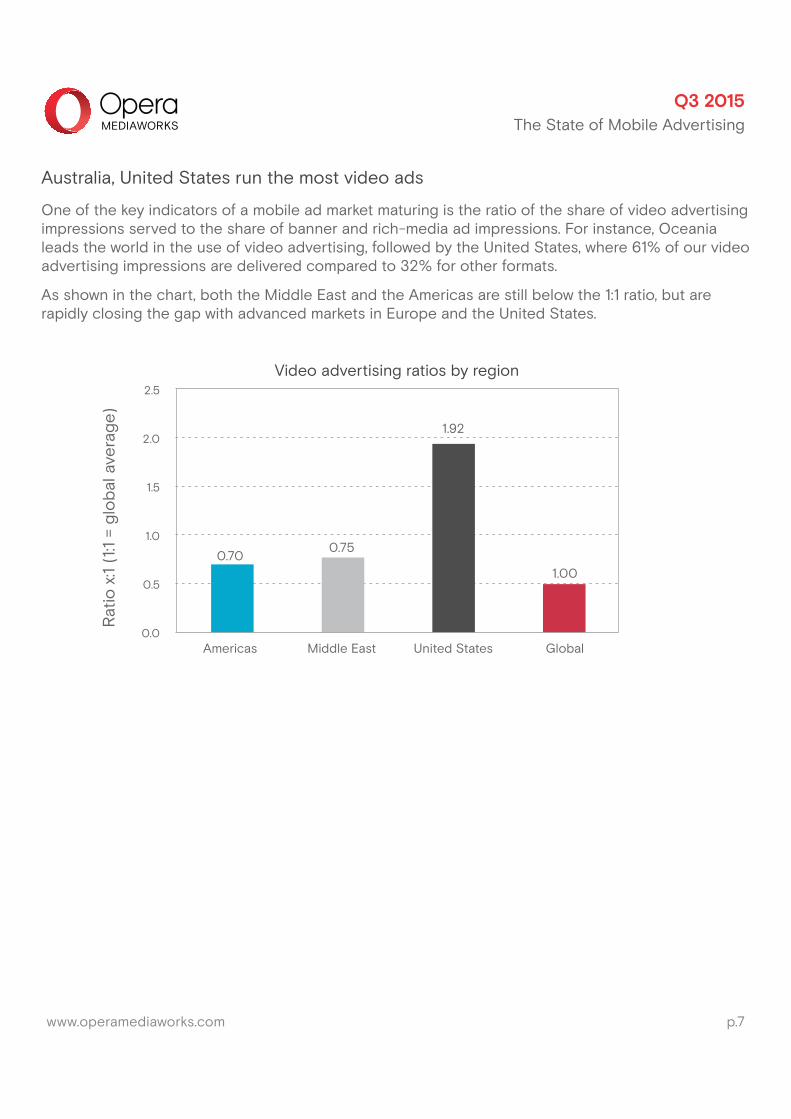
Australia, United States run the most video ads One of the key indicators of a mobile ad market maturing is the ratio of the share of video advertising impressions served to the share of banner and rich-media ad impressions. For instance, Oceania leads the world in the use of video advertising, followed by the United States, where 61% of our video advertising impressions are delivered compared to 32% for other formats.
As shown in the chart, both the Middle East and the Americas are still below the 1:1 ratio, but are rapidly closing the gap with advanced markets in Europe and the United States.
www.operamediaworks.com p.7
Q3 2015The State of Mobile Advertising
www.operamediaworks.com p.8
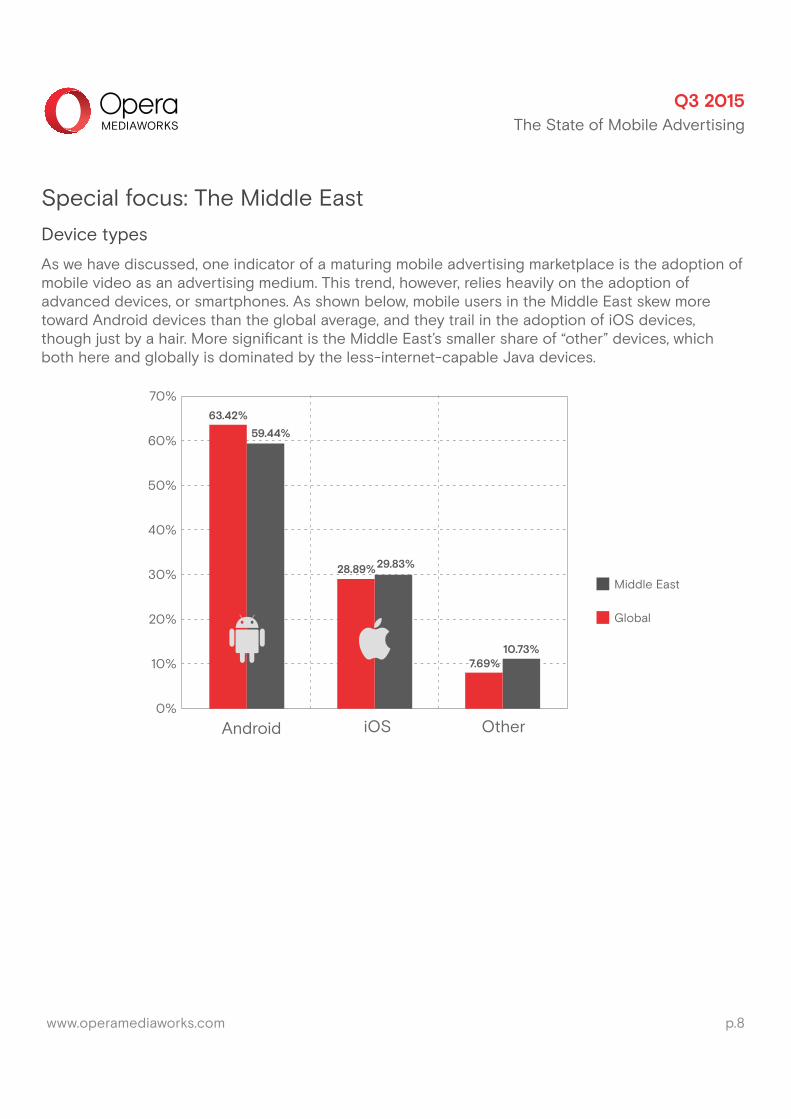
Special focus: The Middle EastDevice types
As we have discussed, one indicator of a maturing mobile advertising marketplace is the adoption of mobile video as an advertising medium. This trend, however, relies heavily on the adoption of advanced devices, or smartphones. As shown below, mobile users in the Middle East skew more toward Android devices than the global average, and they trail in the adoption of iOS devices, though just by a hair. More significant is the Middle East’s smaller share of “other” devices, which both here and globally is dominated by the less-internet-capable Java devices.
Global
Middle East
70%
60%
50%
40%
30%
20%
10%
0%
Android iOS Other
1.20
29.83%
10.73%7.69%
63.42%
59.44%
28.89%
Q3 2015The State of Mobile Advertising
Population in the Middle EastRegion area heights are proportionalto % of total population in the Middle East
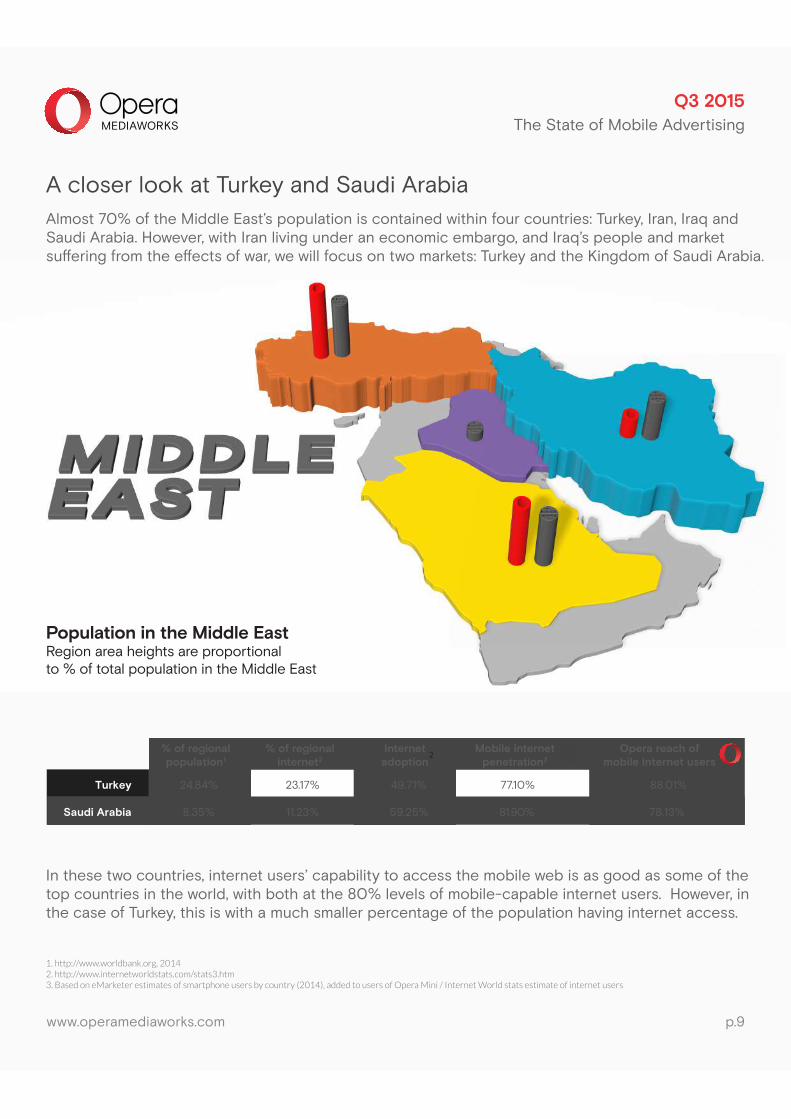
A closer look at Turkey and Saudi Arabia Almost 70% of the Middle East’s population is contained within four countries: Turkey, Iran, Iraq and Saudi Arabia. However, with Iran living under an economic embargo, and Iraq’s people and market suffering from the effects of war, we will focus on two markets: Turkey and the Kingdom of Saudi Arabia.
In these two countries, internet users’ capability to access the mobile web is as good as some of the top countries in the world, with both at the 80% levels of mobile-capable internet users. However, in the case of Turkey, this is with a much smaller percentage of the population having internet access.
% of regionalpopulation1
% of regionalinternet2
Internetadoption
Mobile internetpenetration3
Opera reach ofmobile internet users
Turkey 24.84% 23.17% 49.71% 77.10% 88.01%
Saudi Arabia 8.35% 11.23% 59.25% 81.90% 78.13%
1. http://www.worldbank.org, 2014
2. http://www.internetworldstats.com/stats3.htm
3. Based on eMarketer estimates of smartphone users by country (2014), added to users of Opera Mini / Internet World stats estimate of internet users
2
www.operamediaworks.com p.9
Q3 2015The State of Mobile Advertising
Turkey
Saudi Arabia
Music, Video& Media
News & Information
Technology
Entertainment
Games
90%
80%
70%
60%
50%
40%
30%
20%
10%
0%
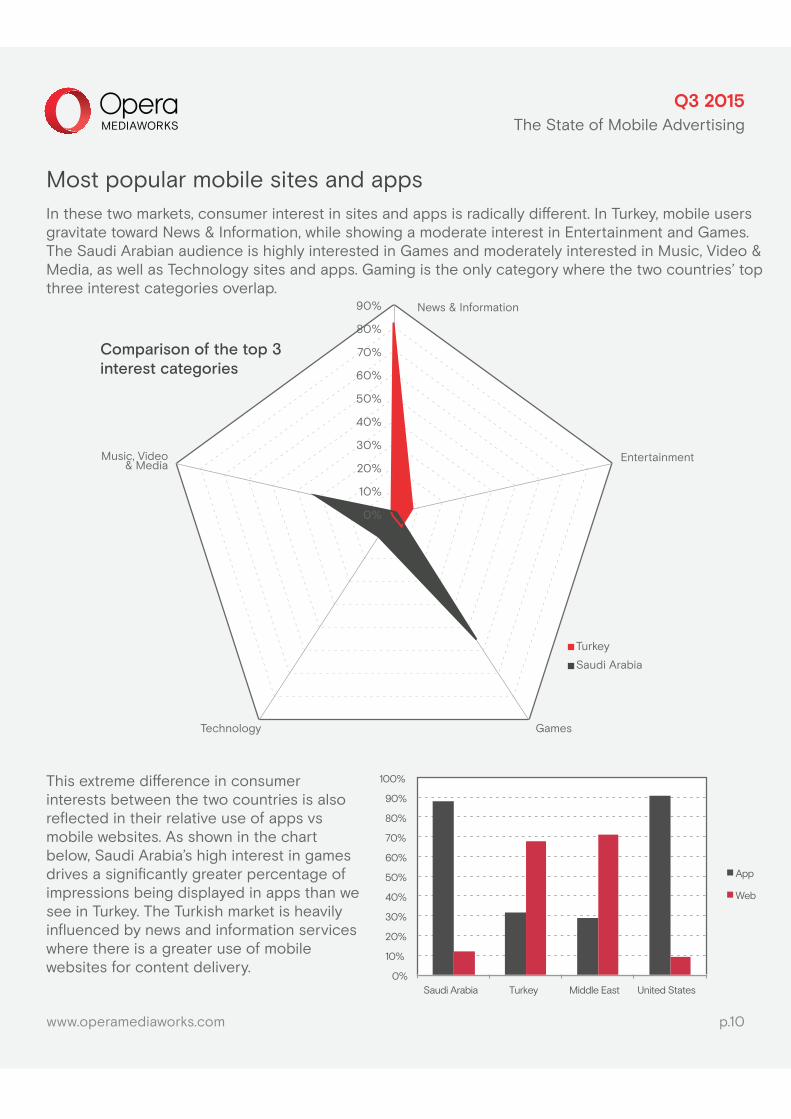
Most popular mobile sites and apps In these two markets, consumer interest in sites and apps is radically different. In Turkey, mobile users gravitate toward News & Information, while showing a moderate interest in Entertainment and Games. The Saudi Arabian audience is highly interested in Games and moderately interested in Music, Video & Media, as well as Technology sites and apps. Gaming is the only category where the two countries’ top three interest categories overlap.
This extreme difference in consumer interests between the two countries is also reflected in their relative use of apps vs mobile websites. As shown in the chart below, Saudi Arabia’s high interest in games drives a significantly greater percentage of impressions being displayed in apps than we see in Turkey. The Turkish market is heavily influenced by news and information services where there is a greater use of mobile websites for content delivery.
0%
10%
20%
30%
40%
50%
60%
70%
80%
90%
100%
Saudi Arabia Turkey Middle East United States
App
Web
www.operamediaworks.com p.10
Comparison of the top 3interest categories
Q3 2015The State of Mobile Advertising
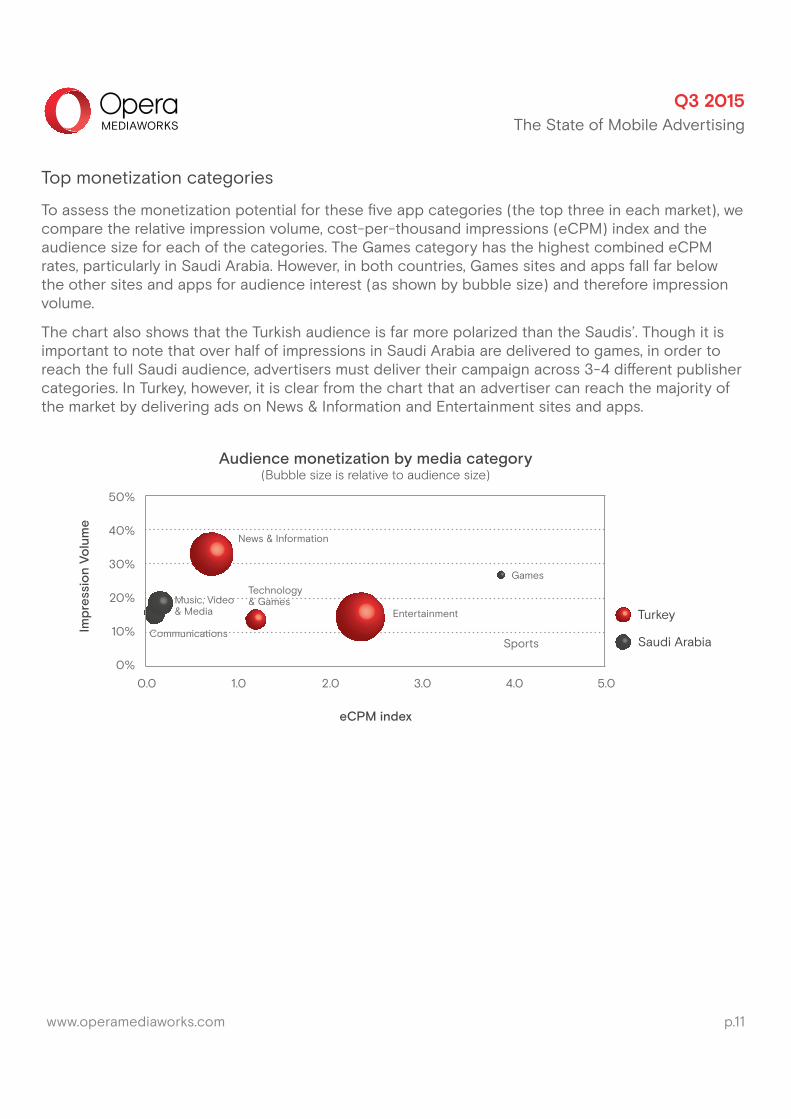
Top monetization categories To assess the monetization potential for these five app categories (the top three in each market), we compare the relative impression volume, cost-per-thousand impressions (eCPM) index and the audience size for each of the categories. The Games category has the highest combined eCPM rates, particularly in Saudi Arabia. However, in both countries, Games sites and apps fall far below the other sites and apps for audience interest (as shown by bubble size) and therefore impression volume.
The chart also shows that the Turkish audience is far more polarized than the Saudis’. Though it is important to note that over half of impressions in Saudi Arabia are delivered to games, in order to reach the full Saudi audience, advertisers must deliver their campaign across 3-4 different publisher categories. In Turkey, however, it is clear from the chart that an advertiser can reach the majority of the market by delivering ads on News & Information and Entertainment sites and apps.
www.operamediaworks.com p.11
Sports
GamesTechnology& Games
Communications
Music, Video& Media
News & Information
Entertainment
50%
40%
30%
20%
10%
0%
0.0 1.0 2.0 3.0 4.0 5.0
Audience monetization by media category(Bubble size is relative to audience size)
eCPM index
Turkey
Saudi Arabia
Imp
ress
ion
Volu
me
Q3 2015The State of Mobile Advertising
www.operamediaworks.com p.12
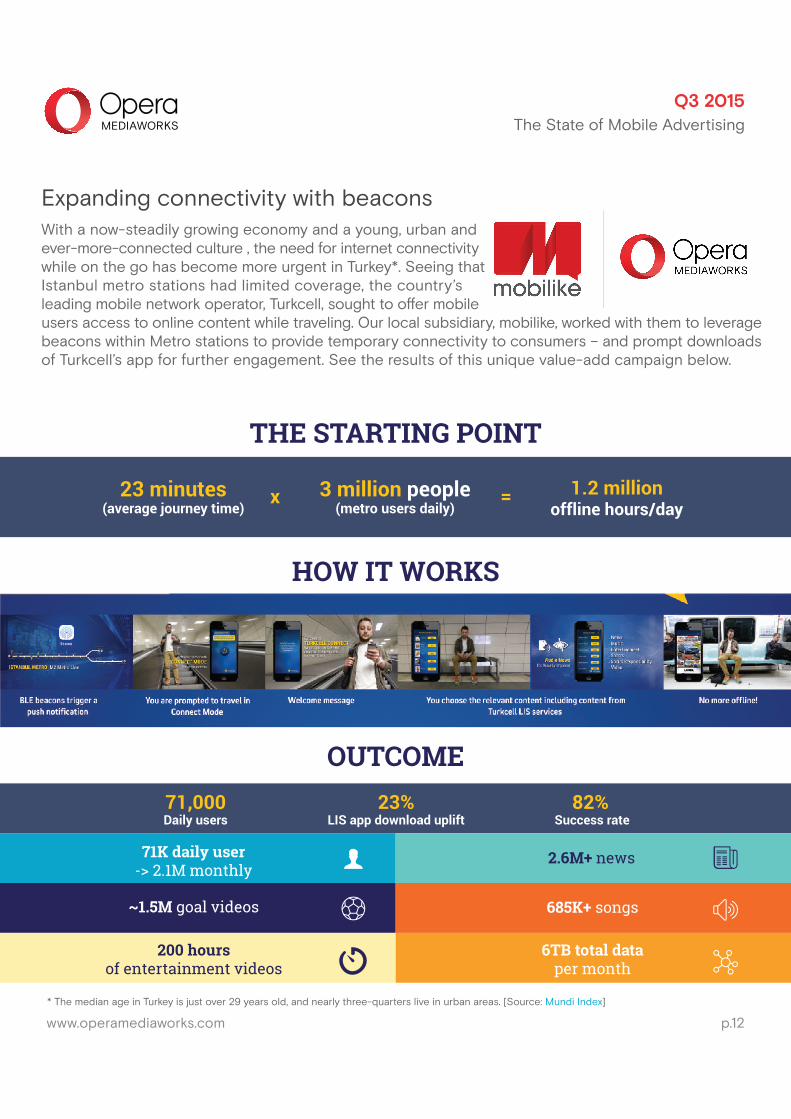
Expanding connectivity with beaconsWith a now-steadily growing economy and a young, urban andever-more-connected culture , the need for internet connectivitywhile on the go has become more urgent in Turkey*. Seeing thatIstanbul metro stations had limited coverage, the country’sleading mobile network operator, Turkcell, sought to offer mobileusers access to online content while traveling. Our local subsidiary, mobilike, worked with them to leverage beacons within Metro stations to provide temporary connectivity to consumers – and prompt downloads of Turkcell’s app for further engagement. See the results of this unique value-add campaign below.
71K daily user -> 2.1M monthly
71,000Daily users
23%LIS app download uplift
82% Success rate
2.6M+ news
~1.5M goal videos 685K+ songs
200 hoursof entertainment videos
6TB total dataper month
* The median age in Turkey is just over 29 years old, and nearly three-quarters live in urban areas. [Source: Mundi Index]
THE STARTING POINT
HOW IT WORKS
OUTCOME
23 minutes(average journey time)
x =3 million people(metro users daily)
1.2 millionoffline hours/day
Q3 2015The State of Mobile Advertising