Embed Size (px)
Citation preview

US Vertical Insights !
Consumer Electronics: Smart Devices (Smartphones & Tablets) !
February - 2015
TABLE OF CONTENTS1. Objectives & Key Insights
2. Mobile Device Consumer Profile
3. The Role of Mobile in Shopping
4. Mobile Ad Receptivity
5. Personas
6. Tips to Combat Showrooming
7. Path to Purchase
8. Research Methodology

OBJECTIVES AND KEY INSIGHTS
OBJECTIVES• Establish a profile of Smart Device purchase intenders
• Understand Mobile Media consumption for Smart Device purchase
• Measure receptiveness to Mobile Advertising
• Illustrate the path to purchase for Smart Device purchase
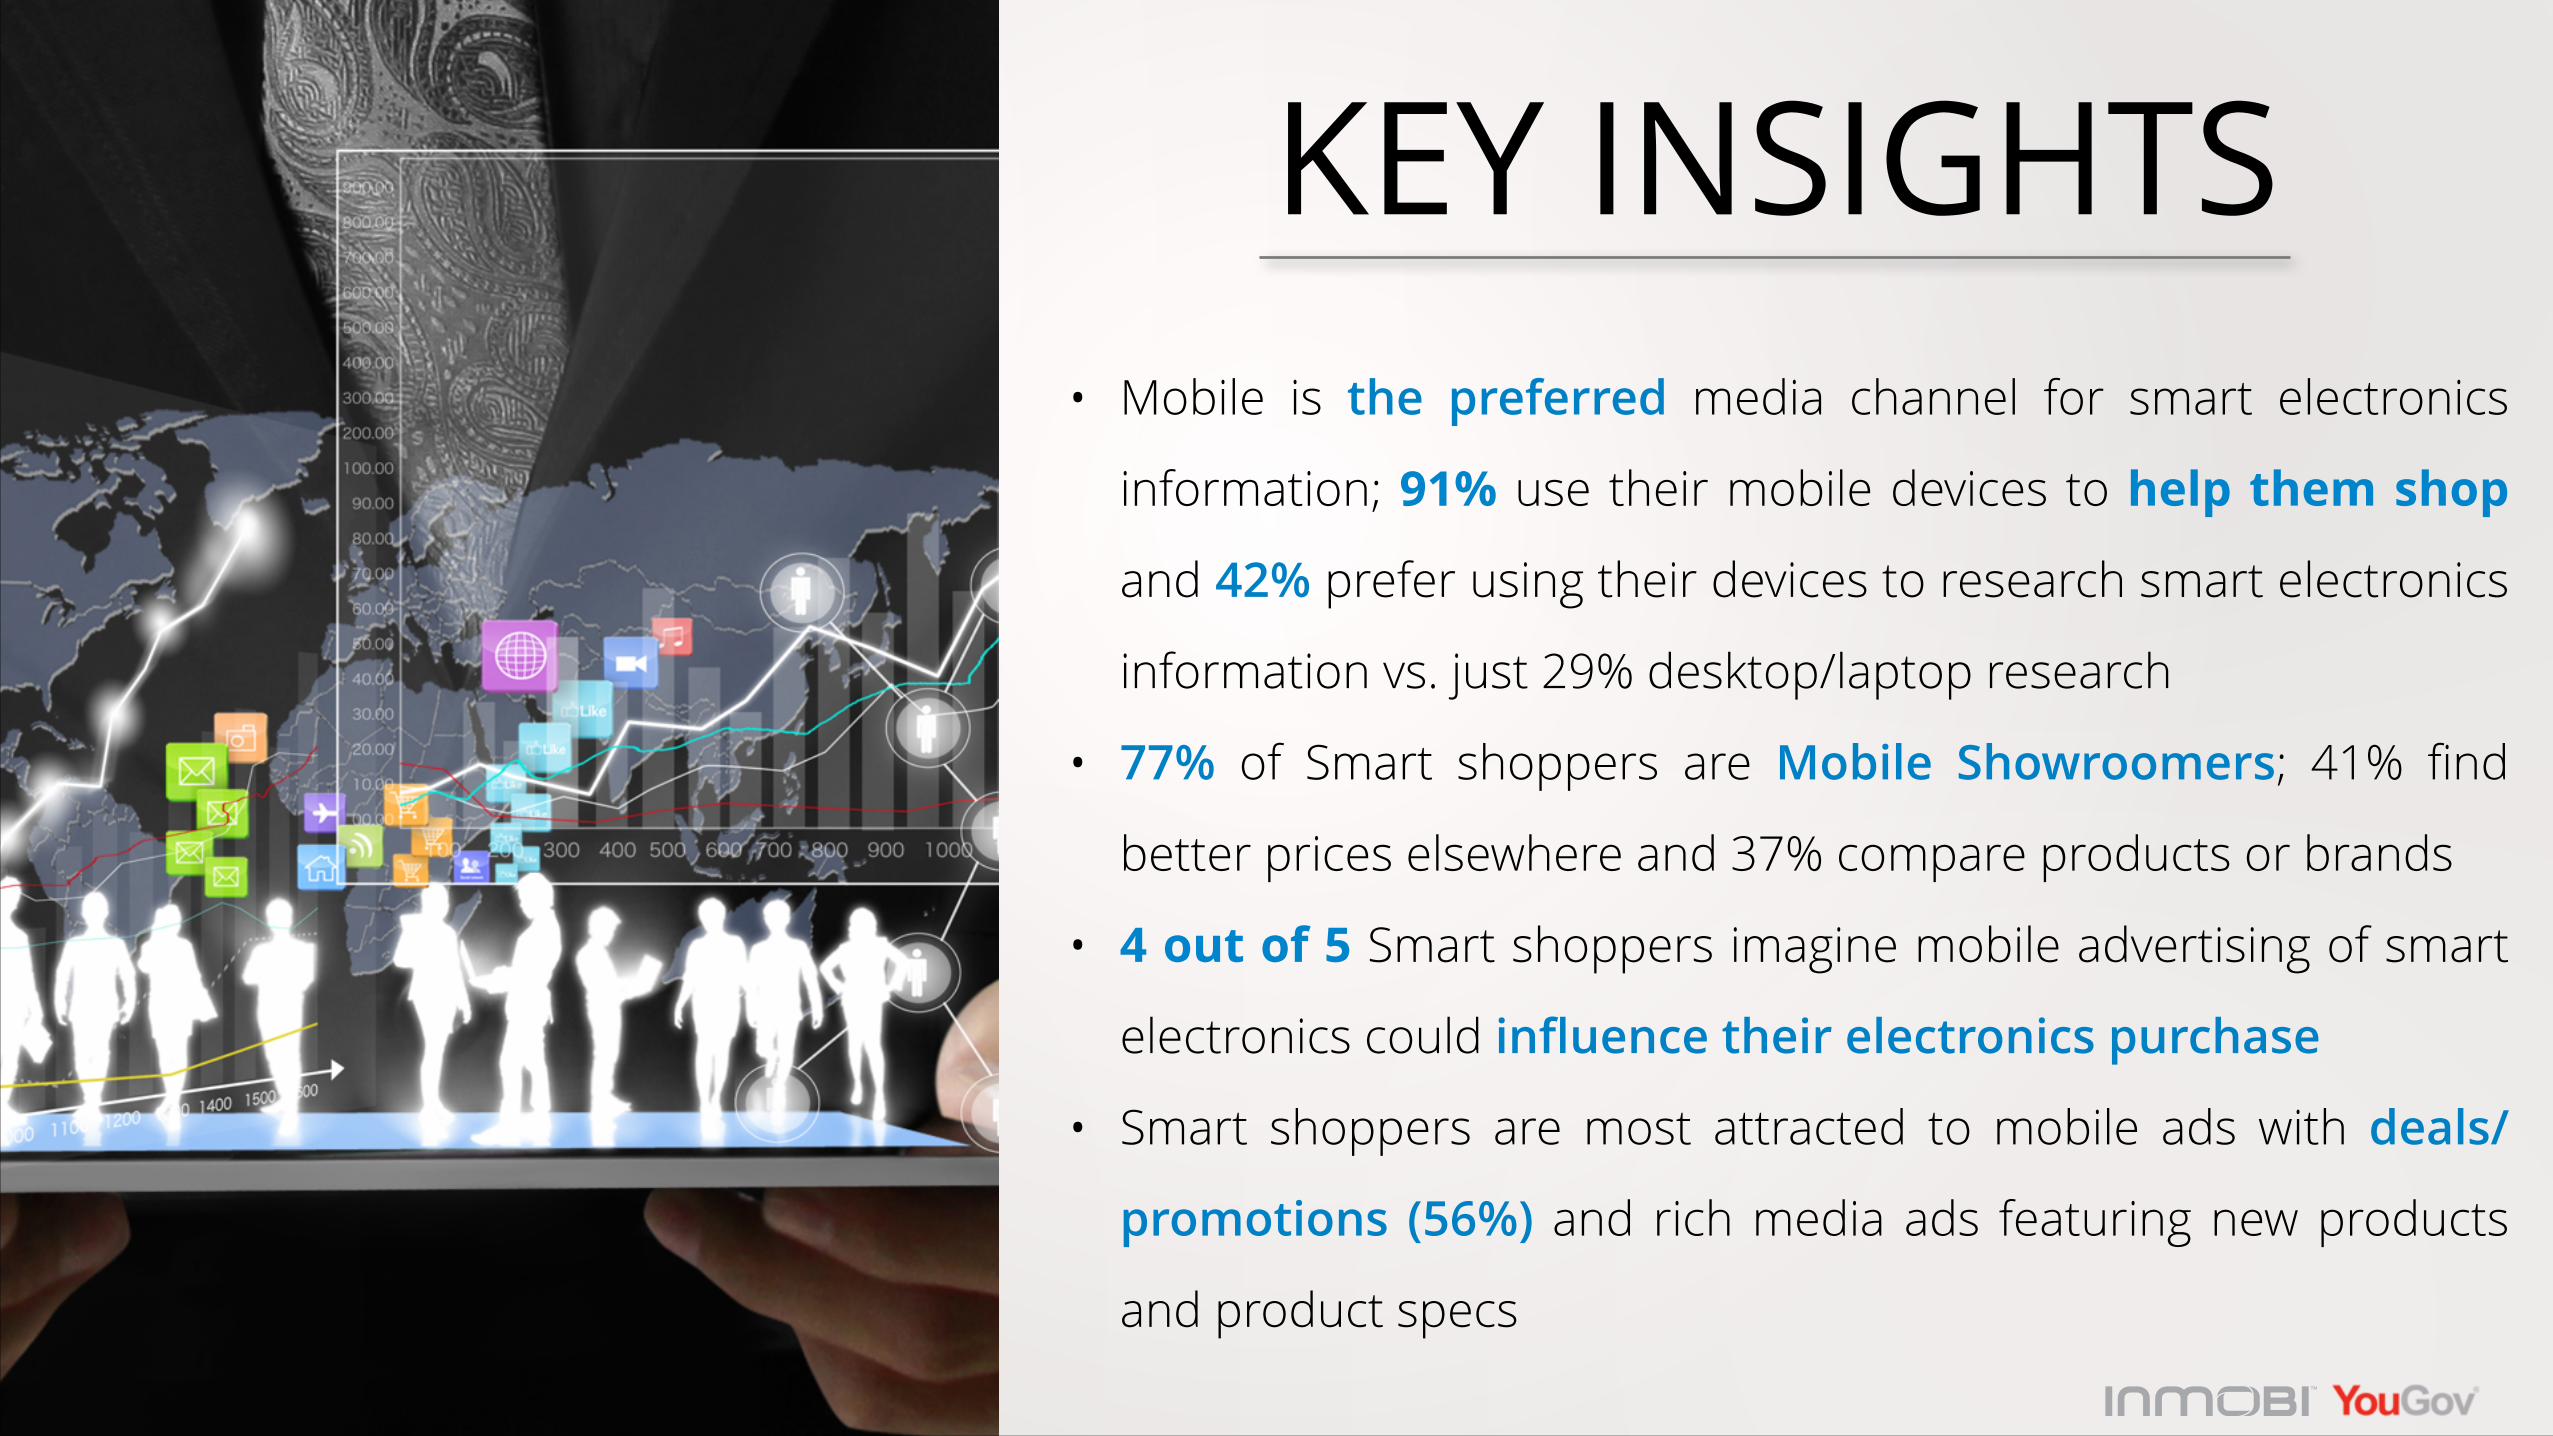
KEY INSIGHTS• Mobile is the preferred media channel for smart electronics
information; 91% use their mobile devices to help them shop
and 42% prefer using their devices to research smart electronics
information vs. just 29% desktop/laptop research
• 77% of Smart shoppers are Mobile Showroomers; 41% find
better prices elsewhere and 37% compare products or brands
• 4 out of 5 Smart shoppers imagine mobile advertising of smart
electronics could influence their electronics purchase
• Smart shoppers are most attracted to mobile ads with deals/
promotions (56%) and rich media ads featuring new products
and product specs

MOBILE DEVICE CONSUMER PROFILE
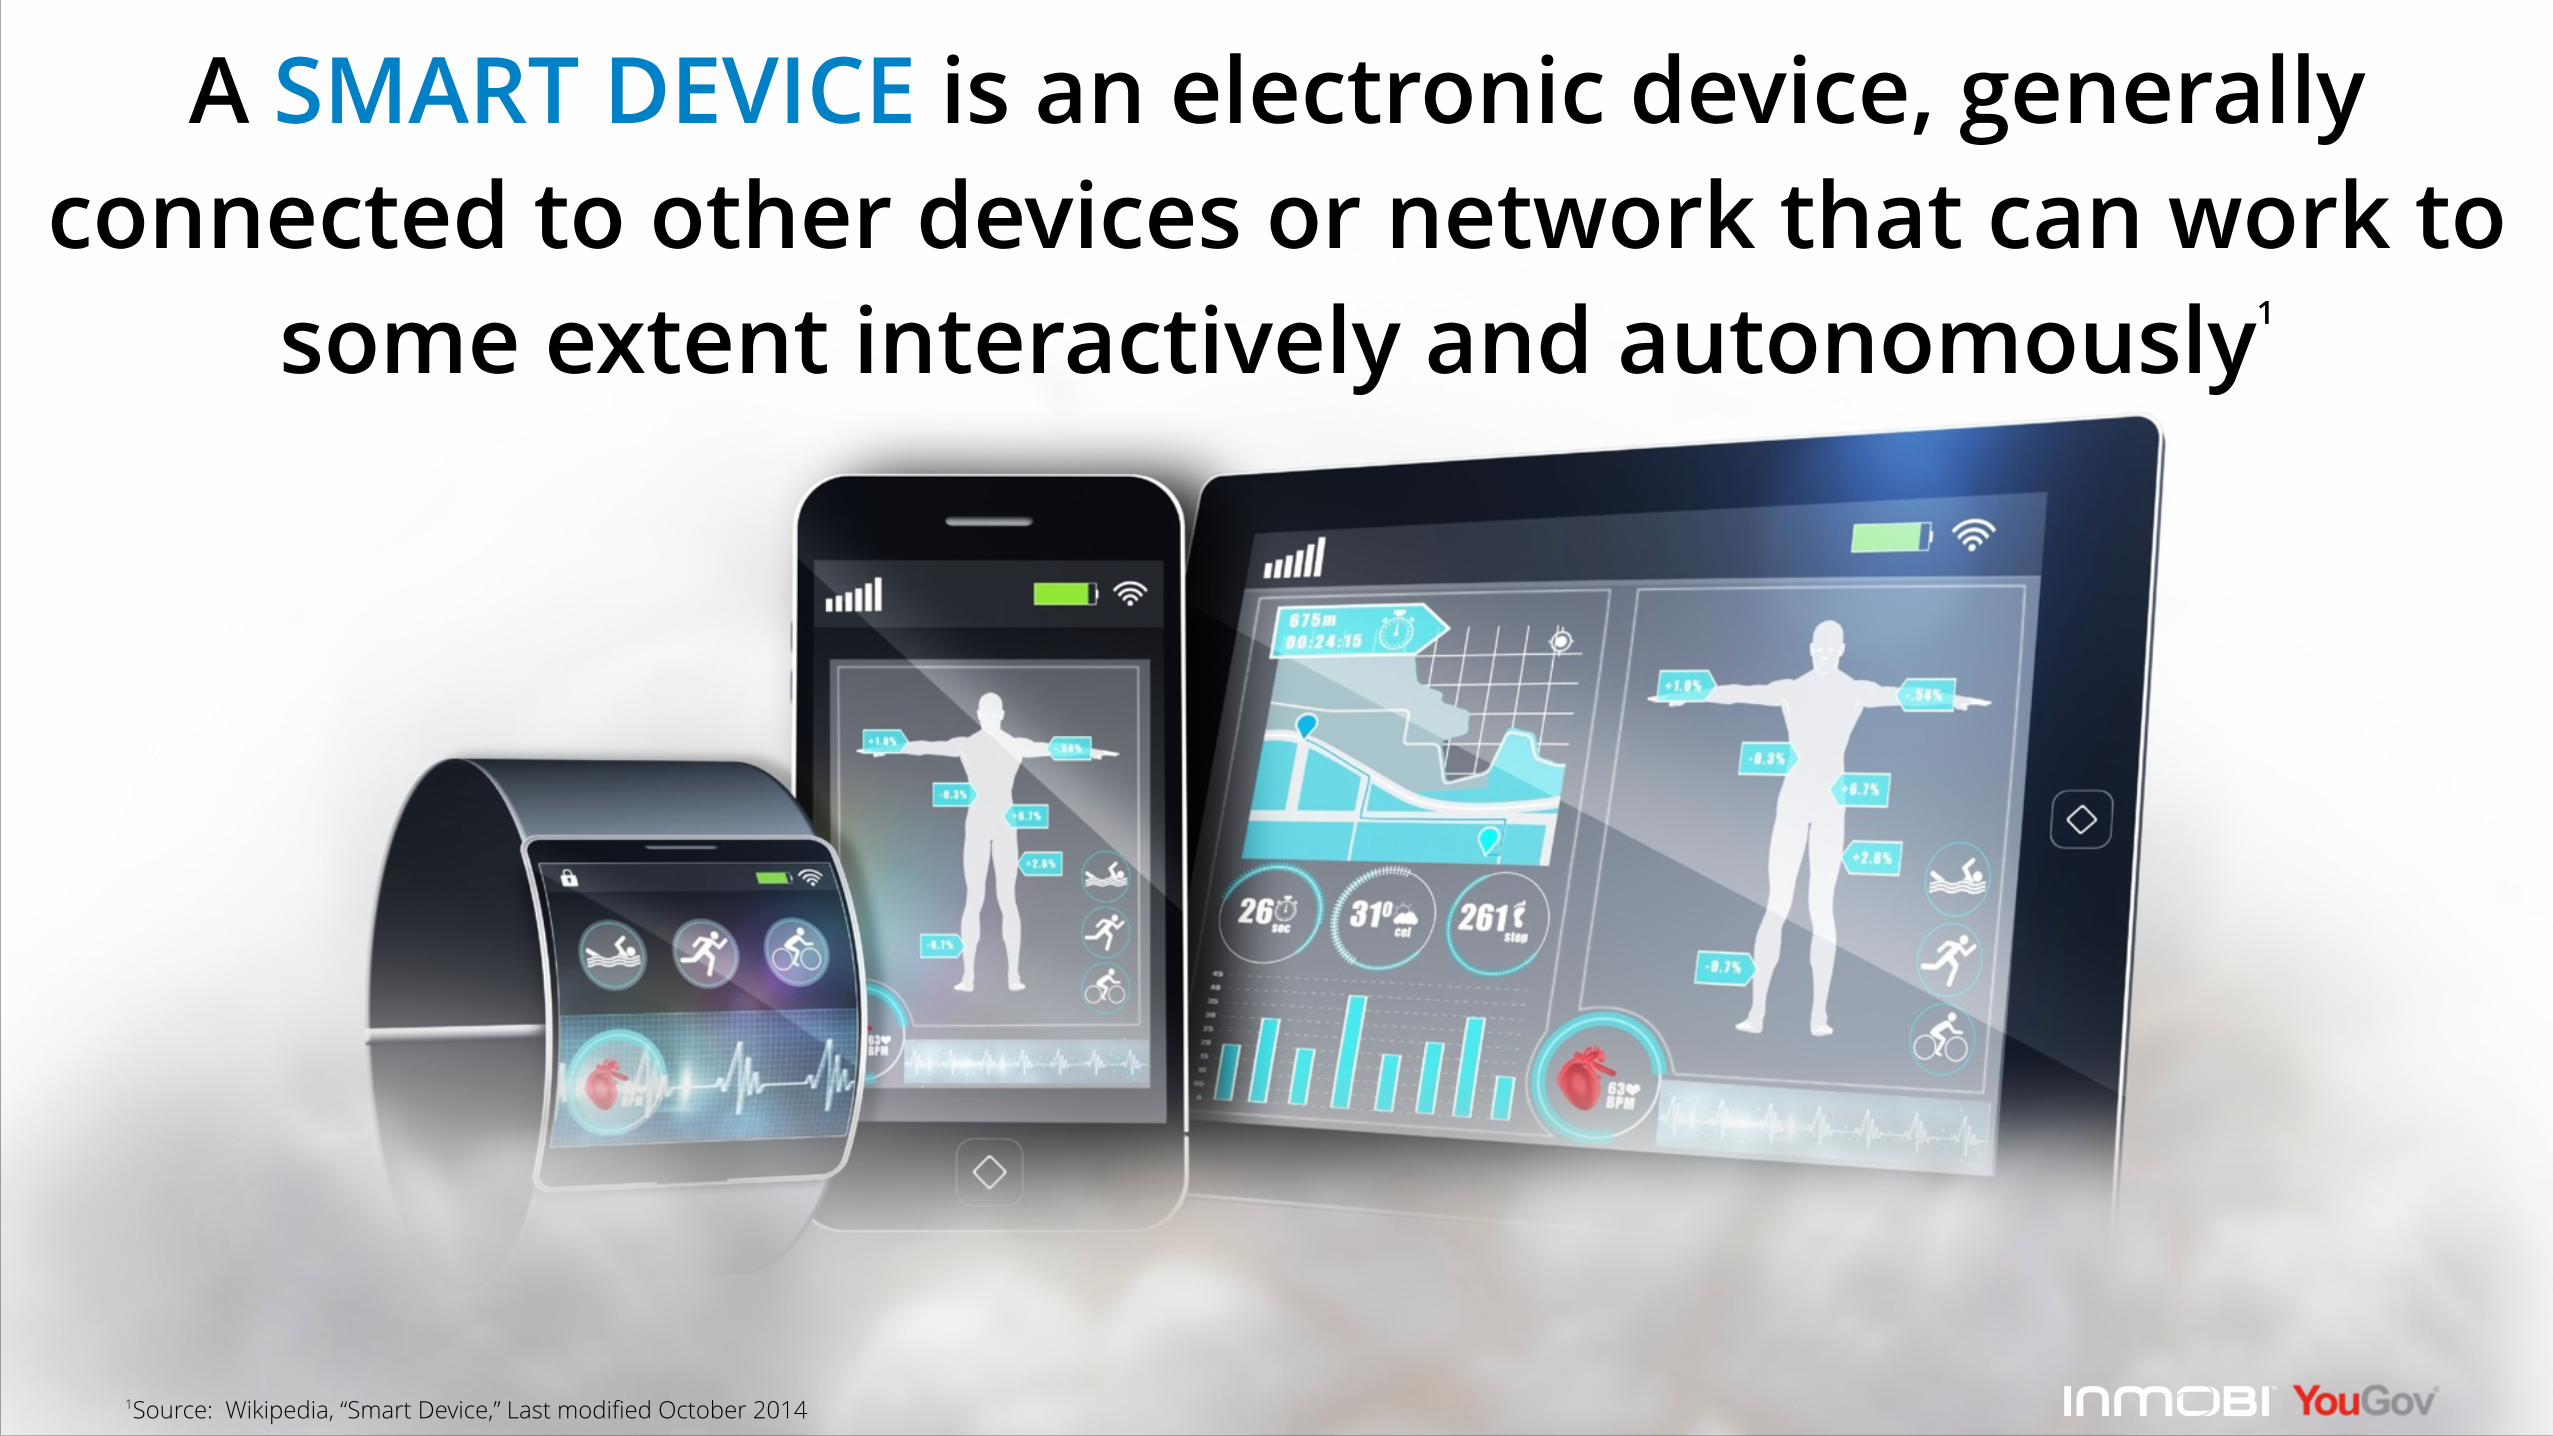
A SMART DEVICE is an electronic device, generally connected to other devices or network that can work to
some extent interactively and autonomously1
1Source: Wikipedia, “Smart Device,” Last modified October 2014
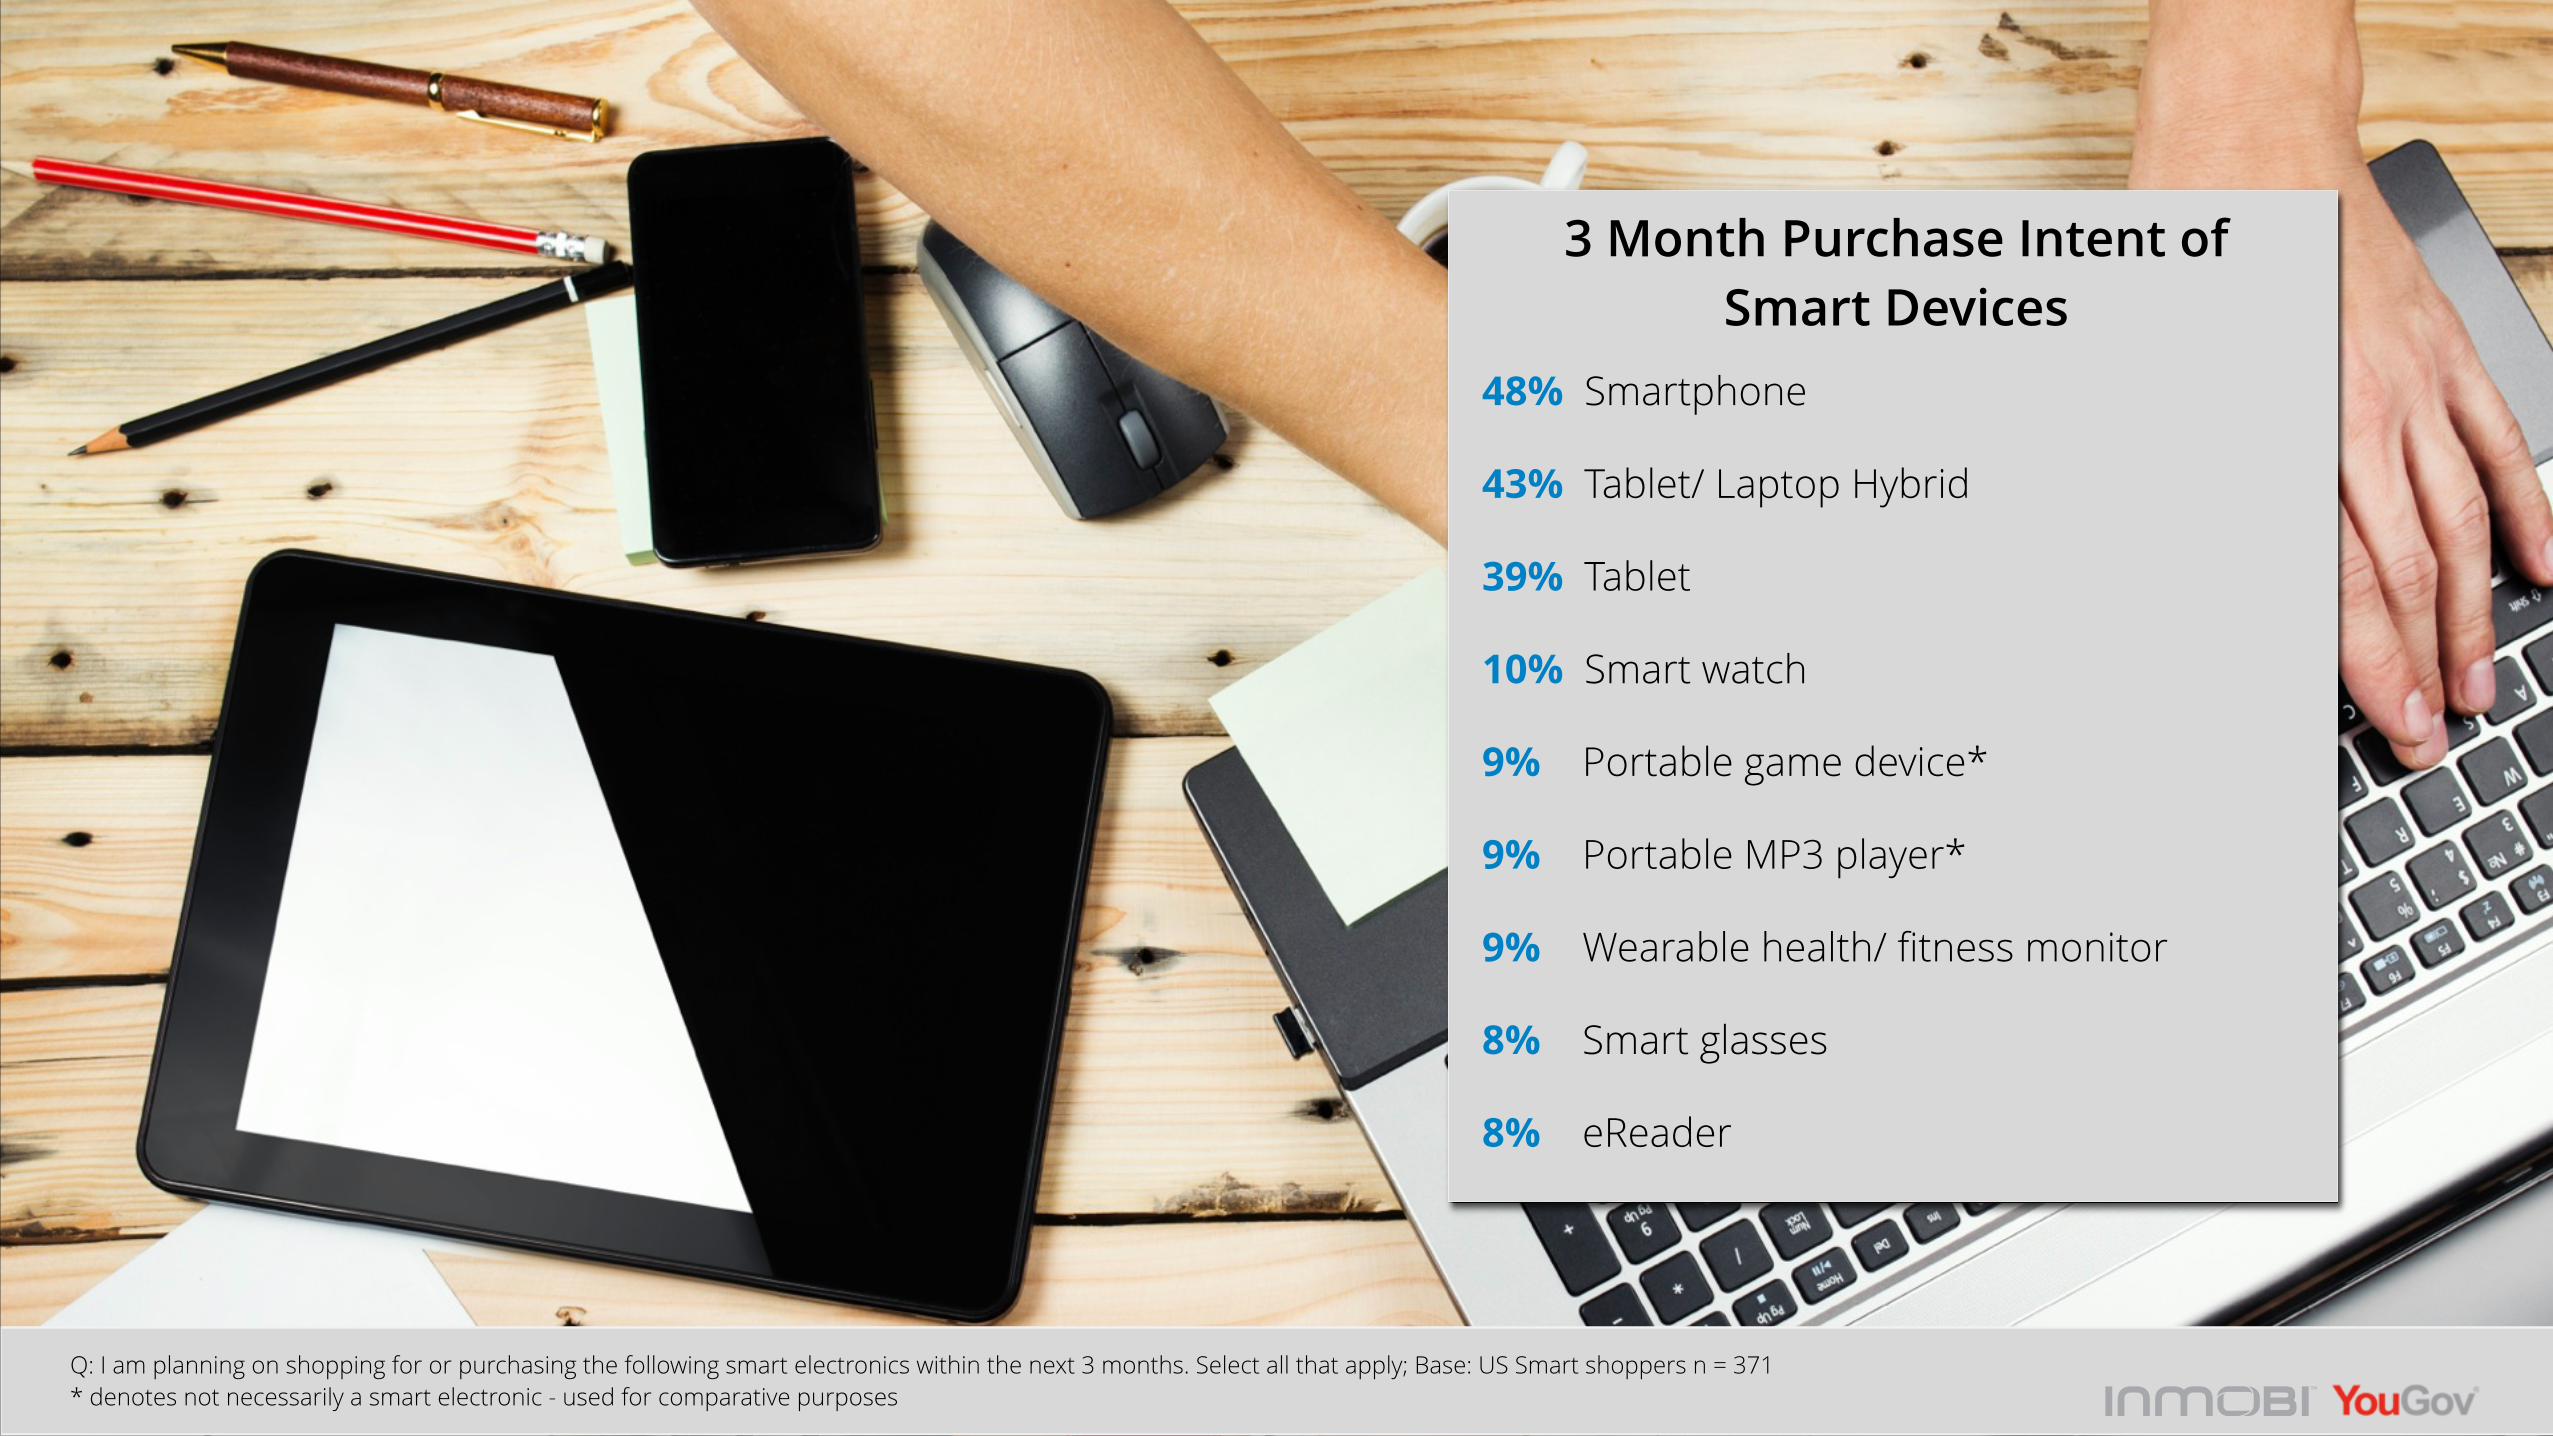
3 Month Purchase Intent of Smart Devices
Q: I am planning on shopping for or purchasing the following smart electronics within the next 3 months. Select all that apply; Base: US Smart shoppers n = 371 * denotes not necessarily a smart electronic - used for comparative purposes
48% Smartphone
43% Tablet/ Laptop Hybrid
39% Tablet
10% Smart watch
9% Portable game device*
9% Portable MP3 player*
9% Wearable health/ fitness monitor
8% Smart glasses
8% eReader

15 - 17
18 - 34
35 - 54
55+ 24%
34%
41%
6%
Age
$35,746Average Yearly Income
54% 42%
Demographic Breakdown of
SMARTPHONE SHOPPERS
15 - 17
18 - 34
35 - 54
55+ 32%
33%
30%
4%
Age
$32,587Average Yearly Income
Demographic Breakdown of
TABLET SHOPPERS
*Tablets encompass tablets, tablet/ hybrids, eReaders
52% 44%
Base: US Smartphone shoppers n = 179; Base: US Tablet shoppers n = 265
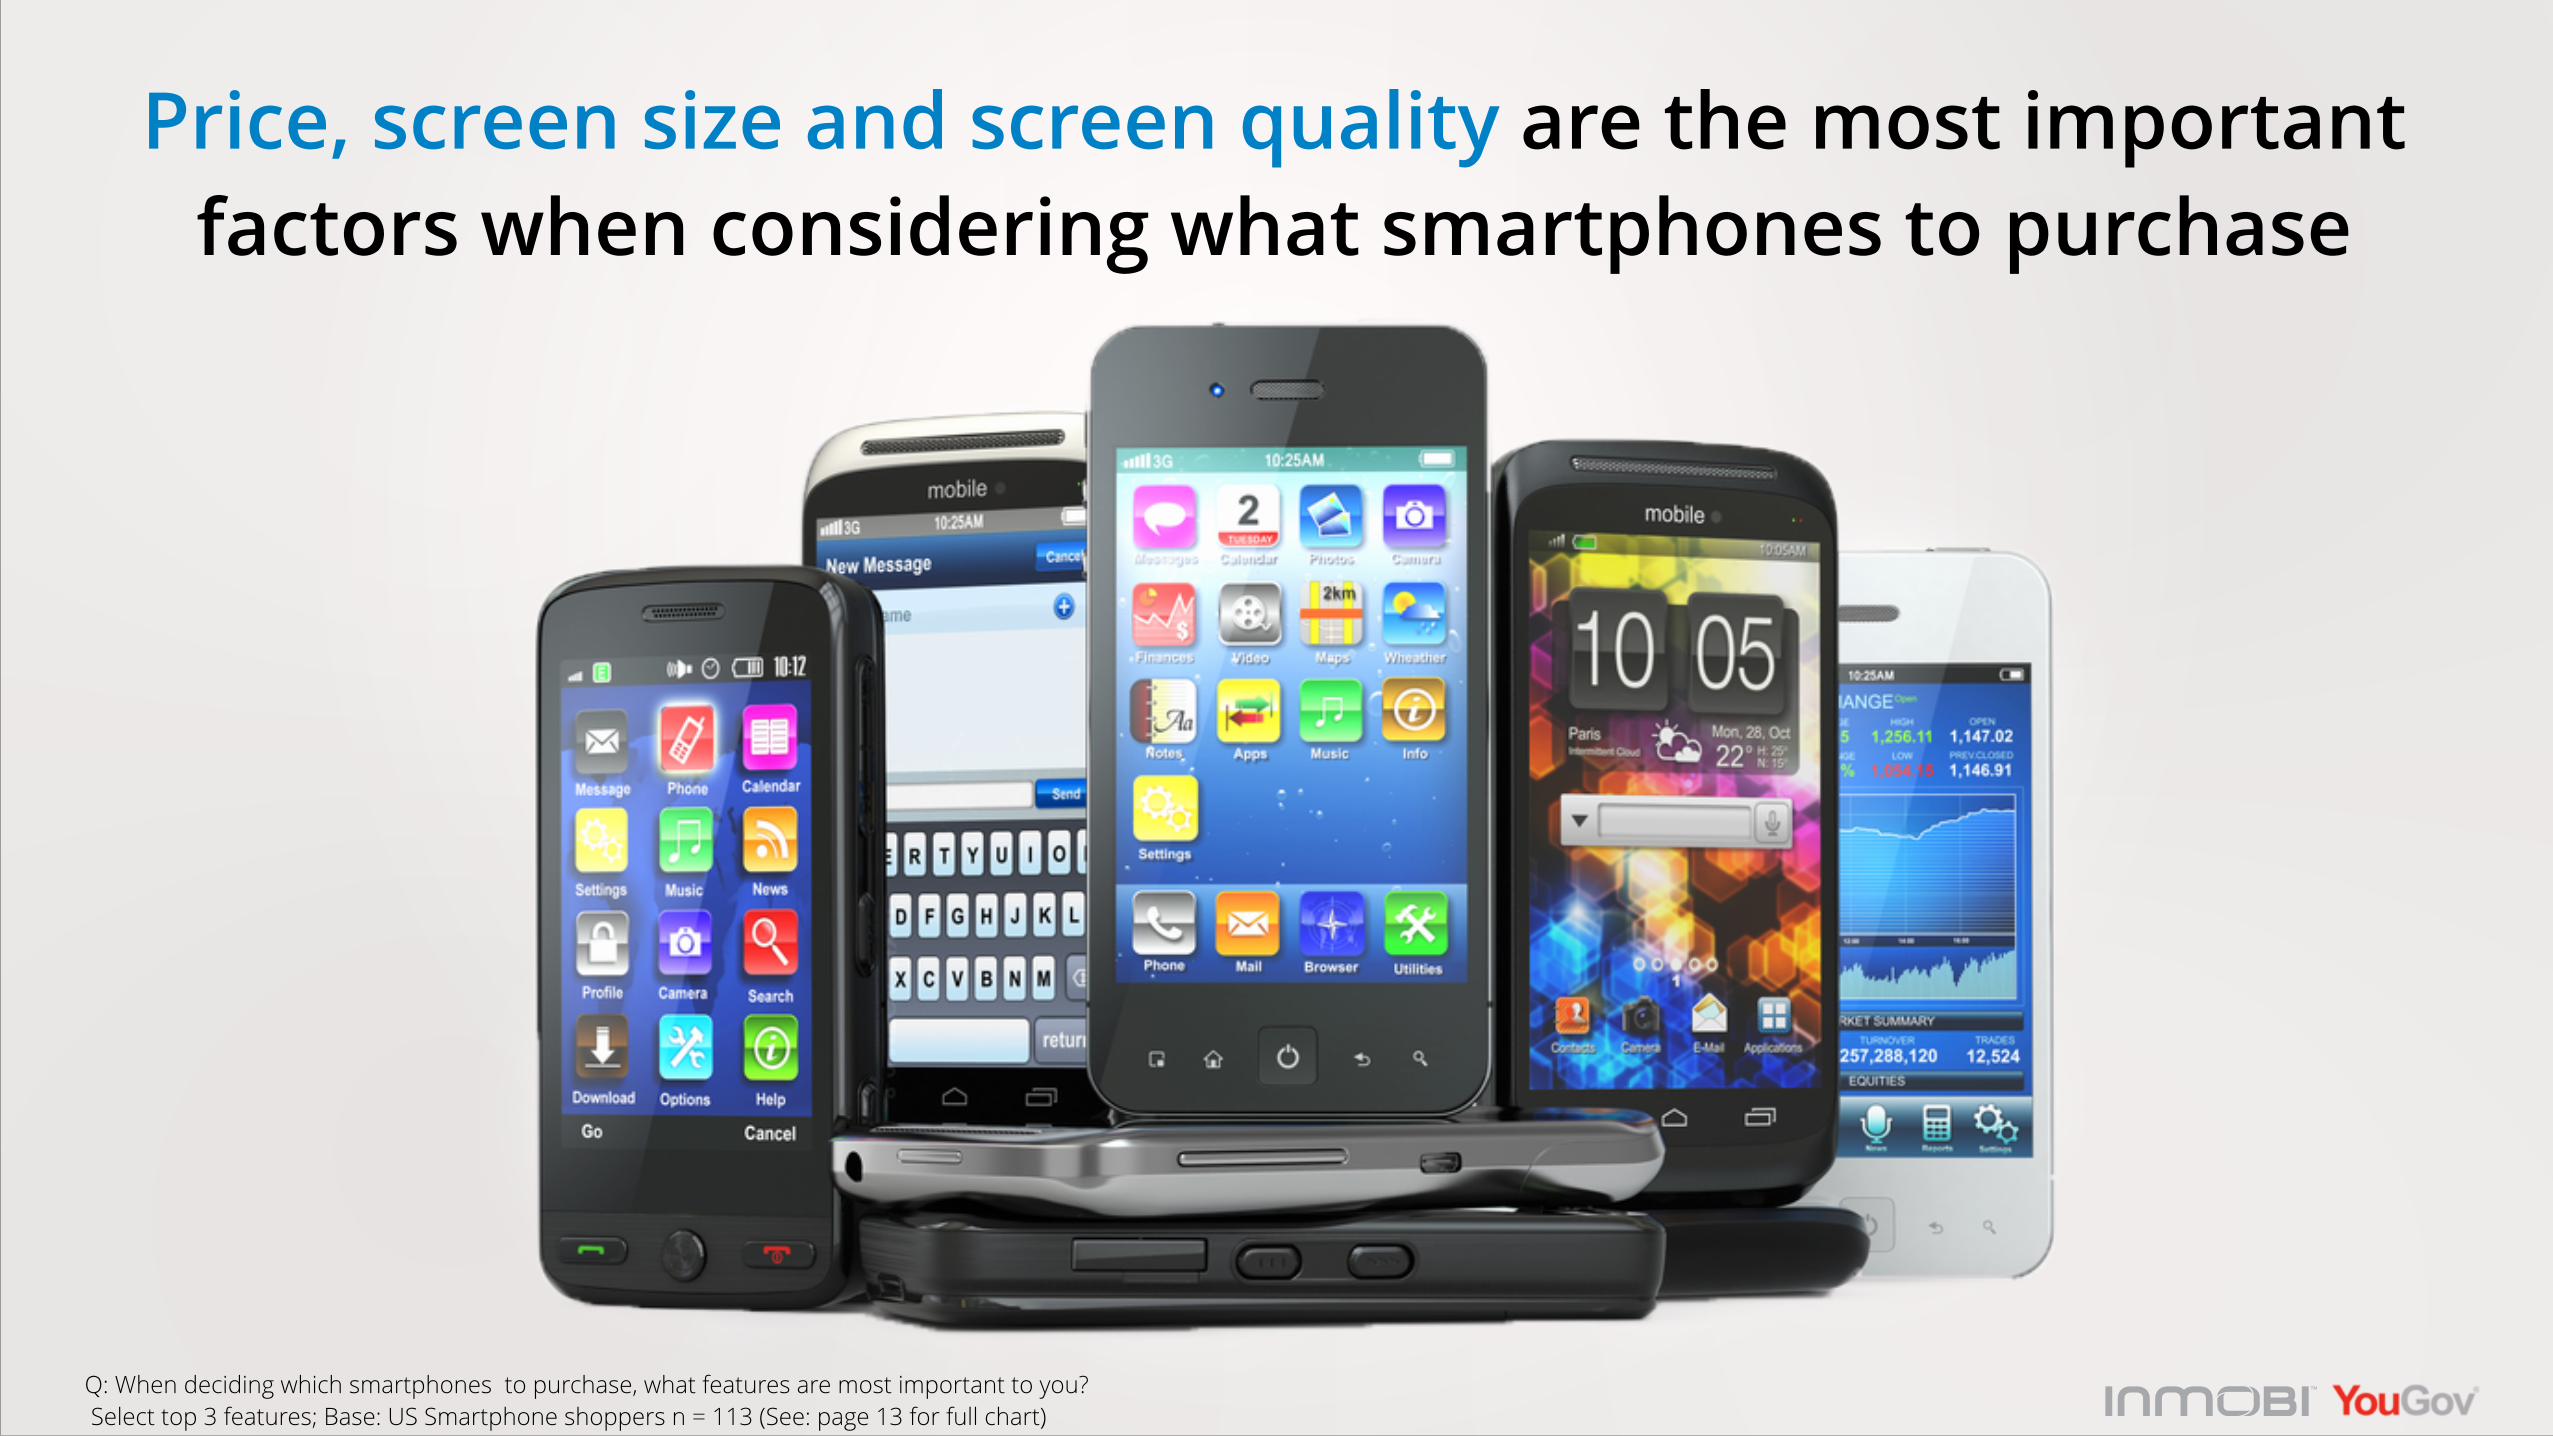
Price, screen size and screen quality are the most important factors when considering what smartphones to purchase
Q: When deciding which smartphones to purchase, what features are most important to you? Select top 3 features; Base: US Smartphone shoppers n = 113 (See: page 13 for full chart)
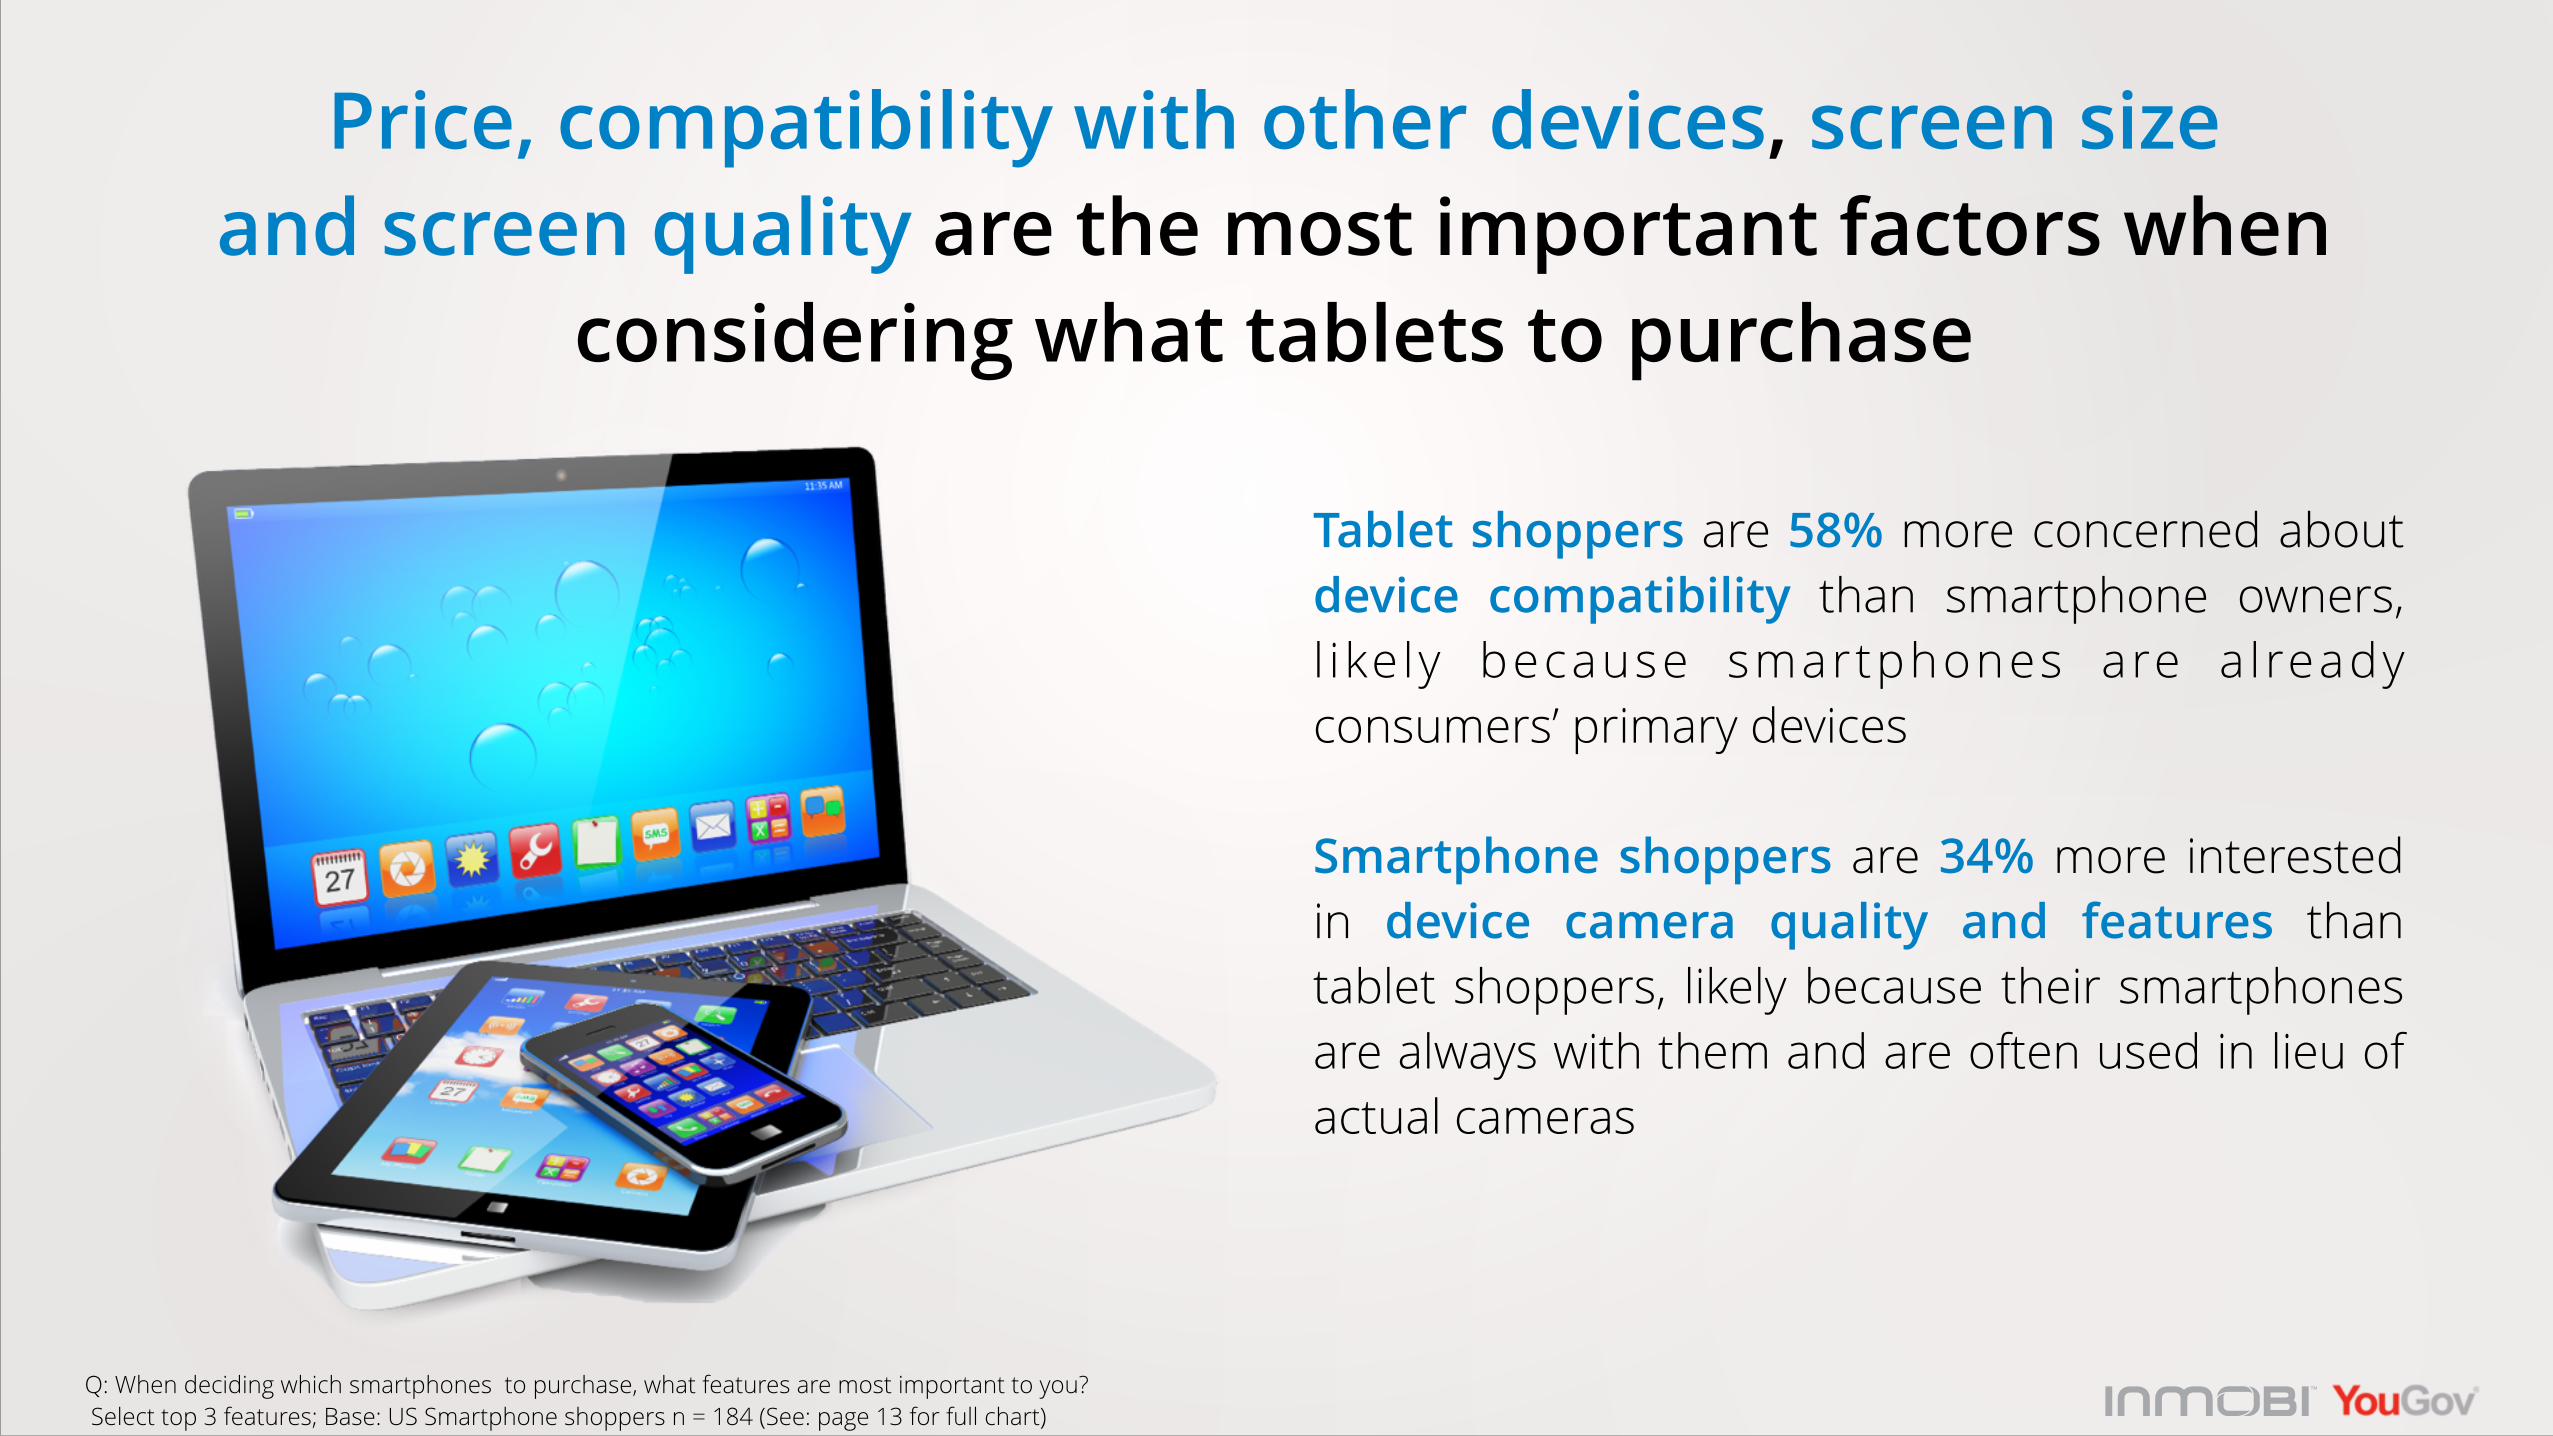
Price, compatibility with other devices, screen size and screen quality are the most important factors when
considering what tablets to purchase
Q: When deciding which smartphones to purchase, what features are most important to you? Select top 3 features; Base: US Smartphone shoppers n = 184 (See: page 13 for full chart)
Tablet shoppers are 58% more concerned about device compatibility than smartphone owners, l ikely because smartphones are a lready consumers’ primary devices !
Smartphone shoppers are 34% more interested in device camera quality and features than tablet shoppers, likely because their smartphones are always with them and are often used in lieu of actual cameras

THE ROLE OF MOBILE IN SHOPPING
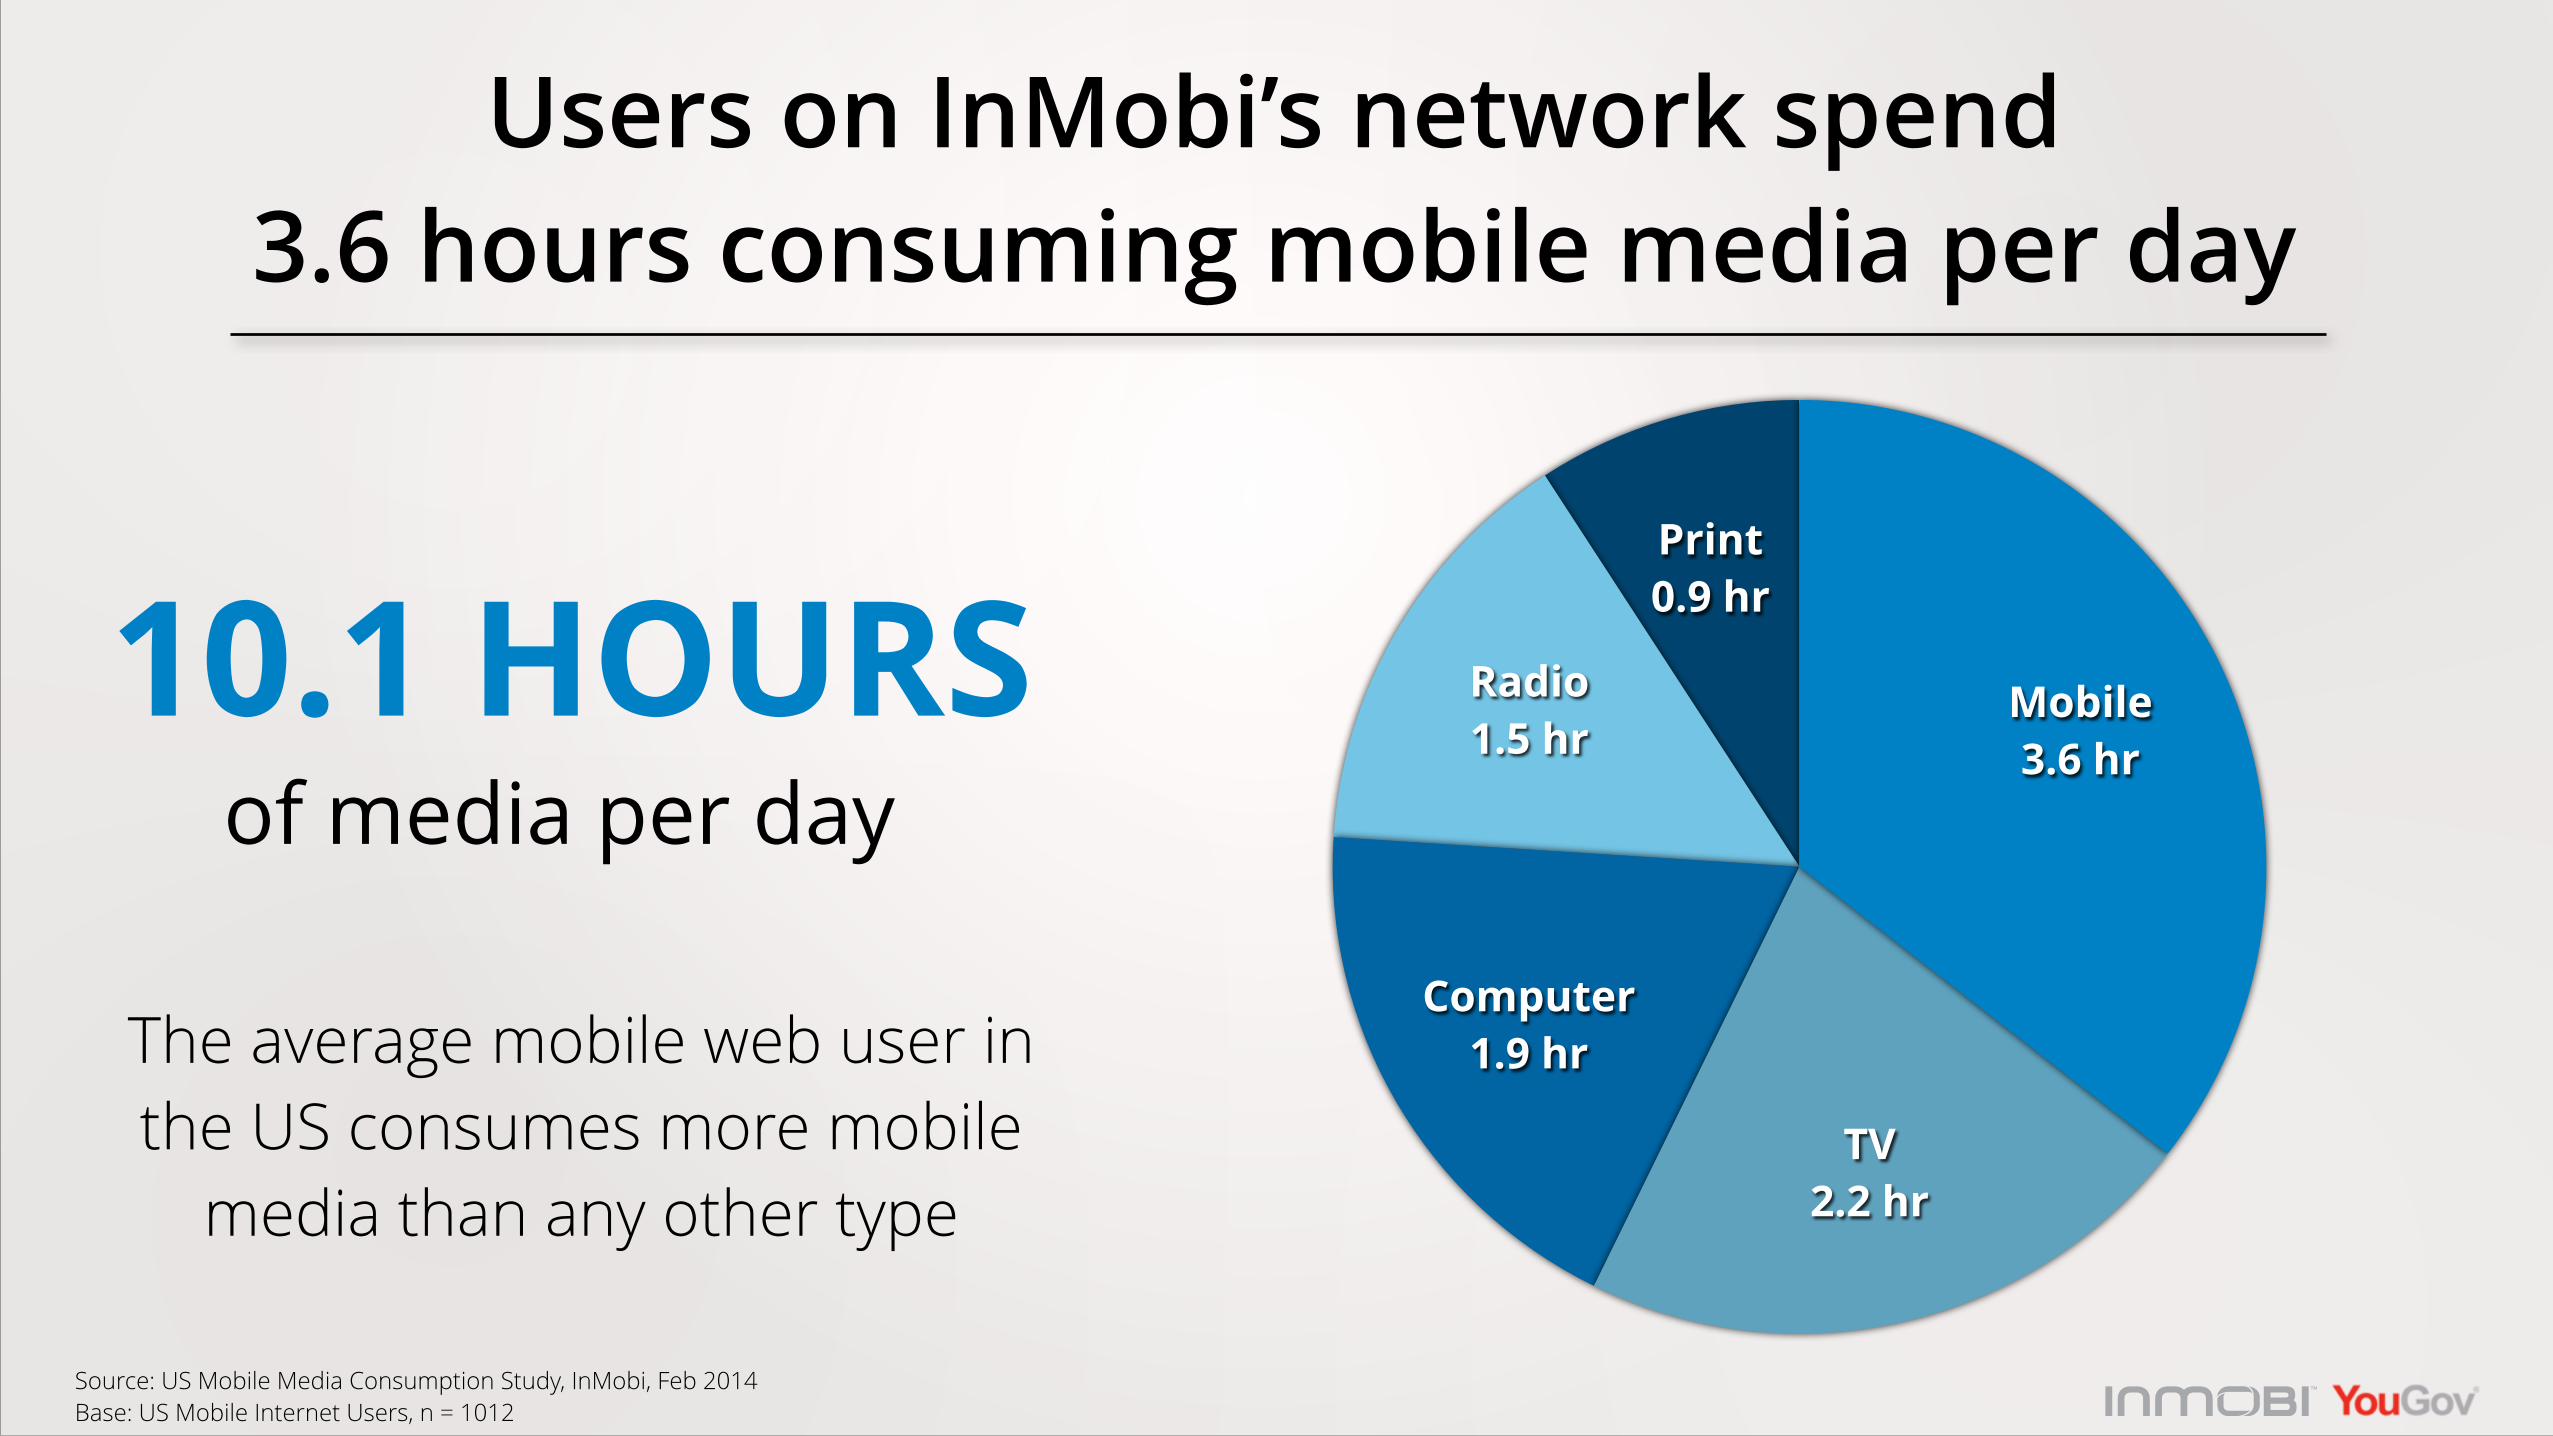
Users on InMobi’s network spend 3.6 hours consuming mobile media per day
Print 0.9 hr
Radio 1.5 hr
Computer 1.9 hr
TV 2.2 hr
Mobile 3.6 hr
The average mobile web user in the US consumes more mobile
media than any other type
10.1 HOURSof media per day
Source: US Mobile Media Consumption Study, InMobi, Feb 2014 Base: US Mobile Internet Users, n = 1012
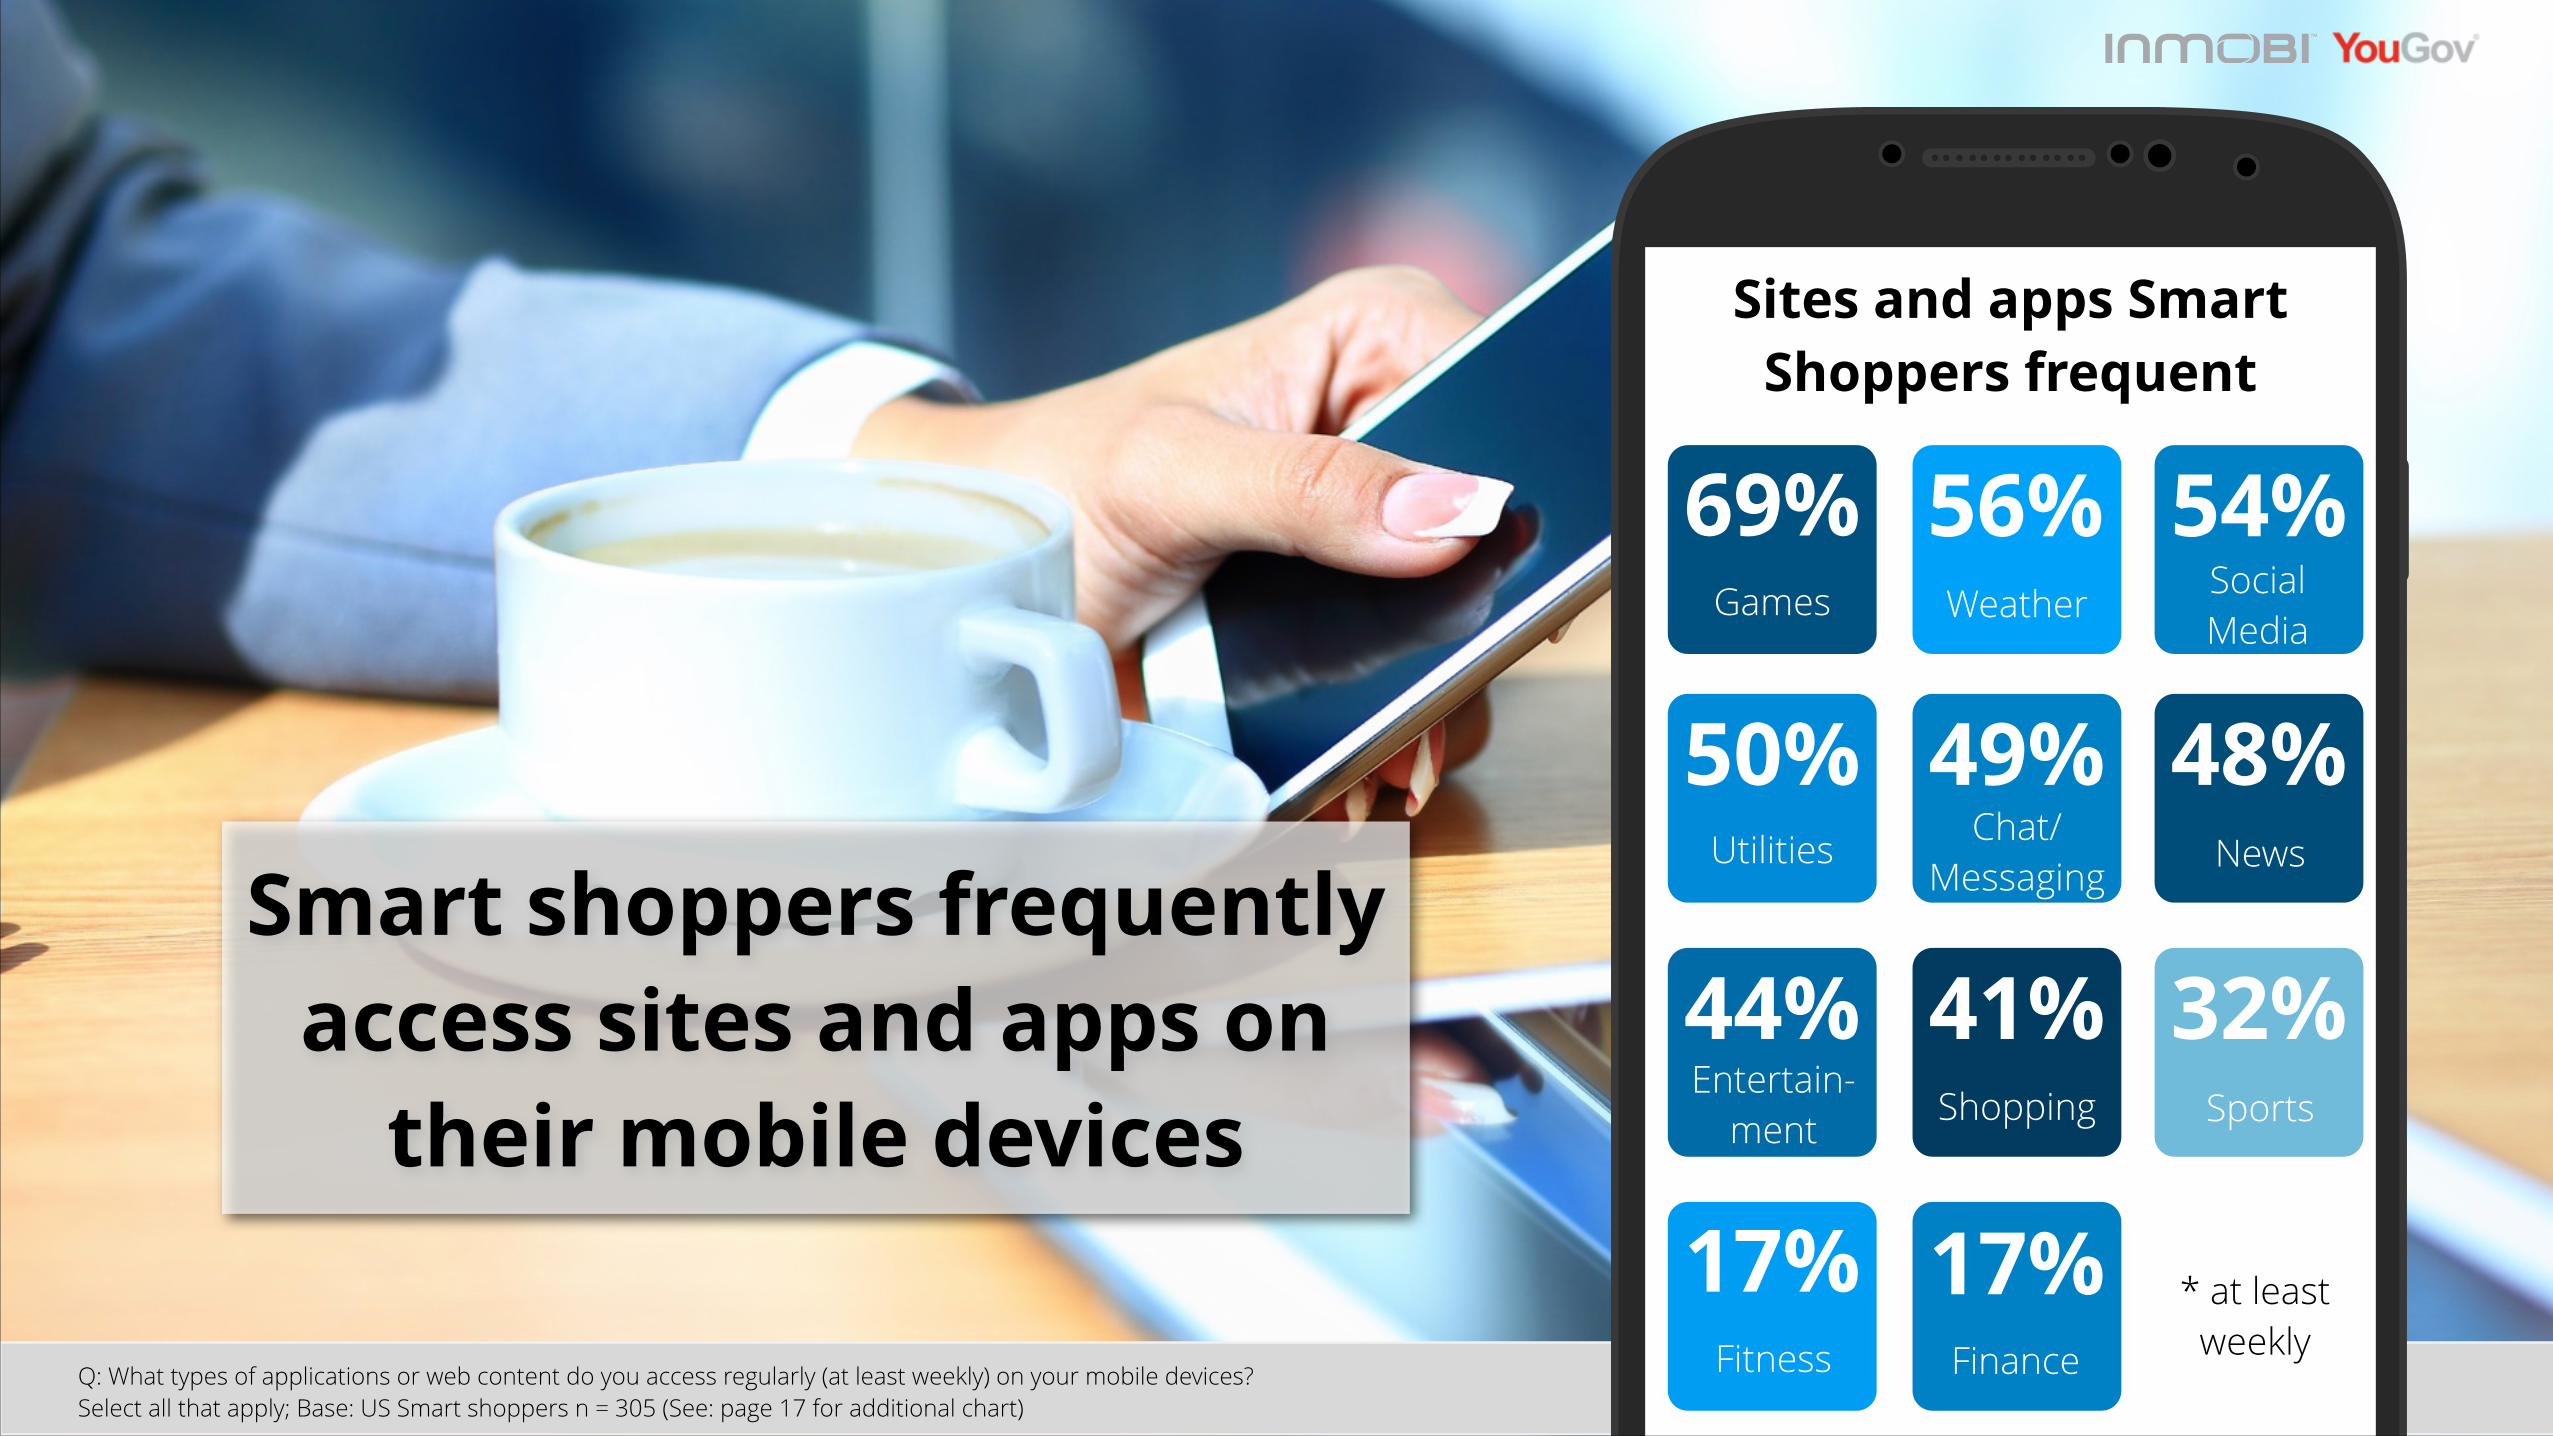
Sites and apps Smart Shoppers frequent
69% 56% 54%
50%
44%
17%
49% 48%
41%
17%
32%
Games Weather Social Media
Utilities
Entertain-ment
Fitness
Chat/ Messaging News
Shopping Sports
FinanceQ: What types of applications or web content do you access regularly (at least weekly) on your mobile devices? Select all that apply; Base: US Smart shoppers n = 305 (See: page 17 for additional chart)
Smart shoppers frequently access sites and apps on
their mobile devices* at least
weekly
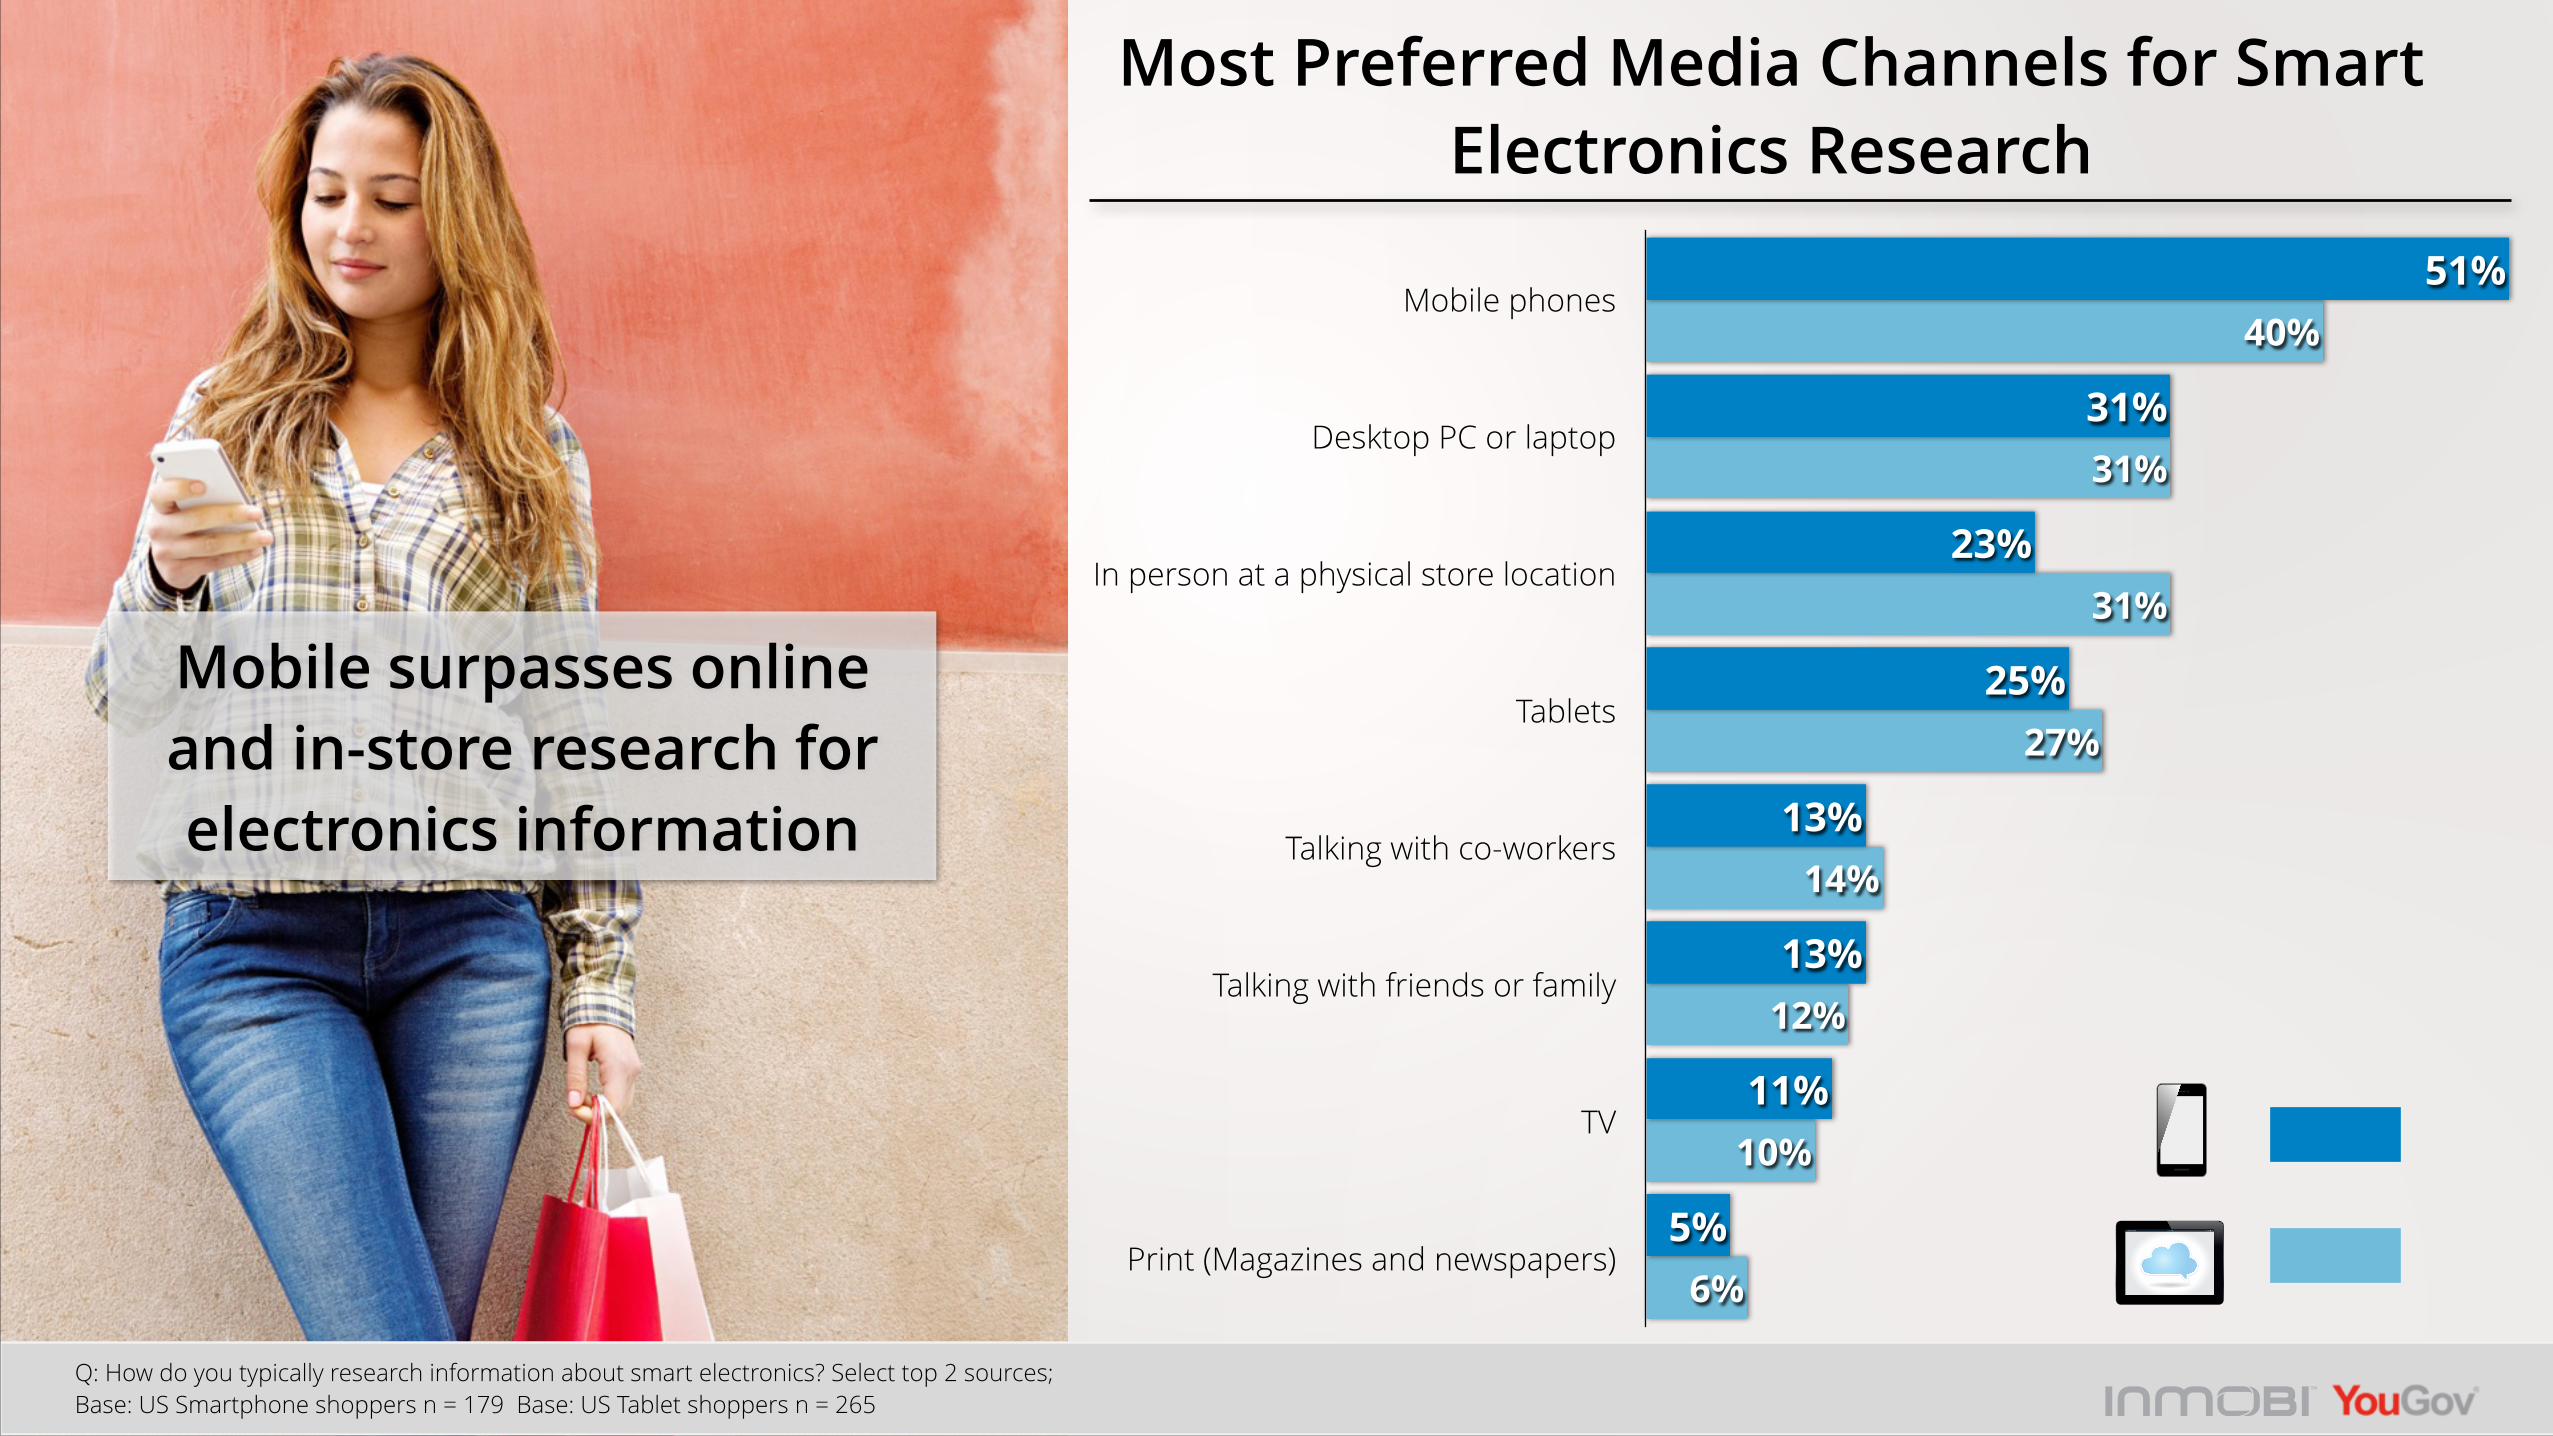
Mobile phones
Desktop PC or laptop
In person at a physical store location
Tablets
Talking with co-workers
Talking with friends or family
TV
Print (Magazines and newspapers)6%
10%
12%
14%
27%
31%
31%
40%
5%
11%
13%
13%
25%
23%
31%
51%
Most Preferred Media Channels for Smart Electronics Research
Mobile surpasses online and in-store research for electronics information
Q: How do you typically research information about smart electronics? Select top 2 sources; Base: US Smartphone shoppers n = 179 Base: US Tablet shoppers n = 265
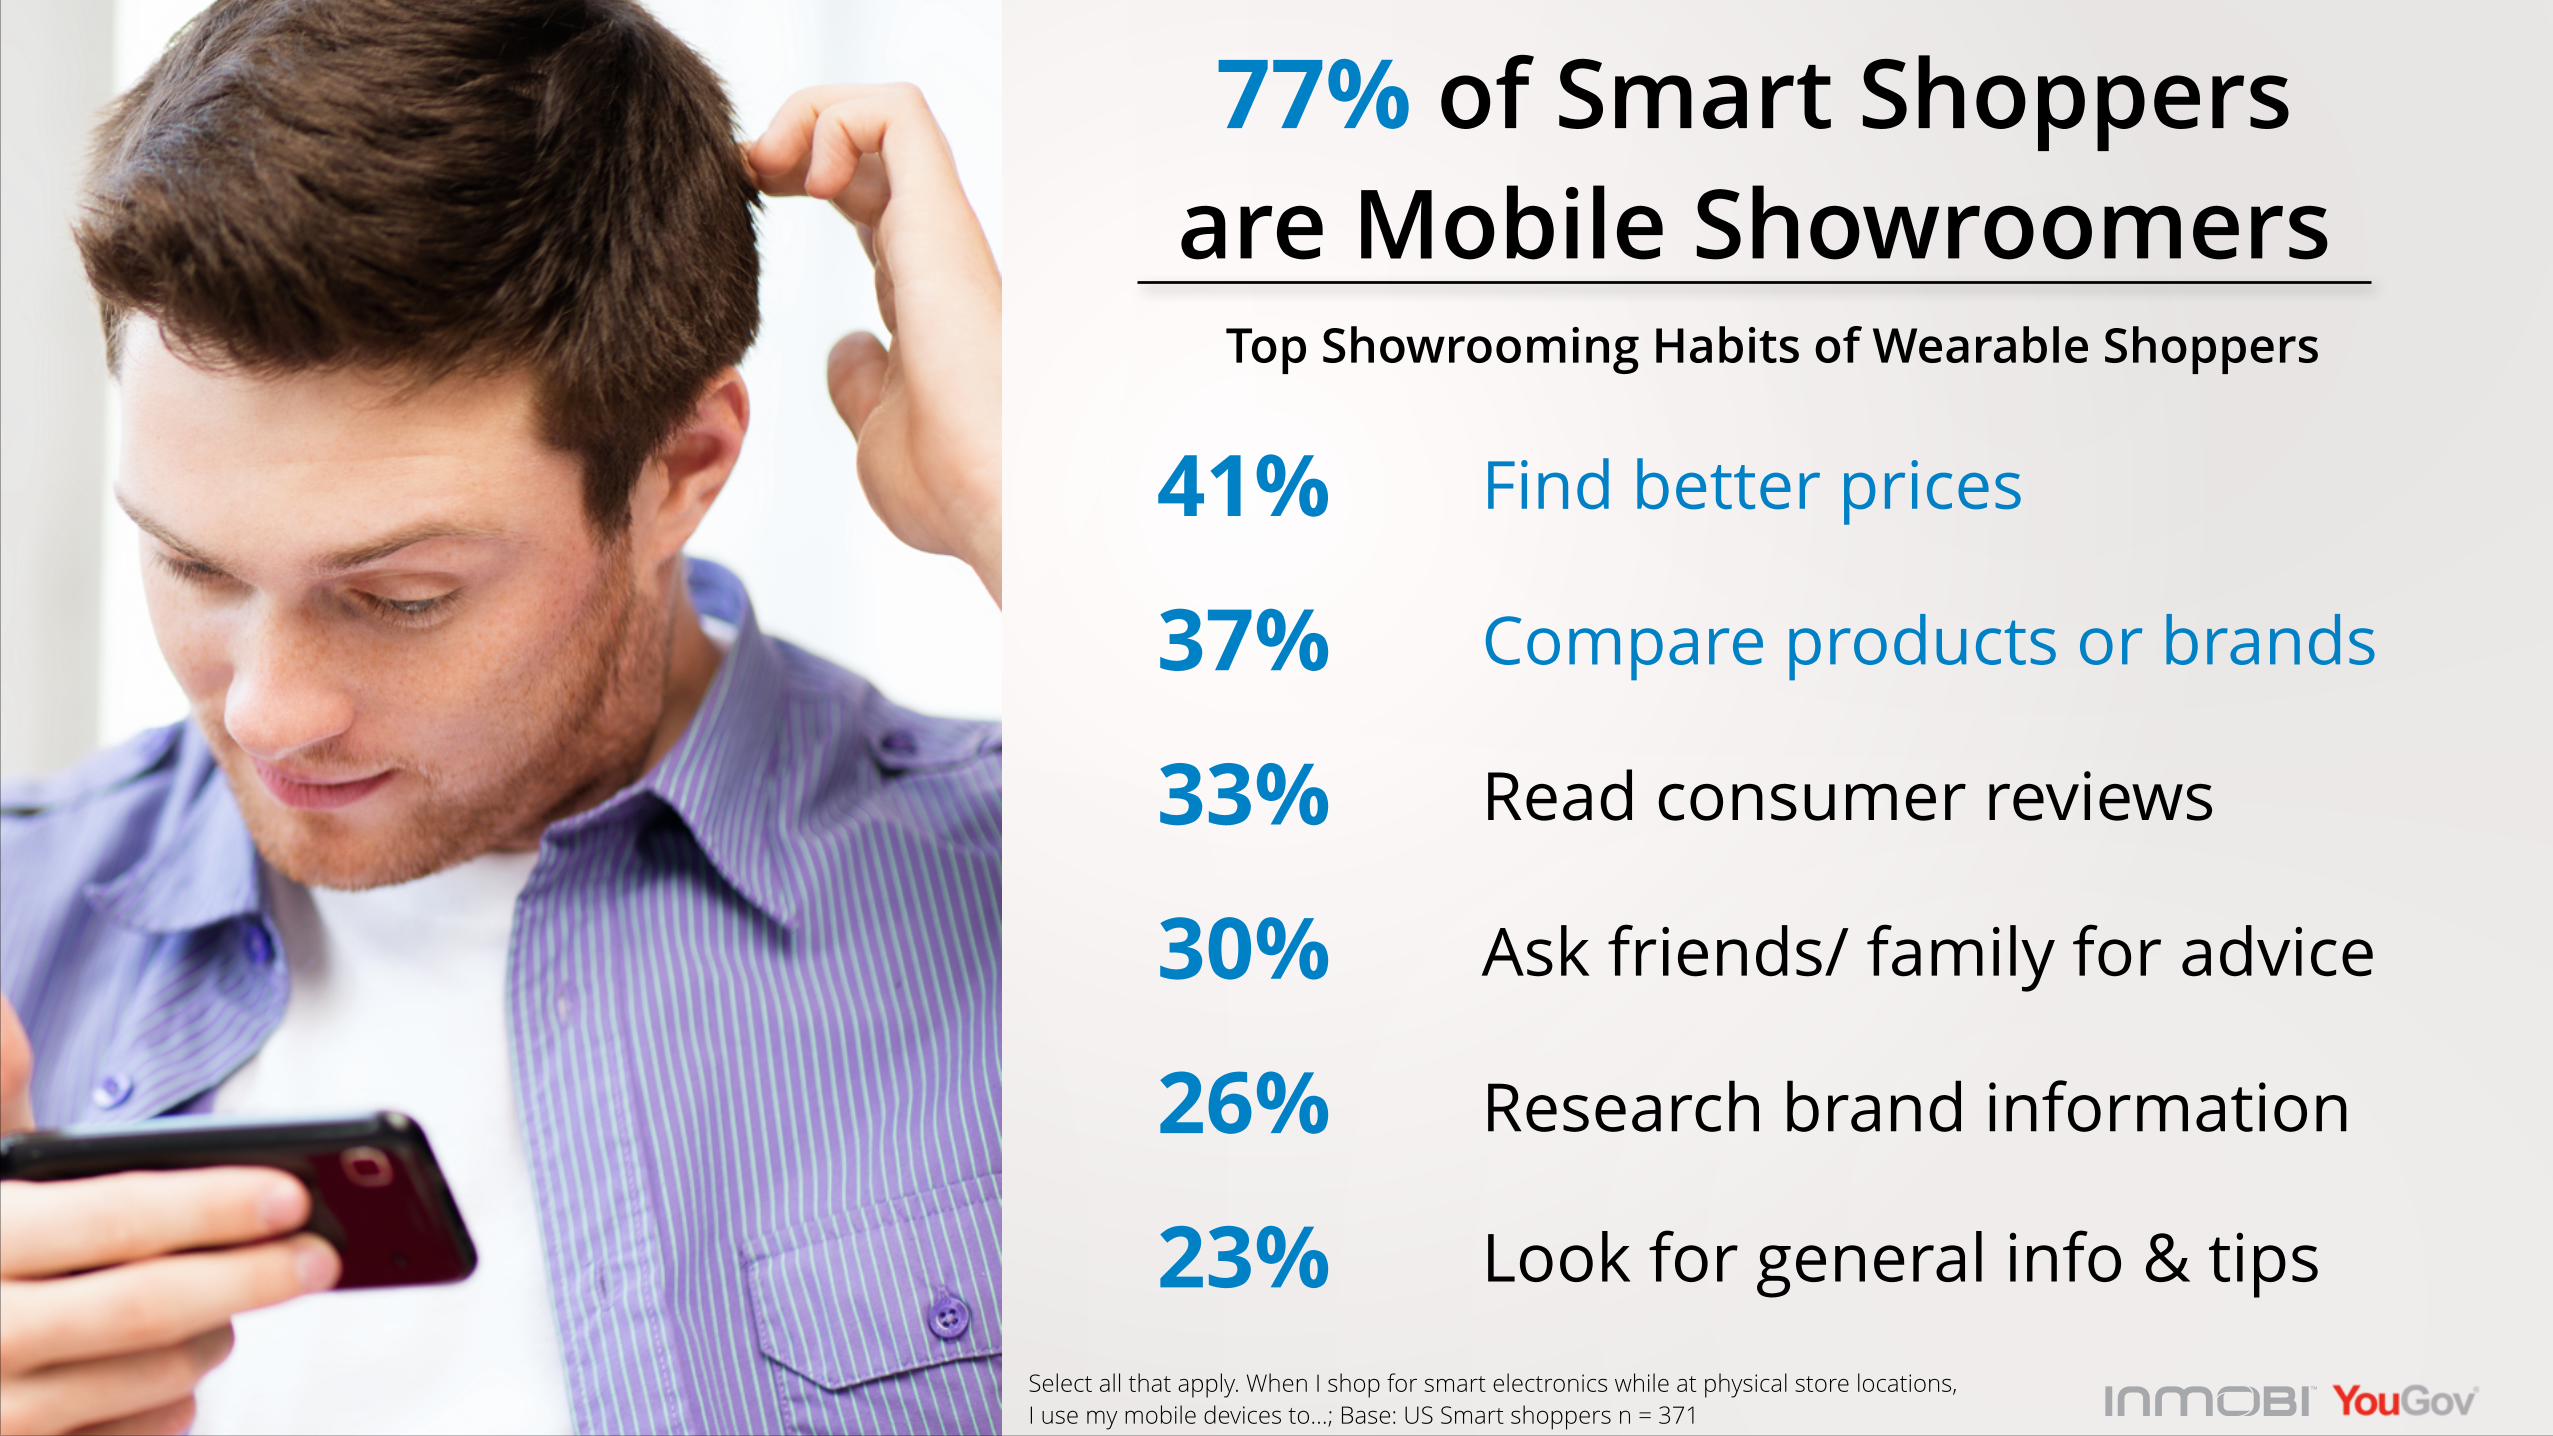
77% of Smart Shoppers are Mobile Showroomers
Top Showrooming Habits of Wearable Shoppers
41%
Select all that apply. When I shop for smart electronics while at physical store locations, I use my mobile devices to…; Base: US Smart shoppers n = 371
37%
33%
30%
26%
23%
Find better prices
Compare products or brands
Read consumer reviews
Ask friends/ family for advice
Research brand information
Look for general info & tips
Change Image

MOBILE AD RECEPTIVITY
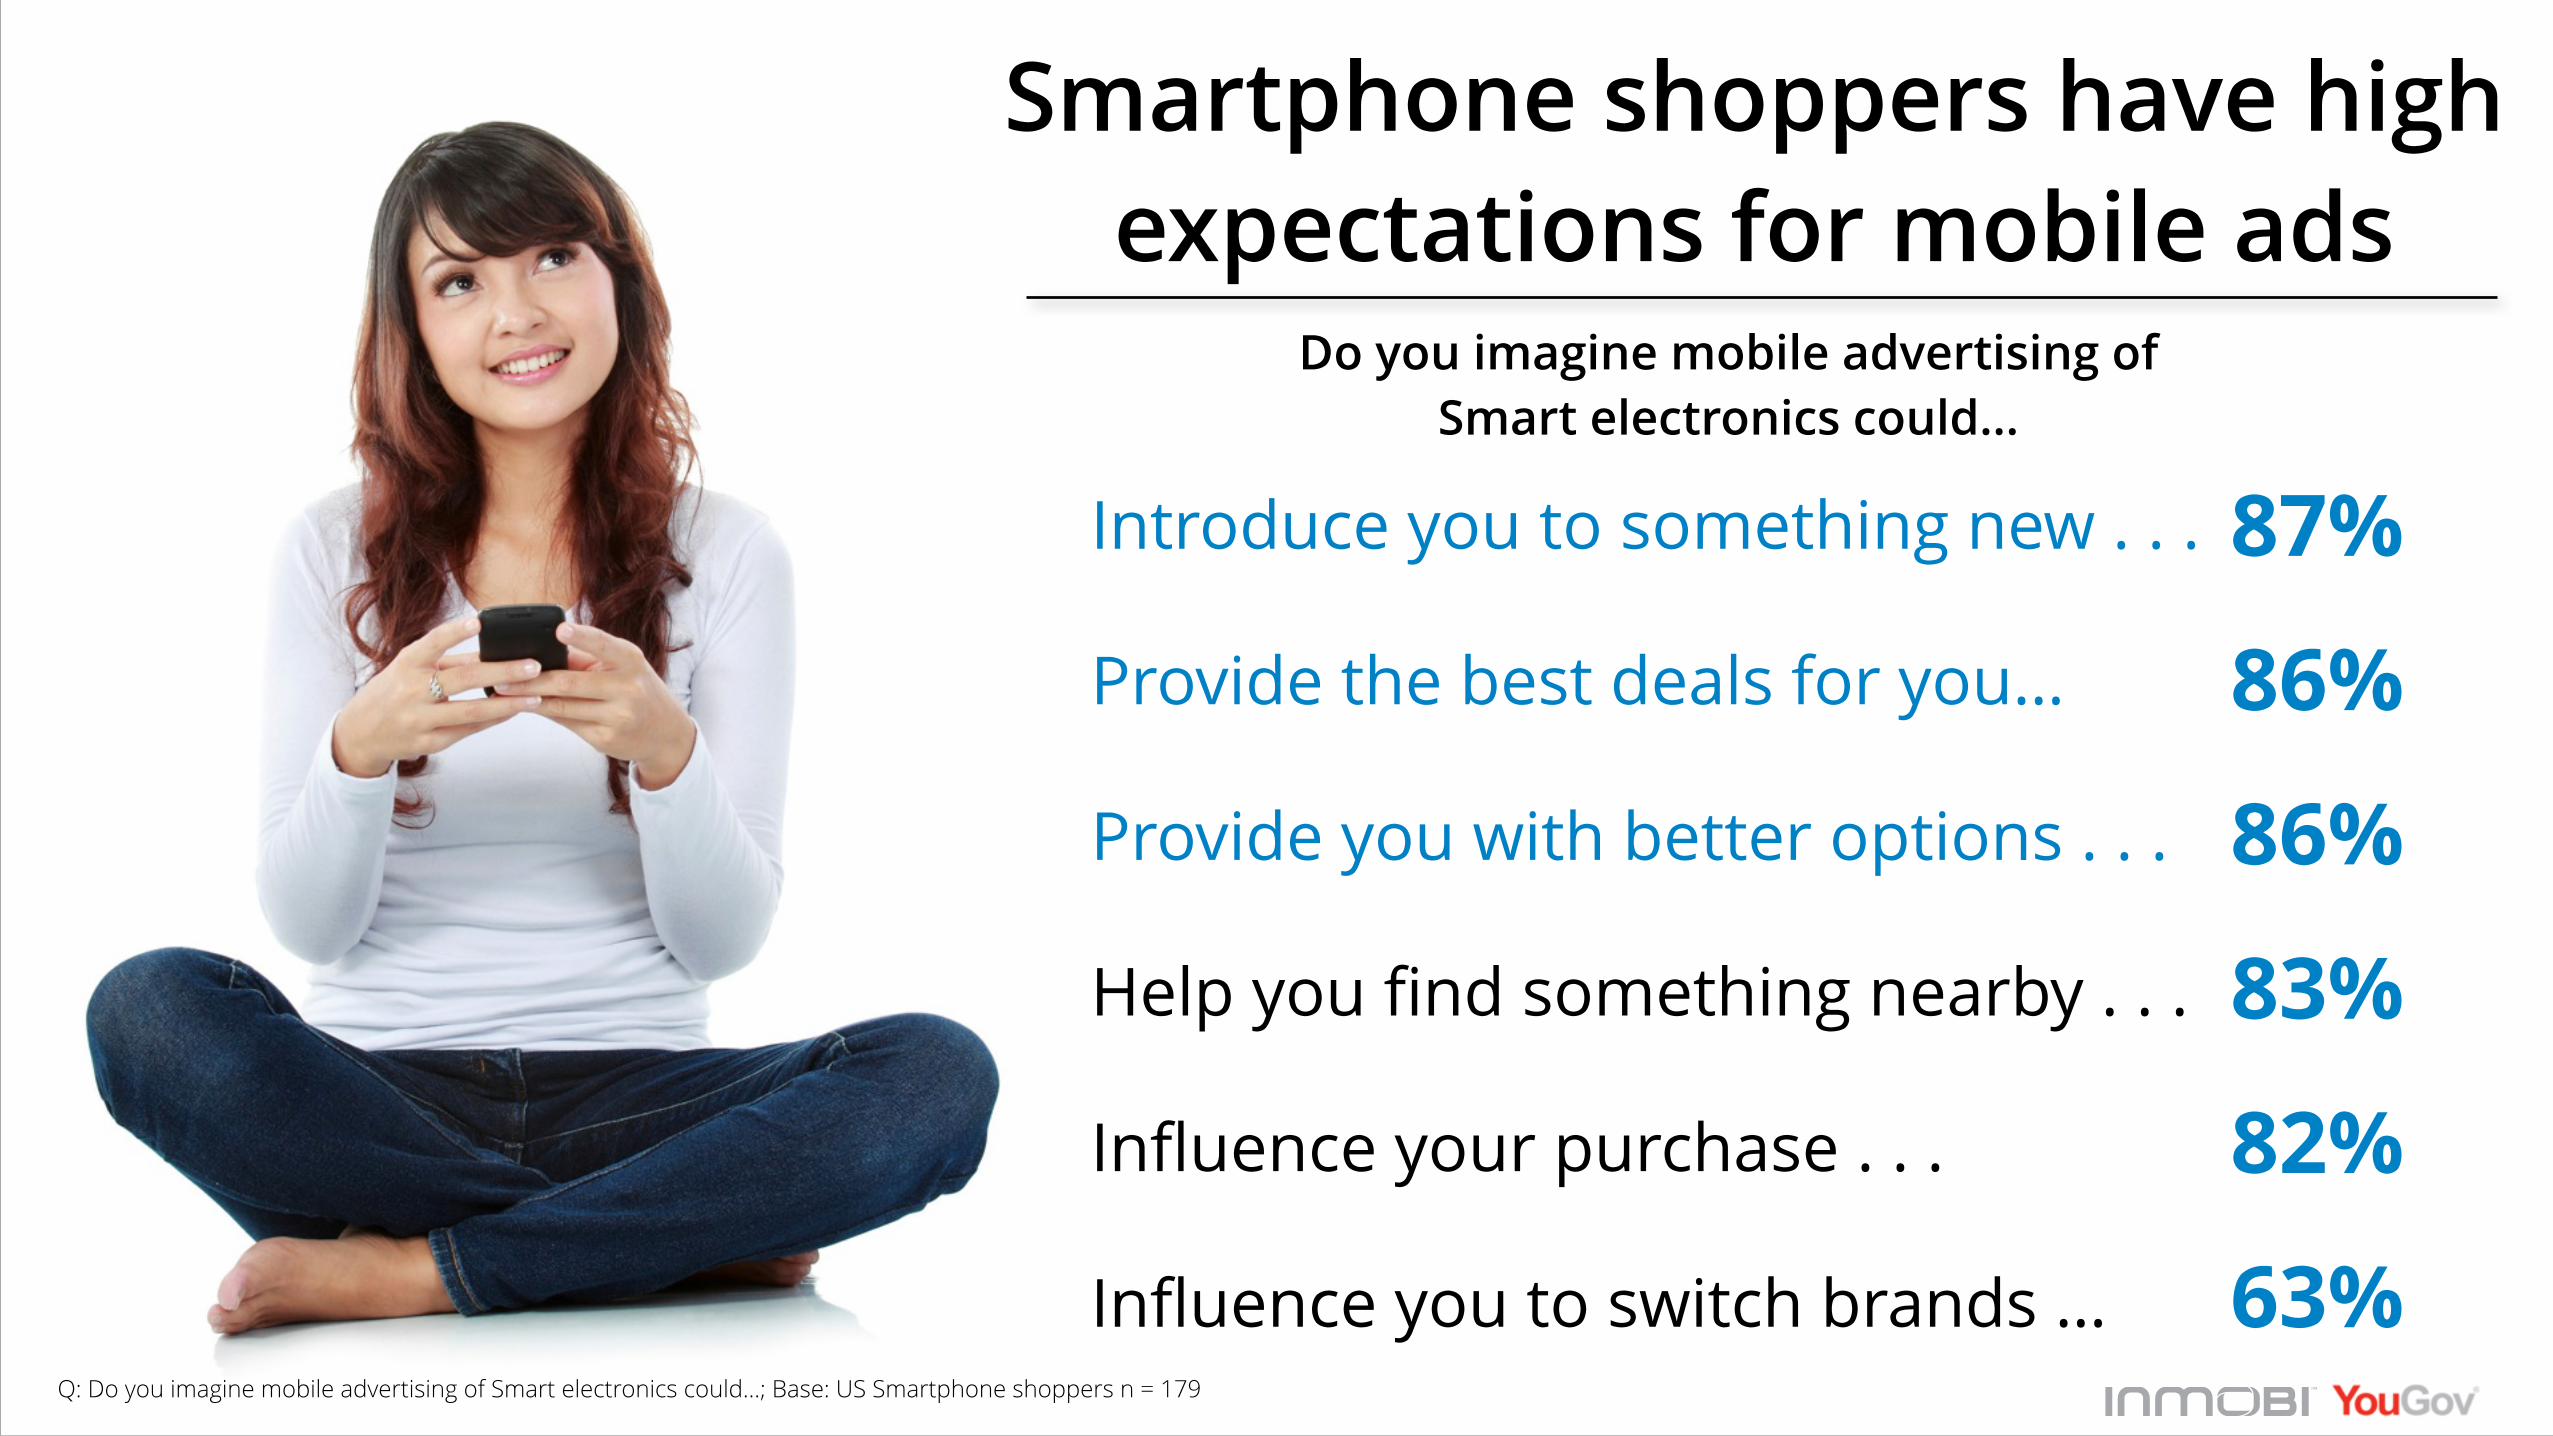
Smartphone shoppers have high expectations for mobile ads
87%
86%
83%
82%
86%
63%
Introduce you to something new . . .
Provide you with better options . . .
Help you find something nearby . . .
Influence your purchase . . .
Provide the best deals for you…
Influence you to switch brands …
Do you imagine mobile advertising of Smart electronics could...
Q: Do you imagine mobile advertising of Smart electronics could…; Base: US Smartphone shoppers n = 179
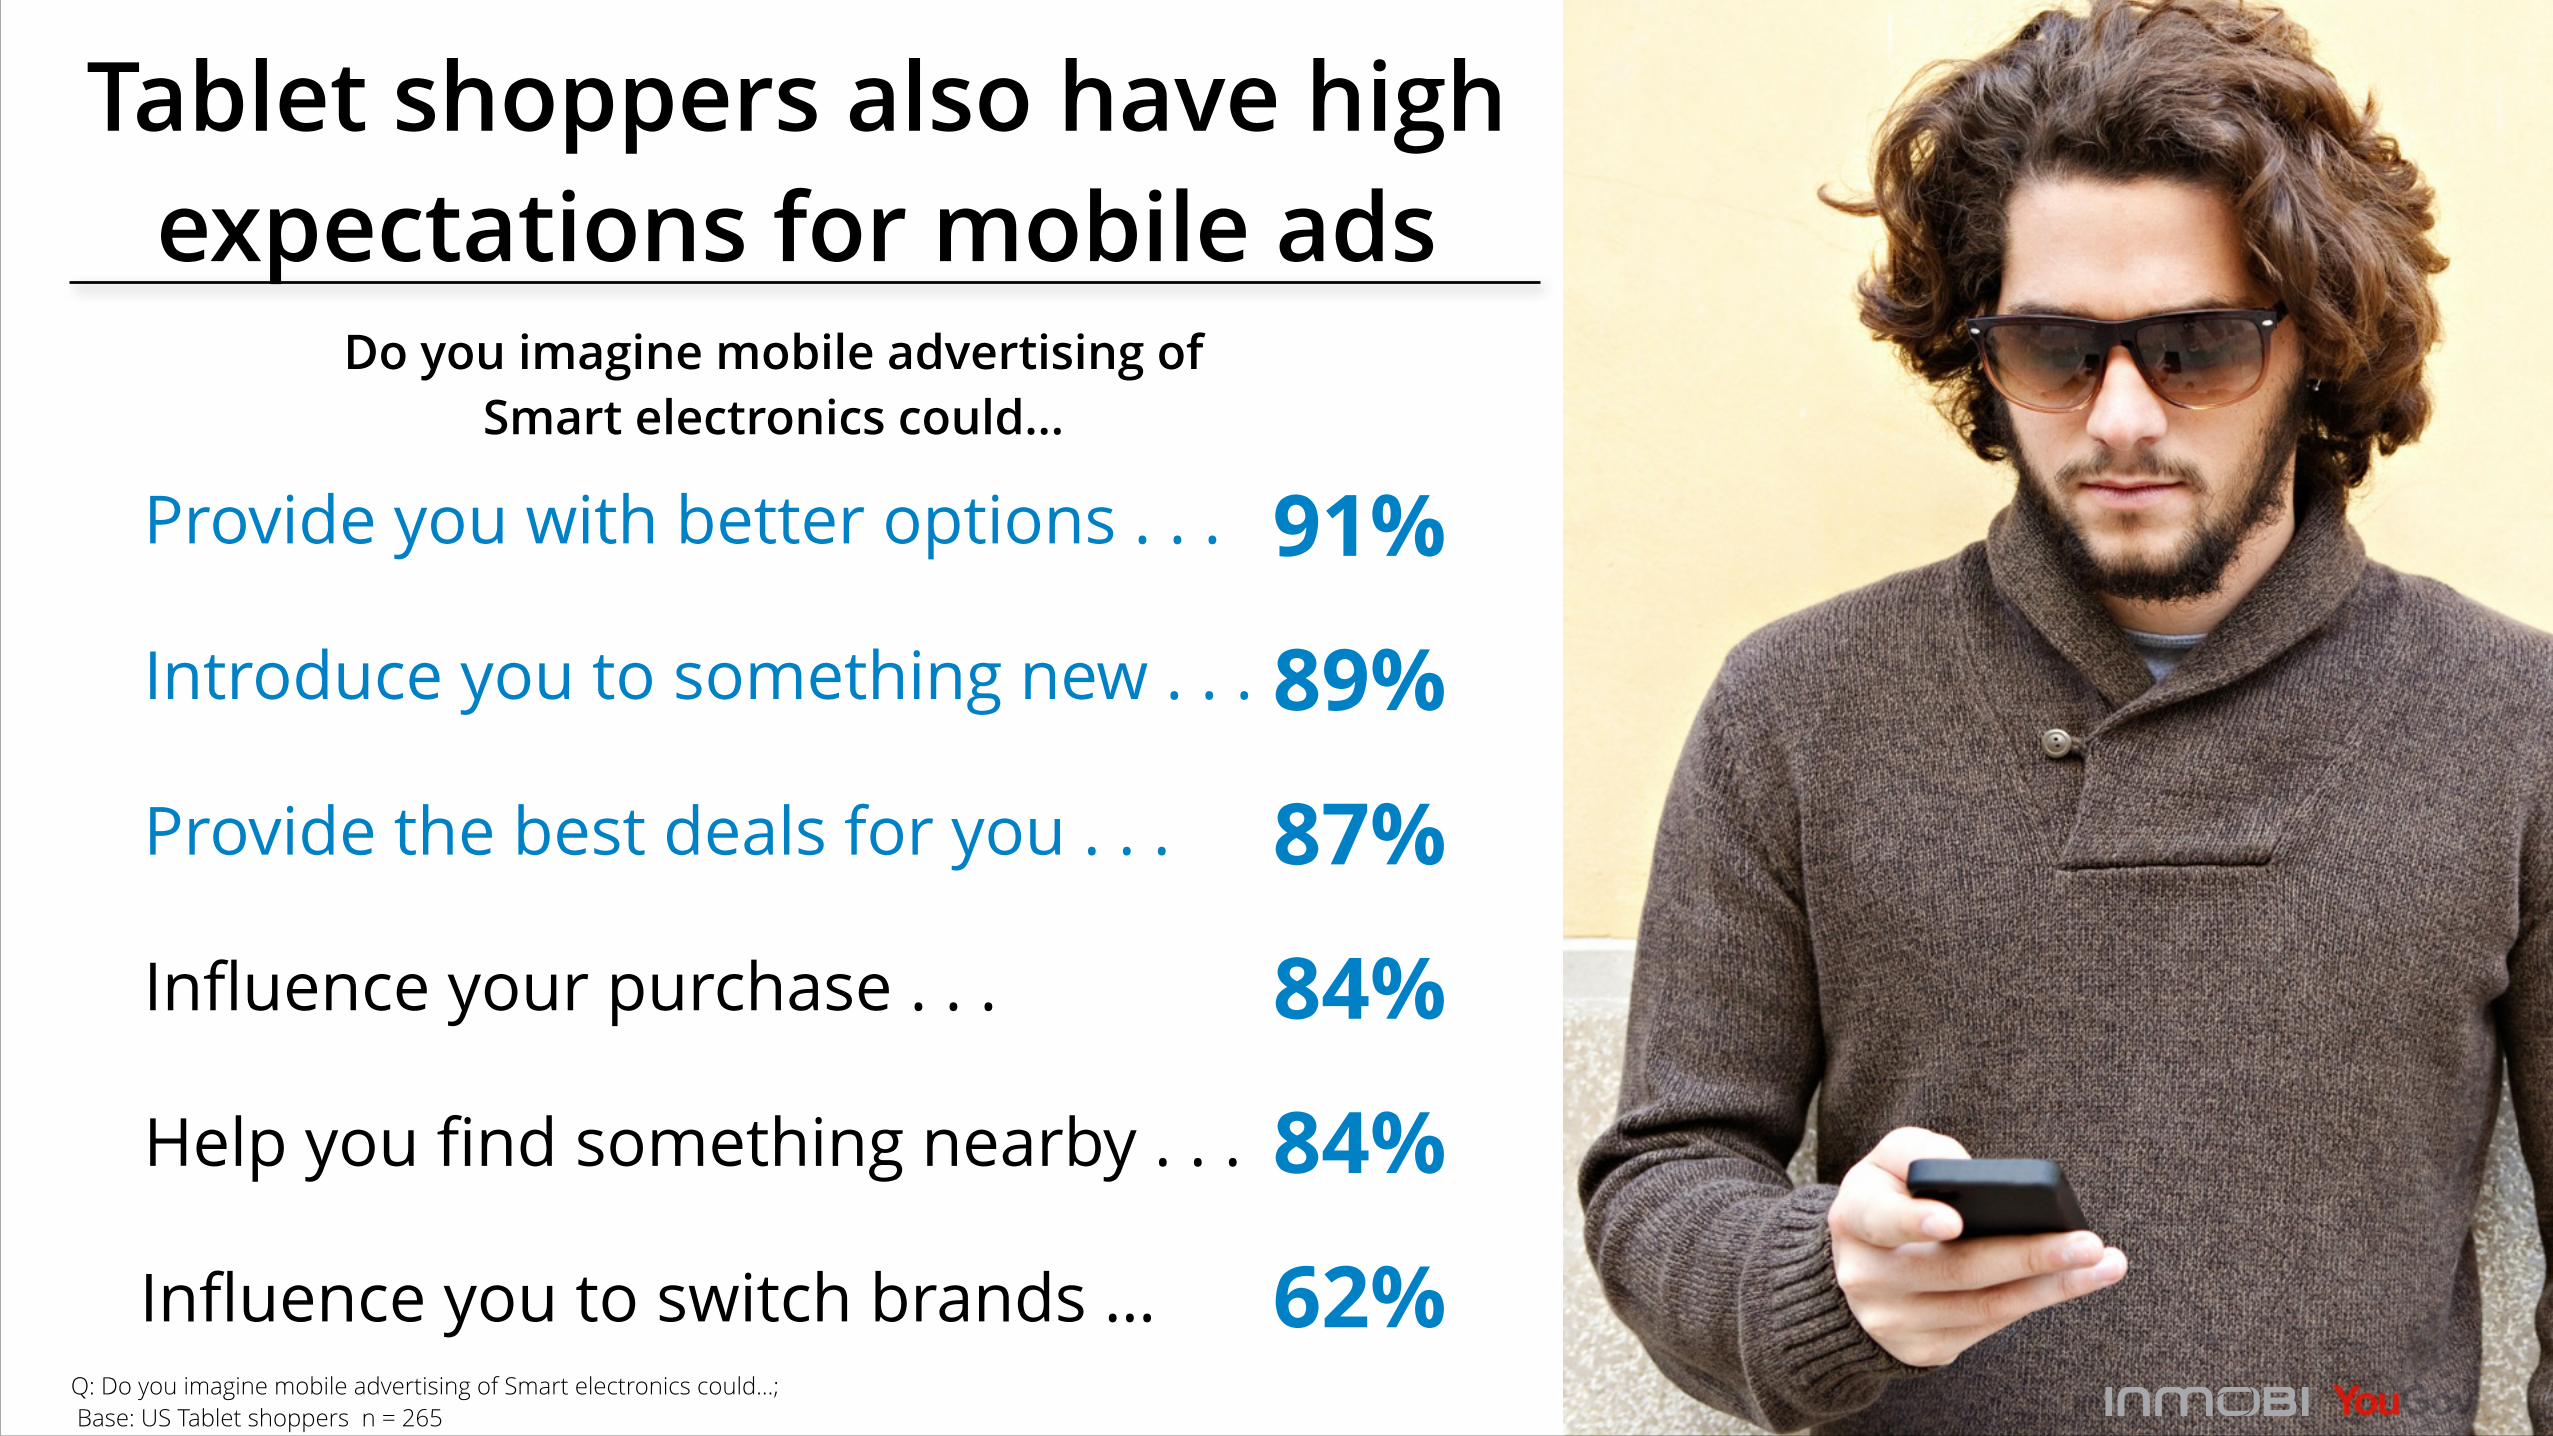
Tablet shoppers also have high expectations for mobile ads
91%
87%
84%
84%
89%
62%
Provide you with better options . . .
Provide the best deals for you . . .
Influence your purchase . . .
Help you find something nearby . . .
Introduce you to something new . . .
Influence you to switch brands …
Do you imagine mobile advertising of Smart electronics could...
Q: Do you imagine mobile advertising of Smart electronics could...; Base: US Tablet shoppers n = 265

PERSONAS

Male vs. Female Shoppers
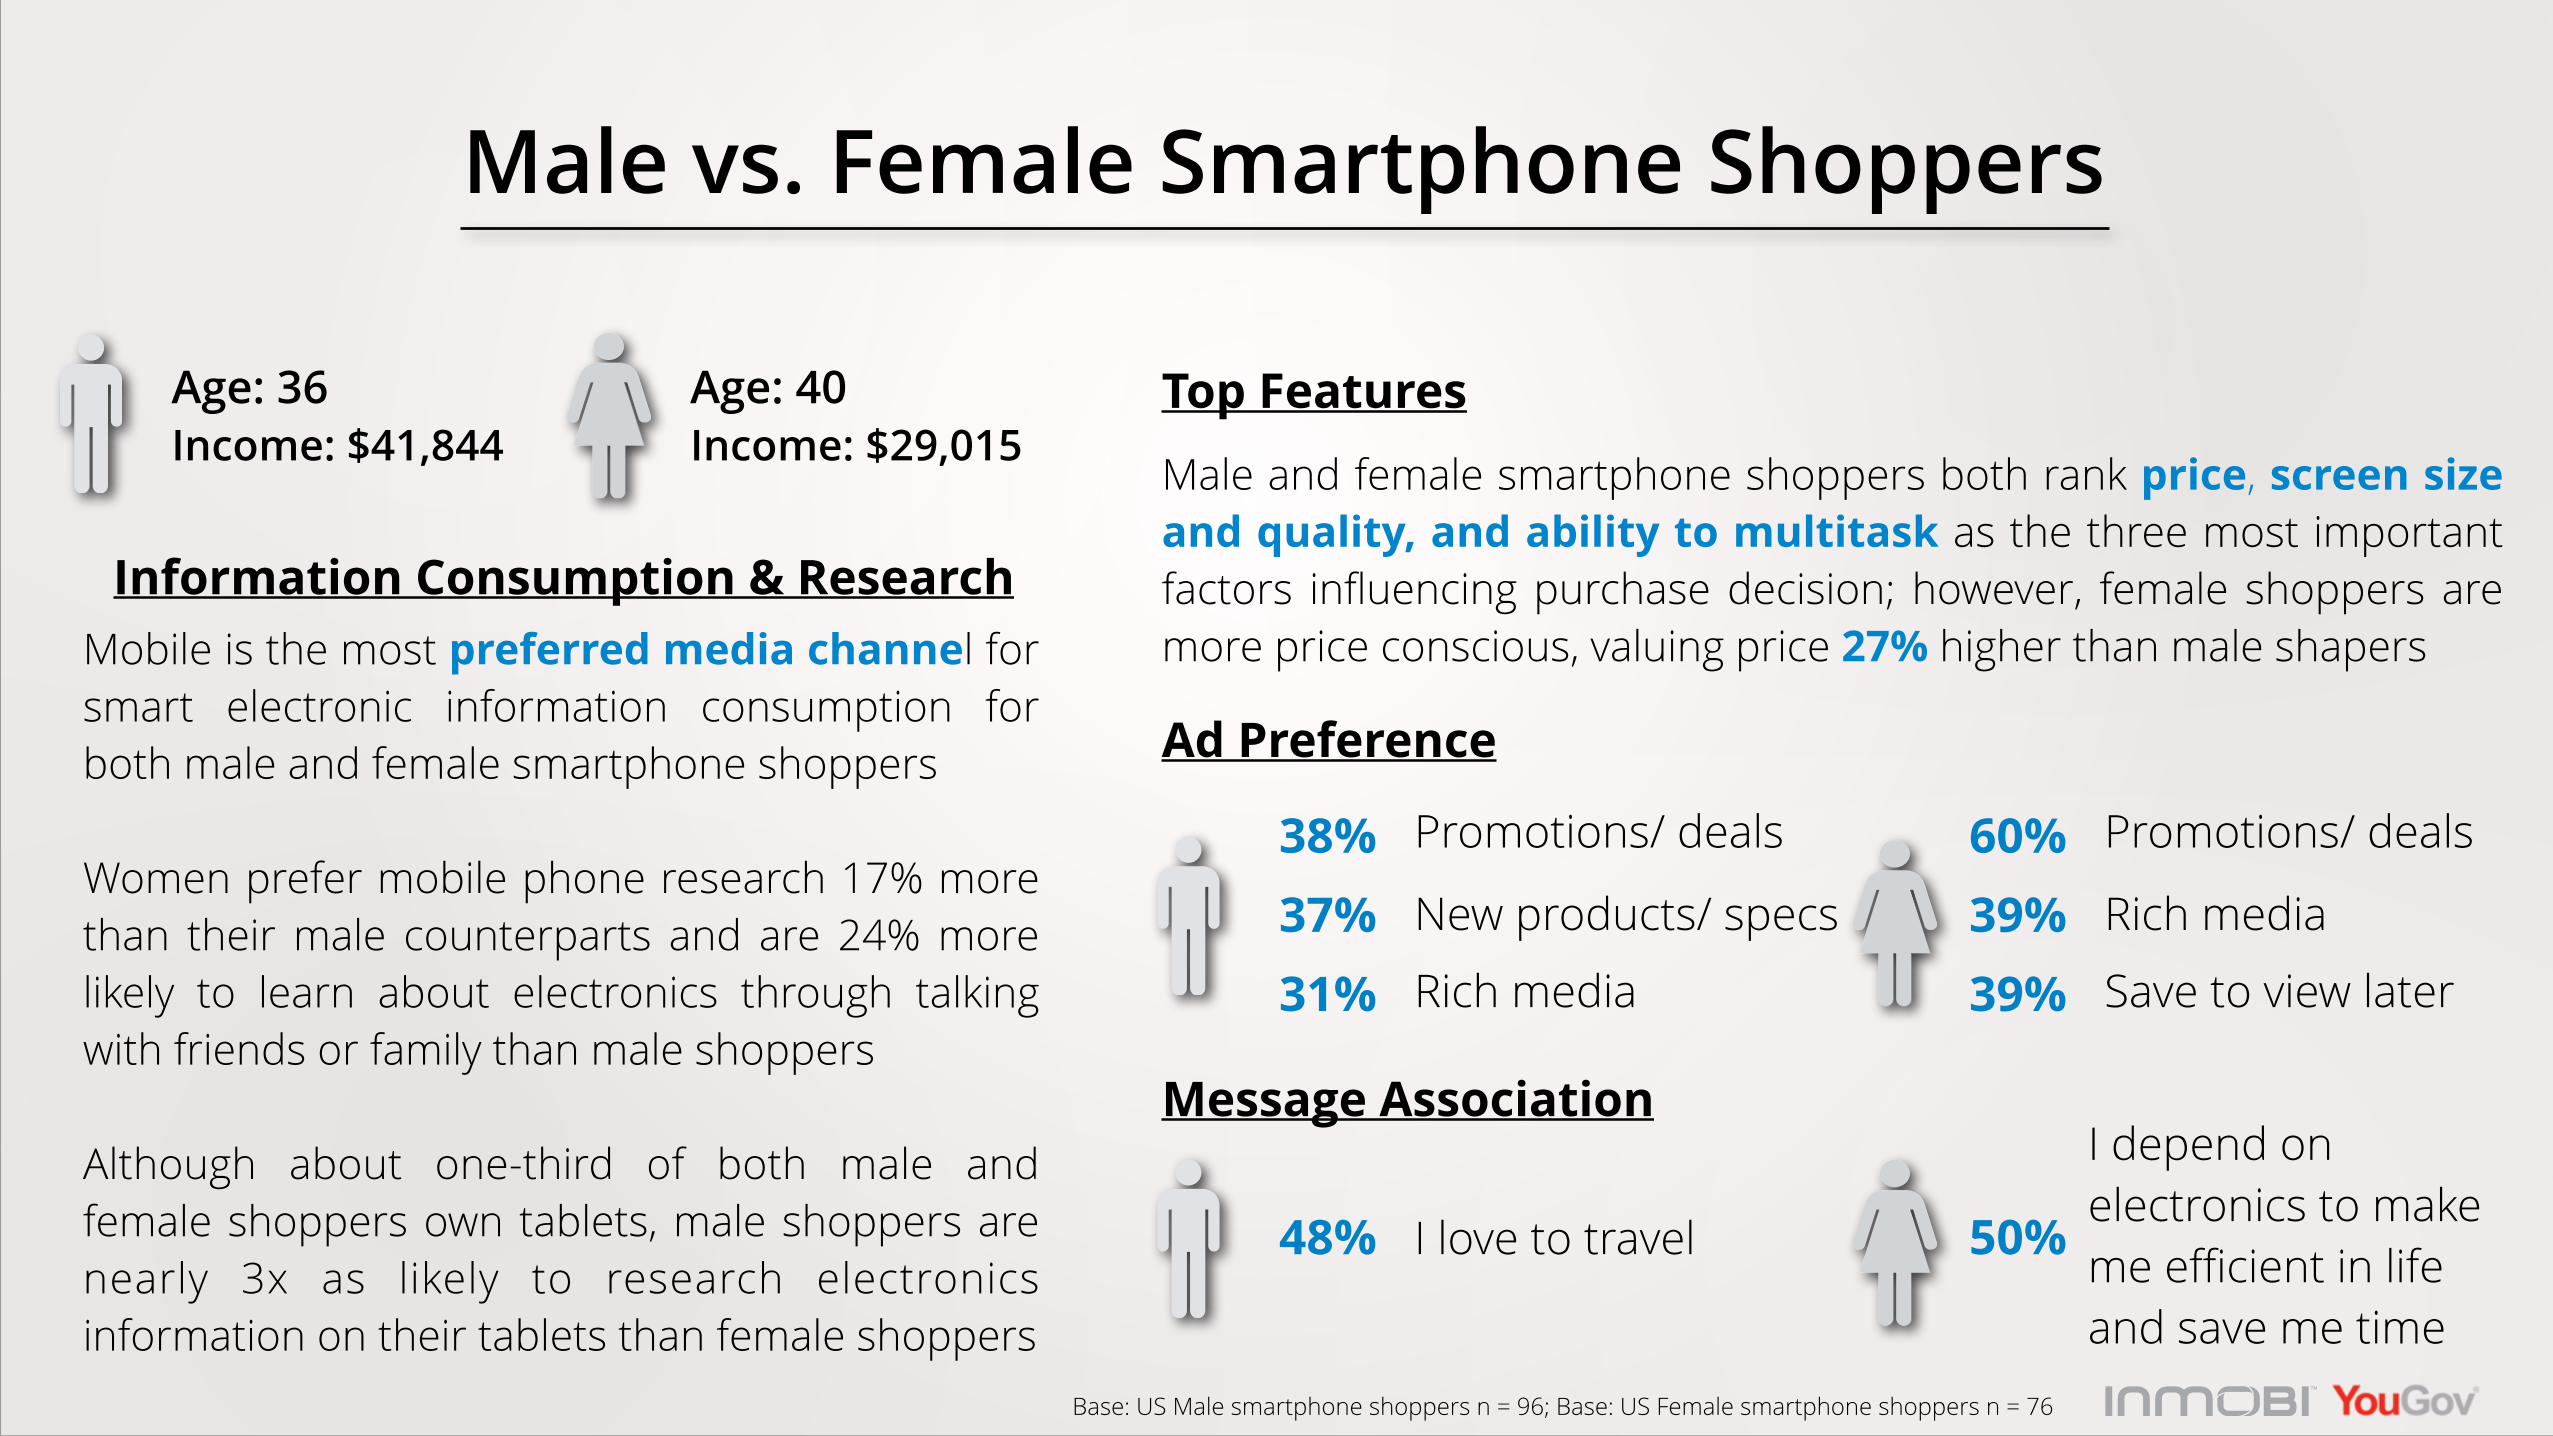
Male vs. Female Smartphone Shoppers
Top Features
Base: US Male smartphone shoppers n = 96; Base: US Female smartphone shoppers n = 76
Income: $41,844Age: 36
Income: $29,015Age: 40
Mobile is the most preferred media channel for smart electronic information consumption for both male and female smartphone shoppers !Women prefer mobile phone research 17% more than their male counterparts and are 24% more likely to learn about electronics through talking with friends or family than male shoppers !Although about one-third of both male and female shoppers own tablets, male shoppers are nearly 3x as likely to research electronics information on their tablets than female shoppers
Information Consumption & Research
!Male and female smartphone shoppers both rank price, screen size and quality, and ability to multitask as the three most important factors influencing purchase decision; however, female shoppers are more price conscious, valuing price 27% higher than male shapers
Ad Preference
New products/ specs
Promotions/ deals
Rich media
38%37%31%
Rich media
Promotions/ deals
Save to view later
60%39%39%
Message Association
I love to travel
I depend on electronics to make me efficient in life and save me time
48% 50%
Millennials vs. Baby Boomers
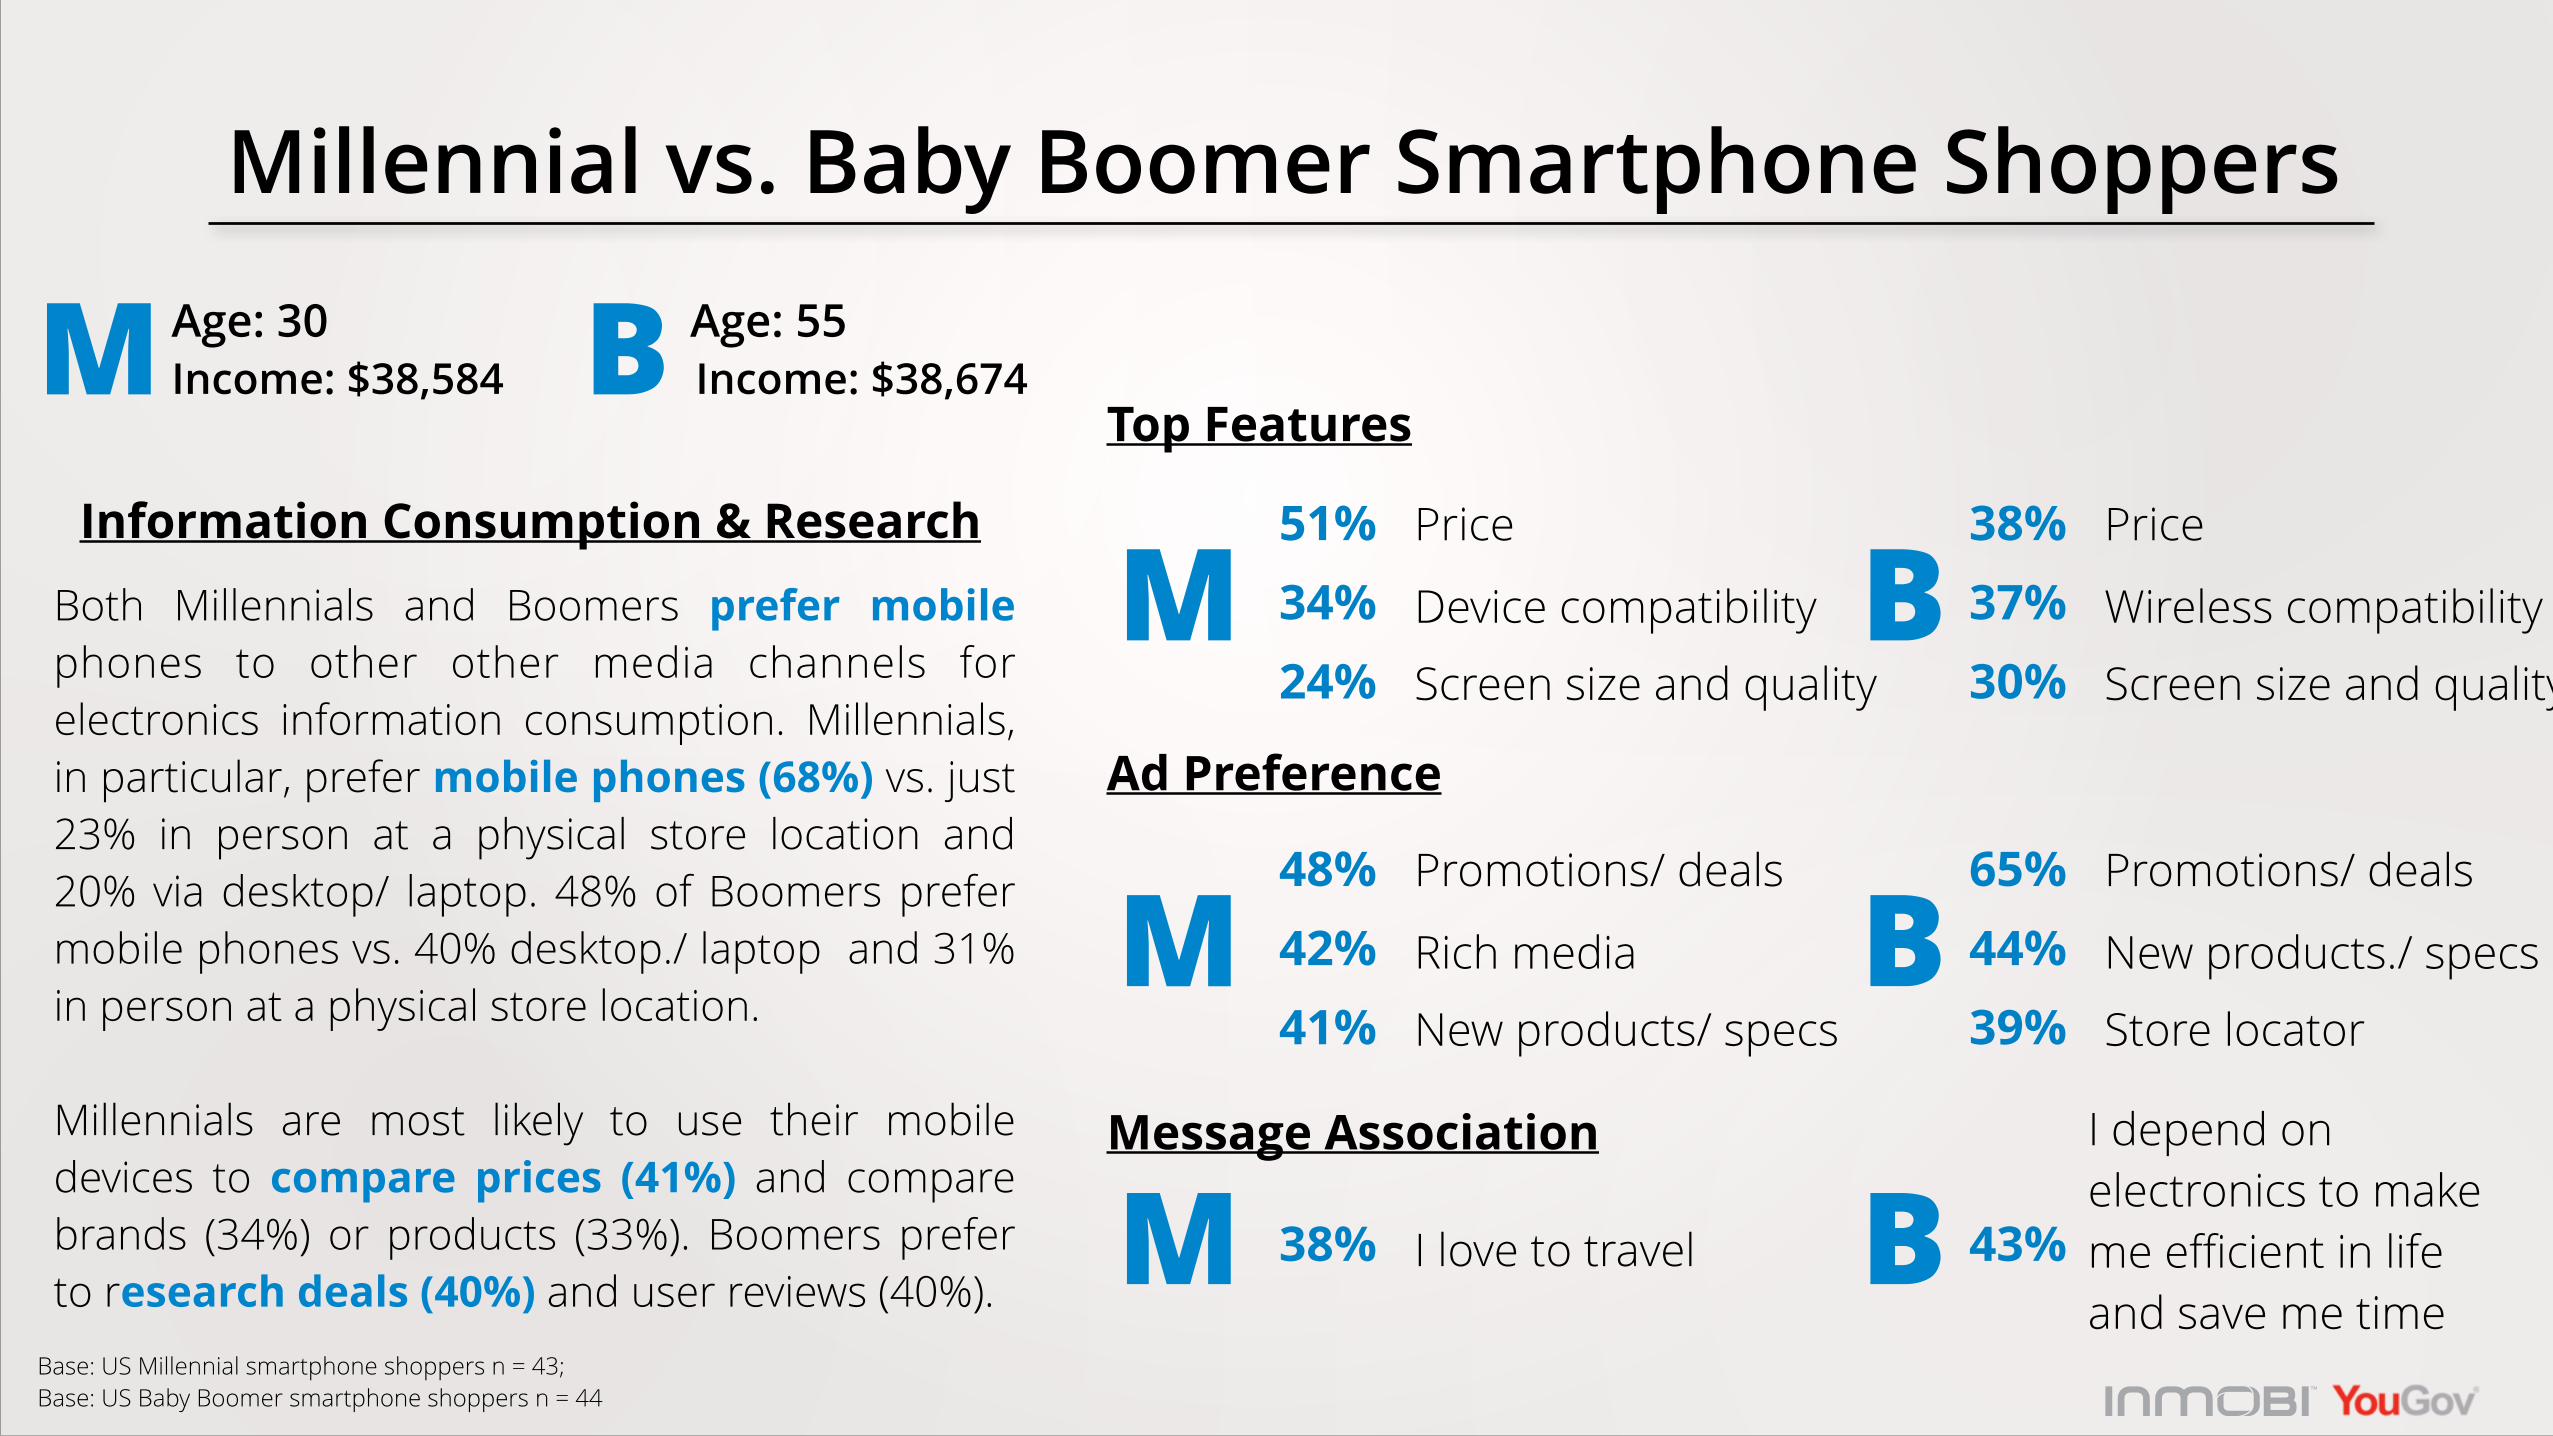
Millennial vs. Baby Boomer Smartphone Shoppers
Top Features
Age: 30 Age: 55
Both Millennials and Boomers prefer mobile phones to other other media channels for electronics information consumption. Millennials, in particular, prefer mobile phones (68%) vs. just 23% in person at a physical store location and 20% via desktop/ laptop. 48% of Boomers prefer mobile phones vs. 40% desktop./ laptop and 31% in person at a physical store location. !Millennials are most likely to use their mobile devices to compare prices (41%) and compare brands (34%) or products (33%). Boomers prefer to research deals (40%) and user reviews (40%).
Information Consumption & Research
Ad Preference
Rich media
Promotions/ deals
New products/ specs
48%42%41%
New products./ specs
Promotions/ deals
Store locator
65%44%39%
Message Association
I love to travel38% 43%
M B
Device compatibility
Price
Screen size and quality
51%34%24%
Wireless compatibility
Price
Screen size and quality
38%37%30%
M B
M
M
B
BI depend on electronics to make me efficient in life and save me time
Income: $38,584 Income: $38,674
Base: US Millennial smartphone shoppers n = 43; Base: US Baby Boomer smartphone shoppers n = 44

DOWNLOAD THE COMPLETE REPORT : CLICK HERE

THANK YOU
REACH US AT:
www.inmobi.com/insights
FOLLOW US ON:
twitter @inmobi
!
facebook.com/inmobi
!
linkedin.com/company/inmobi
!
www.slideshare.net/inmobi