Embed Size (px)
Citation preview
Marketers know we need to stop measuring our marketing performance in
terms of clicks, likes and shares. We know we’re performing when we generate
awareness, engage customers and produce outcomes (revenue, sales, leads,
customer sign-ups). But many of us still aren’t clear on exactly how to quantify
that performance. Funnel metrics are where that happens.
Most marketers are familiar with the purchase funnel, or buyer’s journey—a
simple marketing model that’s been in use for over 100 years. It says that from
the time a customer becomes aware of our products to the time they actually
purchase from us, they’re on a journey that can be divided into stages. From a
customer’s point of view, those stages (at their most basic) are 1) to become
aware of or consider a brand, 2) to choose to learn more, and 3) to decide to
purchase. More complex funnels can include more stages.
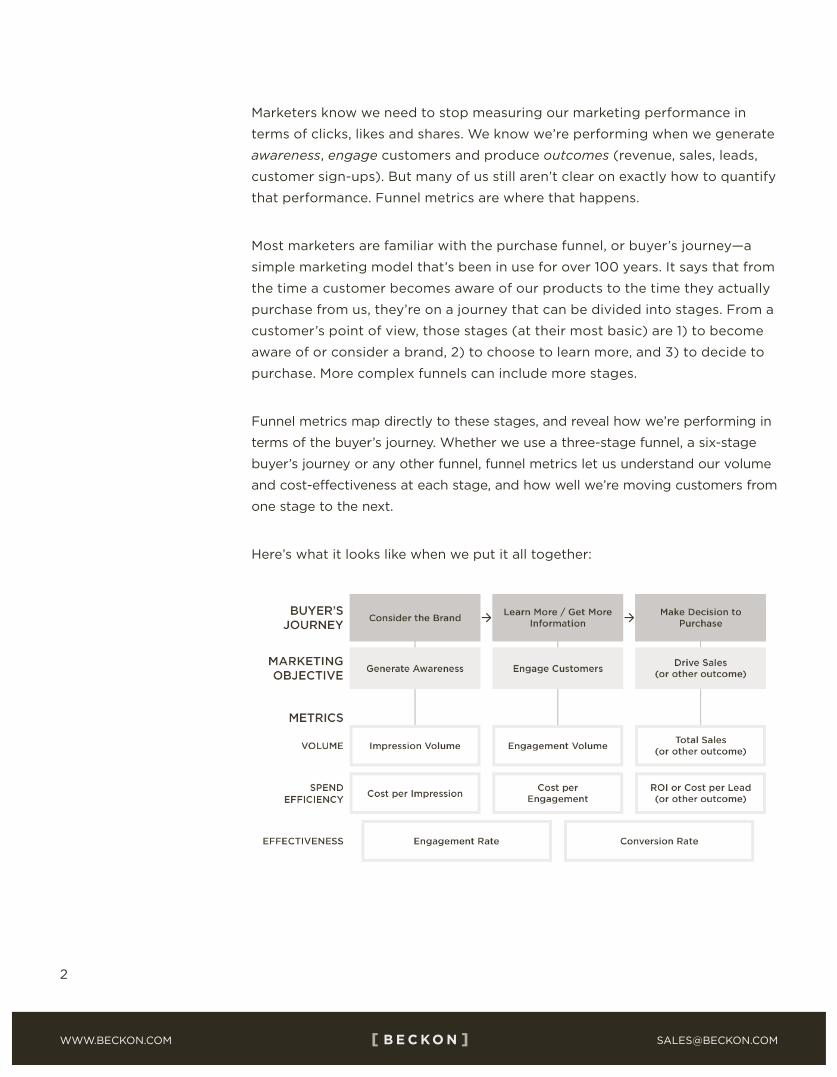
Funnel metrics map directly to these stages, and reveal how we’re performing in
terms of the buyer’s journey. Whether we use a three-stage funnel, a six-stage
buyer’s journey or any other funnel, funnel metrics let us understand our volume
and cost-effectiveness at each stage, and how well we’re moving customers from
one stage to the next.
Here’s what it looks like when we put it all together:
There are two main buckets of funnel metrics: effectiveness and efficiency.
Here are detailed descriptions of the key metrics that measure both, including
example calculations.
MARKETING FUNNEL EFFECTIVENESS METRICS
Funnel effectiveness metrics tell us how effectively our marketing messages,
offers and content are attracting and converting customers. They show us
where the obstacles lie—which stages of the funnel are experiencing problems.
Importantly, funnel effectiveness metrics let us quantify marketing performance,
helping us make data-driven decisions instead of just relying on intuition or gut
feeling.
We’ll start with the volume metrics: top-of-the-funnel awareness, mid-funnel
engagement and bottom-of-the-funnel outcomes. Think of outcomes as what
you and the business decide you’re driving—leads, sales and customer lifetime
value are common.
Awareness
[impression volume]
Have we reached a lot of people, or just a few? On which campaigns or content
themes have we doubled down? How many impressions have we created in the
UK versus the US? How does this year’s volume of impressions compare to last
year’s?
Awareness, measured as impression volume, is a top-of-the-funnel metric that
shows how many people our messages have reached. Impressions are a mainstay
metric for online display media, meaning “ads served”. But if we instead think
about impressions as an abstract concept used consistently across every channel,
the metric becomes very powerful. Email has “impressions” as well, but it’s
not “number of emails sent”—those aren’t eyeballs on emails. Rather, the best
impressions number for email is the number of emails opened (showing that
someone actually read or at least glanced at that content). In this way, every
channel can have an impression volume metric.
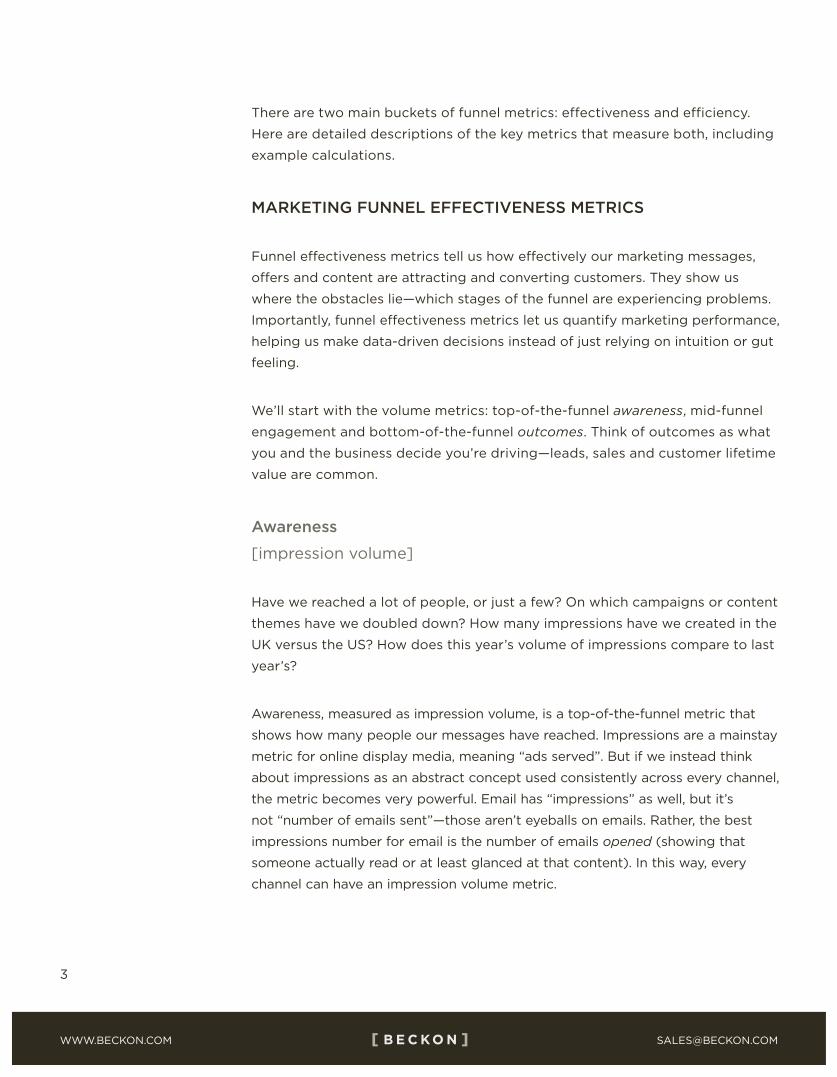
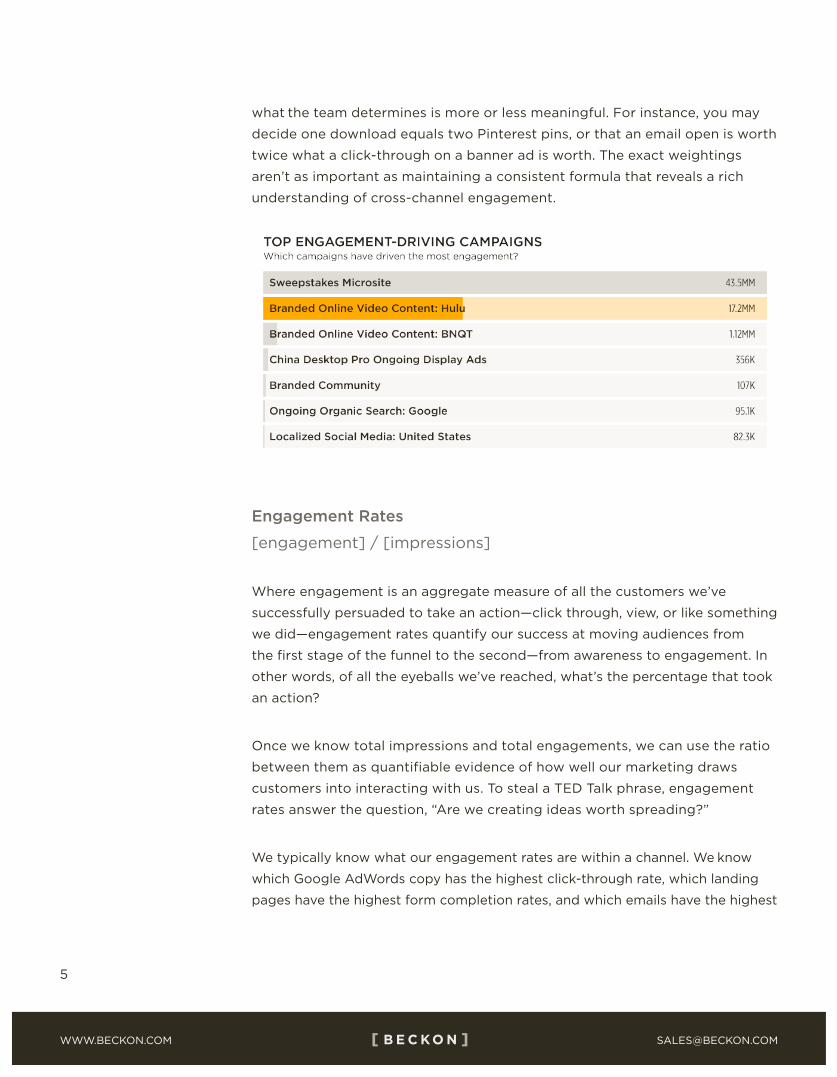
We also want to track impression volume per program, campaign and any other
segments the business reports on, like geography, product or customer type.
And then we can answer questions like, What’s driving the most impressions for
us? What was the breakdown of impressions served? How are the total number
of impressions trending over time?
Engagement
[sum of total engagements (weighted or not)]
When we buy a lot of eyeballs, we’ve invested in the first stage of the funnel:
awareness. Presumably, our efforts there have made plenty of people aware
of our product or brand. But are they clicking, liking, retweeting, downloading,
signing up, visiting our website or taking any other action? Engagement is
a middle-of-the-funnel metric that tracks whether our target audience is
taking action. We’ll also want to know that by campaign, channel, region, etc.,
depending on how the company reports results.
Engagement is an aggregate metric. We want to total up all the metrics that
represent actions initiated by an end user—all the signs that they interacted
with our content and/or chose to learn more. This total engagement number
can be a simple sum of likes, clicks, opens, views, downloads, pins, video views
and so on—and this is what we recommend for any marketing department
just starting out on the measurement journey. For more advanced marketing
departments, each component of engagement can be weighted according to
what the team determines is more or less meaningful. For instance, you may
decide one download equals two Pinterest pins, or that an email open is worth
twice what a click-through on a banner ad is worth. The exact weightings
aren’t as important as maintaining a consistent formula that reveals a rich
understanding of cross-channel engagement.
Engagement Rates
[engagement] / [impressions]
Where engagement is an aggregate measure of all the customers we’ve
successfully persuaded to take an action—click through, view, or like something
we did—engagement rates quantify our success at moving audiences from
the first stage of the funnel to the second—from awareness to engagement. In
other words, of all the eyeballs we’ve reached, what’s the percentage that took
an action?
Once we know total impressions and total engagements, we can use the ratio
between them as quantifiable evidence of how well our marketing draws
customers into interacting with us. To steal a TED Talk phrase, engagement
rates answer the question, “Are we creating ideas worth spreading?”
We typically know what our engagement rates are within a channel. We know
which Google AdWords copy has the highest click-through rate, which landing
pages have the highest form completion rates, and which emails have the highest
open rates. As omnichannel marketers we want cross-channel insight—what’s
engaging our customers best across it all? For that we need a normalized,
apples-to-apples metric. The way we get it is to describe engagement as a
percentage of impressions. By creating a universal engagement-rate metric, we
can compare channels and tactics to each other to evaluate things like:
1 Content interest and velocity. What do our customers care about more: helpful
hints for using our products, or discount offers? What types of content do
our customers most like to share: product photos, stories about corporate
responsibility, or funny videos? The content with the highest engagement rate
provides the answer.
2 Channel velocity. Which channels are truly engaging our target customers? Look
to the engagement rate by channel.
3 Audience engagement. Which audience resonates more with our message:
working moms or college students? Look at the engagement rate for content
run in mom-audience networks and compare that to the engagement rate when
that same content is run on sites targeted at college students, and you’ll know.
Outcomes
[lead volume, customers acquired, sales revenue]
Outcomes are the last stage of the funnel. They quantify the business
results we’ve driven. As marketing leaders are held more accountable for
bottom-of-the-funnel outcome metrics—things that translate easily to business
value—they’re increasingly asked to “sign up for a number” just like chief
revenue officers or SVPs of sales do when they take on a quota. For marketers,
that “number” might be in dollars and might not. Those of us responsible
for e-commerce certainly have a dollar figure to hit. For B2B marketers, that
“number” might be qualified leads.
Whether or not we’re responsible for any specific outcome (for example, 10,000
leads per year), most of us are at least expected to show constant improvement
(say, grow lead flow by 10%). Once we get a good sense of outcome metrics and
establish a baseline, setting targets or goals for the team is the likely next step.
Like all other funnel metrics, we need to be able to look at outcomes by channel
and campaign as well as region, segment, line of business and any other way our
business reporting is organized.
Conversion Rates
[outcomes] / [impressions]
[outcomes] / [engagement]
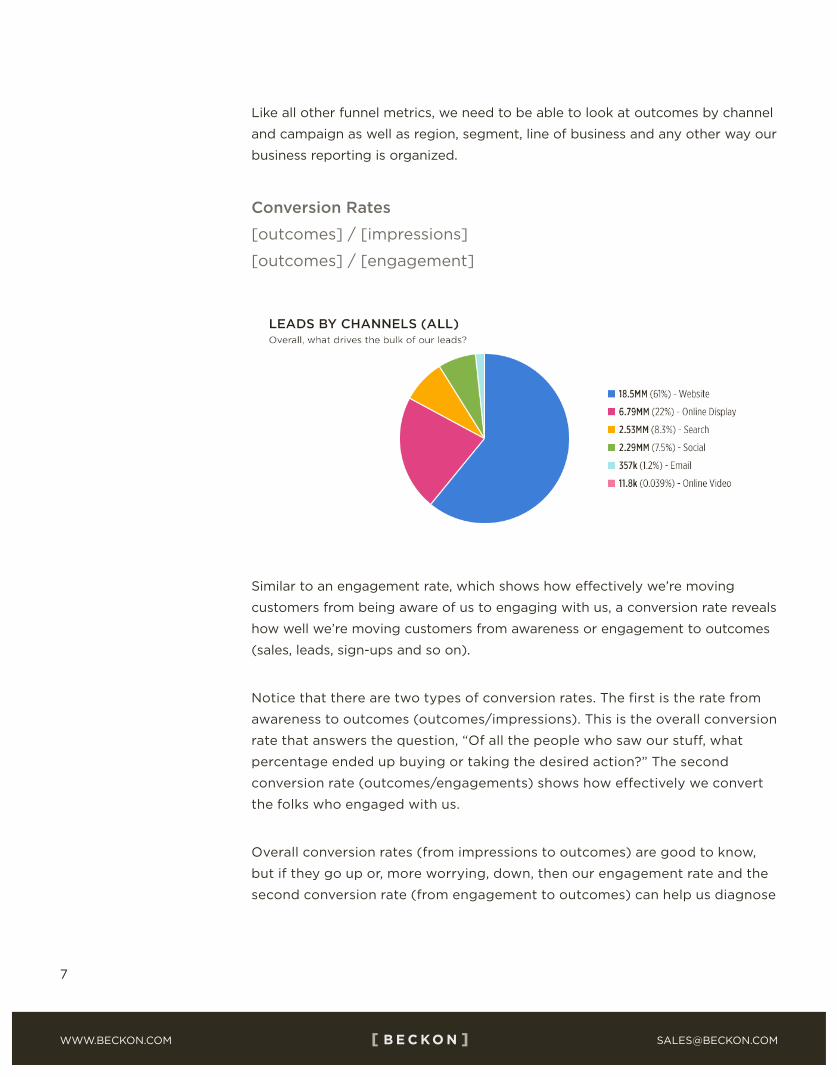
Similar to an engagement rate, which shows how effectively we’re moving
customers from being aware of us to engaging with us, a conversion rate reveals
how well we’re moving customers from awareness or engagement to outcomes
(sales, leads, sign-ups and so on).
Notice that there are two types of conversion rates. The first is the rate from
awareness to outcomes (outcomes/impressions). This is the overall conversion
rate that answers the question, “Of all the people who saw our stuff, what
percentage ended up buying or taking the desired action?” The second
conversion rate (outcomes/engagements) shows how effectively we convert
the folks who engaged with us.
Overall conversion rates (from impressions to outcomes) are good to know,
but if they go up or, more worrying, down, then our engagement rate and the
second conversion rate (from engagement to outcomes) can help us diagnose
the problem by breaking down the funnel to its component parts. For example,
if the engagement rate for a campaign, program or channel is very high (lots
of people are clicking) but the outcomes/engagement rate is very low, then
we know the offer, pricing or even the lead capture form has a problem that’s
preventing conversions, because the message is really resonating.
A Hypothetical Three-Stage Funnel: Volume and “Cost Per”
MARKETING FUNNEL EFFICIENCY METRICS
Now we can bring spend into the funnel-metrics equation in order to understand
cost-efficiency—what drives the most impressions, engagement and outcomes
per $1 we spend?
Let’s look at our funnel table again:
It’s critical for marketers to get a handle on efficiency metrics so we can answer
the questions that will inevitably come: “If I give you another $10,000, where will
you spend it and how will you decide?” Spend is the great normalizer—efficiency
metrics are the guide.
Note that with funnel efficiency metrics, we have to decide up front how we’re
going to define spend, and then be consistent. Some companies only choose
to include direct costs like actual media buys. Others include employee head
count, creative production costs and agency fees. It doesn’t really matter which
we choose, as long as we apply it consistently.
Cost per Impression
[spend] / [impression]
Cost per impression, or CPM, is an important metric for overall marketing ROI
calculations and channel-mix decisions—we need to know how expensive or
cheap channels are relative to each other for generating awareness. Under the
classic definition, CPM was a metric used only for an individual channel. Now,
using the expanded definition of “impression” described previously, CPM can
be a cross-channel metric.
Cost per Engagement
[spend] / [engagement]
Cost per engagement is a key efficiency metric these days, with many CMOs
going on record about how much they love cost per engagement as a rallying
cry for their organizations. This metric says: Our goal is to engage customers
(inspire them to interact with us as a brand and learn more) and we want to do
that as cost-effectively as possible.
But how to calculate it? Remember, engagement actions vary per channel—in
Twitter it’s a retweet, in search it’s a click, in YouTube it’s a video view and
so on—so be sure to use aggregate engagement (defined above) as your
denominator. The numerator is simply the sum of all our spend. Now we can
stack-rank all we do by how cost-effectively it engages consumers.
Cost per Outcome
[spend] / [outcome volume]
Measuring what it costs to acquire that customer or book that deal is, actually,
a look at profitability, and an especially familiar metric to a CFO. Like cost
per impression, cost per outcome is a foundational metric used to help make
channel-mix decisions.
HOW TO QUANTIFY MARKETING EFFICIENCY AND
EFFECTIVENESS IN TERMS OF THE BUYER’S JOURNEY
FUNNEL METRICS: PUT THE MARKETING IN MARKETING MEASUREMENT
2
Marketers know we need to stop measuring our marketing performance in
terms of clicks, likes and shares. We know we’re performing when we generate
awareness, engage customers and produce outcomes (revenue, sales, leads,
customer sign-ups). But many of us still aren’t clear on exactly how to quantify
that performance. Funnel metrics are where that happens.
Most marketers are familiar with the purchase funnel, or buyer’s journey—a
simple marketing model that’s been in use for over 100 years. It says that from
the time a customer becomes aware of our products to the time they actually
purchase from us, they’re on a journey that can be divided into stages. From a
customer’s point of view, those stages (at their most basic) are 1) to become
aware of or consider a brand, 2) to choose to learn more, and 3) to decide to
purchase. More complex funnels can include more stages.
Funnel metrics map directly to these stages, and reveal how we’re performing in
terms of the buyer’s journey. Whether we use a three-stage funnel, a six-stage
buyer’s journey or any other funnel, funnel metrics let us understand our volume
and cost-effectiveness at each stage, and how well we’re moving customers from
one stage to the next.
Here’s what it looks like when we put it all together:
There are two main buckets of funnel metrics: effectiveness and efficiency.
Here are detailed descriptions of the key metrics that measure both, including
example calculations.
MARKETING FUNNEL EFFECTIVENESS METRICS
Funnel effectiveness metrics tell us how effectively our marketing messages,
offers and content are attracting and converting customers. They show us
where the obstacles lie—which stages of the funnel are experiencing problems.
Importantly, funnel effectiveness metrics let us quantify marketing performance,
helping us make data-driven decisions instead of just relying on intuition or gut
feeling.
We’ll start with the volume metrics: top-of-the-funnel awareness, mid-funnel
engagement and bottom-of-the-funnel outcomes. Think of outcomes as what
you and the business decide you’re driving—leads, sales and customer lifetime
value are common.
Awareness
[impression volume]
Have we reached a lot of people, or just a few? On which campaigns or content
themes have we doubled down? How many impressions have we created in the
UK versus the US? How does this year’s volume of impressions compare to last
year’s?
Awareness, measured as impression volume, is a top-of-the-funnel metric that
shows how many people our messages have reached. Impressions are a mainstay
metric for online display media, meaning “ads served”. But if we instead think
about impressions as an abstract concept used consistently across every channel,
the metric becomes very powerful. Email has “impressions” as well, but it’s
not “number of emails sent”—those aren’t eyeballs on emails. Rather, the best
impressions number for email is the number of emails opened (showing that
someone actually read or at least glanced at that content). In this way, every
channel can have an impression volume metric.
We also want to track impression volume per program, campaign and any other
segments the business reports on, like geography, product or customer type.
And then we can answer questions like, What’s driving the most impressions for
us? What was the breakdown of impressions served? How are the total number
of impressions trending over time?
Engagement
[sum of total engagements (weighted or not)]
When we buy a lot of eyeballs, we’ve invested in the first stage of the funnel:
awareness. Presumably, our efforts there have made plenty of people aware
of our product or brand. But are they clicking, liking, retweeting, downloading,
signing up, visiting our website or taking any other action? Engagement is
a middle-of-the-funnel metric that tracks whether our target audience is
taking action. We’ll also want to know that by campaign, channel, region, etc.,
depending on how the company reports results.
Engagement is an aggregate metric. We want to total up all the metrics that
represent actions initiated by an end user—all the signs that they interacted
with our content and/or chose to learn more. This total engagement number
can be a simple sum of likes, clicks, opens, views, downloads, pins, video views
and so on—and this is what we recommend for any marketing department
just starting out on the measurement journey. For more advanced marketing
departments, each component of engagement can be weighted according to
what the team determines is more or less meaningful. For instance, you may
decide one download equals two Pinterest pins, or that an email open is worth
twice what a click-through on a banner ad is worth. The exact weightings
aren’t as important as maintaining a consistent formula that reveals a rich
understanding of cross-channel engagement.
Engagement Rates
[engagement] / [impressions]
Where engagement is an aggregate measure of all the customers we’ve
successfully persuaded to take an action—click through, view, or like something
we did—engagement rates quantify our success at moving audiences from
the first stage of the funnel to the second—from awareness to engagement. In
other words, of all the eyeballs we’ve reached, what’s the percentage that took
an action?
Once we know total impressions and total engagements, we can use the ratio
between them as quantifiable evidence of how well our marketing draws
customers into interacting with us. To steal a TED Talk phrase, engagement
rates answer the question, “Are we creating ideas worth spreading?”
We typically know what our engagement rates are within a channel. We know
which Google AdWords copy has the highest click-through rate, which landing
pages have the highest form completion rates, and which emails have the highest
open rates. As omnichannel marketers we want cross-channel insight—what’s
engaging our customers best across it all? For that we need a normalized,
apples-to-apples metric. The way we get it is to describe engagement as a
percentage of impressions. By creating a universal engagement-rate metric, we
can compare channels and tactics to each other to evaluate things like:
1 Content interest and velocity. What do our customers care about more: helpful
hints for using our products, or discount offers? What types of content do
our customers most like to share: product photos, stories about corporate
responsibility, or funny videos? The content with the highest engagement rate
provides the answer.
2 Channel velocity. Which channels are truly engaging our target customers? Look
to the engagement rate by channel.
3 Audience engagement. Which audience resonates more with our message:
working moms or college students? Look at the engagement rate for content
run in mom-audience networks and compare that to the engagement rate when
that same content is run on sites targeted at college students, and you’ll know.
Outcomes
[lead volume, customers acquired, sales revenue]
Outcomes are the last stage of the funnel. They quantify the business
results we’ve driven. As marketing leaders are held more accountable for
bottom-of-the-funnel outcome metrics—things that translate easily to business
value—they’re increasingly asked to “sign up for a number” just like chief
revenue officers or SVPs of sales do when they take on a quota. For marketers,
that “number” might be in dollars and might not. Those of us responsible
for e-commerce certainly have a dollar figure to hit. For B2B marketers, that
“number” might be qualified leads.
Whether or not we’re responsible for any specific outcome (for example, 10,000
leads per year), most of us are at least expected to show constant improvement
(say, grow lead flow by 10%). Once we get a good sense of outcome metrics and
establish a baseline, setting targets or goals for the team is the likely next step.
Like all other funnel metrics, we need to be able to look at outcomes by channel
and campaign as well as region, segment, line of business and any other way our
business reporting is organized.
Conversion Rates
[outcomes] / [impressions]
[outcomes] / [engagement]
Similar to an engagement rate, which shows how effectively we’re moving
customers from being aware of us to engaging with us, a conversion rate reveals
how well we’re moving customers from awareness or engagement to outcomes
(sales, leads, sign-ups and so on).
Notice that there are two types of conversion rates. The first is the rate from
awareness to outcomes (outcomes/impressions). This is the overall conversion
rate that answers the question, “Of all the people who saw our stuff, what
percentage ended up buying or taking the desired action?” The second
conversion rate (outcomes/engagements) shows how effectively we convert
the folks who engaged with us.
Overall conversion rates (from impressions to outcomes) are good to know,
but if they go up or, more worrying, down, then our engagement rate and the
second conversion rate (from engagement to outcomes) can help us diagnose
the problem by breaking down the funnel to its component parts. For example,
if the engagement rate for a campaign, program or channel is very high (lots
of people are clicking) but the outcomes/engagement rate is very low, then
we know the offer, pricing or even the lead capture form has a problem that’s
preventing conversions, because the message is really resonating.
A Hypothetical Three-Stage Funnel: Volume and “Cost Per”
MARKETING FUNNEL EFFICIENCY METRICS
Now we can bring spend into the funnel-metrics equation in order to understand
cost-efficiency—what drives the most impressions, engagement and outcomes
per $1 we spend?
Let’s look at our funnel table again:
It’s critical for marketers to get a handle on efficiency metrics so we can answer
the questions that will inevitably come: “If I give you another $10,000, where will
you spend it and how will you decide?” Spend is the great normalizer—efficiency
metrics are the guide.
Note that with funnel efficiency metrics, we have to decide up front how we’re
going to define spend, and then be consistent. Some companies only choose
to include direct costs like actual media buys. Others include employee head
count, creative production costs and agency fees. It doesn’t really matter which
we choose, as long as we apply it consistently.
Cost per Impression
[spend] / [impression]
Cost per impression, or CPM, is an important metric for overall marketing ROI
calculations and channel-mix decisions—we need to know how expensive or
cheap channels are relative to each other for generating awareness. Under the
classic definition, CPM was a metric used only for an individual channel. Now,
using the expanded definition of “impression” described previously, CPM can
be a cross-channel metric.
Cost per Engagement
[spend] / [engagement]
Cost per engagement is a key efficiency metric these days, with many CMOs
going on record about how much they love cost per engagement as a rallying
cry for their organizations. This metric says: Our goal is to engage customers
(inspire them to interact with us as a brand and learn more) and we want to do
that as cost-effectively as possible.
But how to calculate it? Remember, engagement actions vary per channel—in
Twitter it’s a retweet, in search it’s a click, in YouTube it’s a video view and
so on—so be sure to use aggregate engagement (defined above) as your
denominator. The numerator is simply the sum of all our spend. Now we can
stack-rank all we do by how cost-effectively it engages consumers.
Cost per Outcome
[spend] / [outcome volume]
Measuring what it costs to acquire that customer or book that deal is, actually,
a look at profitability, and an especially familiar metric to a CFO. Like cost
per impression, cost per outcome is a foundational metric used to help make
channel-mix decisions.
3
Marketers know we need to stop measuring our marketing performance in
terms of clicks, likes and shares. We know we’re performing when we generate
awareness, engage customers and produce outcomes (revenue, sales, leads,
customer sign-ups). But many of us still aren’t clear on exactly how to quantify
that performance. Funnel metrics are where that happens.
Most marketers are familiar with the purchase funnel, or buyer’s journey—a
simple marketing model that’s been in use for over 100 years. It says that from
the time a customer becomes aware of our products to the time they actually
purchase from us, they’re on a journey that can be divided into stages. From a
customer’s point of view, those stages (at their most basic) are 1) to become
aware of or consider a brand, 2) to choose to learn more, and 3) to decide to
purchase. More complex funnels can include more stages.
Funnel metrics map directly to these stages, and reveal how we’re performing in
terms of the buyer’s journey. Whether we use a three-stage funnel, a six-stage
buyer’s journey or any other funnel, funnel metrics let us understand our volume
and cost-effectiveness at each stage, and how well we’re moving customers from
one stage to the next.
Here’s what it looks like when we put it all together:
There are two main buckets of funnel metrics: effectiveness and efficiency.
Here are detailed descriptions of the key metrics that measure both, including
example calculations.
MARKETING FUNNEL EFFECTIVENESS METRICS
Funnel effectiveness metrics tell us how effectively our marketing messages,
offers and content are attracting and converting customers. They show us
where the obstacles lie—which stages of the funnel are experiencing problems.
Importantly, funnel effectiveness metrics let us quantify marketing performance,
helping us make data-driven decisions instead of just relying on intuition or gut
feeling.
We’ll start with the volume metrics: top-of-the-funnel awareness, mid-funnel
engagement and bottom-of-the-funnel outcomes. Think of outcomes as what
you and the business decide you’re driving—leads, sales and customer lifetime
value are common.
Awareness
[impression volume]
Have we reached a lot of people, or just a few? On which campaigns or content
themes have we doubled down? How many impressions have we created in the
UK versus the US? How does this year’s volume of impressions compare to last
year’s?
Awareness, measured as impression volume, is a top-of-the-funnel metric that
shows how many people our messages have reached. Impressions are a mainstay
metric for online display media, meaning “ads served”. But if we instead think
about impressions as an abstract concept used consistently across every channel,
the metric becomes very powerful. Email has “impressions” as well, but it’s
not “number of emails sent”—those aren’t eyeballs on emails. Rather, the best
impressions number for email is the number of emails opened (showing that
someone actually read or at least glanced at that content). In this way, every
channel can have an impression volume metric.
We also want to track impression volume per program, campaign and any other
segments the business reports on, like geography, product or customer type.
And then we can answer questions like, What’s driving the most impressions for
us? What was the breakdown of impressions served? How are the total number
of impressions trending over time?
Engagement
[sum of total engagements (weighted or not)]
When we buy a lot of eyeballs, we’ve invested in the first stage of the funnel:
awareness. Presumably, our efforts there have made plenty of people aware
of our product or brand. But are they clicking, liking, retweeting, downloading,
signing up, visiting our website or taking any other action? Engagement is
a middle-of-the-funnel metric that tracks whether our target audience is
taking action. We’ll also want to know that by campaign, channel, region, etc.,
depending on how the company reports results.
Engagement is an aggregate metric. We want to total up all the metrics that
represent actions initiated by an end user—all the signs that they interacted
with our content and/or chose to learn more. This total engagement number
can be a simple sum of likes, clicks, opens, views, downloads, pins, video views
and so on—and this is what we recommend for any marketing department
just starting out on the measurement journey. For more advanced marketing
departments, each component of engagement can be weighted according to
what the team determines is more or less meaningful. For instance, you may
decide one download equals two Pinterest pins, or that an email open is worth
twice what a click-through on a banner ad is worth. The exact weightings
aren’t as important as maintaining a consistent formula that reveals a rich
understanding of cross-channel engagement.
Engagement Rates
[engagement] / [impressions]
Where engagement is an aggregate measure of all the customers we’ve
successfully persuaded to take an action—click through, view, or like something
we did—engagement rates quantify our success at moving audiences from
the first stage of the funnel to the second—from awareness to engagement. In
other words, of all the eyeballs we’ve reached, what’s the percentage that took
an action?
Once we know total impressions and total engagements, we can use the ratio
between them as quantifiable evidence of how well our marketing draws
customers into interacting with us. To steal a TED Talk phrase, engagement
rates answer the question, “Are we creating ideas worth spreading?”
We typically know what our engagement rates are within a channel. We know
which Google AdWords copy has the highest click-through rate, which landing
pages have the highest form completion rates, and which emails have the highest
open rates. As omnichannel marketers we want cross-channel insight—what’s
engaging our customers best across it all? For that we need a normalized,
apples-to-apples metric. The way we get it is to describe engagement as a
percentage of impressions. By creating a universal engagement-rate metric, we
can compare channels and tactics to each other to evaluate things like:
1 Content interest and velocity. What do our customers care about more: helpful
hints for using our products, or discount offers? What types of content do
our customers most like to share: product photos, stories about corporate
responsibility, or funny videos? The content with the highest engagement rate
provides the answer.
2 Channel velocity. Which channels are truly engaging our target customers? Look
to the engagement rate by channel.
3 Audience engagement. Which audience resonates more with our message:
working moms or college students? Look at the engagement rate for content
run in mom-audience networks and compare that to the engagement rate when
that same content is run on sites targeted at college students, and you’ll know.
Outcomes
[lead volume, customers acquired, sales revenue]
Outcomes are the last stage of the funnel. They quantify the business
results we’ve driven. As marketing leaders are held more accountable for
bottom-of-the-funnel outcome metrics—things that translate easily to business
value—they’re increasingly asked to “sign up for a number” just like chief
revenue officers or SVPs of sales do when they take on a quota. For marketers,
that “number” might be in dollars and might not. Those of us responsible
for e-commerce certainly have a dollar figure to hit. For B2B marketers, that
“number” might be qualified leads.
Whether or not we’re responsible for any specific outcome (for example, 10,000
leads per year), most of us are at least expected to show constant improvement
(say, grow lead flow by 10%). Once we get a good sense of outcome metrics and
establish a baseline, setting targets or goals for the team is the likely next step.
Like all other funnel metrics, we need to be able to look at outcomes by channel
and campaign as well as region, segment, line of business and any other way our
business reporting is organized.
Conversion Rates
[outcomes] / [impressions]
[outcomes] / [engagement]
Similar to an engagement rate, which shows how effectively we’re moving
customers from being aware of us to engaging with us, a conversion rate reveals
how well we’re moving customers from awareness or engagement to outcomes
(sales, leads, sign-ups and so on).
Notice that there are two types of conversion rates. The first is the rate from
awareness to outcomes (outcomes/impressions). This is the overall conversion
rate that answers the question, “Of all the people who saw our stuff, what
percentage ended up buying or taking the desired action?” The second
conversion rate (outcomes/engagements) shows how effectively we convert
the folks who engaged with us.
Overall conversion rates (from impressions to outcomes) are good to know,
but if they go up or, more worrying, down, then our engagement rate and the
second conversion rate (from engagement to outcomes) can help us diagnose
the problem by breaking down the funnel to its component parts. For example,
if the engagement rate for a campaign, program or channel is very high (lots
of people are clicking) but the outcomes/engagement rate is very low, then
we know the offer, pricing or even the lead capture form has a problem that’s
preventing conversions, because the message is really resonating.
A Hypothetical Three-Stage Funnel: Volume and “Cost Per”
MARKETING FUNNEL EFFICIENCY METRICS
Now we can bring spend into the funnel-metrics equation in order to understand
cost-efficiency—what drives the most impressions, engagement and outcomes
per $1 we spend?
Let’s look at our funnel table again:
It’s critical for marketers to get a handle on efficiency metrics so we can answer
the questions that will inevitably come: “If I give you another $10,000, where will
you spend it and how will you decide?” Spend is the great normalizer—efficiency
metrics are the guide.
Note that with funnel efficiency metrics, we have to decide up front how we’re
going to define spend, and then be consistent. Some companies only choose
to include direct costs like actual media buys. Others include employee head
count, creative production costs and agency fees. It doesn’t really matter which
we choose, as long as we apply it consistently.
Cost per Impression
[spend] / [impression]
Cost per impression, or CPM, is an important metric for overall marketing ROI
calculations and channel-mix decisions—we need to know how expensive or
cheap channels are relative to each other for generating awareness. Under the
classic definition, CPM was a metric used only for an individual channel. Now,
using the expanded definition of “impression” described previously, CPM can
be a cross-channel metric.
Cost per Engagement
[spend] / [engagement]
Cost per engagement is a key efficiency metric these days, with many CMOs
going on record about how much they love cost per engagement as a rallying
cry for their organizations. This metric says: Our goal is to engage customers
(inspire them to interact with us as a brand and learn more) and we want to do
that as cost-effectively as possible.
But how to calculate it? Remember, engagement actions vary per channel—in
Twitter it’s a retweet, in search it’s a click, in YouTube it’s a video view and
so on—so be sure to use aggregate engagement (defined above) as your
denominator. The numerator is simply the sum of all our spend. Now we can
stack-rank all we do by how cost-effectively it engages consumers.
Cost per Outcome
[spend] / [outcome volume]
Measuring what it costs to acquire that customer or book that deal is, actually,
a look at profitability, and an especially familiar metric to a CFO. Like cost
per impression, cost per outcome is a foundational metric used to help make
channel-mix decisions.
4
Marketers know we need to stop measuring our marketing performance in
terms of clicks, likes and shares. We know we’re performing when we generate
awareness, engage customers and produce outcomes (revenue, sales, leads,
customer sign-ups). But many of us still aren’t clear on exactly how to quantify
that performance. Funnel metrics are where that happens.
Most marketers are familiar with the purchase funnel, or buyer’s journey—a
simple marketing model that’s been in use for over 100 years. It says that from
the time a customer becomes aware of our products to the time they actually
purchase from us, they’re on a journey that can be divided into stages. From a
customer’s point of view, those stages (at their most basic) are 1) to become
aware of or consider a brand, 2) to choose to learn more, and 3) to decide to
purchase. More complex funnels can include more stages.
Funnel metrics map directly to these stages, and reveal how we’re performing in
terms of the buyer’s journey. Whether we use a three-stage funnel, a six-stage
buyer’s journey or any other funnel, funnel metrics let us understand our volume
and cost-effectiveness at each stage, and how well we’re moving customers from
one stage to the next.
Here’s what it looks like when we put it all together:
There are two main buckets of funnel metrics: effectiveness and efficiency.
Here are detailed descriptions of the key metrics that measure both, including
example calculations.
MARKETING FUNNEL EFFECTIVENESS METRICS
Funnel effectiveness metrics tell us how effectively our marketing messages,
offers and content are attracting and converting customers. They show us
where the obstacles lie—which stages of the funnel are experiencing problems.
Importantly, funnel effectiveness metrics let us quantify marketing performance,
helping us make data-driven decisions instead of just relying on intuition or gut
feeling.
We’ll start with the volume metrics: top-of-the-funnel awareness, mid-funnel
engagement and bottom-of-the-funnel outcomes. Think of outcomes as what
you and the business decide you’re driving—leads, sales and customer lifetime
value are common.
Awareness
[impression volume]
Have we reached a lot of people, or just a few? On which campaigns or content
themes have we doubled down? How many impressions have we created in the
UK versus the US? How does this year’s volume of impressions compare to last
year’s?
Awareness, measured as impression volume, is a top-of-the-funnel metric that
shows how many people our messages have reached. Impressions are a mainstay
metric for online display media, meaning “ads served”. But if we instead think
about impressions as an abstract concept used consistently across every channel,
the metric becomes very powerful. Email has “impressions” as well, but it’s
not “number of emails sent”—those aren’t eyeballs on emails. Rather, the best
impressions number for email is the number of emails opened (showing that
someone actually read or at least glanced at that content). In this way, every
channel can have an impression volume metric.
We also want to track impression volume per program, campaign and any other
segments the business reports on, like geography, product or customer type.
And then we can answer questions like, What’s driving the most impressions for
us? What was the breakdown of impressions served? How are the total number
of impressions trending over time?
Engagement
[sum of total engagements (weighted or not)]
When we buy a lot of eyeballs, we’ve invested in the first stage of the funnel:
awareness. Presumably, our efforts there have made plenty of people aware
of our product or brand. But are they clicking, liking, retweeting, downloading,
signing up, visiting our website or taking any other action? Engagement is
a middle-of-the-funnel metric that tracks whether our target audience is
taking action. We’ll also want to know that by campaign, channel, region, etc.,
depending on how the company reports results.
Engagement is an aggregate metric. We want to total up all the metrics that
represent actions initiated by an end user—all the signs that they interacted
with our content and/or chose to learn more. This total engagement number
can be a simple sum of likes, clicks, opens, views, downloads, pins, video views
and so on—and this is what we recommend for any marketing department
just starting out on the measurement journey. For more advanced marketing
departments, each component of engagement can be weighted according to
what the team determines is more or less meaningful. For instance, you may
decide one download equals two Pinterest pins, or that an email open is worth
twice what a click-through on a banner ad is worth. The exact weightings
aren’t as important as maintaining a consistent formula that reveals a rich
understanding of cross-channel engagement.
Engagement Rates
[engagement] / [impressions]
Where engagement is an aggregate measure of all the customers we’ve
successfully persuaded to take an action—click through, view, or like something
we did—engagement rates quantify our success at moving audiences from
the first stage of the funnel to the second—from awareness to engagement. In
other words, of all the eyeballs we’ve reached, what’s the percentage that took
an action?
Once we know total impressions and total engagements, we can use the ratio
between them as quantifiable evidence of how well our marketing draws
customers into interacting with us. To steal a TED Talk phrase, engagement
rates answer the question, “Are we creating ideas worth spreading?”
We typically know what our engagement rates are within a channel. We know
which Google AdWords copy has the highest click-through rate, which landing
pages have the highest form completion rates, and which emails have the highest
open rates. As omnichannel marketers we want cross-channel insight—what’s
engaging our customers best across it all? For that we need a normalized,
apples-to-apples metric. The way we get it is to describe engagement as a
percentage of impressions. By creating a universal engagement-rate metric, we
can compare channels and tactics to each other to evaluate things like:
1 Content interest and velocity. What do our customers care about more: helpful
hints for using our products, or discount offers? What types of content do
our customers most like to share: product photos, stories about corporate
responsibility, or funny videos? The content with the highest engagement rate
provides the answer.
2 Channel velocity. Which channels are truly engaging our target customers? Look
to the engagement rate by channel.
3 Audience engagement. Which audience resonates more with our message:
working moms or college students? Look at the engagement rate for content
run in mom-audience networks and compare that to the engagement rate when
that same content is run on sites targeted at college students, and you’ll know.
Outcomes
[lead volume, customers acquired, sales revenue]
Outcomes are the last stage of the funnel. They quantify the business
results we’ve driven. As marketing leaders are held more accountable for
bottom-of-the-funnel outcome metrics—things that translate easily to business
value—they’re increasingly asked to “sign up for a number” just like chief
revenue officers or SVPs of sales do when they take on a quota. For marketers,
that “number” might be in dollars and might not. Those of us responsible
for e-commerce certainly have a dollar figure to hit. For B2B marketers, that
“number” might be qualified leads.
Whether or not we’re responsible for any specific outcome (for example, 10,000
leads per year), most of us are at least expected to show constant improvement
(say, grow lead flow by 10%). Once we get a good sense of outcome metrics and
establish a baseline, setting targets or goals for the team is the likely next step.
Like all other funnel metrics, we need to be able to look at outcomes by channel
and campaign as well as region, segment, line of business and any other way our
business reporting is organized.
Conversion Rates
[outcomes] / [impressions]
[outcomes] / [engagement]
Similar to an engagement rate, which shows how effectively we’re moving
customers from being aware of us to engaging with us, a conversion rate reveals
how well we’re moving customers from awareness or engagement to outcomes
(sales, leads, sign-ups and so on).
Notice that there are two types of conversion rates. The first is the rate from
awareness to outcomes (outcomes/impressions). This is the overall conversion
rate that answers the question, “Of all the people who saw our stuff, what
percentage ended up buying or taking the desired action?” The second
conversion rate (outcomes/engagements) shows how effectively we convert
the folks who engaged with us.
Overall conversion rates (from impressions to outcomes) are good to know,
but if they go up or, more worrying, down, then our engagement rate and the
second conversion rate (from engagement to outcomes) can help us diagnose
the problem by breaking down the funnel to its component parts. For example,
if the engagement rate for a campaign, program or channel is very high (lots
of people are clicking) but the outcomes/engagement rate is very low, then
we know the offer, pricing or even the lead capture form has a problem that’s
preventing conversions, because the message is really resonating.
A Hypothetical Three-Stage Funnel: Volume and “Cost Per”
MARKETING FUNNEL EFFICIENCY METRICS
Now we can bring spend into the funnel-metrics equation in order to understand
cost-efficiency—what drives the most impressions, engagement and outcomes
per $1 we spend?
Let’s look at our funnel table again:
It’s critical for marketers to get a handle on efficiency metrics so we can answer
the questions that will inevitably come: “If I give you another $10,000, where will
you spend it and how will you decide?” Spend is the great normalizer—efficiency
metrics are the guide.
Note that with funnel efficiency metrics, we have to decide up front how we’re
going to define spend, and then be consistent. Some companies only choose
to include direct costs like actual media buys. Others include employee head
count, creative production costs and agency fees. It doesn’t really matter which
we choose, as long as we apply it consistently.
Cost per Impression
[spend] / [impression]
Cost per impression, or CPM, is an important metric for overall marketing ROI
calculations and channel-mix decisions—we need to know how expensive or
cheap channels are relative to each other for generating awareness. Under the
classic definition, CPM was a metric used only for an individual channel. Now,
using the expanded definition of “impression” described previously, CPM can
be a cross-channel metric.
Cost per Engagement
[spend] / [engagement]
Cost per engagement is a key efficiency metric these days, with many CMOs
going on record about how much they love cost per engagement as a rallying
cry for their organizations. This metric says: Our goal is to engage customers
(inspire them to interact with us as a brand and learn more) and we want to do
that as cost-effectively as possible.
But how to calculate it? Remember, engagement actions vary per channel—in
Twitter it’s a retweet, in search it’s a click, in YouTube it’s a video view and
so on—so be sure to use aggregate engagement (defined above) as your
denominator. The numerator is simply the sum of all our spend. Now we can
stack-rank all we do by how cost-effectively it engages consumers.
Cost per Outcome
[spend] / [outcome volume]
Measuring what it costs to acquire that customer or book that deal is, actually,
a look at profitability, and an especially familiar metric to a CFO. Like cost
per impression, cost per outcome is a foundational metric used to help make
channel-mix decisions.
5
Marketers know we need to stop measuring our marketing performance in
terms of clicks, likes and shares. We know we’re performing when we generate
awareness, engage customers and produce outcomes (revenue, sales, leads,
customer sign-ups). But many of us still aren’t clear on exactly how to quantify
that performance. Funnel metrics are where that happens.
Most marketers are familiar with the purchase funnel, or buyer’s journey—a
simple marketing model that’s been in use for over 100 years. It says that from
the time a customer becomes aware of our products to the time they actually
purchase from us, they’re on a journey that can be divided into stages. From a
customer’s point of view, those stages (at their most basic) are 1) to become
aware of or consider a brand, 2) to choose to learn more, and 3) to decide to
purchase. More complex funnels can include more stages.
Funnel metrics map directly to these stages, and reveal how we’re performing in
terms of the buyer’s journey. Whether we use a three-stage funnel, a six-stage
buyer’s journey or any other funnel, funnel metrics let us understand our volume
and cost-effectiveness at each stage, and how well we’re moving customers from
one stage to the next.
Here’s what it looks like when we put it all together:
There are two main buckets of funnel metrics: effectiveness and efficiency.
Here are detailed descriptions of the key metrics that measure both, including
example calculations.
MARKETING FUNNEL EFFECTIVENESS METRICS
Funnel effectiveness metrics tell us how effectively our marketing messages,
offers and content are attracting and converting customers. They show us
where the obstacles lie—which stages of the funnel are experiencing problems.
Importantly, funnel effectiveness metrics let us quantify marketing performance,
helping us make data-driven decisions instead of just relying on intuition or gut
feeling.
We’ll start with the volume metrics: top-of-the-funnel awareness, mid-funnel
engagement and bottom-of-the-funnel outcomes. Think of outcomes as what
you and the business decide you’re driving—leads, sales and customer lifetime
value are common.
Awareness
[impression volume]
Have we reached a lot of people, or just a few? On which campaigns or content
themes have we doubled down? How many impressions have we created in the
UK versus the US? How does this year’s volume of impressions compare to last
year’s?
Awareness, measured as impression volume, is a top-of-the-funnel metric that
shows how many people our messages have reached. Impressions are a mainstay
metric for online display media, meaning “ads served”. But if we instead think
about impressions as an abstract concept used consistently across every channel,
the metric becomes very powerful. Email has “impressions” as well, but it’s
not “number of emails sent”—those aren’t eyeballs on emails. Rather, the best
impressions number for email is the number of emails opened (showing that
someone actually read or at least glanced at that content). In this way, every
channel can have an impression volume metric.
We also want to track impression volume per program, campaign and any other
segments the business reports on, like geography, product or customer type.
And then we can answer questions like, What’s driving the most impressions for
us? What was the breakdown of impressions served? How are the total number
of impressions trending over time?
Engagement
[sum of total engagements (weighted or not)]
When we buy a lot of eyeballs, we’ve invested in the first stage of the funnel:
awareness. Presumably, our efforts there have made plenty of people aware
of our product or brand. But are they clicking, liking, retweeting, downloading,
signing up, visiting our website or taking any other action? Engagement is
a middle-of-the-funnel metric that tracks whether our target audience is
taking action. We’ll also want to know that by campaign, channel, region, etc.,
depending on how the company reports results.
Engagement is an aggregate metric. We want to total up all the metrics that
represent actions initiated by an end user—all the signs that they interacted
with our content and/or chose to learn more. This total engagement number
can be a simple sum of likes, clicks, opens, views, downloads, pins, video views
and so on—and this is what we recommend for any marketing department
just starting out on the measurement journey. For more advanced marketing
departments, each component of engagement can be weighted according to
what the team determines is more or less meaningful. For instance, you may
decide one download equals two Pinterest pins, or that an email open is worth
twice what a click-through on a banner ad is worth. The exact weightings
aren’t as important as maintaining a consistent formula that reveals a rich
understanding of cross-channel engagement.
Engagement Rates
[engagement] / [impressions]
Where engagement is an aggregate measure of all the customers we’ve
successfully persuaded to take an action—click through, view, or like something
we did—engagement rates quantify our success at moving audiences from
the first stage of the funnel to the second—from awareness to engagement. In
other words, of all the eyeballs we’ve reached, what’s the percentage that took
an action?
Once we know total impressions and total engagements, we can use the ratio
between them as quantifiable evidence of how well our marketing draws
customers into interacting with us. To steal a TED Talk phrase, engagement
rates answer the question, “Are we creating ideas worth spreading?”
We typically know what our engagement rates are within a channel. We know
which Google AdWords copy has the highest click-through rate, which landing
pages have the highest form completion rates, and which emails have the highest
open rates. As omnichannel marketers we want cross-channel insight—what’s
engaging our customers best across it all? For that we need a normalized,
apples-to-apples metric. The way we get it is to describe engagement as a
percentage of impressions. By creating a universal engagement-rate metric, we
can compare channels and tactics to each other to evaluate things like:
1 Content interest and velocity. What do our customers care about more: helpful
hints for using our products, or discount offers? What types of content do
our customers most like to share: product photos, stories about corporate
responsibility, or funny videos? The content with the highest engagement rate
provides the answer.
2 Channel velocity. Which channels are truly engaging our target customers? Look
to the engagement rate by channel.
3 Audience engagement. Which audience resonates more with our message:
working moms or college students? Look at the engagement rate for content
run in mom-audience networks and compare that to the engagement rate when
that same content is run on sites targeted at college students, and you’ll know.
Outcomes
[lead volume, customers acquired, sales revenue]
Outcomes are the last stage of the funnel. They quantify the business
results we’ve driven. As marketing leaders are held more accountable for
bottom-of-the-funnel outcome metrics—things that translate easily to business
value—they’re increasingly asked to “sign up for a number” just like chief
revenue officers or SVPs of sales do when they take on a quota. For marketers,
that “number” might be in dollars and might not. Those of us responsible
for e-commerce certainly have a dollar figure to hit. For B2B marketers, that
“number” might be qualified leads.
Whether or not we’re responsible for any specific outcome (for example, 10,000
leads per year), most of us are at least expected to show constant improvement
(say, grow lead flow by 10%). Once we get a good sense of outcome metrics and
establish a baseline, setting targets or goals for the team is the likely next step.
Like all other funnel metrics, we need to be able to look at outcomes by channel
and campaign as well as region, segment, line of business and any other way our
business reporting is organized.
Conversion Rates
[outcomes] / [impressions]
[outcomes] / [engagement]
Similar to an engagement rate, which shows how effectively we’re moving
customers from being aware of us to engaging with us, a conversion rate reveals
how well we’re moving customers from awareness or engagement to outcomes
(sales, leads, sign-ups and so on).
Notice that there are two types of conversion rates. The first is the rate from
awareness to outcomes (outcomes/impressions). This is the overall conversion
rate that answers the question, “Of all the people who saw our stuff, what
percentage ended up buying or taking the desired action?” The second
conversion rate (outcomes/engagements) shows how effectively we convert
the folks who engaged with us.
Overall conversion rates (from impressions to outcomes) are good to know,
but if they go up or, more worrying, down, then our engagement rate and the
second conversion rate (from engagement to outcomes) can help us diagnose
the problem by breaking down the funnel to its component parts. For example,
if the engagement rate for a campaign, program or channel is very high (lots
of people are clicking) but the outcomes/engagement rate is very low, then
we know the offer, pricing or even the lead capture form has a problem that’s
preventing conversions, because the message is really resonating.
A Hypothetical Three-Stage Funnel: Volume and “Cost Per”
MARKETING FUNNEL EFFICIENCY METRICS
Now we can bring spend into the funnel-metrics equation in order to understand
cost-efficiency—what drives the most impressions, engagement and outcomes
per $1 we spend?
Let’s look at our funnel table again:
It’s critical for marketers to get a handle on efficiency metrics so we can answer
the questions that will inevitably come: “If I give you another $10,000, where will
you spend it and how will you decide?” Spend is the great normalizer—efficiency
metrics are the guide.
Note that with funnel efficiency metrics, we have to decide up front how we’re
going to define spend, and then be consistent. Some companies only choose
to include direct costs like actual media buys. Others include employee head
count, creative production costs and agency fees. It doesn’t really matter which
we choose, as long as we apply it consistently.
Cost per Impression
[spend] / [impression]
Cost per impression, or CPM, is an important metric for overall marketing ROI
calculations and channel-mix decisions—we need to know how expensive or
cheap channels are relative to each other for generating awareness. Under the
classic definition, CPM was a metric used only for an individual channel. Now,
using the expanded definition of “impression” described previously, CPM can
be a cross-channel metric.
Cost per Engagement
[spend] / [engagement]
Cost per engagement is a key efficiency metric these days, with many CMOs
going on record about how much they love cost per engagement as a rallying
cry for their organizations. This metric says: Our goal is to engage customers
(inspire them to interact with us as a brand and learn more) and we want to do
that as cost-effectively as possible.
But how to calculate it? Remember, engagement actions vary per channel—in
Twitter it’s a retweet, in search it’s a click, in YouTube it’s a video view and
so on—so be sure to use aggregate engagement (defined above) as your
denominator. The numerator is simply the sum of all our spend. Now we can
stack-rank all we do by how cost-effectively it engages consumers.
Cost per Outcome
[spend] / [outcome volume]
Measuring what it costs to acquire that customer or book that deal is, actually,
a look at profitability, and an especially familiar metric to a CFO. Like cost
per impression, cost per outcome is a foundational metric used to help make
channel-mix decisions.
6
Marketers know we need to stop measuring our marketing performance in
terms of clicks, likes and shares. We know we’re performing when we generate
awareness, engage customers and produce outcomes (revenue, sales, leads,
customer sign-ups). But many of us still aren’t clear on exactly how to quantify
that performance. Funnel metrics are where that happens.
Most marketers are familiar with the purchase funnel, or buyer’s journey—a
simple marketing model that’s been in use for over 100 years. It says that from
the time a customer becomes aware of our products to the time they actually
purchase from us, they’re on a journey that can be divided into stages. From a
customer’s point of view, those stages (at their most basic) are 1) to become
aware of or consider a brand, 2) to choose to learn more, and 3) to decide to
purchase. More complex funnels can include more stages.
Funnel metrics map directly to these stages, and reveal how we’re performing in
terms of the buyer’s journey. Whether we use a three-stage funnel, a six-stage
buyer’s journey or any other funnel, funnel metrics let us understand our volume
and cost-effectiveness at each stage, and how well we’re moving customers from
one stage to the next.
Here’s what it looks like when we put it all together:
There are two main buckets of funnel metrics: effectiveness and efficiency.
Here are detailed descriptions of the key metrics that measure both, including
example calculations.
MARKETING FUNNEL EFFECTIVENESS METRICS
Funnel effectiveness metrics tell us how effectively our marketing messages,
offers and content are attracting and converting customers. They show us
where the obstacles lie—which stages of the funnel are experiencing problems.
Importantly, funnel effectiveness metrics let us quantify marketing performance,
helping us make data-driven decisions instead of just relying on intuition or gut
feeling.
We’ll start with the volume metrics: top-of-the-funnel awareness, mid-funnel
engagement and bottom-of-the-funnel outcomes. Think of outcomes as what
you and the business decide you’re driving—leads, sales and customer lifetime
value are common.
Awareness
[impression volume]
Have we reached a lot of people, or just a few? On which campaigns or content
themes have we doubled down? How many impressions have we created in the
UK versus the US? How does this year’s volume of impressions compare to last
year’s?
Awareness, measured as impression volume, is a top-of-the-funnel metric that
shows how many people our messages have reached. Impressions are a mainstay
metric for online display media, meaning “ads served”. But if we instead think
about impressions as an abstract concept used consistently across every channel,
the metric becomes very powerful. Email has “impressions” as well, but it’s
not “number of emails sent”—those aren’t eyeballs on emails. Rather, the best
impressions number for email is the number of emails opened (showing that
someone actually read or at least glanced at that content). In this way, every
channel can have an impression volume metric.
We also want to track impression volume per program, campaign and any other
segments the business reports on, like geography, product or customer type.
And then we can answer questions like, What’s driving the most impressions for
us? What was the breakdown of impressions served? How are the total number
of impressions trending over time?
Engagement
[sum of total engagements (weighted or not)]
When we buy a lot of eyeballs, we’ve invested in the first stage of the funnel:
awareness. Presumably, our efforts there have made plenty of people aware
of our product or brand. But are they clicking, liking, retweeting, downloading,
signing up, visiting our website or taking any other action? Engagement is
a middle-of-the-funnel metric that tracks whether our target audience is
taking action. We’ll also want to know that by campaign, channel, region, etc.,
depending on how the company reports results.
Engagement is an aggregate metric. We want to total up all the metrics that
represent actions initiated by an end user—all the signs that they interacted
with our content and/or chose to learn more. This total engagement number
can be a simple sum of likes, clicks, opens, views, downloads, pins, video views
and so on—and this is what we recommend for any marketing department
just starting out on the measurement journey. For more advanced marketing
departments, each component of engagement can be weighted according to
what the team determines is more or less meaningful. For instance, you may
decide one download equals two Pinterest pins, or that an email open is worth
twice what a click-through on a banner ad is worth. The exact weightings
aren’t as important as maintaining a consistent formula that reveals a rich
understanding of cross-channel engagement.
Engagement Rates
[engagement] / [impressions]
Where engagement is an aggregate measure of all the customers we’ve
successfully persuaded to take an action—click through, view, or like something
we did—engagement rates quantify our success at moving audiences from
the first stage of the funnel to the second—from awareness to engagement. In
other words, of all the eyeballs we’ve reached, what’s the percentage that took
an action?
Once we know total impressions and total engagements, we can use the ratio
between them as quantifiable evidence of how well our marketing draws
customers into interacting with us. To steal a TED Talk phrase, engagement
rates answer the question, “Are we creating ideas worth spreading?”
We typically know what our engagement rates are within a channel. We know
which Google AdWords copy has the highest click-through rate, which landing
pages have the highest form completion rates, and which emails have the highest
open rates. As omnichannel marketers we want cross-channel insight—what’s
engaging our customers best across it all? For that we need a normalized,
apples-to-apples metric. The way we get it is to describe engagement as a
percentage of impressions. By creating a universal engagement-rate metric, we
can compare channels and tactics to each other to evaluate things like:
1 Content interest and velocity. What do our customers care about more: helpful
hints for using our products, or discount offers? What types of content do
our customers most like to share: product photos, stories about corporate
responsibility, or funny videos? The content with the highest engagement rate
provides the answer.
2 Channel velocity. Which channels are truly engaging our target customers? Look
to the engagement rate by channel.
3 Audience engagement. Which audience resonates more with our message:
working moms or college students? Look at the engagement rate for content
run in mom-audience networks and compare that to the engagement rate when
that same content is run on sites targeted at college students, and you’ll know.
Outcomes
[lead volume, customers acquired, sales revenue]
Outcomes are the last stage of the funnel. They quantify the business
results we’ve driven. As marketing leaders are held more accountable for
bottom-of-the-funnel outcome metrics—things that translate easily to business
value—they’re increasingly asked to “sign up for a number” just like chief
revenue officers or SVPs of sales do when they take on a quota. For marketers,
that “number” might be in dollars and might not. Those of us responsible
for e-commerce certainly have a dollar figure to hit. For B2B marketers, that
“number” might be qualified leads.
Whether or not we’re responsible for any specific outcome (for example, 10,000
leads per year), most of us are at least expected to show constant improvement
(say, grow lead flow by 10%). Once we get a good sense of outcome metrics and
establish a baseline, setting targets or goals for the team is the likely next step.
Like all other funnel metrics, we need to be able to look at outcomes by channel
and campaign as well as region, segment, line of business and any other way our
business reporting is organized.
Conversion Rates
[outcomes] / [impressions]
[outcomes] / [engagement]
Similar to an engagement rate, which shows how effectively we’re moving
customers from being aware of us to engaging with us, a conversion rate reveals
how well we’re moving customers from awareness or engagement to outcomes
(sales, leads, sign-ups and so on).
Notice that there are two types of conversion rates. The first is the rate from
awareness to outcomes (outcomes/impressions). This is the overall conversion
rate that answers the question, “Of all the people who saw our stuff, what
percentage ended up buying or taking the desired action?” The second
conversion rate (outcomes/engagements) shows how effectively we convert
the folks who engaged with us.
Overall conversion rates (from impressions to outcomes) are good to know,
but if they go up or, more worrying, down, then our engagement rate and the
second conversion rate (from engagement to outcomes) can help us diagnose
the problem by breaking down the funnel to its component parts. For example,
if the engagement rate for a campaign, program or channel is very high (lots
of people are clicking) but the outcomes/engagement rate is very low, then
we know the offer, pricing or even the lead capture form has a problem that’s
preventing conversions, because the message is really resonating.
A Hypothetical Three-Stage Funnel: Volume and “Cost Per”
MARKETING FUNNEL EFFICIENCY METRICS
Now we can bring spend into the funnel-metrics equation in order to understand
cost-efficiency—what drives the most impressions, engagement and outcomes
per $1 we spend?
Let’s look at our funnel table again:
It’s critical for marketers to get a handle on efficiency metrics so we can answer
the questions that will inevitably come: “If I give you another $10,000, where will
you spend it and how will you decide?” Spend is the great normalizer—efficiency
metrics are the guide.
Note that with funnel efficiency metrics, we have to decide up front how we’re
going to define spend, and then be consistent. Some companies only choose
to include direct costs like actual media buys. Others include employee head
count, creative production costs and agency fees. It doesn’t really matter which
we choose, as long as we apply it consistently.
Cost per Impression
[spend] / [impression]
Cost per impression, or CPM, is an important metric for overall marketing ROI
calculations and channel-mix decisions—we need to know how expensive or
cheap channels are relative to each other for generating awareness. Under the
classic definition, CPM was a metric used only for an individual channel. Now,
using the expanded definition of “impression” described previously, CPM can
be a cross-channel metric.
Cost per Engagement
[spend] / [engagement]
Cost per engagement is a key efficiency metric these days, with many CMOs
going on record about how much they love cost per engagement as a rallying
cry for their organizations. This metric says: Our goal is to engage customers
(inspire them to interact with us as a brand and learn more) and we want to do
that as cost-effectively as possible.
But how to calculate it? Remember, engagement actions vary per channel—in
Twitter it’s a retweet, in search it’s a click, in YouTube it’s a video view and
so on—so be sure to use aggregate engagement (defined above) as your
denominator. The numerator is simply the sum of all our spend. Now we can
stack-rank all we do by how cost-effectively it engages consumers.
Cost per Outcome
[spend] / [outcome volume]
Measuring what it costs to acquire that customer or book that deal is, actually,
a look at profitability, and an especially familiar metric to a CFO. Like cost
per impression, cost per outcome is a foundational metric used to help make
channel-mix decisions.
7
Marketers know we need to stop measuring our marketing performance in
terms of clicks, likes and shares. We know we’re performing when we generate
awareness, engage customers and produce outcomes (revenue, sales, leads,
customer sign-ups). But many of us still aren’t clear on exactly how to quantify
that performance. Funnel metrics are where that happens.
Most marketers are familiar with the purchase funnel, or buyer’s journey—a
simple marketing model that’s been in use for over 100 years. It says that from
the time a customer becomes aware of our products to the time they actually
purchase from us, they’re on a journey that can be divided into stages. From a
customer’s point of view, those stages (at their most basic) are 1) to become
aware of or consider a brand, 2) to choose to learn more, and 3) to decide to
purchase. More complex funnels can include more stages.
Funnel metrics map directly to these stages, and reveal how we’re performing in
terms of the buyer’s journey. Whether we use a three-stage funnel, a six-stage
buyer’s journey or any other funnel, funnel metrics let us understand our volume
and cost-effectiveness at each stage, and how well we’re moving customers from
one stage to the next.
Here’s what it looks like when we put it all together:
There are two main buckets of funnel metrics: effectiveness and efficiency.
Here are detailed descriptions of the key metrics that measure both, including
example calculations.
MARKETING FUNNEL EFFECTIVENESS METRICS
Funnel effectiveness metrics tell us how effectively our marketing messages,
offers and content are attracting and converting customers. They show us
where the obstacles lie—which stages of the funnel are experiencing problems.
Importantly, funnel effectiveness metrics let us quantify marketing performance,
helping us make data-driven decisions instead of just relying on intuition or gut
feeling.
We’ll start with the volume metrics: top-of-the-funnel awareness, mid-funnel
engagement and bottom-of-the-funnel outcomes. Think of outcomes as what
you and the business decide you’re driving—leads, sales and customer lifetime
value are common.
Awareness
[impression volume]
Have we reached a lot of people, or just a few? On which campaigns or content
themes have we doubled down? How many impressions have we created in the
UK versus the US? How does this year’s volume of impressions compare to last
year’s?
Awareness, measured as impression volume, is a top-of-the-funnel metric that
shows how many people our messages have reached. Impressions are a mainstay
metric for online display media, meaning “ads served”. But if we instead think
about impressions as an abstract concept used consistently across every channel,
the metric becomes very powerful. Email has “impressions” as well, but it’s
not “number of emails sent”—those aren’t eyeballs on emails. Rather, the best
impressions number for email is the number of emails opened (showing that
someone actually read or at least glanced at that content). In this way, every
channel can have an impression volume metric.
We also want to track impression volume per program, campaign and any other
segments the business reports on, like geography, product or customer type.
And then we can answer questions like, What’s driving the most impressions for
us? What was the breakdown of impressions served? How are the total number
of impressions trending over time?
Engagement
[sum of total engagements (weighted or not)]
When we buy a lot of eyeballs, we’ve invested in the first stage of the funnel:
awareness. Presumably, our efforts there have made plenty of people aware
of our product or brand. But are they clicking, liking, retweeting, downloading,
signing up, visiting our website or taking any other action? Engagement is
a middle-of-the-funnel metric that tracks whether our target audience is
taking action. We’ll also want to know that by campaign, channel, region, etc.,
depending on how the company reports results.
Engagement is an aggregate metric. We want to total up all the metrics that
represent actions initiated by an end user—all the signs that they interacted
with our content and/or chose to learn more. This total engagement number
can be a simple sum of likes, clicks, opens, views, downloads, pins, video views
and so on—and this is what we recommend for any marketing department
just starting out on the measurement journey. For more advanced marketing
departments, each component of engagement can be weighted according to
what the team determines is more or less meaningful. For instance, you may
decide one download equals two Pinterest pins, or that an email open is worth
twice what a click-through on a banner ad is worth. The exact weightings
aren’t as important as maintaining a consistent formula that reveals a rich
understanding of cross-channel engagement.
Engagement Rates
[engagement] / [impressions]
Where engagement is an aggregate measure of all the customers we’ve
successfully persuaded to take an action—click through, view, or like something
we did—engagement rates quantify our success at moving audiences from
the first stage of the funnel to the second—from awareness to engagement. In
other words, of all the eyeballs we’ve reached, what’s the percentage that took
an action?
Once we know total impressions and total engagements, we can use the ratio
between them as quantifiable evidence of how well our marketing draws
customers into interacting with us. To steal a TED Talk phrase, engagement
rates answer the question, “Are we creating ideas worth spreading?”
We typically know what our engagement rates are within a channel. We know
which Google AdWords copy has the highest click-through rate, which landing
pages have the highest form completion rates, and which emails have the highest
open rates. As omnichannel marketers we want cross-channel insight—what’s
engaging our customers best across it all? For that we need a normalized,
apples-to-apples metric. The way we get it is to describe engagement as a
percentage of impressions. By creating a universal engagement-rate metric, we
can compare channels and tactics to each other to evaluate things like:
1 Content interest and velocity. What do our customers care about more: helpful
hints for using our products, or discount offers? What types of content do
our customers most like to share: product photos, stories about corporate
responsibility, or funny videos? The content with the highest engagement rate
provides the answer.
2 Channel velocity. Which channels are truly engaging our target customers? Look
to the engagement rate by channel.
3 Audience engagement. Which audience resonates more with our message:
working moms or college students? Look at the engagement rate for content
run in mom-audience networks and compare that to the engagement rate when
that same content is run on sites targeted at college students, and you’ll know.
Outcomes
[lead volume, customers acquired, sales revenue]
Outcomes are the last stage of the funnel. They quantify the business
results we’ve driven. As marketing leaders are held more accountable for
bottom-of-the-funnel outcome metrics—things that translate easily to business
value—they’re increasingly asked to “sign up for a number” just like chief
revenue officers or SVPs of sales do when they take on a quota. For marketers,
that “number” might be in dollars and might not. Those of us responsible
for e-commerce certainly have a dollar figure to hit. For B2B marketers, that
“number” might be qualified leads.
Whether or not we’re responsible for any specific outcome (for example, 10,000
leads per year), most of us are at least expected to show constant improvement
(say, grow lead flow by 10%). Once we get a good sense of outcome metrics and
establish a baseline, setting targets or goals for the team is the likely next step.
Like all other funnel metrics, we need to be able to look at outcomes by channel
and campaign as well as region, segment, line of business and any other way our
business reporting is organized.
Conversion Rates
[outcomes] / [impressions]
[outcomes] / [engagement]
Similar to an engagement rate, which shows how effectively we’re moving
customers from being aware of us to engaging with us, a conversion rate reveals
how well we’re moving customers from awareness or engagement to outcomes
(sales, leads, sign-ups and so on).
Notice that there are two types of conversion rates. The first is the rate from
awareness to outcomes (outcomes/impressions). This is the overall conversion
rate that answers the question, “Of all the people who saw our stuff, what
percentage ended up buying or taking the desired action?” The second
conversion rate (outcomes/engagements) shows how effectively we convert
the folks who engaged with us.
Overall conversion rates (from impressions to outcomes) are good to know,
but if they go up or, more worrying, down, then our engagement rate and the
second conversion rate (from engagement to outcomes) can help us diagnose
the problem by breaking down the funnel to its component parts. For example,
if the engagement rate for a campaign, program or channel is very high (lots
of people are clicking) but the outcomes/engagement rate is very low, then
we know the offer, pricing or even the lead capture form has a problem that’s
preventing conversions, because the message is really resonating.
A Hypothetical Three-Stage Funnel: Volume and “Cost Per”
MARKETING FUNNEL EFFICIENCY METRICS
Now we can bring spend into the funnel-metrics equation in order to understand
cost-efficiency—what drives the most impressions, engagement and outcomes
per $1 we spend?
Let’s look at our funnel table again:
It’s critical for marketers to get a handle on efficiency metrics so we can answer
the questions that will inevitably come: “If I give you another $10,000, where will
you spend it and how will you decide?” Spend is the great normalizer—efficiency
metrics are the guide.
Note that with funnel efficiency metrics, we have to decide up front how we’re
going to define spend, and then be consistent. Some companies only choose
to include direct costs like actual media buys. Others include employee head
count, creative production costs and agency fees. It doesn’t really matter which
we choose, as long as we apply it consistently.
Cost per Impression
[spend] / [impression]
Cost per impression, or CPM, is an important metric for overall marketing ROI
calculations and channel-mix decisions—we need to know how expensive or
cheap channels are relative to each other for generating awareness. Under the
classic definition, CPM was a metric used only for an individual channel. Now,
using the expanded definition of “impression” described previously, CPM can
be a cross-channel metric.
Cost per Engagement
[spend] / [engagement]
Cost per engagement is a key efficiency metric these days, with many CMOs
going on record about how much they love cost per engagement as a rallying
cry for their organizations. This metric says: Our goal is to engage customers
(inspire them to interact with us as a brand and learn more) and we want to do
that as cost-effectively as possible.
But how to calculate it? Remember, engagement actions vary per channel—in
Twitter it’s a retweet, in search it’s a click, in YouTube it’s a video view and
so on—so be sure to use aggregate engagement (defined above) as your
denominator. The numerator is simply the sum of all our spend. Now we can
stack-rank all we do by how cost-effectively it engages consumers.
Cost per Outcome
[spend] / [outcome volume]
Measuring what it costs to acquire that customer or book that deal is, actually,
a look at profitability, and an especially familiar metric to a CFO. Like cost
per impression, cost per outcome is a foundational metric used to help make
channel-mix decisions.
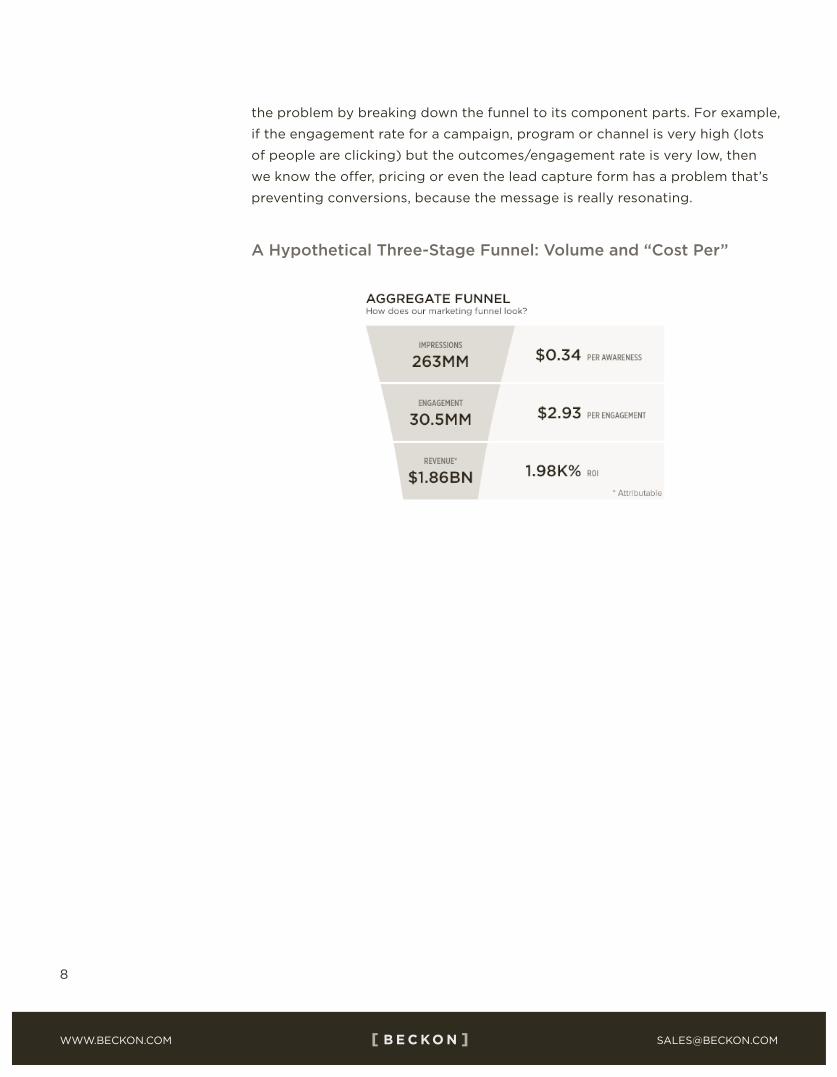
8
Marketers know we need to stop measuring our marketing performance in
terms of clicks, likes and shares. We know we’re performing when we generate
awareness, engage customers and produce outcomes (revenue, sales, leads,
customer sign-ups). But many of us still aren’t clear on exactly how to quantify
that performance. Funnel metrics are where that happens.
Most marketers are familiar with the purchase funnel, or buyer’s journey—a
simple marketing model that’s been in use for over 100 years. It says that from
the time a customer becomes aware of our products to the time they actually
purchase from us, they’re on a journey that can be divided into stages. From a
customer’s point of view, those stages (at their most basic) are 1) to become
aware of or consider a brand, 2) to choose to learn more, and 3) to decide to
purchase. More complex funnels can include more stages.
Funnel metrics map directly to these stages, and reveal how we’re performing in
terms of the buyer’s journey. Whether we use a three-stage funnel, a six-stage
buyer’s journey or any other funnel, funnel metrics let us understand our volume
and cost-effectiveness at each stage, and how well we’re moving customers from
one stage to the next.
Here’s what it looks like when we put it all together:
There are two main buckets of funnel metrics: effectiveness and efficiency.
Here are detailed descriptions of the key metrics that measure both, including
example calculations.
MARKETING FUNNEL EFFECTIVENESS METRICS
Funnel effectiveness metrics tell us how effectively our marketing messages,
offers and content are attracting and converting customers. They show us
where the obstacles lie—which stages of the funnel are experiencing problems.
Importantly, funnel effectiveness metrics let us quantify marketing performance,
helping us make data-driven decisions instead of just relying on intuition or gut
feeling.
We’ll start with the volume metrics: top-of-the-funnel awareness, mid-funnel
engagement and bottom-of-the-funnel outcomes. Think of outcomes as what
you and the business decide you’re driving—leads, sales and customer lifetime
value are common.
Awareness
[impression volume]
Have we reached a lot of people, or just a few? On which campaigns or content
themes have we doubled down? How many impressions have we created in the
UK versus the US? How does this year’s volume of impressions compare to last
year’s?
Awareness, measured as impression volume, is a top-of-the-funnel metric that
shows how many people our messages have reached. Impressions are a mainstay
metric for online display media, meaning “ads served”. But if we instead think
about impressions as an abstract concept used consistently across every channel,
the metric becomes very powerful. Email has “impressions” as well, but it’s
not “number of emails sent”—those aren’t eyeballs on emails. Rather, the best
impressions number for email is the number of emails opened (showing that
someone actually read or at least glanced at that content). In this way, every
channel can have an impression volume metric.
We also want to track impression volume per program, campaign and any other
segments the business reports on, like geography, product or customer type.
And then we can answer questions like, What’s driving the most impressions for
us? What was the breakdown of impressions served? How are the total number
of impressions trending over time?
Engagement
[sum of total engagements (weighted or not)]
When we buy a lot of eyeballs, we’ve invested in the first stage of the funnel:
awareness. Presumably, our efforts there have made plenty of people aware
of our product or brand. But are they clicking, liking, retweeting, downloading,
signing up, visiting our website or taking any other action? Engagement is
a middle-of-the-funnel metric that tracks whether our target audience is
taking action. We’ll also want to know that by campaign, channel, region, etc.,
depending on how the company reports results.
Engagement is an aggregate metric. We want to total up all the metrics that
represent actions initiated by an end user—all the signs that they interacted
with our content and/or chose to learn more. This total engagement number
can be a simple sum of likes, clicks, opens, views, downloads, pins, video views
and so on—and this is what we recommend for any marketing department
just starting out on the measurement journey. For more advanced marketing
departments, each component of engagement can be weighted according to
what the team determines is more or less meaningful. For instance, you may
decide one download equals two Pinterest pins, or that an email open is worth
twice what a click-through on a banner ad is worth. The exact weightings
aren’t as important as maintaining a consistent formula that reveals a rich
understanding of cross-channel engagement.
Engagement Rates
[engagement] / [impressions]
Where engagement is an aggregate measure of all the customers we’ve
successfully persuaded to take an action—click through, view, or like something
we did—engagement rates quantify our success at moving audiences from
the first stage of the funnel to the second—from awareness to engagement. In
other words, of all the eyeballs we’ve reached, what’s the percentage that took
an action?
Once we know total impressions and total engagements, we can use the ratio
between them as quantifiable evidence of how well our marketing draws
customers into interacting with us. To steal a TED Talk phrase, engagement
rates answer the question, “Are we creating ideas worth spreading?”
We typically know what our engagement rates are within a channel. We know
which Google AdWords copy has the highest click-through rate, which landing
pages have the highest form completion rates, and which emails have the highest
open rates. As omnichannel marketers we want cross-channel insight—what’s
engaging our customers best across it all? For that we need a normalized,
apples-to-apples metric. The way we get it is to describe engagement as a
percentage of impressions. By creating a universal engagement-rate metric, we
can compare channels and tactics to each other to evaluate things like:
1 Content interest and velocity. What do our customers care about more: helpful
hints for using our products, or discount offers? What types of content do
our customers most like to share: product photos, stories about corporate
responsibility, or funny videos? The content with the highest engagement rate
provides the answer.
2 Channel velocity. Which channels are truly engaging our target customers? Look
to the engagement rate by channel.
3 Audience engagement. Which audience resonates more with our message:
working moms or college students? Look at the engagement rate for content
run in mom-audience networks and compare that to the engagement rate when
that same content is run on sites targeted at college students, and you’ll know.
Outcomes
[lead volume, customers acquired, sales revenue]
Outcomes are the last stage of the funnel. They quantify the business
results we’ve driven. As marketing leaders are held more accountable for
bottom-of-the-funnel outcome metrics—things that translate easily to business
value—they’re increasingly asked to “sign up for a number” just like chief
revenue officers or SVPs of sales do when they take on a quota. For marketers,
that “number” might be in dollars and might not. Those of us responsible
for e-commerce certainly have a dollar figure to hit. For B2B marketers, that
“number” might be qualified leads.
Whether or not we’re responsible for any specific outcome (for example, 10,000
leads per year), most of us are at least expected to show constant improvement
(say, grow lead flow by 10%). Once we get a good sense of outcome metrics and
establish a baseline, setting targets or goals for the team is the likely next step.
Like all other funnel metrics, we need to be able to look at outcomes by channel
and campaign as well as region, segment, line of business and any other way our
business reporting is organized.
Conversion Rates
[outcomes] / [impressions]
[outcomes] / [engagement]
Similar to an engagement rate, which shows how effectively we’re moving
customers from being aware of us to engaging with us, a conversion rate reveals
how well we’re moving customers from awareness or engagement to outcomes
(sales, leads, sign-ups and so on).
Notice that there are two types of conversion rates. The first is the rate from
awareness to outcomes (outcomes/impressions). This is the overall conversion
rate that answers the question, “Of all the people who saw our stuff, what
percentage ended up buying or taking the desired action?” The second
conversion rate (outcomes/engagements) shows how effectively we convert
the folks who engaged with us.
Overall conversion rates (from impressions to outcomes) are good to know,
but if they go up or, more worrying, down, then our engagement rate and the
second conversion rate (from engagement to outcomes) can help us diagnose
the problem by breaking down the funnel to its component parts. For example,
if the engagement rate for a campaign, program or channel is very high (lots
of people are clicking) but the outcomes/engagement rate is very low, then
we know the offer, pricing or even the lead capture form has a problem that’s
preventing conversions, because the message is really resonating.
A Hypothetical Three-Stage Funnel: Volume and “Cost Per”
MARKETING FUNNEL EFFICIENCY METRICS
Now we can bring spend into the funnel-metrics equation in order to understand
cost-efficiency—what drives the most impressions, engagement and outcomes
per $1 we spend?
Let’s look at our funnel table again:
It’s critical for marketers to get a handle on efficiency metrics so we can answer
the questions that will inevitably come: “If I give you another $10,000, where will
you spend it and how will you decide?” Spend is the great normalizer—efficiency
metrics are the guide.
Note that with funnel efficiency metrics, we have to decide up front how we’re
going to define spend, and then be consistent. Some companies only choose
to include direct costs like actual media buys. Others include employee head
count, creative production costs and agency fees. It doesn’t really matter which
we choose, as long as we apply it consistently.
Cost per Impression
[spend] / [impression]
Cost per impression, or CPM, is an important metric for overall marketing ROI
calculations and channel-mix decisions—we need to know how expensive or
cheap channels are relative to each other for generating awareness. Under the
classic definition, CPM was a metric used only for an individual channel. Now,
using the expanded definition of “impression” described previously, CPM can
be a cross-channel metric.
Cost per Engagement
[spend] / [engagement]
Cost per engagement is a key efficiency metric these days, with many CMOs
going on record about how much they love cost per engagement as a rallying
cry for their organizations. This metric says: Our goal is to engage customers
(inspire them to interact with us as a brand and learn more) and we want to do
that as cost-effectively as possible.
But how to calculate it? Remember, engagement actions vary per channel—in
Twitter it’s a retweet, in search it’s a click, in YouTube it’s a video view and
so on—so be sure to use aggregate engagement (defined above) as your
denominator. The numerator is simply the sum of all our spend. Now we can
stack-rank all we do by how cost-effectively it engages consumers.
Cost per Outcome
[spend] / [outcome volume]
Measuring what it costs to acquire that customer or book that deal is, actually,
a look at profitability, and an especially familiar metric to a CFO. Like cost
per impression, cost per outcome is a foundational metric used to help make
channel-mix decisions.
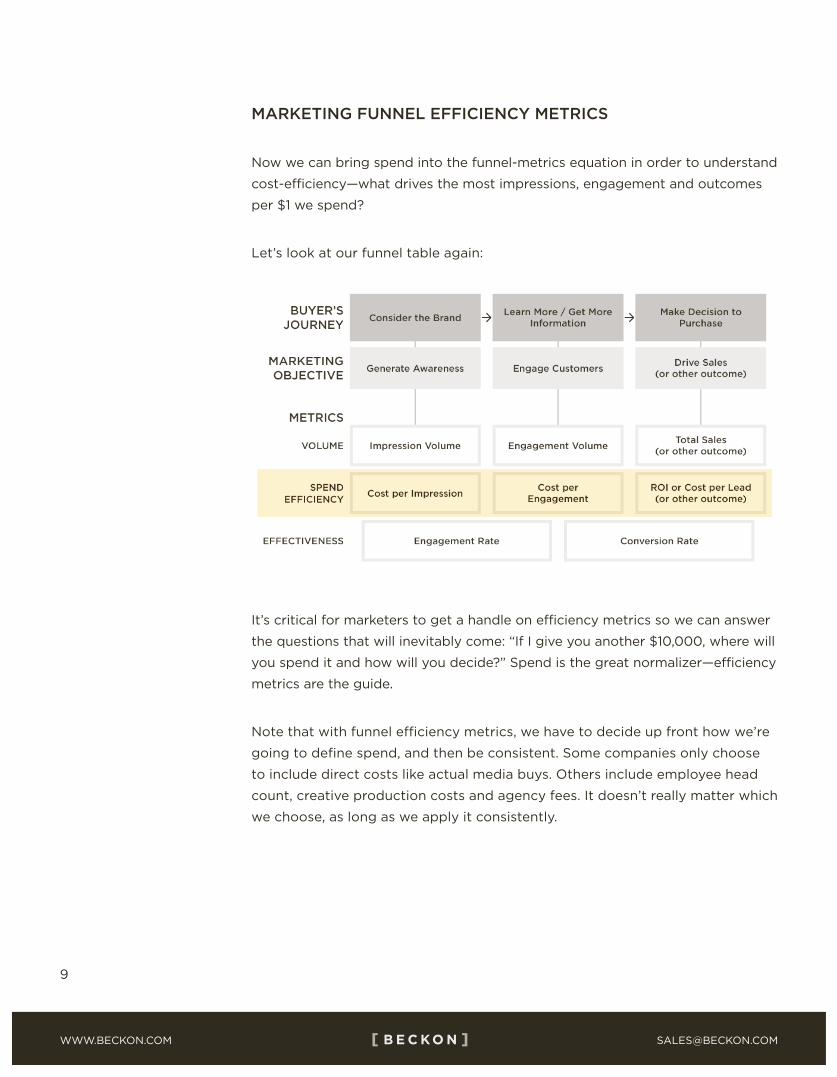
9
Marketers know we need to stop measuring our marketing performance in
terms of clicks, likes and shares. We know we’re performing when we generate
awareness, engage customers and produce outcomes (revenue, sales, leads,
customer sign-ups). But many of us still aren’t clear on exactly how to quantify
that performance. Funnel metrics are where that happens.
Most marketers are familiar with the purchase funnel, or buyer’s journey—a
simple marketing model that’s been in use for over 100 years. It says that from
the time a customer becomes aware of our products to the time they actually
purchase from us, they’re on a journey that can be divided into stages. From a
customer’s point of view, those stages (at their most basic) are 1) to become
aware of or consider a brand, 2) to choose to learn more, and 3) to decide to
purchase. More complex funnels can include more stages.
Funnel metrics map directly to these stages, and reveal how we’re performing in
terms of the buyer’s journey. Whether we use a three-stage funnel, a six-stage
buyer’s journey or any other funnel, funnel metrics let us understand our volume
and cost-effectiveness at each stage, and how well we’re moving customers from
one stage to the next.
Here’s what it looks like when we put it all together:
There are two main buckets of funnel metrics: effectiveness and efficiency.
Here are detailed descriptions of the key metrics that measure both, including
example calculations.
MARKETING FUNNEL EFFECTIVENESS METRICS
Funnel effectiveness metrics tell us how effectively our marketing messages,
offers and content are attracting and converting customers. They show us
where the obstacles lie—which stages of the funnel are experiencing problems.
Importantly, funnel effectiveness metrics let us quantify marketing performance,
helping us make data-driven decisions instead of just relying on intuition or gut
feeling.
We’ll start with the volume metrics: top-of-the-funnel awareness, mid-funnel
engagement and bottom-of-the-funnel outcomes. Think of outcomes as what
you and the business decide you’re driving—leads, sales and customer lifetime
value are common.
Awareness
[impression volume]
Have we reached a lot of people, or just a few? On which campaigns or content
themes have we doubled down? How many impressions have we created in the
UK versus the US? How does this year’s volume of impressions compare to last
year’s?
Awareness, measured as impression volume, is a top-of-the-funnel metric that
shows how many people our messages have reached. Impressions are a mainstay
metric for online display media, meaning “ads served”. But if we instead think
about impressions as an abstract concept used consistently across every channel,
the metric becomes very powerful. Email has “impressions” as well, but it’s
not “number of emails sent”—those aren’t eyeballs on emails. Rather, the best
impressions number for email is the number of emails opened (showing that
someone actually read or at least glanced at that content). In this way, every
channel can have an impression volume metric.
We also want to track impression volume per program, campaign and any other
segments the business reports on, like geography, product or customer type.
And then we can answer questions like, What’s driving the most impressions for
us? What was the breakdown of impressions served? How are the total number
of impressions trending over time?
Engagement
[sum of total engagements (weighted or not)]
When we buy a lot of eyeballs, we’ve invested in the first stage of the funnel:
awareness. Presumably, our efforts there have made plenty of people aware
of our product or brand. But are they clicking, liking, retweeting, downloading,
signing up, visiting our website or taking any other action? Engagement is
a middle-of-the-funnel metric that tracks whether our target audience is
taking action. We’ll also want to know that by campaign, channel, region, etc.,
depending on how the company reports results.
Engagement is an aggregate metric. We want to total up all the metrics that
represent actions initiated by an end user—all the signs that they interacted
with our content and/or chose to learn more. This total engagement number
can be a simple sum of likes, clicks, opens, views, downloads, pins, video views
and so on—and this is what we recommend for any marketing department
just starting out on the measurement journey. For more advanced marketing
departments, each component of engagement can be weighted according to
what the team determines is more or less meaningful. For instance, you may
decide one download equals two Pinterest pins, or that an email open is worth
twice what a click-through on a banner ad is worth. The exact weightings
aren’t as important as maintaining a consistent formula that reveals a rich
understanding of cross-channel engagement.
Engagement Rates
[engagement] / [impressions]
Where engagement is an aggregate measure of all the customers we’ve
successfully persuaded to take an action—click through, view, or like something
we did—engagement rates quantify our success at moving audiences from
the first stage of the funnel to the second—from awareness to engagement. In
other words, of all the eyeballs we’ve reached, what’s the percentage that took
an action?
Once we know total impressions and total engagements, we can use the ratio
between them as quantifiable evidence of how well our marketing draws
customers into interacting with us. To steal a TED Talk phrase, engagement
rates answer the question, “Are we creating ideas worth spreading?”
We typically know what our engagement rates are within a channel. We know
which Google AdWords copy has the highest click-through rate, which landing
pages have the highest form completion rates, and which emails have the highest
open rates. As omnichannel marketers we want cross-channel insight—what’s
engaging our customers best across it all? For that we need a normalized,
apples-to-apples metric. The way we get it is to describe engagement as a
percentage of impressions. By creating a universal engagement-rate metric, we
can compare channels and tactics to each other to evaluate things like:
1 Content interest and velocity. What do our customers care about more: helpful
hints for using our products, or discount offers? What types of content do
our customers most like to share: product photos, stories about corporate
responsibility, or funny videos? The content with the highest engagement rate
provides the answer.
2 Channel velocity. Which channels are truly engaging our target customers? Look
to the engagement rate by channel.
3 Audience engagement. Which audience resonates more with our message:
working moms or college students? Look at the engagement rate for content
run in mom-audience networks and compare that to the engagement rate when
that same content is run on sites targeted at college students, and you’ll know.
Outcomes
[lead volume, customers acquired, sales revenue]
Outcomes are the last stage of the funnel. They quantify the business
results we’ve driven. As marketing leaders are held more accountable for
bottom-of-the-funnel outcome metrics—things that translate easily to business
value—they’re increasingly asked to “sign up for a number” just like chief
revenue officers or SVPs of sales do when they take on a quota. For marketers,
that “number” might be in dollars and might not. Those of us responsible
for e-commerce certainly have a dollar figure to hit. For B2B marketers, that
“number” might be qualified leads.
Whether or not we’re responsible for any specific outcome (for example, 10,000
leads per year), most of us are at least expected to show constant improvement
(say, grow lead flow by 10%). Once we get a good sense of outcome metrics and
establish a baseline, setting targets or goals for the team is the likely next step.
Like all other funnel metrics, we need to be able to look at outcomes by channel
and campaign as well as region, segment, line of business and any other way our
business reporting is organized.
Conversion Rates
[outcomes] / [impressions]
[outcomes] / [engagement]
Similar to an engagement rate, which shows how effectively we’re moving
customers from being aware of us to engaging with us, a conversion rate reveals
how well we’re moving customers from awareness or engagement to outcomes
(sales, leads, sign-ups and so on).
Notice that there are two types of conversion rates. The first is the rate from
awareness to outcomes (outcomes/impressions). This is the overall conversion
rate that answers the question, “Of all the people who saw our stuff, what
percentage ended up buying or taking the desired action?” The second
conversion rate (outcomes/engagements) shows how effectively we convert
the folks who engaged with us.
Overall conversion rates (from impressions to outcomes) are good to know,
but if they go up or, more worrying, down, then our engagement rate and the
second conversion rate (from engagement to outcomes) can help us diagnose
the problem by breaking down the funnel to its component parts. For example,
if the engagement rate for a campaign, program or channel is very high (lots
of people are clicking) but the outcomes/engagement rate is very low, then
we know the offer, pricing or even the lead capture form has a problem that’s
preventing conversions, because the message is really resonating.
A Hypothetical Three-Stage Funnel: Volume and “Cost Per”
MARKETING FUNNEL EFFICIENCY METRICS
Now we can bring spend into the funnel-metrics equation in order to understand
cost-efficiency—what drives the most impressions, engagement and outcomes
per $1 we spend?
Let’s look at our funnel table again:
It’s critical for marketers to get a handle on efficiency metrics so we can answer
the questions that will inevitably come: “If I give you another $10,000, where will
you spend it and how will you decide?” Spend is the great normalizer—efficiency
metrics are the guide.
Note that with funnel efficiency metrics, we have to decide up front how we’re
going to define spend, and then be consistent. Some companies only choose
to include direct costs like actual media buys. Others include employee head
count, creative production costs and agency fees. It doesn’t really matter which
we choose, as long as we apply it consistently.
Cost per Impression
[spend] / [impression]
Cost per impression, or CPM, is an important metric for overall marketing ROI
calculations and channel-mix decisions—we need to know how expensive or
cheap channels are relative to each other for generating awareness. Under the
classic definition, CPM was a metric used only for an individual channel. Now,
using the expanded definition of “impression” described previously, CPM can
be a cross-channel metric.
Cost per Engagement
[spend] / [engagement]
Cost per engagement is a key efficiency metric these days, with many CMOs
going on record about how much they love cost per engagement as a rallying
cry for their organizations. This metric says: Our goal is to engage customers
(inspire them to interact with us as a brand and learn more) and we want to do
that as cost-effectively as possible.
But how to calculate it? Remember, engagement actions vary per channel—in
Twitter it’s a retweet, in search it’s a click, in YouTube it’s a video view and
so on—so be sure to use aggregate engagement (defined above) as your
denominator. The numerator is simply the sum of all our spend. Now we can
stack-rank all we do by how cost-effectively it engages consumers.
Cost per Outcome
[spend] / [outcome volume]
Measuring what it costs to acquire that customer or book that deal is, actually,
a look at profitability, and an especially familiar metric to a CFO. Like cost
per impression, cost per outcome is a foundational metric used to help make
channel-mix decisions.
10
Marketers know we need to stop measuring our marketing performance in
terms of clicks, likes and shares. We know we’re performing when we generate
awareness, engage customers and produce outcomes (revenue, sales, leads,
customer sign-ups). But many of us still aren’t clear on exactly how to quantify
that performance. Funnel metrics are where that happens.
Most marketers are familiar with the purchase funnel, or buyer’s journey—a
simple marketing model that’s been in use for over 100 years. It says that from
the time a customer becomes aware of our products to the time they actually
purchase from us, they’re on a journey that can be divided into stages. From a
customer’s point of view, those stages (at their most basic) are 1) to become
aware of or consider a brand, 2) to choose to learn more, and 3) to decide to
purchase. More complex funnels can include more stages.
Funnel metrics map directly to these stages, and reveal how we’re performing in
terms of the buyer’s journey. Whether we use a three-stage funnel, a six-stage
buyer’s journey or any other funnel, funnel metrics let us understand our volume
and cost-effectiveness at each stage, and how well we’re moving customers from
one stage to the next.
Here’s what it looks like when we put it all together:
There are two main buckets of funnel metrics: effectiveness and efficiency.
Here are detailed descriptions of the key metrics that measure both, including
example calculations.
MARKETING FUNNEL EFFECTIVENESS METRICS
Funnel effectiveness metrics tell us how effectively our marketing messages,
offers and content are attracting and converting customers. They show us
where the obstacles lie—which stages of the funnel are experiencing problems.
Importantly, funnel effectiveness metrics let us quantify marketing performance,
helping us make data-driven decisions instead of just relying on intuition or gut
feeling.
We’ll start with the volume metrics: top-of-the-funnel awareness, mid-funnel
engagement and bottom-of-the-funnel outcomes. Think of outcomes as what
you and the business decide you’re driving—leads, sales and customer lifetime
value are common.
Awareness
[impression volume]
Have we reached a lot of people, or just a few? On which campaigns or content
themes have we doubled down? How many impressions have we created in the
UK versus the US? How does this year’s volume of impressions compare to last
year’s?
Awareness, measured as impression volume, is a top-of-the-funnel metric that
shows how many people our messages have reached. Impressions are a mainstay
metric for online display media, meaning “ads served”. But if we instead think
about impressions as an abstract concept used consistently across every channel,
the metric becomes very powerful. Email has “impressions” as well, but it’s
not “number of emails sent”—those aren’t eyeballs on emails. Rather, the best
impressions number for email is the number of emails opened (showing that
someone actually read or at least glanced at that content). In this way, every
channel can have an impression volume metric.
We also want to track impression volume per program, campaign and any other
segments the business reports on, like geography, product or customer type.
And then we can answer questions like, What’s driving the most impressions for
us? What was the breakdown of impressions served? How are the total number
of impressions trending over time?
Engagement
[sum of total engagements (weighted or not)]
When we buy a lot of eyeballs, we’ve invested in the first stage of the funnel:
awareness. Presumably, our efforts there have made plenty of people aware
of our product or brand. But are they clicking, liking, retweeting, downloading,
signing up, visiting our website or taking any other action? Engagement is
a middle-of-the-funnel metric that tracks whether our target audience is
taking action. We’ll also want to know that by campaign, channel, region, etc.,
depending on how the company reports results.
Engagement is an aggregate metric. We want to total up all the metrics that
represent actions initiated by an end user—all the signs that they interacted
with our content and/or chose to learn more. This total engagement number
can be a simple sum of likes, clicks, opens, views, downloads, pins, video views
and so on—and this is what we recommend for any marketing department
just starting out on the measurement journey. For more advanced marketing
departments, each component of engagement can be weighted according to
what the team determines is more or less meaningful. For instance, you may
decide one download equals two Pinterest pins, or that an email open is worth
twice what a click-through on a banner ad is worth. The exact weightings
aren’t as important as maintaining a consistent formula that reveals a rich
understanding of cross-channel engagement.
Engagement Rates
[engagement] / [impressions]
Where engagement is an aggregate measure of all the customers we’ve
successfully persuaded to take an action—click through, view, or like something
we did—engagement rates quantify our success at moving audiences from
the first stage of the funnel to the second—from awareness to engagement. In
other words, of all the eyeballs we’ve reached, what’s the percentage that took
an action?
Once we know total impressions and total engagements, we can use the ratio
between them as quantifiable evidence of how well our marketing draws
customers into interacting with us. To steal a TED Talk phrase, engagement
rates answer the question, “Are we creating ideas worth spreading?”
We typically know what our engagement rates are within a channel. We know
which Google AdWords copy has the highest click-through rate, which landing
pages have the highest form completion rates, and which emails have the highest
open rates. As omnichannel marketers we want cross-channel insight—what’s
engaging our customers best across it all? For that we need a normalized,
apples-to-apples metric. The way we get it is to describe engagement as a
percentage of impressions. By creating a universal engagement-rate metric, we
can compare channels and tactics to each other to evaluate things like:
1 Content interest and velocity. What do our customers care about more: helpful
hints for using our products, or discount offers? What types of content do
our customers most like to share: product photos, stories about corporate
responsibility, or funny videos? The content with the highest engagement rate
provides the answer.
2 Channel velocity. Which channels are truly engaging our target customers? Look
to the engagement rate by channel.
3 Audience engagement. Which audience resonates more with our message:
working moms or college students? Look at the engagement rate for content
run in mom-audience networks and compare that to the engagement rate when
that same content is run on sites targeted at college students, and you’ll know.
Outcomes
[lead volume, customers acquired, sales revenue]
Outcomes are the last stage of the funnel. They quantify the business
results we’ve driven. As marketing leaders are held more accountable for
bottom-of-the-funnel outcome metrics—things that translate easily to business
value—they’re increasingly asked to “sign up for a number” just like chief
revenue officers or SVPs of sales do when they take on a quota. For marketers,
that “number” might be in dollars and might not. Those of us responsible
for e-commerce certainly have a dollar figure to hit. For B2B marketers, that
“number” might be qualified leads.
Whether or not we’re responsible for any specific outcome (for example, 10,000
leads per year), most of us are at least expected to show constant improvement
(say, grow lead flow by 10%). Once we get a good sense of outcome metrics and
establish a baseline, setting targets or goals for the team is the likely next step.
Like all other funnel metrics, we need to be able to look at outcomes by channel
and campaign as well as region, segment, line of business and any other way our
business reporting is organized.
Conversion Rates
[outcomes] / [impressions]
[outcomes] / [engagement]
Similar to an engagement rate, which shows how effectively we’re moving
customers from being aware of us to engaging with us, a conversion rate reveals
how well we’re moving customers from awareness or engagement to outcomes
(sales, leads, sign-ups and so on).
Notice that there are two types of conversion rates. The first is the rate from
awareness to outcomes (outcomes/impressions). This is the overall conversion
rate that answers the question, “Of all the people who saw our stuff, what
percentage ended up buying or taking the desired action?” The second
conversion rate (outcomes/engagements) shows how effectively we convert
the folks who engaged with us.
Overall conversion rates (from impressions to outcomes) are good to know,
but if they go up or, more worrying, down, then our engagement rate and the
second conversion rate (from engagement to outcomes) can help us diagnose
the problem by breaking down the funnel to its component parts. For example,
if the engagement rate for a campaign, program or channel is very high (lots
of people are clicking) but the outcomes/engagement rate is very low, then
we know the offer, pricing or even the lead capture form has a problem that’s
preventing conversions, because the message is really resonating.
A Hypothetical Three-Stage Funnel: Volume and “Cost Per”
MARKETING FUNNEL EFFICIENCY METRICS
Now we can bring spend into the funnel-metrics equation in order to understand
cost-efficiency—what drives the most impressions, engagement and outcomes
per $1 we spend?
Let’s look at our funnel table again:
It’s critical for marketers to get a handle on efficiency metrics so we can answer
the questions that will inevitably come: “If I give you another $10,000, where will
you spend it and how will you decide?” Spend is the great normalizer—efficiency
metrics are the guide.
Note that with funnel efficiency metrics, we have to decide up front how we’re
going to define spend, and then be consistent. Some companies only choose
to include direct costs like actual media buys. Others include employee head
count, creative production costs and agency fees. It doesn’t really matter which
we choose, as long as we apply it consistently.
Cost per Impression
[spend] / [impression]
Cost per impression, or CPM, is an important metric for overall marketing ROI
calculations and channel-mix decisions—we need to know how expensive or
cheap channels are relative to each other for generating awareness. Under the
classic definition, CPM was a metric used only for an individual channel. Now,
using the expanded definition of “impression” described previously, CPM can
be a cross-channel metric.
Cost per Engagement
[spend] / [engagement]
Cost per engagement is a key efficiency metric these days, with many CMOs
going on record about how much they love cost per engagement as a rallying
cry for their organizations. This metric says: Our goal is to engage customers
(inspire them to interact with us as a brand and learn more) and we want to do
that as cost-effectively as possible.
But how to calculate it? Remember, engagement actions vary per channel—in
Twitter it’s a retweet, in search it’s a click, in YouTube it’s a video view and
so on—so be sure to use aggregate engagement (defined above) as your
denominator. The numerator is simply the sum of all our spend. Now we can
stack-rank all we do by how cost-effectively it engages consumers.
Cost per Outcome
[spend] / [outcome volume]
Measuring what it costs to acquire that customer or book that deal is, actually,
a look at profitability, and an especially familiar metric to a CFO. Like cost
per impression, cost per outcome is a foundational metric used to help make
channel-mix decisions.
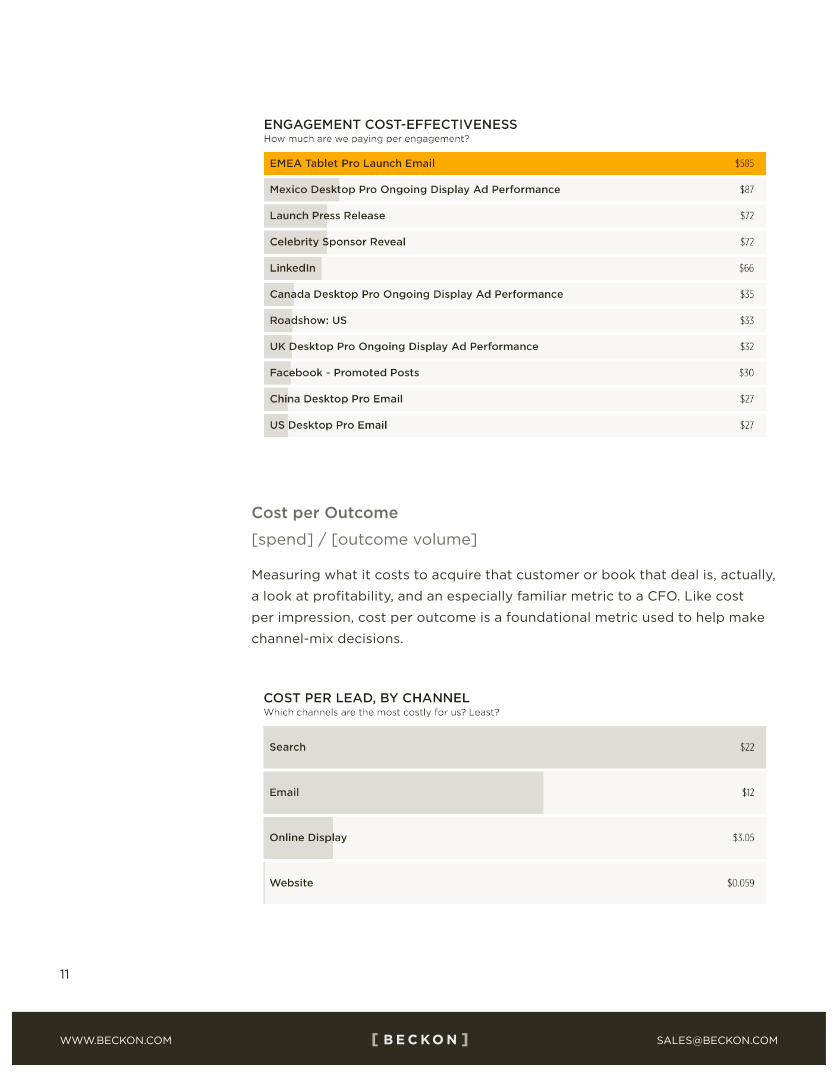
11
Marketers know we need to stop measuring our marketing performance in
terms of clicks, likes and shares. We know we’re performing when we generate
awareness, engage customers and produce outcomes (revenue, sales, leads,
customer sign-ups). But many of us still aren’t clear on exactly how to quantify
that performance. Funnel metrics are where that happens.
Most marketers are familiar with the purchase funnel, or buyer’s journey—a
simple marketing model that’s been in use for over 100 years. It says that from
the time a customer becomes aware of our products to the time they actually
purchase from us, they’re on a journey that can be divided into stages. From a
customer’s point of view, those stages (at their most basic) are 1) to become
aware of or consider a brand, 2) to choose to learn more, and 3) to decide to
purchase. More complex funnels can include more stages.
Funnel metrics map directly to these stages, and reveal how we’re performing in
terms of the buyer’s journey. Whether we use a three-stage funnel, a six-stage
buyer’s journey or any other funnel, funnel metrics let us understand our volume
and cost-effectiveness at each stage, and how well we’re moving customers from
one stage to the next.
Here’s what it looks like when we put it all together:
There are two main buckets of funnel metrics: effectiveness and efficiency.
Here are detailed descriptions of the key metrics that measure both, including
example calculations.
MARKETING FUNNEL EFFECTIVENESS METRICS
Funnel effectiveness metrics tell us how effectively our marketing messages,
offers and content are attracting and converting customers. They show us
where the obstacles lie—which stages of the funnel are experiencing problems.
Importantly, funnel effectiveness metrics let us quantify marketing performance,
helping us make data-driven decisions instead of just relying on intuition or gut
feeling.
We’ll start with the volume metrics: top-of-the-funnel awareness, mid-funnel
engagement and bottom-of-the-funnel outcomes. Think of outcomes as what
you and the business decide you’re driving—leads, sales and customer lifetime
value are common.
Awareness
[impression volume]
Have we reached a lot of people, or just a few? On which campaigns or content
themes have we doubled down? How many impressions have we created in the
UK versus the US? How does this year’s volume of impressions compare to last
year’s?
Awareness, measured as impression volume, is a top-of-the-funnel metric that
shows how many people our messages have reached. Impressions are a mainstay
metric for online display media, meaning “ads served”. But if we instead think
about impressions as an abstract concept used consistently across every channel,
the metric becomes very powerful. Email has “impressions” as well, but it’s
not “number of emails sent”—those aren’t eyeballs on emails. Rather, the best
impressions number for email is the number of emails opened (showing that
someone actually read or at least glanced at that content). In this way, every
channel can have an impression volume metric.
We also want to track impression volume per program, campaign and any other
segments the business reports on, like geography, product or customer type.
And then we can answer questions like, What’s driving the most impressions for
us? What was the breakdown of impressions served? How are the total number
of impressions trending over time?
Engagement
[sum of total engagements (weighted or not)]
When we buy a lot of eyeballs, we’ve invested in the first stage of the funnel:
awareness. Presumably, our efforts there have made plenty of people aware
of our product or brand. But are they clicking, liking, retweeting, downloading,
signing up, visiting our website or taking any other action? Engagement is
a middle-of-the-funnel metric that tracks whether our target audience is
taking action. We’ll also want to know that by campaign, channel, region, etc.,
depending on how the company reports results.
Engagement is an aggregate metric. We want to total up all the metrics that
represent actions initiated by an end user—all the signs that they interacted
with our content and/or chose to learn more. This total engagement number
can be a simple sum of likes, clicks, opens, views, downloads, pins, video views
and so on—and this is what we recommend for any marketing department
just starting out on the measurement journey. For more advanced marketing
departments, each component of engagement can be weighted according to
what the team determines is more or less meaningful. For instance, you may
decide one download equals two Pinterest pins, or that an email open is worth
twice what a click-through on a banner ad is worth. The exact weightings
aren’t as important as maintaining a consistent formula that reveals a rich
understanding of cross-channel engagement.
Engagement Rates
[engagement] / [impressions]
Where engagement is an aggregate measure of all the customers we’ve
successfully persuaded to take an action—click through, view, or like something
we did—engagement rates quantify our success at moving audiences from
the first stage of the funnel to the second—from awareness to engagement. In
other words, of all the eyeballs we’ve reached, what’s the percentage that took
an action?
Once we know total impressions and total engagements, we can use the ratio
between them as quantifiable evidence of how well our marketing draws
customers into interacting with us. To steal a TED Talk phrase, engagement
rates answer the question, “Are we creating ideas worth spreading?”
We typically know what our engagement rates are within a channel. We know
which Google AdWords copy has the highest click-through rate, which landing
pages have the highest form completion rates, and which emails have the highest
open rates. As omnichannel marketers we want cross-channel insight—what’s
engaging our customers best across it all? For that we need a normalized,
apples-to-apples metric. The way we get it is to describe engagement as a
percentage of impressions. By creating a universal engagement-rate metric, we
can compare channels and tactics to each other to evaluate things like:
1 Content interest and velocity. What do our customers care about more: helpful
hints for using our products, or discount offers? What types of content do
our customers most like to share: product photos, stories about corporate
responsibility, or funny videos? The content with the highest engagement rate
provides the answer.
2 Channel velocity. Which channels are truly engaging our target customers? Look
to the engagement rate by channel.
3 Audience engagement. Which audience resonates more with our message:
working moms or college students? Look at the engagement rate for content
run in mom-audience networks and compare that to the engagement rate when
that same content is run on sites targeted at college students, and you’ll know.
Outcomes
[lead volume, customers acquired, sales revenue]
Outcomes are the last stage of the funnel. They quantify the business
results we’ve driven. As marketing leaders are held more accountable for
bottom-of-the-funnel outcome metrics—things that translate easily to business
value—they’re increasingly asked to “sign up for a number” just like chief
revenue officers or SVPs of sales do when they take on a quota. For marketers,
that “number” might be in dollars and might not. Those of us responsible
for e-commerce certainly have a dollar figure to hit. For B2B marketers, that
“number” might be qualified leads.
Whether or not we’re responsible for any specific outcome (for example, 10,000
leads per year), most of us are at least expected to show constant improvement
(say, grow lead flow by 10%). Once we get a good sense of outcome metrics and
establish a baseline, setting targets or goals for the team is the likely next step.
Like all other funnel metrics, we need to be able to look at outcomes by channel
and campaign as well as region, segment, line of business and any other way our
business reporting is organized.
Conversion Rates
[outcomes] / [impressions]
[outcomes] / [engagement]
Similar to an engagement rate, which shows how effectively we’re moving
customers from being aware of us to engaging with us, a conversion rate reveals
how well we’re moving customers from awareness or engagement to outcomes
(sales, leads, sign-ups and so on).
Notice that there are two types of conversion rates. The first is the rate from
awareness to outcomes (outcomes/impressions). This is the overall conversion
rate that answers the question, “Of all the people who saw our stuff, what
percentage ended up buying or taking the desired action?” The second
conversion rate (outcomes/engagements) shows how effectively we convert
the folks who engaged with us.
Overall conversion rates (from impressions to outcomes) are good to know,
but if they go up or, more worrying, down, then our engagement rate and the
second conversion rate (from engagement to outcomes) can help us diagnose
the problem by breaking down the funnel to its component parts. For example,
if the engagement rate for a campaign, program or channel is very high (lots
of people are clicking) but the outcomes/engagement rate is very low, then
we know the offer, pricing or even the lead capture form has a problem that’s
preventing conversions, because the message is really resonating.
A Hypothetical Three-Stage Funnel: Volume and “Cost Per”
MARKETING FUNNEL EFFICIENCY METRICS
Now we can bring spend into the funnel-metrics equation in order to understand
cost-efficiency—what drives the most impressions, engagement and outcomes
per $1 we spend?
Let’s look at our funnel table again:
It’s critical for marketers to get a handle on efficiency metrics so we can answer
the questions that will inevitably come: “If I give you another $10,000, where will
you spend it and how will you decide?” Spend is the great normalizer—efficiency
metrics are the guide.
Note that with funnel efficiency metrics, we have to decide up front how we’re
going to define spend, and then be consistent. Some companies only choose
to include direct costs like actual media buys. Others include employee head
count, creative production costs and agency fees. It doesn’t really matter which
we choose, as long as we apply it consistently.
Cost per Impression
[spend] / [impression]
Cost per impression, or CPM, is an important metric for overall marketing ROI
calculations and channel-mix decisions—we need to know how expensive or
cheap channels are relative to each other for generating awareness. Under the
classic definition, CPM was a metric used only for an individual channel. Now,
using the expanded definition of “impression” described previously, CPM can
be a cross-channel metric.
Cost per Engagement
[spend] / [engagement]
Cost per engagement is a key efficiency metric these days, with many CMOs
going on record about how much they love cost per engagement as a rallying
cry for their organizations. This metric says: Our goal is to engage customers
(inspire them to interact with us as a brand and learn more) and we want to do
that as cost-effectively as possible.
But how to calculate it? Remember, engagement actions vary per channel—in
Twitter it’s a retweet, in search it’s a click, in YouTube it’s a video view and
so on—so be sure to use aggregate engagement (defined above) as your
denominator. The numerator is simply the sum of all our spend. Now we can
stack-rank all we do by how cost-effectively it engages consumers.
Cost per Outcome
[spend] / [outcome volume]
Measuring what it costs to acquire that customer or book that deal is, actually,
a look at profitability, and an especially familiar metric to a CFO. Like cost
per impression, cost per outcome is a foundational metric used to help make
channel-mix decisions.
12
Marketers know we need to stop measuring our marketing performance in
terms of clicks, likes and shares. We know we’re performing when we generate
awareness, engage customers and produce outcomes (revenue, sales, leads,
customer sign-ups). But many of us still aren’t clear on exactly how to quantify
that performance. Funnel metrics are where that happens.
Most marketers are familiar with the purchase funnel, or buyer’s journey—a
simple marketing model that’s been in use for over 100 years. It says that from
the time a customer becomes aware of our products to the time they actually
purchase from us, they’re on a journey that can be divided into stages. From a
customer’s point of view, those stages (at their most basic) are 1) to become
aware of or consider a brand, 2) to choose to learn more, and 3) to decide to
purchase. More complex funnels can include more stages.
Funnel metrics map directly to these stages, and reveal how we’re performing in
terms of the buyer’s journey. Whether we use a three-stage funnel, a six-stage
buyer’s journey or any other funnel, funnel metrics let us understand our volume
and cost-effectiveness at each stage, and how well we’re moving customers from
one stage to the next.
Here’s what it looks like when we put it all together:
There are two main buckets of funnel metrics: effectiveness and efficiency.
Here are detailed descriptions of the key metrics that measure both, including
example calculations.
MARKETING FUNNEL EFFECTIVENESS METRICS
Funnel effectiveness metrics tell us how effectively our marketing messages,
offers and content are attracting and converting customers. They show us
where the obstacles lie—which stages of the funnel are experiencing problems.
Importantly, funnel effectiveness metrics let us quantify marketing performance,
helping us make data-driven decisions instead of just relying on intuition or gut
feeling.
We’ll start with the volume metrics: top-of-the-funnel awareness, mid-funnel
engagement and bottom-of-the-funnel outcomes. Think of outcomes as what
you and the business decide you’re driving—leads, sales and customer lifetime
value are common.
Awareness
[impression volume]
Have we reached a lot of people, or just a few? On which campaigns or content
themes have we doubled down? How many impressions have we created in the
UK versus the US? How does this year’s volume of impressions compare to last
year’s?
Awareness, measured as impression volume, is a top-of-the-funnel metric that
shows how many people our messages have reached. Impressions are a mainstay
metric for online display media, meaning “ads served”. But if we instead think
about impressions as an abstract concept used consistently across every channel,
the metric becomes very powerful. Email has “impressions” as well, but it’s
not “number of emails sent”—those aren’t eyeballs on emails. Rather, the best
impressions number for email is the number of emails opened (showing that
someone actually read or at least glanced at that content). In this way, every
channel can have an impression volume metric.
We also want to track impression volume per program, campaign and any other
segments the business reports on, like geography, product or customer type.
And then we can answer questions like, What’s driving the most impressions for
us? What was the breakdown of impressions served? How are the total number
of impressions trending over time?
Engagement
[sum of total engagements (weighted or not)]
When we buy a lot of eyeballs, we’ve invested in the first stage of the funnel:
awareness. Presumably, our efforts there have made plenty of people aware
of our product or brand. But are they clicking, liking, retweeting, downloading,
signing up, visiting our website or taking any other action? Engagement is
a middle-of-the-funnel metric that tracks whether our target audience is
taking action. We’ll also want to know that by campaign, channel, region, etc.,
depending on how the company reports results.
Engagement is an aggregate metric. We want to total up all the metrics that
represent actions initiated by an end user—all the signs that they interacted
with our content and/or chose to learn more. This total engagement number
can be a simple sum of likes, clicks, opens, views, downloads, pins, video views
and so on—and this is what we recommend for any marketing department
just starting out on the measurement journey. For more advanced marketing
departments, each component of engagement can be weighted according to
what the team determines is more or less meaningful. For instance, you may
decide one download equals two Pinterest pins, or that an email open is worth
twice what a click-through on a banner ad is worth. The exact weightings
aren’t as important as maintaining a consistent formula that reveals a rich
understanding of cross-channel engagement.
Engagement Rates
[engagement] / [impressions]
Where engagement is an aggregate measure of all the customers we’ve
successfully persuaded to take an action—click through, view, or like something
we did—engagement rates quantify our success at moving audiences from
the first stage of the funnel to the second—from awareness to engagement. In
other words, of all the eyeballs we’ve reached, what’s the percentage that took
an action?
Once we know total impressions and total engagements, we can use the ratio
between them as quantifiable evidence of how well our marketing draws
customers into interacting with us. To steal a TED Talk phrase, engagement
rates answer the question, “Are we creating ideas worth spreading?”
We typically know what our engagement rates are within a channel. We know
which Google AdWords copy has the highest click-through rate, which landing
pages have the highest form completion rates, and which emails have the highest
open rates. As omnichannel marketers we want cross-channel insight—what’s
engaging our customers best across it all? For that we need a normalized,
apples-to-apples metric. The way we get it is to describe engagement as a
percentage of impressions. By creating a universal engagement-rate metric, we
can compare channels and tactics to each other to evaluate things like:
1 Content interest and velocity. What do our customers care about more: helpful
hints for using our products, or discount offers? What types of content do
our customers most like to share: product photos, stories about corporate
responsibility, or funny videos? The content with the highest engagement rate
provides the answer.
2 Channel velocity. Which channels are truly engaging our target customers? Look
to the engagement rate by channel.
3 Audience engagement. Which audience resonates more with our message:
working moms or college students? Look at the engagement rate for content
run in mom-audience networks and compare that to the engagement rate when
that same content is run on sites targeted at college students, and you’ll know.
Outcomes
[lead volume, customers acquired, sales revenue]
Outcomes are the last stage of the funnel. They quantify the business
results we’ve driven. As marketing leaders are held more accountable for
bottom-of-the-funnel outcome metrics—things that translate easily to business
value—they’re increasingly asked to “sign up for a number” just like chief
revenue officers or SVPs of sales do when they take on a quota. For marketers,
that “number” might be in dollars and might not. Those of us responsible
for e-commerce certainly have a dollar figure to hit. For B2B marketers, that
“number” might be qualified leads.
Whether or not we’re responsible for any specific outcome (for example, 10,000
leads per year), most of us are at least expected to show constant improvement
(say, grow lead flow by 10%). Once we get a good sense of outcome metrics and
establish a baseline, setting targets or goals for the team is the likely next step.
Like all other funnel metrics, we need to be able to look at outcomes by channel
and campaign as well as region, segment, line of business and any other way our
business reporting is organized.
Conversion Rates
[outcomes] / [impressions]
[outcomes] / [engagement]
Similar to an engagement rate, which shows how effectively we’re moving
customers from being aware of us to engaging with us, a conversion rate reveals
how well we’re moving customers from awareness or engagement to outcomes
(sales, leads, sign-ups and so on).
Notice that there are two types of conversion rates. The first is the rate from
awareness to outcomes (outcomes/impressions). This is the overall conversion
rate that answers the question, “Of all the people who saw our stuff, what
percentage ended up buying or taking the desired action?” The second
conversion rate (outcomes/engagements) shows how effectively we convert
the folks who engaged with us.
Overall conversion rates (from impressions to outcomes) are good to know,
but if they go up or, more worrying, down, then our engagement rate and the
second conversion rate (from engagement to outcomes) can help us diagnose
the problem by breaking down the funnel to its component parts. For example,
if the engagement rate for a campaign, program or channel is very high (lots
of people are clicking) but the outcomes/engagement rate is very low, then
we know the offer, pricing or even the lead capture form has a problem that’s
preventing conversions, because the message is really resonating.
A Hypothetical Three-Stage Funnel: Volume and “Cost Per”
MARKETING FUNNEL EFFICIENCY METRICS
Now we can bring spend into the funnel-metrics equation in order to understand
cost-efficiency—what drives the most impressions, engagement and outcomes
per $1 we spend?
Let’s look at our funnel table again:
It’s critical for marketers to get a handle on efficiency metrics so we can answer
the questions that will inevitably come: “If I give you another $10,000, where will
you spend it and how will you decide?” Spend is the great normalizer—efficiency
metrics are the guide.
Note that with funnel efficiency metrics, we have to decide up front how we’re
going to define spend, and then be consistent. Some companies only choose
to include direct costs like actual media buys. Others include employee head
count, creative production costs and agency fees. It doesn’t really matter which
we choose, as long as we apply it consistently.
Cost per Impression
[spend] / [impression]
Cost per impression, or CPM, is an important metric for overall marketing ROI
calculations and channel-mix decisions—we need to know how expensive or
cheap channels are relative to each other for generating awareness. Under the
classic definition, CPM was a metric used only for an individual channel. Now,
using the expanded definition of “impression” described previously, CPM can
be a cross-channel metric.
Cost per Engagement
[spend] / [engagement]
Cost per engagement is a key efficiency metric these days, with many CMOs
going on record about how much they love cost per engagement as a rallying
cry for their organizations. This metric says: Our goal is to engage customers
(inspire them to interact with us as a brand and learn more) and we want to do
that as cost-effectively as possible.
But how to calculate it? Remember, engagement actions vary per channel—in
Twitter it’s a retweet, in search it’s a click, in YouTube it’s a video view and
so on—so be sure to use aggregate engagement (defined above) as your
denominator. The numerator is simply the sum of all our spend. Now we can
stack-rank all we do by how cost-effectively it engages consumers.
Cost per Outcome
[spend] / [outcome volume]
Measuring what it costs to acquire that customer or book that deal is, actually,
a look at profitability, and an especially familiar metric to a CFO. Like cost
per impression, cost per outcome is a foundational metric used to help make
channel-mix decisions.
FURTHER READING
Funnel metrics reveal how we’re performing in terms of the buyer’s journey.
Whether we use a three-stage funnel, a six-stage buyer’s journey or any other
funnel, funnel metrics let us understand our volume and cost-effectiveness at
each stage, and how well we’re moving customers from one stage to the next.
For a complete overview of all the metrics that matter, including ROMO, ROMI
and paid-earned-owned media ratios, see The Integrated Marketing Analytics
Guidebook: Metrics That Matter.
http://bit.ly/1svqV1c
http://bit.ly/1svqV1c
ABOUT BECKON
Beckon is omni-channel analytics software for marketing in all its modern complexity. Our
software-as-a-service platform integrates messy marketing data and delivers rich dashboards for
cross-channel marketing intelligence. Built by marketers for marketers, Beckon is the dashboard to
the CMO—industry best-practice analytics and marketing-impact metrics right out of the box for
ultra-fast time to marketing value. Beckon serves marketers who want to bring order to chaos, make
data-informed optimization decisions, and tell the marketing story in terms of business impact. Find
your strength in numbers with Beckon.
LEARN MORE
Contact us for a complimentary consultation to find out how Beckon can help you better demonstrate
the marketing contribution at your organization.
107 SOUTH B STREET, SUITE 300
SAN MATEO, CA 94401


![Marketing Funnel by Bill Quinn [Metrics Marketing Bootcamp]](https://img.pdfslide.us/doc/110x75/555be962d8b42a38078b51a0/marketing-funnel-by-bill-quinn-metrics-marketing-bootcamp.jpg)