Embed Size (px)
Citation preview
MARK311 Final White Paper Deliverable Neier
BowTie Cause Marketing Research 1 Cho, Garton, Khosa, Milord, Martini
Market Research
for
Bowtie Cause
Final White Paper
Team Members: Monica Khosa, RaShelle Garton,
Hyejin Cho, Sami Martini, Ryan Milord
MARK311 Final White Paper Deliverable Neier
BowTie Cause Marketing Research 2 Cho, Garton, Khosa, Milord, Martini
TABLE OF CONTENTS
Executive Summary………….………………………………………………………………….3
Background & Opportunities…………………………………………………………………...4
Solution…………………………………………………………………………………………...6
Conclusion………………………………………………………………………………………14
Works Cited……………………………………………………………………………………..20
Appendix………………………………………………………………………………………...21
Survey……………………………………………………………………………………21
Frequencies……………………………………………………………………………...28
Frequency Charts……………………………………………………………………….46
Other Question Responses……………………………………………………………..56
Demographic/Geographical Data……………………………………………………...57
Cross-tabulations…………………………………………………………………….....58
In-depth Interviews……………………...…………………….……………….……...102
Resumes………………………………………………………………………..………119
MARK311 Final White Paper Deliverable Neier
BowTie Cause Marketing Research 3 Cho, Garton, Khosa, Milord, Martini
Executive Summary BowTie cause is an online retailer that sells cause apparel, and is looking to grow their
business. This study was conducted in order to gain insights regarding the phenomena of cause
marketing. According to the Mintel Academic report, cause related marketing is: “a marketing
tactic that combines selling a brand with doing good for the world”.
This study was conducted by collecting qualitative data in the form of in depth
interviews, as well as qualitative data in the form of surveys administered via Qualtrics. The
overarching theme of the study was examining how cause related marketing affects consumer
purchasing behavior. 5 research objectives were explored in order to gain a holistic
understanding of cause marketing. They were as follows: (1) To understand the role in which
social media plays in brand development, (2) To assess the different factors that influence
consumer purchases in relation to philanthropic causes, (3) To investigate purchasing trends of a
socially aware consumer, (4) to research geographical locations where there is higher demand for
cause related products, and (5) To find out the influence celebrity endorsements have on
consumer behavior.
To pursue these research objectives, data was collected and analyzed from both the
surveys and the interviews. One of the findings, for example, suggest that health related causes
are the most popular causes to purchase from, as 28.8% of respondents stated that healthcare
related causes are their most preferred cause. 41.6% of people suggested that their #1
consideration when purchasing goods related to a cause is what type of cause is being supported.
The in-depth interviews assisted with contextualizing the numerical results. For instance, one
respondent suggested that the biggest motivator for purchasing cause related products was
altruism.
The data findings were complex and nuanced, and therefore subject to interpretation. It is
hoped that the conclusions that can be drawn from this study will prove to be useful to BowTie
cause. If there are any questions, please contact the authors.
The 19 question survey based on cause-related marketing yielded a total of 89 responses
with 49 completed surveys.
MARK311 Final White Paper Deliverable Neier
BowTie Cause Marketing Research 4 Cho, Garton, Khosa, Milord, Martini
Background & Opportunities
The following includes a background description of what initiated the need for market
research. The research was done in an effort to properly understand the needs of the client and
their marketing efforts in hopes to better equip BowTie Cause with data and analysis to reach its
target market.
BowTie Cause is an organization that designs and sells signature bowties that directly
relate to a specific social cause. Categorized as a social-enterprise BowTie Cause dances on a
fine line between operating as a for-profit business while still trying to achieve social change.
The idea behind BowTie Cause began with retired football player Dhani Jones. The goal of the
organization is to make a profit while helping to raise awareness of causes. Currently, BowTie
cause offers 144 bow ties and has 109 organizational partners. BowTie Cause seeks to grow its
business, and thus is currently looking for growth opportunities.
It was imperative to present a promising case for BowTie Cause in order to satisfy their
needs. In order to do so, it was key to abide by the RFI implications by following the proper
research design. The research team decided to follow the exploratory research design that
included focus groups, a key informant interview, secondary data literature search, and
observational methods 1 . Through these exploratory design subsections, the appropriate
knowledge was obtained in an effort to fully satisfy BowTie Causes wants and needs.
The first step to the problem formation process is to meet with the client in order to
define the problem/opportunity correctly2 . The research team met with the client, Amanda
Williams, BowTie Cause CEO. Based on this key informant interview, it became apparent that
the main concerns and goals included developing a consistent recognizable brand, maintaining
an online presence with their website and with social media and exploring potential growth
opportunities. Bowtie Cause has reached a crossroads, a stage in which their company’s
advancement has directional strategy for future opportunities but is limited without additional
research. So with this framework in mind, this lead to the Managerial Decision Opportunity
(MDO) as follows:
The research team was in agreement that this MDO was consistent with the client’s needs
relating to the major concerns listed above. In order to expand on the MDO, the research team
came up with five research objectives. Each research objective directly relates to a specific
theme that is meant to help answer the MDO.
1 (Churchill 37) 2 (Churchill 50)
In what ways can cause marketing influence the way in
which consumers purchase?
MARK311 Final White Paper Deliverable Neier
BowTie Cause Marketing Research 5 Cho, Garton, Khosa, Milord, Martini
● To understand the role in which social media plays in brand development.
● To investigate purchasing trends of a socially aware consumer.
● To assess the different factors that influence consumer purchases in relation to
philanthropic causes.
● Research geographical locations where there is higher demand for cause-related products.
● To find out the influence celebrity endorsements have on consumer purchase behavior.
The first objective relates to online presence and brand development. Brand development
is key for any company to be successful, and since BowTie Cause is still in the process of
developing a consistent brand, it is important to learn more about how online presence through
social media can play a role in this process.
The second objective was developed in a way to identify growth opportunities by
pinpointing purchasing trends of socially aware consumers. Once these trends are identified,
BowTie Cause can then use the information collected in order to take advantage of any growth
opportunities that should arise. This leads directly into the next objective which is intended to
help BowTie Cause identify the different factors that influence consumer purchases in relation to
philanthropic causes such as theirs.
The intent behind the fourth objective was to discover geographical locations with a
higher demand for cause related products in order for BowTie Cause to know where to focus
their marketing efforts. Finally, the fifth objective focuses on the influence of celebrity
endorsements in relation to consumer purchase behavior and how that can increase both brand
development and growth. In order to become a business partner that acted on behalf of BowTie
Cause, it was imperative to listen to their concerns and base the research around what they
needed.
Through literature search, quantitative and qualitative data was obtained on cause-related
marketing, purchase behavior, and social media effectiveness. Data from quantitative, descriptive,
and exploratory data on the cause marketing could be achieved through literature Search. It
supported the background of information about the influence of social media, purchasing trends
for bowties, impact of celebrity endorsements, purchasing tendency of cause-related product,
motivation factors for purchasing decision. A significant data based on 2,000 internet users aged
over 18 shows that 51% of people do prefer buying from cause-related company3.
Initially, while drafting the RFI, the research team had developed all 5 objectives as
follows:
● To understand the role in which social media plays in brand development.
● To investigate purchasing trends of a socially aware consumer.
● Research geographical locations where there is a higher demand for bow ties.
● To find out what type of cause marketing consumers are most receptive to.
● To assess the different factors that influence consumer purchases in relation to
philanthropic causes.
3 Mintel
MARK311 Final White Paper Deliverable Neier
BowTie Cause Marketing Research 6 Cho, Garton, Khosa, Milord, Martini
Upon reflection, the fourth objective proved to be too broad and non-specific to the established
MDO. This objective was then changed to the following:
● To find out the influence celebrity endorsements have on consumer purchase behavior.
The new objective was a better fit for the client and the research teams’ MDO. Since BowTie
Cause has already incorporated celebrities in with their brand, the research team felt that this new
objective would be more beneficial to the client’s needs. There was a second alteration that was
made to the 5 initial objectives as well, this was made to the third objective. The research team
felt that this objective was too narrow by only including demand for bow ties. In order to create a
less bias research objective, ‘bow ties’ was changed to ‘cause related products.’
Solution
The following delineates the processes taken in the collection of data. This includes the
research methods undertaken including a focus group moderator guide to conduct in depth
interviews and the creation of an interactive, online survey.
A focus group moderator guide4 was developed as a guideline to initiate a dialogue
between the interviewer and the interviewee. It assisted with the direction and flow of the
conversation while initiating the interviewee to expand on certain thoughts. The in-depth
interviews were meant to provide the research team with qualitative data. This included a series
of questions which prompted the participant to reflect on their insights on each of the mentioned
research objectives. A total of five in-depth interviews were conducted.
These in-depth interviews featured a total of 10 questions, with 3 engagement questions,
5 exploration questions, and 2 exit questions. It’s important to note that these questions merely
served as conversation starters. Our team adopted a funnel approach to questioning, with broad
questions being asked first to prompt the respondent to speak as much as possible, followed by
more specific follow-up questions. The follow-up questions varied from interview to interview,
as they were meant to prompt the respondent to elaborate and expand upon certain points that
they already shared. In that sense, the interviews were of a conversational nature, therefore
creating a comfortable environment for respondents to answer candidly.
The in-depth interviews were meant to enhance the understanding of the big picture of
cause marketing and its impact on consumer purchasing behavior. The questions were broad
enough so that they aren’t directly relatable to any single research objective, but many of the
questions overlapped with research objectives 1, 2 and 55. In general, the in-depth interviews
served the purpose of providing insights that survey questions cannot produce and
contextualizing our quantitative data.
As previously mentioned, the first 3 questions were engagement questions that served as
a starting point for the conversations with interviewees. They included questions such as: “Are
you involved with any philanthropic causes?” and “What do you think cause-related marketing 4 See appendix for in-depth interviews 5 See appendix for list of questions
MARK311 Final White Paper Deliverable Neier
BowTie Cause Marketing Research 7 Cho, Garton, Khosa, Milord, Martini
is?” These questions were chosen to serve as starting points for the conversation because they are
questions that anybody can answer. Additionally, they served as a way to understand the
respondent’s background and underlying viewpoints going into the survey. The engagement
questions were the broadest questions that were asked because they made no assumptions about
the person being interviewed.
The next 5 questions were exploratory questions, such as “How often do causes influence
your purchase decisions?” and “What do you believe motivates people from purchasing a cause-
related brand?” These questions were less open-ended than the engagement questions asked
directly before. Exploratory questions are meant to get at the heart of the matter, which is the
respondent’s opinion, thoughts, and sentiments regarding cause-related marketing.
The last 2 questions were exit questions, which gave the respondent the opportunity to
share whatever they felt was relevant at the end of the interview. Exit questions are meant to
allow the interviewee to summarize their thoughts and to add things that they weren’t asked
about that they feel like sharing. For example, the last question of the interview was “Does
cause-related marketing affect your purchasing behavior?” This question is designed to prompt
the interviewee to revisit all that they have said and to summarize it. Many respondents have
added on to their previous statements while answering this question. The exit questions were
fairly broad in order to allow the respondents to describe their answers as much as possible.
Additionally, an online software tool, Qualtrics, was used in the collection of quantitative
data. Qualtrics was used to design, pretest, and distribute surveys. There were a total of 89
surveys administered, of which 49 were completed. The reason for this low completion rate was
due to technical difficulties while completing surveys on mobile devices. The video clip proved
to be the primary source to these barriers. Regardless of any issues, this was determined to be an
adequate sample size that can minimize the effect that random errors have on the accuracy of the
data.
The Qualtrics survey featured 19 questions that related to each one of the research
objectives. In order to produce valuable data, a diverse array of questions were included. The
survey had 7 nominal questions, 5 ordinal questions, 2 ratio questions, and 4 interval questions.
It was important to have multiple questions under each measurement scale in order to minimize
non-sampling, systematic, and random error. Additionally, interactive features of Qualtrics, such
as videos, sliding scale questions, and ranking questions were utilized to create a visually
appealing, engaging survey. The color scheme was set to match that of BowTie Cause in order to
familiarize the respondent with the BTC brand. The survey was tested extensively in order to
enhance usability and accuracy.
In order to attain the highest quality data, a survey was created from scratch in order to
tailor its questions specifically to the MDO. No questions from the Qualtrics question bank were
included in the survey. The questions were asked in a neutral, objective manner so that the
respondent would not feel inclined to choose one option over the other. The research team
worked diligently to create a survey that was free of leading questions and any other biases.
Additionally, the answers to the questions were designed to be exhaustive, giving the respondent
a full range of possible answers to select.
Additionally, the survey was extensively tested, over 700 times, to offer the respondents a
MARK311 Final White Paper Deliverable Neier
BowTie Cause Marketing Research 8 Cho, Garton, Khosa, Milord, Martini
seamless survey experience, and to offer BowTie Cause accurate data. As such, questions were
carefully selected and phrased in order to make the questions easy to understand and easy to
respond to, a total of 28 questions were discarded in the process. The types of erroneous
questions that were removed were questions that were too vague, questions that offered mutually
inclusive choices as answers, and redundant questions. Pre-testing was performed over the
course of several weeks. The survey was administered to various individuals and was changed in
response to the feedback given. Additionally, the survey was administered to a graduate assistant,
who gave a final critique.
The initial sampling frame consisted of socially aware individuals that were actively engaged
in some kind of philanthropic cause. The amount of activity can vary from small donations made
to being actively participating in fundraising events. Younger individuals between the ages of
19-27 were the primary target as the team felt that this demographics would be more relatable to
the sampling frame. From this the surveys were mainly distributed on social media websites. The
two primary websites include Facebook and Twitter. Each team member posted the link to the
survey on his or her personal Facebook profiles. This allowed for everyone on the friends list to
be able to view the link in addition to having the option to take the survey. Each team member
has approximately 700 Facebook friends. Multiplying this by five for each team member the
survey was exposed to at least 3,500 potential participants on Facebook alone. This did, however,
limit the geographical locations as it is based on each individual of the research team.
The survey was designed so that no respondent would be led to respond in a way that
they normally wouldn’t. Objectivity was the main point of the survey. By distributing the survey
online, a wide range of people had access to it. Everyone was given the opportunity to answer
the survey anonymously. This was all done to ensure getting accurate, quality data.
The survey size of 40 was statistically sufficient, and the questions were phrased
objectively. Both of these factors served to insure internal validity. Internal validity is the extent
to which there is confidence that the measured dependent variables are being affected by the
independent variables.
Although the survey at a satisfactory size, it did emphasize certain demographics more
than others. Because of this, the survey may or may not have much external validity. The extent
to which this survey is applicable to the general population, or other segments of the population
is unknown. The demographics that were clearly overrepresented were millennials, students, and
young professionals. All but 2 responses occurred in the state of Illinois. Middle aged working
people, as well as senior citizens, were both underrepresented in the survey.
The research in this study was carried out in full compliance with the ICC/ESOMAR
international code on marketing research. The research was carried out transparently and
honestly. Respondents were given the incentives they were promised when they completed the
survey. They were told exactly what the survey contained, how their information will be handled,
and for what it will be used. They were given the option to remain anonymous. These practices
are standard in the area of marketing research.
One ethical issue that was encountered throughout the course of this study was the issue
of data representation. The completion rates for the survey are at 50%, and for a while the cause
MARK311 Final White Paper Deliverable Neier
BowTie Cause Marketing Research 9 Cho, Garton, Khosa, Milord, Martini
was unknown. It was unclear how to represent the data ethically, as some surveys were
incomplete, while others were complete. Later on, it became clear that the problem stemmed
from mobile use of the survey. Mobile phones used an external app to play the video in the
survey, and this caused mobile respondents to inadvertently leave the survey. This issue likely
did not affect the validity of any answers, but it was still an ethical responsibility to disclose the
problems that were encountered. Regarding this issue, the ESOMAR code specifically says in
article 11c: “Researchers should always make available the technical information necessary to
assess the validity of any published findings”6
Once the survey was completed and closed via Qualtrics, the research team converted the
Qualtrics data into SPSS. Once logged into Qualtrics, from the home page, click on the “View
Results” tab, then click “Download Data”. There are many formats to choose from, click on the
second link under SPSS that says “Download SPSS .sav File”. Once the file is downloaded and
opened in SPSS, there is no need to go back into Qualtrics.
The downloaded SPSS file includes some irrelevant information that was deleted in order
to clean the file up and increase efficiency. This information is under the “Data View” tab and
includes: the survey introduction, transition questions, the survey conclusion, and other columns
that SPSS automatically creates with every new file. Also under this tab were some variables that
SPSS was unable to code properly which resulted in a “system-missing” value. The research
team had to recode these values in order to receive the accurate data when running frequencies
and cross-tabulations. Under the “Variable View” tab, the research team then renamed each
question with keywords for easier analysis and made sure every question had a set of values
paired with it in order to receive accurate frequencies and cross-tabulations.
One of the first things the research team did after correctly renaming and labeling the file
was analyze the results of each individual variables. In order to accurately do this, the
frequencies must be done for each individual variable. This is done by clicking on the ‘Analyze’
tab toward the top of the page, then scrolling down and clicking on ‘Descriptive Statistics,’ from 6 ICC/ESOMAR international code on market and social research, Article 11(c).
MARK311 Final White Paper Deliverable Neier
BowTie Cause Marketing Research 10 Cho, Garton, Khosa, Milord, Martini
there clicking on the drop down tab ‘Frequencies.’ Select all variables that need frequencies run
then click the arrow so everything selected moves under the ‘Variables’ section. Click ‘Statistics’,
in the top right hand corner check the boxes ‘mean, median, and mode,’ then click continue.
Click ‘charts’ to add bar charts or pie charts into the frequencies.
There are two objectives that the research team designed to work together in this process.
Both the second and third research objectives are geared toward consumer purchases. The second
objective focuses on socially aware consumers while the third objective focuses on philanthropic
causes. Throughout the data analysis process, the research team noticed a few variables that
came up more than others, with most of the variables being related to the two objectives
mentioned above. These survey questions turned out to be the most valuable to the MDO
because they could be used to help the team analyze multiple research objectives. Cross-
tabulations are run by clicking the ‘Analyze’ tab toward the top of the page, scrolling down and
clicking ‘Descriptive Statistics,’ from there then clicking on the drop down tab ‘Crosstabs.’ Once
both variables have been decided upon, select the first variable and insert it under the ‘columns’
section and insert the second variable under the ‘rows’ section. Click ‘statistics’ and check the
‘Chi-square’ box, then click continue. Click ‘cells’ and check the ‘column’ box under the
percentages section, click continue, then okay.
Research Objective 1
To understand the role in which social media plays in brand development.
Applicable survey questions:
● Please order the following social media sites according to the frequency in which you use
them. (1 being the most frequent and 5 being the least frequent)
● If you saw someone promoting a brand on the following social media sites, how likely or
unlikely are you to investigate the brand further?
● In the last 6 months, how many times have you purchased a product and/or service after
seeing it on one of the following social media sites?
Some beneficial cross-tabulations to run can include:
● “Please order the following social media sites according to the frequency in which you
use them - Facebook” and “In the past 6 months, how many times have you purchased a
product and/or service after seeing it on one of the following social media sites? -
Facebook”
● “Please order the following social media sites according to the frequency in which you
use them - Twitter” and “In the past 6 months, how many times have you purchased a
product and/or service after seeing it on one of the following social media sites? - Twitter”
By running cross-tabulations with the two sets of questions listed above, the results indicate the
association between the consumer’s most frequently visited social media site and the purchases
made directly from those sites. Through relevant survey answers, further investigation in cross-
tabulation will be deeply delved into the research objective. Further cross-tabulations will be run
based on relevant survey answers.
MARK311 Final White Paper Deliverable Neier
BowTie Cause Marketing Research 11 Cho, Garton, Khosa, Milord, Martini
Research Objective 2
To investigate purchasing trends of socially aware consumers.
Applicable survey questions:
● Have you purchased products related to a cause within the last year? (e.g. Livestrong
bracelet, breast cancer awareness t-shirt, GO Green recyclable tote bag)
● Please select the following reasons as to why you have not purchased from a cause.
Select all that apply.
● On a scale from 1-10, please indicate your likeliness to go out of your way to purchase
from a company well-known for its social responsibility. (e.g. Whole Foods, Starbucks,
Chipotle)
● How many cause-related products do you own? (e.g. Livestrong bracelet, breast cancer
awareness t-shirt, GO Green recyclable tote bag)
● Which kind of apparel are you more likely to purchase for a cause? (e.g. Livestrong
bracelet, breast cancer awareness t-shirt, GO Green recyclable tote bag)
● Where are you more likely to purchase the previously mentioned apparel?
● Please rank the following in order of importance when purchasing a product that supports
a cause. 1 being the most important and 4 being the least important. (Drag and Drop)
Some beneficial cross-tabulations to run can include:
● “Have you purchased products related to a cause within the last year - Yes” and “Where
are you more likely to purchase the previously mentioned apparel”
● “Which kind of apparel are you more likely to purchase for a cause?” and “Where are
you more likely to purchase the previously mentioned apparel?”
● “Please rank the following in order of importance when purchasing a product that
supports a cause (how much of the proceeds go to the cause, the type of cause being
supported, the reputation of the company supporting the cause, and influence by friends)”
and “On a scale from 1 to 10, please indicate your likeliness to go out of your way to
purchase from a company well-known for its social responsibility.”
These three sets of questions are examples of the cross-tabulations the research team will run. In
regards to the second bullet point, the findings would indicate whether there is an association
between the type of apparel consumers are more likely to purchase for a cause and where they
are more likely to purchase that apparel. If there is in fact an association between these two
questions, BowTie Cause can use the information to their advantage.
Research Objective 3
To assess the different factors that influence consumer purchases in relation
to philanthropic causes.
Applicable survey questions:
● Have you purchased products related to a cause within the last year?
● Do you go to Philanthropic or fundraising events?
MARK311 Final White Paper Deliverable Neier
BowTie Cause Marketing Research 12 Cho, Garton, Khosa, Milord, Martini
● On a scale of 1-10, please indicate your likeliness to go out of your way to purchase a
product for a cause.
● Please indicate which of the following types of causes are you more likely to purchase
apparel from?
Some beneficial cross-tabulations to run can include:
● “Do you go to Philanthropic/Fundraising events - Yes” and “When you go to
philanthropic events, on average how far do you/are you willing to travel from your home
- 20+ miles?”
● “Please rank the following in order of importance when purchasing a product that
supports a cause (how much of the proceeds go to the cause, the type of cause being
supported, the reputation of the company supporting the cause, and influence by friends)”
and “Please indicate which of the following types of causes you are more likely to
purchase apparel from (health, education, animal rights, environment, etc.)”
If, for the first set of questions, the cross-tabulations resulted in an association between
consumers that attend philanthropic/fundraising events and traveling 20+ miles from home to
attend such events, BowTie Cause would benefit from this knowledge. On the other hand, the
cross-tabulations could also indicate that consumers who do attend such events are only willing
to travel up to 10 miles. Running these tests will either affirm or disprove any assumptions made.
Research Objective 4
Research geographical locations where there is higher demand for cause
related products. Applicable survey questions:
● Please select the following reasons as to why you have not purchased from a cause.
● On a scale from 1 to 10, please indicate your likeliness to go out of your way to purchase
from a company well-known for its social responsibility.
● Do you go to Philanthropic/Fundraising events?
● When you go to philanthropic events, on average how far do you/are you willing to travel
from your home?
Some beneficial cross-tabulations to run can include:
● “Please enter your zip code” and “Have you purchased products related to a cause within
the last year - Yes”
● “Please indicate your zip code” and “Please select the following reasons as to why you
have not purchased from a cause”
Although, in the second set of questions, reasons for not purchasing from a cause does not
directly relate to this objective, it may be beneficial to look into this cross-tabulation anyway.
The results may show an association between certain geographical locations and the reasons why
consumers do not purchase from causes in those areas.
MARK311 Final White Paper Deliverable Neier
BowTie Cause Marketing Research 13 Cho, Garton, Khosa, Milord, Martini
Research Objective 5
To find out the influence celebrity endorsements have on consumer purchase
behavior.
Applicable survey questions:
● To what extent do you agree with the following statements? This video (BowTie Cause at
SuperBowl XLVII) made me motivated... (Options - to purchase a bow tie, to learn more
about BowTie Cause, to become more open to the idea of wearing a bow tie, to want to
purchase directly from BowTie Cause)
● Please rank the following groups of people in terms of who you think is most influential
when endorsing an organization and what they stand for. 1 being the most influential and
6 being the least influential. (Options – Athletes, Business Leaders, Politicians, Actors,
Singers, Reality TV Stars and Hosts)
Some beneficial cross-tabulations to run can include:
● “Please rank the following groups of people in terms of who you think is most influential
when endorsing an organization and what they stand for - Athletes” and “Please watch
this short video. To what extent do you agree with the following statements? This video
made me motivated… - to learn more about BowTie Cause”
● “Please rank the following groups of people in terms of who you think is most influential
when endorsing an organization and what they stand for - Actors” and “Please watch this
short video. To what extent do you agree with the following statements? This video made
me motivated… - to learn more about BowTie Cause.”
Running cross-tabulations between the different answers to both of these questions can be very
insightful. The findings may indicate that participants who chose athletes as their number one
most influential endorsers are more willing to purchase directly from BowTie Cause after
watching the video rather than those participants who chose business leaders as the most
influential.
MARK311 Final White Paper Deliverable Neier
BowTie Cause Marketing Research 14 Cho, Garton, Khosa, Milord, Martini
Conclusion
Research Objective 1
To understand the role in which social media plays in brand development.
Frequencies:
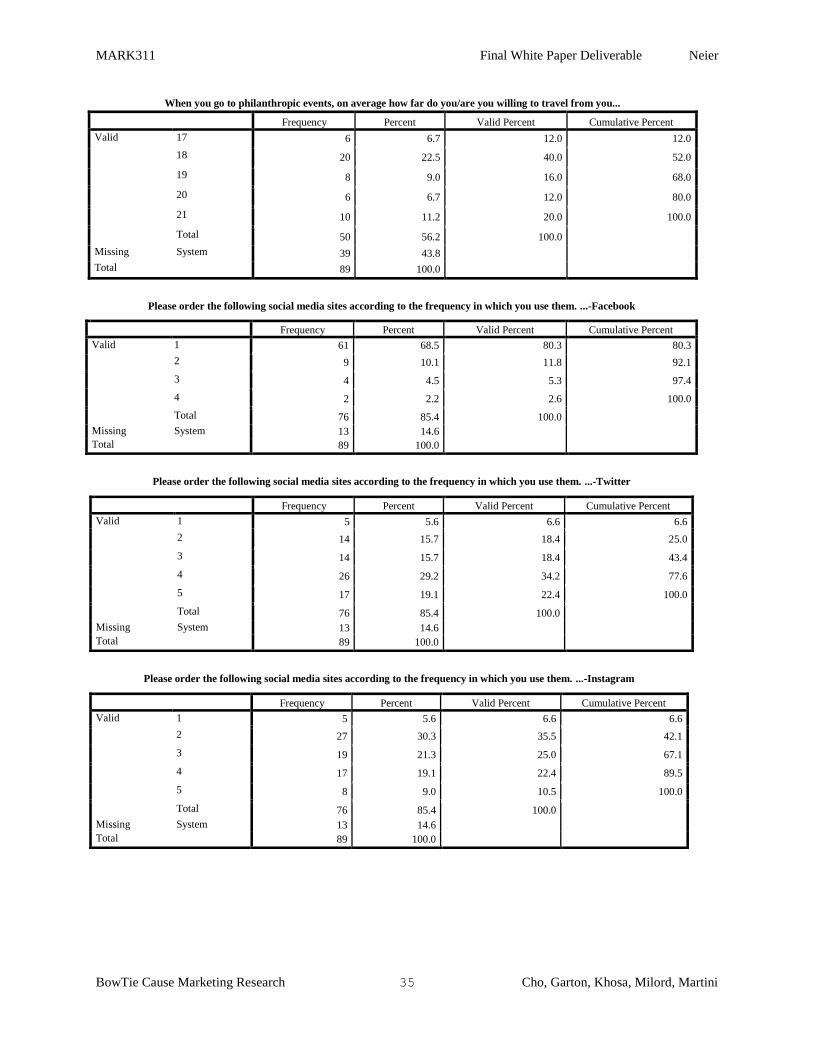
● 80% of participants use Facebook the most frequently.
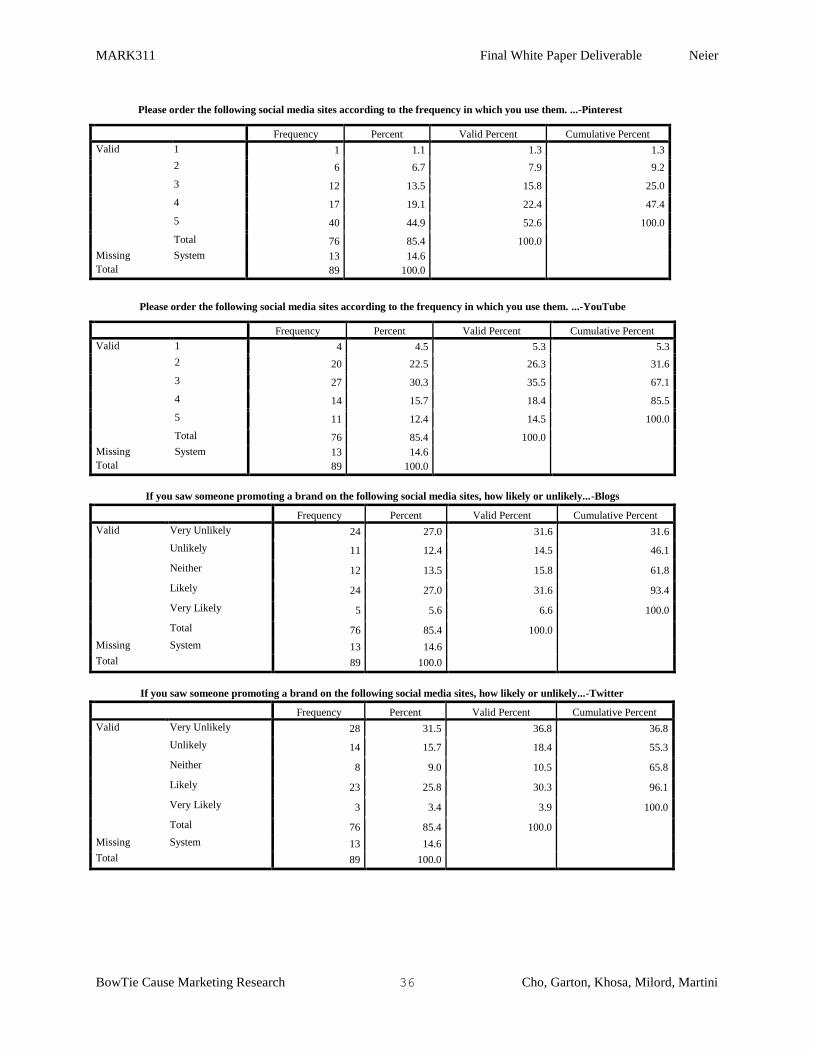
● 34% of participants that see the promotion of a brand on Twitter are likely/very likely to
investigate further while 55% of participants are unlikely/very unlikely to investigate
further.
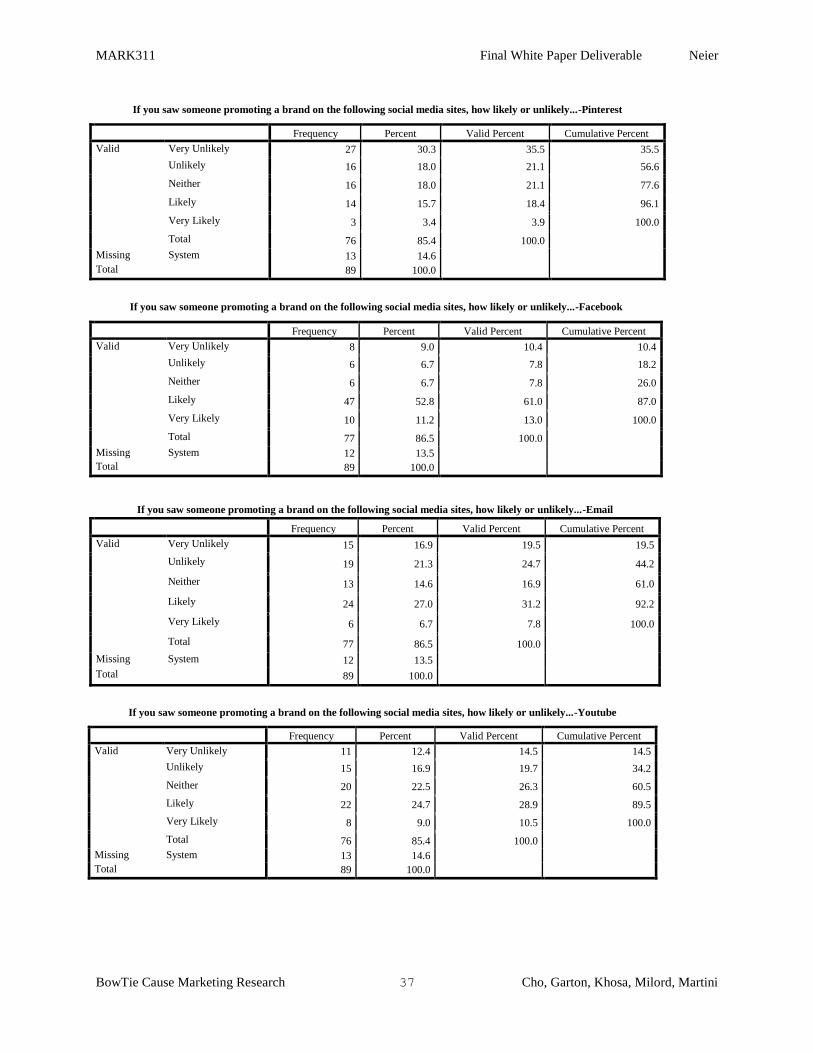
● 39% of participants that see the promotion of a brand through Email are likely/very likely
to investigate further while 44% of participants are unlikely/very unlikely to investigate
further.
Associated cross-tabulations:
● “Please order the following social media sites according to the frequency in which you
use them. - Twitter” and “In the last 6 months, how many times have you purchased a
product and/or service after seeing it on one of the following social media sites? - Twitter”
○ The results of this cross-tabulation indicate that there is an association between
these two variables, with a Chi-Square value of .000. Of the participants that
ranked Twitter as their most frequented site, 60% have made multiple purchases
after seeing the products on Twitter.
● “Please order the following social media sites according to the frequency in which you
use them. - Facebook” and “If you saw someone promoting a brand on the following
social media sites, how likely or unlikely are you to investigate the brand further? -
Facebook”
○ Although the results of this cross-tabulation has a Chi-Square value of .006,
which indicates that it is in fact associated, the research team was surprised with
the results. Supporting the predictions, 75% of the participants that frequent
Facebook the most are likely/very likely to investigate the brand further when
seeing it promoted through Facebook. As well as that, 74.6% of the participants
that frequent Facebook the least are also likely/very likely to investigate the brand
further when seeing it promoted through Facebook.
○ Based on these surprising findings, it seems that the frequency in which Facebook
is used is irrelevant to the likeliness of participants investigating a promotion
further when seen on Facebook. (Facebook seems to be a good social media site
for promoting a brand, but does not necessarily lead to purchases)
Un-Associated cross-tabulations:
● “Please order the following social media sites according to the frequency in which you
use them. - Facebook” and “In the last 6 months, how many times have you purchased a
MARK311 Final White Paper Deliverable Neier
BowTie Cause Marketing Research 15 Cho, Garton, Khosa, Milord, Martini
product and/or service after seeing it on one of the following social media sites? -
Facebook”
○ Based on the results, there is no associated between the frequency in which
Facebook is used and purchases from Facebook. The Chi-Square value for this
cross-tabulation is .962.
Additional relevant results:
● Qualitative data was received from the in-depth interviews. According to one respondent,
Twitter is an unreliable social media site in regards to believing or trusting any
promotional advertisements seen on the website.
Research Objective 2
To investigate purchasing trends of socially aware consumers.
Frequencies:
● 49% of participants are more willing to purchase from a socially-aware company
● 41.6% of participants feel that the type of cause being supported is the most important
factor when deciding to purchase.
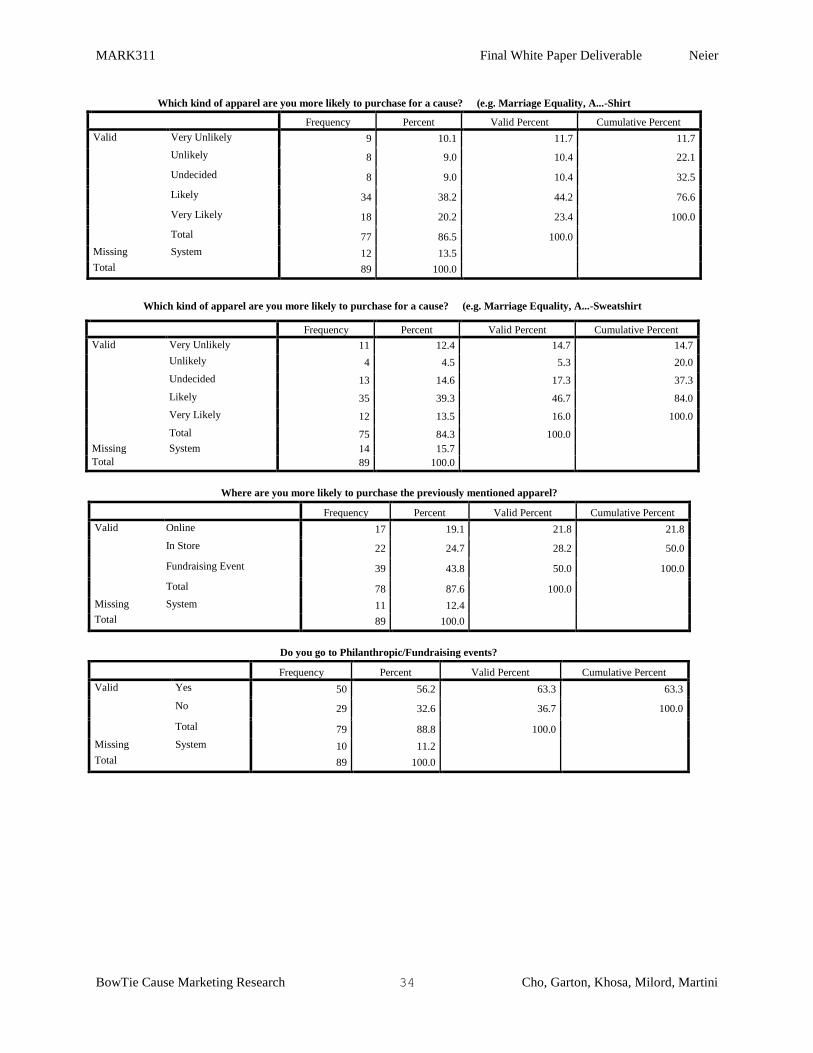
● The top three items participants are more like to purchase for a cause include sweatshirts
(39.3%), t-shirts (38.2%), and necklaces (24.7%).
Associated cross-tabulations:
● “Please indicate which of the following types of causes you are more likely to purchase
apparel from – animal rights” and “Please indicate your gender.”
o The two are associate with a chi square of 0.001. This indicates that they are very
closely associated. According to the results found, females are more like to support
animal rights compared to men. 37.9% of female participants ranked animal rights as
their top philanthropic choice while only 4.2% of male participants ranked it as their top
choice.
Un-Associated cross-tabulations:
● “Where are you more likely to purchase the previously mentioned apparel? and “Which
kind of apparel are you more likely to purchase for a cause - bow ties.”
○ The two cross-tabulations listed were unassociated as the Chi-Square value
was .06. While they are not directly associated, it was found that of those
participants that are likely to purchase a bow tie for a cause, they prefer to buy
them online compared to a retail store or fundraising event. 18.8% of participants
would rather purchase a bow tie online.
● “Do you go to Philanthropic/Fundraising events?” and “On a scale from 1 to 10, please
indicate your likeliness to go out of your way to purchase from a company well-known
for its social responsibility.”
○ The two cross-tabulations listed were unassociated as the Chi-Square value came
out to .627. This was surprising because one would think that an individual who
MARK311 Final White Paper Deliverable Neier
BowTie Cause Marketing Research 16 Cho, Garton, Khosa, Milord, Martini
goes to philanthropic events would be more likely to purchase from socially-
responsible companies. However, according to the results this is not the case.
Additional relevant results:
● Qualitative data was received from the in-depth interviews. According to one respondent,
who care health and environment for his first cause, he would like to buy if those kinds of
causes are behind the products. However, he pointed out how much money and how the
process go in that socially-aware company in terms of transparency.
● The participant acknowledges that cause-marketing does work and that if companies
were to market the products more and explain the cause he/she would be more inclined to
purchase.
● The participant is more inclined to purchase products advertised on twitter rather than
Facebook. Twitter has more credibility.
Research Objective 3
To assess the different factors that influence consumer purchases in relation
to philanthropic causes.
Frequencies:
● The results show that, of the people asked “Do you go to philanthropic events?” 66.6%
answered ‘yes’ whereas 33.3% answered ‘no’.
● 28% of those asked “Which type of cause are you most likely to purchase apparel from”
listed Health-related causes as their #1 choice, 22.6% listed animals rights, and 16.4%
listed the environment.
Associated cross-tabulations:
● “Have you purchased products related to a cause within the last year? - Yes” and “Do you
go to Philanthropic or Fundraising events? - Yes”
○ These variables were shown to be statistically associated with a Chi-Square value
of .015. 42% of respondents claimed that they both regularly go to philanthropic
events and that they have purchased products related to a cause within the last
year. The results of the survey imply that the majority of the population (as
reflected by the sample) goes to philanthropic events. The study indicates that
going to philanthropic events is associated with purchasing cause-related items.
This means that BowTie Cause can possibly grow its customer base by becoming
more visible in philanthropic/fundraising events. If they do so, it is likely that they
may be able to attract additional customers who purchase products related to
causes.
Un-Associated cross-tabulations:
● “Have you purchased a product related to a cause within the last year?” and “On a scale
of 1-10, please indicate your likeliness to go out of your way to purchase from a cause”
○ With a Chi-Square value of 11.07, these two variables are not associated.
MARK311 Final White Paper Deliverable Neier
BowTie Cause Marketing Research 17 Cho, Garton, Khosa, Milord, Martini
● “Do you go to philanthropic/Fundraising events?” and “Please indicate which of the
following types of causes you’re most likely to purchase apparel from?”
○ This cross-tabulation yielded no association on all kinds of cause apparel. All
Chi-Square values were well above .05, however it’s worth noting that the
‘Educational’ apparel Chi-Square had the least value, indicating that it may be
more associated than others.
Additional relevant results:
● The In-Depth Interview revealed a lot about how philanthropic causes influence
consumer purchasing behavior. One respondent indicated that the product itself was the
most important aspect of his decision of whether or not to purchase a product. The cause
was a ‘secondary’ factor that was less important. Additionally, the respondent indicated
that the trustworthiness and transparency of the cause that is being marketed is something
really important to him. If a company is very transparent with how much of the proceeds
go towards a cause, and if the cause is a transparent one, then to him, this is trustworthy.
● He also mentioned that, if a cause means a lot to him, then he would buy a product for the
sole purpose of supporting that cause. But this is only true in cases where he feels
strongly about the cause he is supporting. Otherwise, the cause is simply a secondary
aspect that he doesn’t factor in too much during purchasing decisions.
● The relative frequencies of the types of causes people are most likely to purchase apparel
from are interesting. The most popular type of cause for apparel is health. A close second
is Animals rights, and Environment is third. BowTie Cause can benefit from this insight
by focusing on the causes that people are most likely to purchase from, such as health and
education.
● A more nuanced view of the aforementioned frequencies are the rankings of the causes in
relation to one another. For example, health related causes are ranked first 28.8% of the
time, ranked second 14% of the time, and ranked third 19% of the time. It can be
concluded that health related causes are most frequently either first priority or third
priority. Similarly, Education was only listed as the top cause for cause related purchases
only 7% of the time. It was ranked number two, however, 37% of the time. This means
that although education is not a top priority for most respondents, it is a close second for
many. If BowTie Cause was to focus on only two causes for cause-related products, this
study would suggest that they should choose two: Health-related causes and Education-
related causes.
● Qualitative data was received from the in-depth interviews. According to one respondent,
“I think people are a lot more savvy now about where they’re putting their money and
companies that are not-for-profit and bigger companies know that so they have to make it
very appealing and market it in a way that really spells things out for the consumer so
that they don’t feel that they’re being ripped off.” This response shows how important it
is to establish credibility as a philanthropic cause. Otherwise, people may be reluctant to
donate to the cause.
Research Objective 4
Research geographical locations where there is higher demand for cause
MARK311 Final White Paper Deliverable Neier
BowTie Cause Marketing Research 18 Cho, Garton, Khosa, Milord, Martini
related products. Frequencies:
22.2% of respondents rated their likeliness to ‘go out of their way’ to purchase a cause
related product as an 8 on a 10 point scale. 17.5% rated 7. Overall, a total of 49.3% of
respondents rated their willingness to go out of their way to purchase a cause related
product a 7/10 and above.
o This means that most people are willing to take extra steps in order to purchase a
product for a worthy cause that they believe in. The cause in itself makes products
more attractive to consumers, and so they are willing to inconvenience themselves
to get it.
Associated cross-tabulations:
● There were no associated cross-tabulations that produced a Chi-Square value of .05 and
under.
Un-Associated cross-tabulations:
● “On a scale from 1 to 10, please indicate your likeliness to go out of your way to
purchase from a company well-known for its social responsibility.” and “When you go to
philanthropic events, on average how far do you/are you willing to travel from your
home?”
○ The data was deemed significant through running the crosstabs on SPSS. The
initial assumption was that there might be a significantly high association between
consumers purchasing preference and their willingness to go to philanthropic
events. It was because people, who are likely to purchase cause-related products
rather than non-cause-related products, would be more interested in the
philanthropic events. However, the data showed that the association between
consumers purchasing decisions and their geographical location was quite low.
Even if people are willing to purchase philanthropic products, they are less likely
to travel to go to philanthropic events.
Additional relevant results:
● Qualitative data was received from the in-depth interviews. According to one respondent,
he would be willing to travel 10-15 minutes out of his way in order to purchase a product
that supports a cause that he likes.
Research Objective 5
To find out the influence celebrity endorsements have on consumer purchase
behavior.
Frequencies:
● 38.2% of the respondents said that watching the BowTie Cause Video made them want to
learn more about BowTie Cause.
● 27.6% of respondents ranked athletes as either the first or second most influential type of
organizational celebrity endorser.
MARK311 Final White Paper Deliverable Neier
BowTie Cause Marketing Research 19 Cho, Garton, Khosa, Milord, Martini
Associated cross-tabulations:
● “To what extent do you agree with the following statements? This video (BowTie Cause
at SuperBowl XLVII) made me motivated… - to learn more about BowTie Cause” and
“Please rank the following groups of people in terms of who you think is most influential
when endorsing an organization and what they stand for. - Reality TV Stars and Hosts”
○ This cross-tabulation was deemed significant because it had a Chi-Square
association of .010. This data will provide useful insights into who BowTie Cause
should use to endorse their products to get viewers to want to learn more about
the organization. Of the people that ranked Reality TV Stars and Hosts as the
most influential, 34.1% of them either agreed or strongly agreed that that video
made them want to learn more about BowTie Cause.
Un-Associated cross-tabulations:
● “To what extent do you agree with the following statements? This video (BowTie Cause
at SuperBowl XLVII) made me motivated… - to become more open to the idea of
wearing a bow tie” and “Please rank the following groups of people in terms of who you
think is most influential when endorsing an organization and what they stand for. -
Athletes”
○ This cross-tabulation resulted in a Chi-Square value of .138. Although this is
above .05, it can still provide useful insights for the client. BowTie Cause used a
combination of athletes and reality TV stars and hosts for their video, with an
emphasis on athletes. It seems that their video motivates the viewer to be more
open to the idea of wearing a bow tie. But, according to the cross-tabulation
results, it may be beneficial to put more focus on using endorsements from
Reality TV Stars and Hosts like the ones in the video: Adam Richman, Andrew
Zimmern, Guy Fieri, etc. Celebrity endorsements such as these seem to have
impacted the viewer far more than that of professional athletes.
Additional relevant results:
● Qualitative data was received from the in-depth interviews. According to one respondent,
the specific celebrity or type of celebrity endorsing a product related to a cause does not
make a difference, but he has “to believe in them as a person and know that they are
genuine” in order to be influenced by their endorsement.7
7 See Appendix page 111
MARK311 Final White Paper Deliverable Neier
BowTie Cause Marketing Research 20 Cho, Garton, Khosa, Milord, Martini
Works Cited
Bonetto, Lauren. Executive Summary. Rep. N.p.: Mintel Group, 2014. Print.
Bonetto, Lauren. Infographic Overview. Rep. N.p.: Mintel Group, 2014. Print.
Churchill, Gilbert A., Jr., and Tom J. Brown. Basic Marketing Research. 6th ed. Ohio: Thomson
South-Western, 2007. Print.
O'Donnell, Fiona. Cause Marketing. Rep. N.p.: Mintel Group, 2011. Print.
Social Media and Retailing. Rep. no. ML00017-019. London: MarketLine, 2014. Print.
MARK311 Final White Paper Deliverable Neier
BowTie Cause Marketing Research 21 Cho, Garton, Khosa, Milord, Martini
Appendix
Survey
The primary goal of this survey is to better understand the underlying reasons that influence
consumers to purchase products related to a cause. The data collected will be used solely for
research purposes and will be kept private.
Please answer as truthfully as possible. We appreciate your participation. As a thank you for
your time we are offering a 10% off coupon code for BowTieCause.com at the end of our
survey.
Thank you!
1.) Have you purchased products related to a cause within the last year? (e.g. Livestrong bracelet,
breast cancer awareness t-shirt, GO Green recyclable tote bag)
Yes (1)
No (2)
If Yes Is Selected, Then Skip To On a scale from 1 to 10, please indic...
2.) Please select the following reasons as to why you have not purchased from a cause. Select all
that apply:
Unaffordable (1)
Inconvenient (2)
Uninterested (3)
Other (4) ____________________
MARK311 Final White Paper Deliverable Neier
BowTie Cause Marketing Research 22 Cho, Garton, Khosa, Milord, Martini
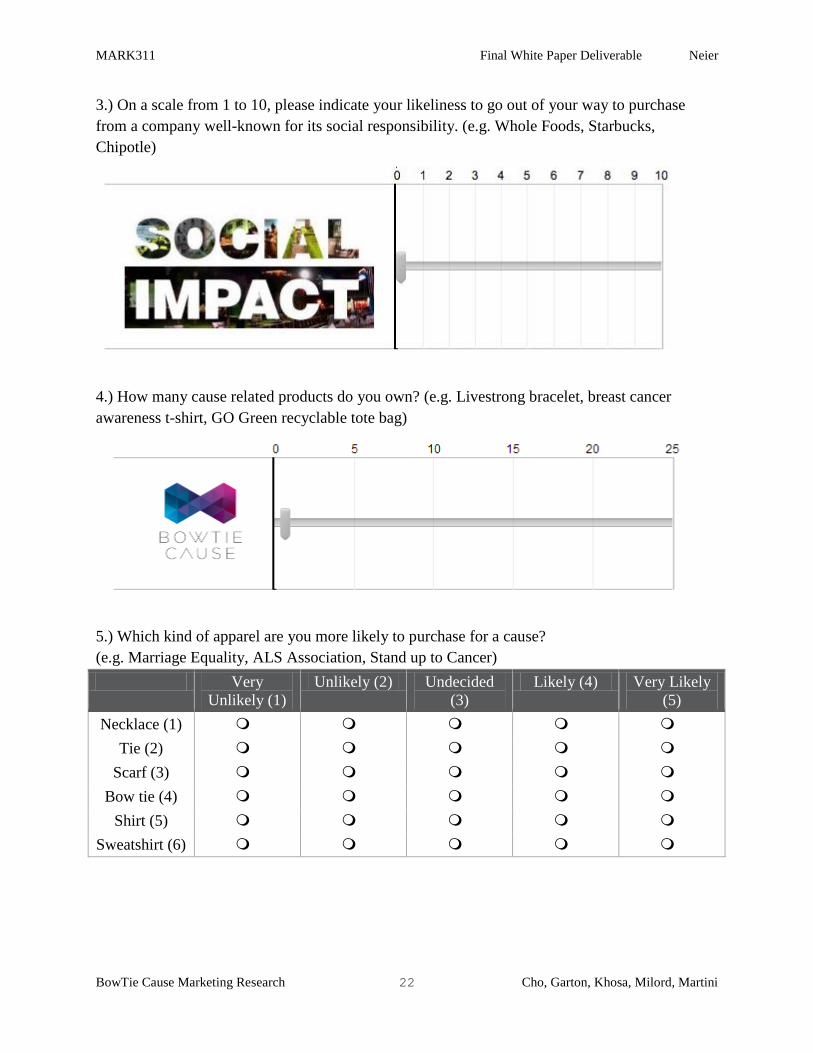
3.) On a scale from 1 to 10, please indicate your likeliness to go out of your way to purchase
from a company well-known for its social responsibility. (e.g. Whole Foods, Starbucks,
Chipotle)
4.) How many cause related products do you own? (e.g. Livestrong bracelet, breast cancer
awareness t-shirt, GO Green recyclable tote bag)
5.) Which kind of apparel are you more likely to purchase for a cause?
(e.g. Marriage Equality, ALS Association, Stand up to Cancer)
Very
Unlikely (1)
Unlikely (2) Undecided
(3)
Likely (4) Very Likely
(5)
Necklace (1)
Tie (2)
Scarf (3)
Bow tie (4)
Shirt (5)
Sweatshirt (6)
MARK311 Final White Paper Deliverable Neier
BowTie Cause Marketing Research 23 Cho, Garton, Khosa, Milord, Martini
6.) Where are you more likely to purchase the previously mentioned apparel?
Online (1)
In Store (2)
Fundraising Event (3)
7.) Do you go to Philanthropic/Fundraising events?
Yes (1)
No (2)
If No Is Selected, Then Skip To End of Block
8.) When you go to philanthropic events, on average how far do you/are you willing to travel
from your home?
0-5 miles (17)
6-10 miles (18)
11-15 miles (19)
16-20 miles (20)
20+ miles (21)
MARK311 Final White Paper Deliverable Neier
BowTie Cause Marketing Research 24 Cho, Garton, Khosa, Milord, Martini
9.) Please order the following social media sites according to the frequency in which you use
them.
1 being the most frequent and 5 being the least frequent. (Drag and drop)
______ Facebook (1)
______ Twitter (2)
______ Instagram (3)
______ Pinterest (5)
______ YouTube (6)
10.) If you saw someone promoting a brand on the following social media sites, how likely or
unlikely are you to investigate the brand further?
Very
Unlikely (1)
Unlikely (2) Neither (3) Likely (7) Very Likely
(4)
Blogs (1)
Twitter (2)
Facebook (4)
Email (5)
Youtube (6)
Pinterest (3)
Instagram (7)
Google + (8)
11.) In the last 6 months, how many times have you purchased a product and/or service after
seeing it on one of the following social media sites?
______ Facebook (1)
______ Twitter (2)
______ Blogs (3)
______ Pinterest (4)
______ Other (5)
12.) Please rank the following in order of importance when purchasing a product that supports a
cause.
1 being the most important and 4 being the least important. (Drag and Drop)
______ How much of the proceeds go to the cause (1)
______ The type of cause being supported (2)
______ Reputation of the company supporting the cause (3)
______ Influence by friends (6)
13.) Please watch this short video.
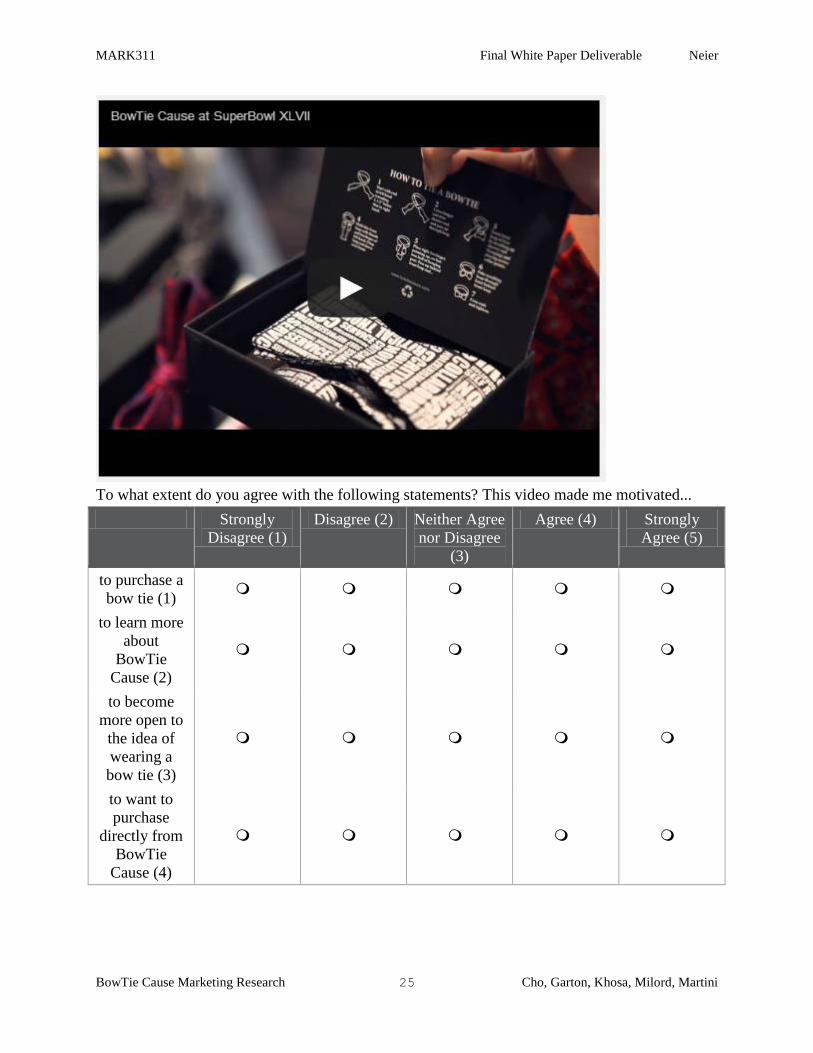
MARK311 Final White Paper Deliverable Neier
BowTie Cause Marketing Research 25 Cho, Garton, Khosa, Milord, Martini
To what extent do you agree with the following statements? This video made me motivated...
Strongly
Disagree (1)
Disagree (2) Neither Agree
nor Disagree
(3)
Agree (4) Strongly
Agree (5)
to purchase a
bow tie (1)
to learn more
about
BowTie
Cause (2)
to become
more open to
the idea of
wearing a
bow tie (3)
to want to
purchase
directly from
BowTie
Cause (4)
MARK311 Final White Paper Deliverable Neier
BowTie Cause Marketing Research 26 Cho, Garton, Khosa, Milord, Martini
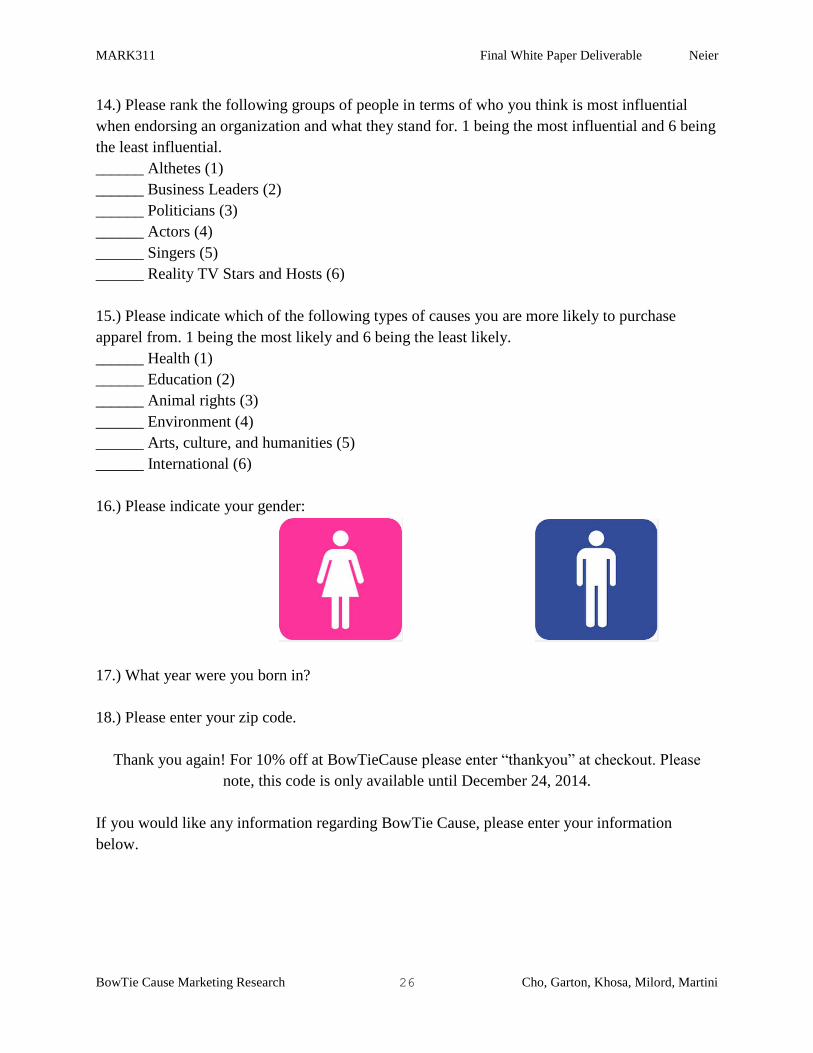
14.) Please rank the following groups of people in terms of who you think is most influential
when endorsing an organization and what they stand for. 1 being the most influential and 6 being
the least influential.
______ Althetes (1)
______ Business Leaders (2)
______ Politicians (3)
______ Actors (4)
______ Singers (5)
______ Reality TV Stars and Hosts (6)
15.) Please indicate which of the following types of causes you are more likely to purchase
apparel from. 1 being the most likely and 6 being the least likely.
______ Health (1)
______ Education (2)
______ Animal rights (3)
______ Environment (4)
______ Arts, culture, and humanities (5)
______ International (6)
16.) Please indicate your gender:
17.) What year were you born in?
18.) Please enter your zip code.
Thank you again! For 10% off at BowTieCause please enter “thankyou” at checkout. Please
note, this code is only available until December 24, 2014.
If you would like any information regarding BowTie Cause, please enter your information
below.
MARK311 Final White Paper Deliverable Neier
BowTie Cause Marketing Research 27 Cho, Garton, Khosa, Milord, Martini
First Name (4)
Last Name (5)
Email (6)
MARK311 Final White Paper Deliverable Neier
BowTie Cause Marketing Research 28 Cho, Garton, Khosa, Milord, Martini
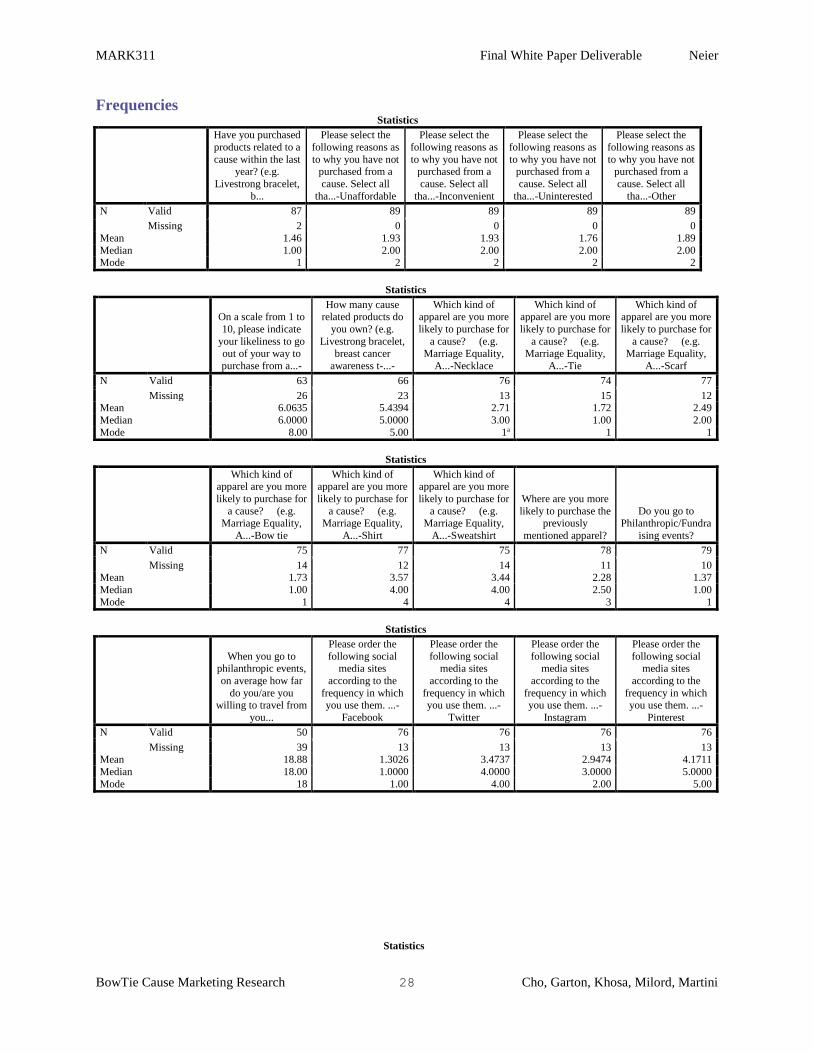
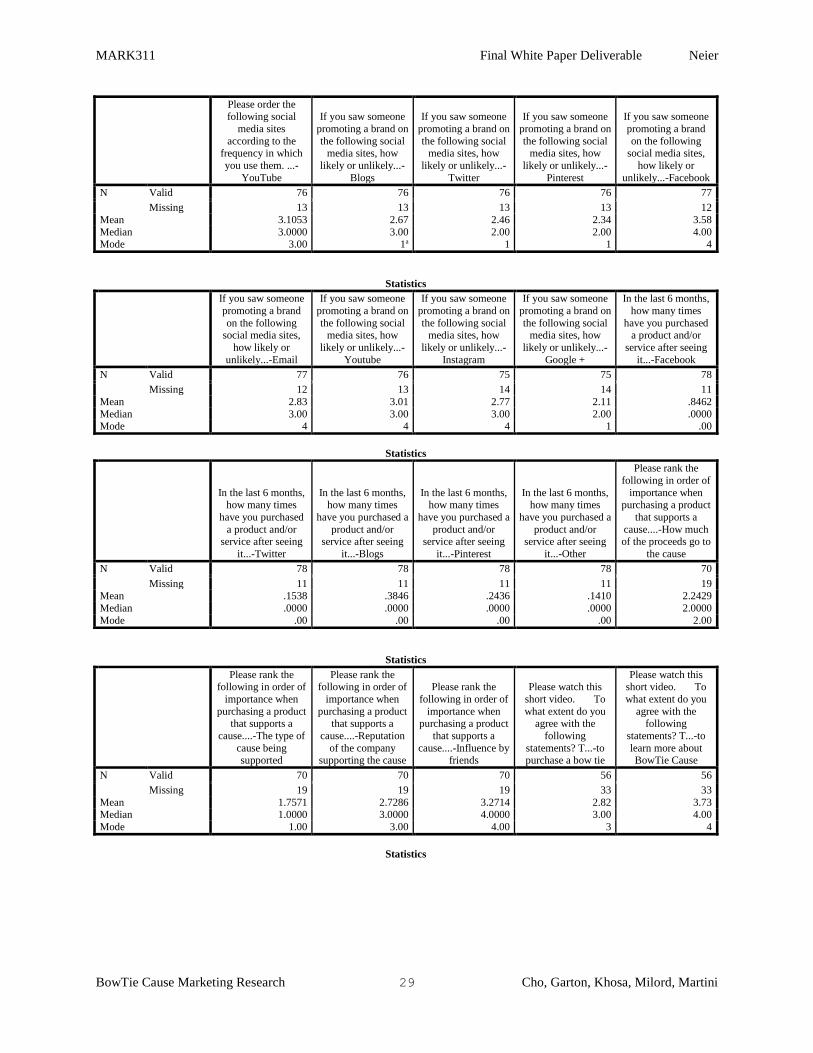
Frequencies Statistics
Have you purchased
products related to a
cause within the last year? (e.g.
Livestrong bracelet,
b...
Please select the
following reasons as
to why you have not purchased from a
cause. Select all
tha...-Unaffordable
Please select the
following reasons as
to why you have not purchased from a
cause. Select all
tha...-Inconvenient
Please select the
following reasons as
to why you have not purchased from a
cause. Select all
tha...-Uninterested
Please select the
following reasons as
to why you have not purchased from a
cause. Select all
tha...-Other
N Valid 87 89 89 89 89
Missing 2 0 0 0 0
Mean 1.46 1.93 1.93 1.76 1.89
Median 1.00 2.00 2.00 2.00 2.00 Mode 1 2 2 2 2
Statistics
On a scale from 1 to
10, please indicate
your likeliness to go
out of your way to
purchase from a...-
How many cause related products do
you own? (e.g.
Livestrong bracelet,
breast cancer
awareness t-...-
Which kind of apparel are you more
likely to purchase for
a cause? (e.g.
Marriage Equality,
A...-Necklace
Which kind of apparel are you more
likely to purchase for
a cause? (e.g.
Marriage Equality,
A...-Tie
Which kind of apparel are you more
likely to purchase for
a cause? (e.g.
Marriage Equality,
A...-Scarf
N Valid 63 66 76 74 77
Missing 26 23 13 15 12 Mean 6.0635 5.4394 2.71 1.72 2.49
Median 6.0000 5.0000 3.00 1.00 2.00
Mode 8.00 5.00 1a 1 1
Statistics
Which kind of apparel are you more
likely to purchase for
a cause? (e.g. Marriage Equality,
A...-Bow tie
Which kind of apparel are you more
likely to purchase for
a cause? (e.g. Marriage Equality,
A...-Shirt
Which kind of apparel are you more
likely to purchase for
a cause? (e.g. Marriage Equality,
A...-Sweatshirt
Where are you more
likely to purchase the previously
mentioned apparel?
Do you go to Philanthropic/Fundra
ising events?
N Valid 75 77 75 78 79
Missing 14 12 14 11 10
Mean 1.73 3.57 3.44 2.28 1.37
Median 1.00 4.00 4.00 2.50 1.00
Mode 1 4 4 3 1
Statistics
When you go to philanthropic events,
on average how far
do you/are you willing to travel from
you...
Please order the
following social media sites
according to the
frequency in which you use them. ...-
Please order the
following social media sites
according to the
frequency in which you use them. ...-
Please order the
following social media sites
according to the
frequency in which you use them. ...-
Please order the
following social media sites
according to the
frequency in which you use them. ...-
N Valid 50 76 76 76 76
Missing 39 13 13 13 13 Mean 18.88 1.3026 3.4737 2.9474 4.1711
Median 18.00 1.0000 4.0000 3.0000 5.0000
Mode 18 1.00 4.00 2.00 5.00
Statistics
MARK311 Final White Paper Deliverable Neier
BowTie Cause Marketing Research 29 Cho, Garton, Khosa, Milord, Martini
Please order the
following social
media sites
according to the frequency in which
you use them. ...-
YouTube
If you saw someone
promoting a brand on
the following social media sites, how
likely or unlikely...-
Blogs
If you saw someone
promoting a brand on
the following social media sites, how
likely or unlikely...-
If you saw someone
promoting a brand on
the following social media sites, how
likely or unlikely...-
If you saw someone
promoting a brand
on the following social media sites,
how likely or
unlikely...-Facebook
N Valid 76 76 76 76 77
Missing 13 13 13 13 12
Mean 3.1053 2.67 2.46 2.34 3.58
Median 3.0000 3.00 2.00 2.00 4.00 Mode 3.00 1a 1 1 4
Statistics
If you saw someone
promoting a brand
on the following social media sites,
how likely or
unlikely...-Email
If you saw someone
promoting a brand on
the following social media sites, how
likely or unlikely...-
Youtube
If you saw someone
promoting a brand on
the following social media sites, how
likely or unlikely...-
If you saw someone
promoting a brand on
the following social media sites, how
likely or unlikely...-
Google +
In the last 6 months,
how many times
have you purchased a product and/or
service after seeing
it...-Facebook
N Valid 77 76 75 75 78
Missing 12 13 14 14 11
Mean 2.83 3.01 2.77 2.11 .8462
Median 3.00 3.00 3.00 2.00 .0000 Mode 4 4 4 1 .00
Statistics
In the last 6 months, how many times
have you purchased
a product and/or service after seeing
it...-Twitter
In the last 6 months, how many times
have you purchased a
product and/or service after seeing
it...-Blogs
In the last 6 months, how many times
have you purchased a
product and/or service after seeing
it...-Pinterest
In the last 6 months, how many times
have you purchased a
product and/or service after seeing
it...-Other
Please rank the
following in order of
importance when purchasing a product
that supports a
cause....-How much of the proceeds go to
the cause
N Valid 78 78 78 78 70
Missing 11 11 11 11 19 Mean .1538 .3846 .2436 .1410 2.2429
Median .0000 .0000 .0000 .0000 2.0000
Mode .00 .00 .00 .00 2.00
Statistics
Please rank the following in order of
importance when
purchasing a product that supports a
cause....-The type of
cause being supported
Please rank the following in order of
importance when
purchasing a product that supports a
cause....-Reputation
of the company supporting the cause
Please rank the
following in order of
importance when purchasing a product
that supports a
cause....-Influence by friends
Please watch this
short video. To
what extent do you agree with the
following
statements? T...-to purchase a bow tie
Please watch this short video. To
what extent do you
agree with the following
statements? T...-to
learn more about BowTie Cause
N Valid 70 70 70 56 56
Missing 19 19 19 33 33
Mean 1.7571 2.7286 3.2714 2.82 3.73 Median 1.0000 3.0000 4.0000 3.00 4.00
Mode 1.00 3.00 4.00 3 4
Statistics
MARK311 Final White Paper Deliverable Neier
BowTie Cause Marketing Research 30 Cho, Garton, Khosa, Milord, Martini
Please watch this
short video. To
what extent do you
agree with the following
statements? T...-to
become more open to the idea of
wearing a bow tie
Please watch this
short video. To
what extent do you
agree with the following
statements? T...-to
want to purchase directly from
BowTie Cause
Please rank the following groups of
people in terms of
who you think is most influential
when en...-Althetes
Please rank the
following groups of people in terms of
who you think is
most influential when en...-Business
Leaders
Please rank the
following groups of people in terms of
who you think is
most influential when en...-
Politicians
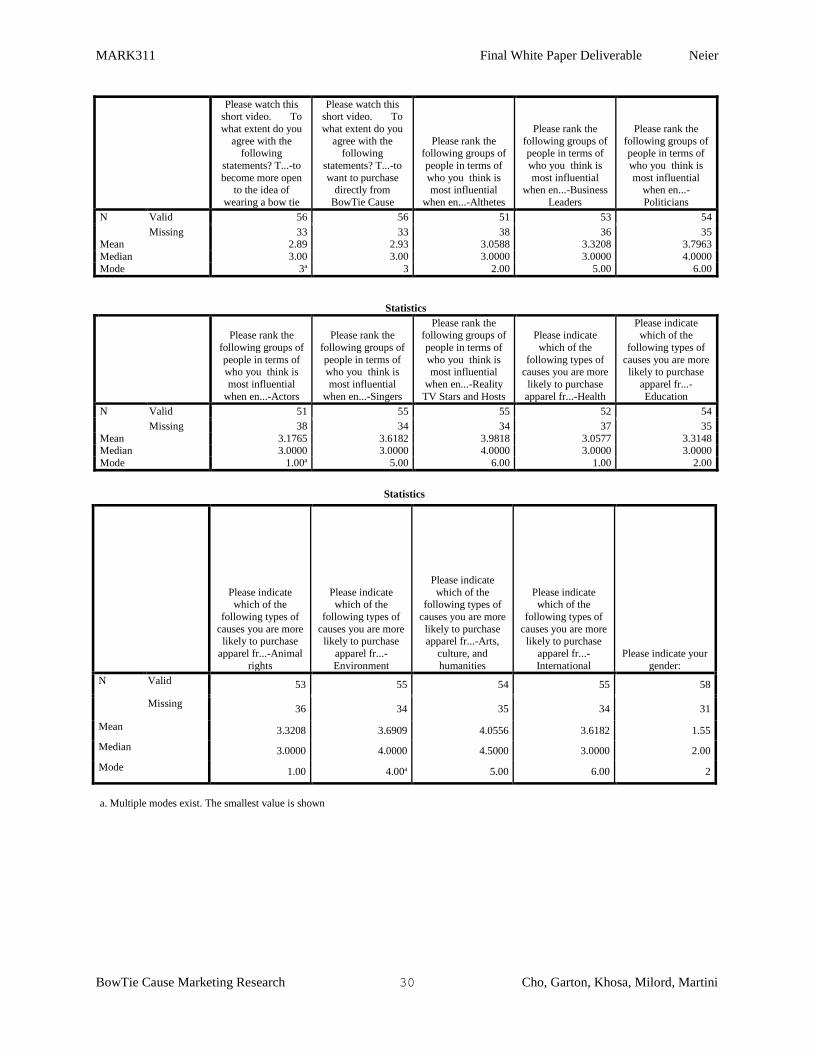
N Valid 56 56 51 53 54
Missing 33 33 38 36 35 Mean 2.89 2.93 3.0588 3.3208 3.7963
Median 3.00 3.00 3.0000 3.0000 4.0000
Mode 3a 3 2.00 5.00 6.00
Statistics
Please rank the
following groups of
people in terms of who you think is
most influential
when en...-Actors
Please rank the
following groups of
people in terms of who you think is
most influential
when en...-Singers
Please rank the following groups of
people in terms of
who you think is most influential
when en...-Reality
TV Stars and Hosts
Please indicate
which of the
following types of causes you are more
likely to purchase
apparel fr...-Health
Please indicate which of the
following types of
causes you are more likely to purchase
apparel fr...-
Education
N Valid 51 55 55 52 54
Missing 38 34 34 37 35
Mean 3.1765 3.6182 3.9818 3.0577 3.3148 Median 3.0000 3.0000 4.0000 3.0000 3.0000
Mode 1.00a 5.00 6.00 1.00 2.00
Statistics
Please indicate which of the
following types of
causes you are more likely to purchase
apparel fr...-Animal
rights
Please indicate which of the
following types of
causes you are more likely to purchase
apparel fr...-
Environment
Please indicate
which of the following types of
causes you are more
likely to purchase apparel fr...-Arts,
culture, and
humanities
Please indicate which of the
following types of
causes you are more likely to purchase
apparel fr...-
International
Please indicate your
gender:
N Valid 53 55 54 55 58
Missing 36 34 35 34 31
Mean 3.3208 3.6909 4.0556 3.6182 1.55
Median 3.0000 4.0000 4.5000 3.0000 2.00
Mode 1.00 4.00a 5.00 6.00 2
a. Multiple modes exist. The smallest value is shown
MARK311 Final White Paper Deliverable Neier
BowTie Cause Marketing Research 31 Cho, Garton, Khosa, Milord, Martini
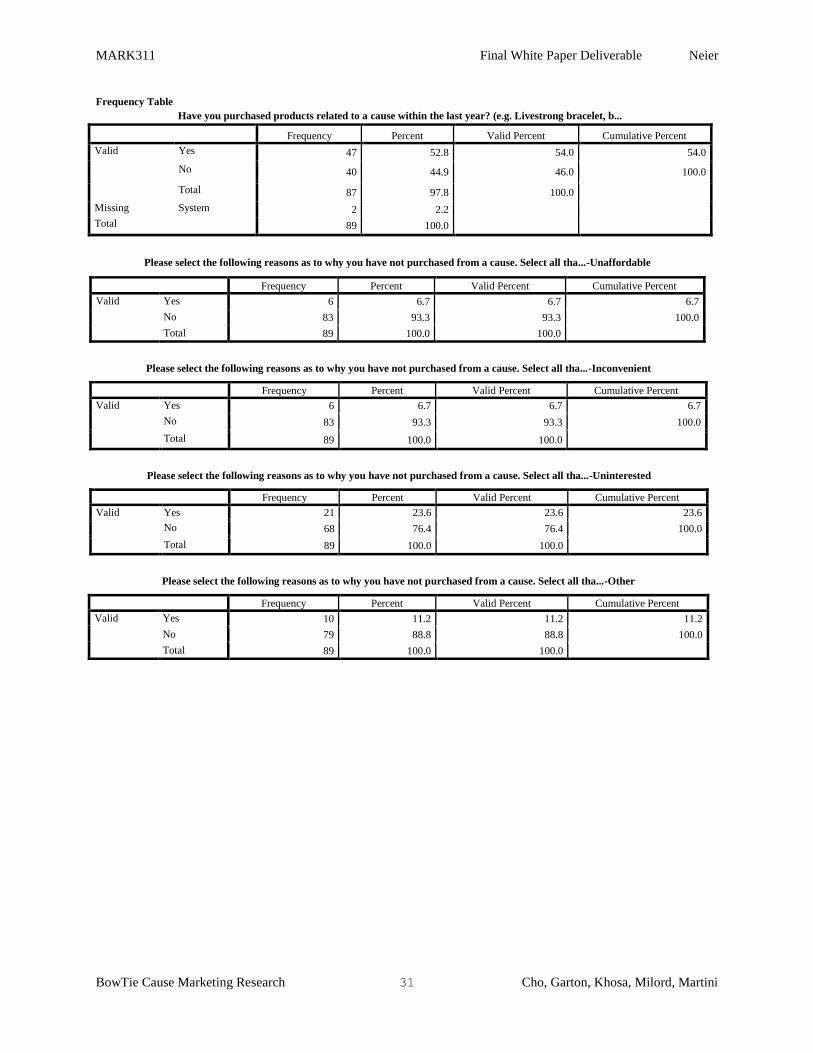
Frequency Table
Have you purchased products related to a cause within the last year? (e.g. Livestrong bracelet, b...
Frequency Percent Valid Percent Cumulative Percent
Valid Yes 47 52.8 54.0 54.0
No 40 44.9 46.0 100.0
Total 87 97.8 100.0
Missing System 2 2.2
Total 89 100.0
Please select the following reasons as to why you have not purchased from a cause. Select all tha...-Unaffordable
Frequency Percent Valid Percent Cumulative Percent
Valid Yes 6 6.7 6.7 6.7
No 83 93.3 93.3 100.0
Total 89 100.0 100.0
Please select the following reasons as to why you have not purchased from a cause. Select all tha...-Inconvenient
Frequency Percent Valid Percent Cumulative Percent
Valid Yes 6 6.7 6.7 6.7
No 83 93.3 93.3 100.0
Total 89 100.0 100.0
Please select the following reasons as to why you have not purchased from a cause. Select all tha...-Uninterested
Frequency Percent Valid Percent Cumulative Percent
Valid Yes 21 23.6 23.6 23.6
No 68 76.4 76.4 100.0
Total 89 100.0 100.0
Please select the following reasons as to why you have not purchased from a cause. Select all tha...-Other
Frequency Percent Valid Percent Cumulative Percent
Valid Yes 10 11.2 11.2 11.2
No 79 88.8 88.8 100.0
Total 89 100.0 100.0
MARK311 Final White Paper Deliverable Neier
BowTie Cause Marketing Research 32 Cho, Garton, Khosa, Milord, Martini
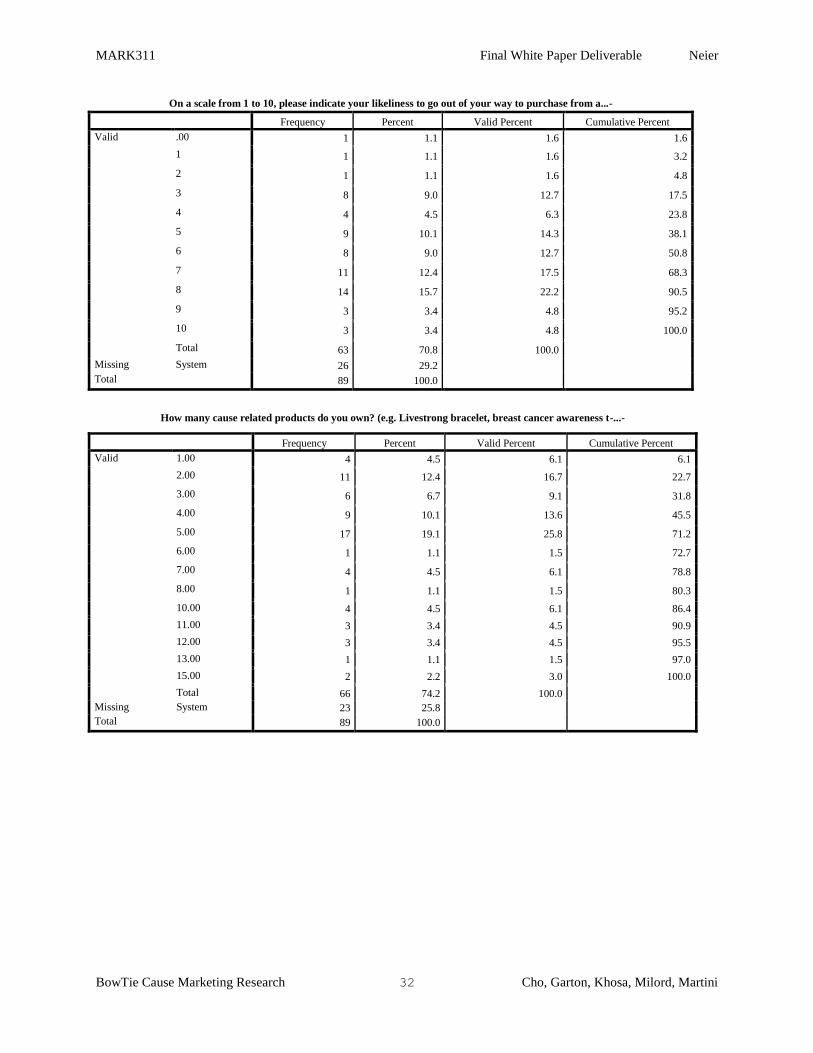
On a scale from 1 to 10, please indicate your likeliness to go out of your way to purchase from a...-
Frequency Percent Valid Percent Cumulative Percent
Valid .00 1 1.1 1.6 1.6
1 1 1.1 1.6 3.2
2 1 1.1 1.6 4.8
3 8 9.0 12.7 17.5
4 4 4.5 6.3 23.8
5 9 10.1 14.3 38.1
6 8 9.0 12.7 50.8
7 11 12.4 17.5 68.3
8 14 15.7 22.2 90.5
9 3 3.4 4.8 95.2
10 3 3.4 4.8 100.0
Total 63 70.8 100.0
Missing System 26 29.2
Total 89 100.0
How many cause related products do you own? (e.g. Livestrong bracelet, breast cancer awareness t-...-
Frequency Percent Valid Percent Cumulative Percent
Valid 1.00 4 4.5 6.1 6.1
2.00 11 12.4 16.7 22.7
3.00 6 6.7 9.1 31.8
4.00 9 10.1 13.6 45.5
5.00 17 19.1 25.8 71.2
6.00 1 1.1 1.5 72.7
7.00 4 4.5 6.1 78.8
8.00 1 1.1 1.5 80.3
10.00 4 4.5 6.1 86.4
11.00 3 3.4 4.5 90.9
12.00 3 3.4 4.5 95.5
13.00 1 1.1 1.5 97.0
15.00 2 2.2 3.0 100.0
Total 66 74.2 100.0
Missing System 23 25.8
Total 89 100.0

MARK311 Final White Paper Deliverable Neier
BowTie Cause Marketing Research 33 Cho, Garton, Khosa, Milord, Martini
Which kind of apparel are you more likely to purchase for a cause? (e.g. Marriage Equality, A...-Necklace
Frequency Percent Valid Percent Cumulative Percent
Valid Very Unlikely 22 24.7 28.9 28.9
Unlikely 14 15.7 18.4 47.4
Undecided 11 12.4 14.5 61.8
Likely 22 24.7 28.9 90.8
Very Likely 7 7.9 9.2 100.0
Total 76 85.4 100.0
Missing System 13 14.6
Total 89 100.0
Which kind of apparel are you more likely to purchase for a cause? (e.g. Marriage Equality, A...-Tie
Frequency Percent Valid Percent Cumulative Percent
Valid Very Unlikely 42 47.2 56.8 56.8
Unlikely 19 21.3 25.7 82.4
Undecided 5 5.6 6.8 89.2
Likely 8 9.0 10.8 100.0
Total 74 83.1 100.0
Missing System 15 16.9
Total 89 100.0
Which kind of apparel are you more likely to purchase for a cause? (e.g. Marriage Equality, A...-Scarf
Frequency Percent Valid Percent Cumulative Percent
Valid Very Unlikely 24 27.0 31.2 31.2
Unlikely 17 19.1 22.1 53.2
Undecided 14 15.7 18.2 71.4
Likely 18 20.2 23.4 94.8
Very Likely 4 4.5 5.2 100.0
Total 77 86.5 100.0
Missing System 12 13.5
Total 89 100.0
Which kind of apparel are you more likely to purchase for a cause? (e.g. Marriage Equality, A...-Bow tie
Frequency Percent Valid Percent Cumulative Percent
Valid Very Unlikely 42 47.2 56.0 56.0
Unlikely 19 21.3 25.3 81.3
Undecided 6 6.7 8.0 89.3
Likely 8 9.0 10.7 100.0
Total 75 84.3 100.0
Missing System 14 15.7
Total 89 100.0
MARK311 Final White Paper Deliverable Neier
BowTie Cause Marketing Research 34 Cho, Garton, Khosa, Milord, Martini
Which kind of apparel are you more likely to purchase for a cause? (e.g. Marriage Equality, A...-Shirt
Frequency Percent Valid Percent Cumulative Percent
Valid Very Unlikely 9 10.1 11.7 11.7
Unlikely 8 9.0 10.4 22.1
Undecided 8 9.0 10.4 32.5
Likely 34 38.2 44.2 76.6
Very Likely 18 20.2 23.4 100.0
Total 77 86.5 100.0
Missing System 12 13.5
Total 89 100.0
Which kind of apparel are you more likely to purchase for a cause? (e.g. Marriage Equality, A...-Sweatshirt
Frequency Percent Valid Percent Cumulative Percent
Valid Very Unlikely 11 12.4 14.7 14.7
Unlikely 4 4.5 5.3 20.0
Undecided 13 14.6 17.3 37.3
Likely 35 39.3 46.7 84.0
Very Likely 12 13.5 16.0 100.0
Total 75 84.3 100.0
Missing System 14 15.7
Total 89 100.0
Where are you more likely to purchase the previously mentioned apparel?
Frequency Percent Valid Percent Cumulative Percent
Valid Online 17 19.1 21.8 21.8
In Store 22 24.7 28.2 50.0
Fundraising Event 39 43.8 50.0 100.0
Total 78 87.6 100.0
Missing System 11 12.4
Total 89 100.0
Do you go to Philanthropic/Fundraising events?
Frequency Percent Valid Percent Cumulative Percent
Valid Yes 50 56.2 63.3 63.3
No 29 32.6 36.7 100.0
Total 79 88.8 100.0
Missing System 10 11.2
Total 89 100.0
MARK311 Final White Paper Deliverable Neier
BowTie Cause Marketing Research 35 Cho, Garton, Khosa, Milord, Martini
When you go to philanthropic events, on average how far do you/are you willing to travel from you...
Frequency Percent Valid Percent Cumulative Percent
Valid 17 6 6.7 12.0 12.0
18 20 22.5 40.0 52.0
19 8 9.0 16.0 68.0
20 6 6.7 12.0 80.0
21 10 11.2 20.0 100.0
Total 50 56.2 100.0
Missing System 39 43.8
Total 89 100.0
Please order the following social media sites according to the frequency in which you use them. ...-Facebook
Frequency Percent Valid Percent Cumulative Percent
Valid 1 61 68.5 80.3 80.3
2 9 10.1 11.8 92.1
3 4 4.5 5.3 97.4
4 2 2.2 2.6 100.0
Total 76 85.4 100.0
Missing System 13 14.6
Total 89 100.0
Please order the following social media sites according to the frequency in which you use them. ...-Twitter
Frequency Percent Valid Percent Cumulative Percent
Valid 1 5 5.6 6.6 6.6
2 14 15.7 18.4 25.0
3 14 15.7 18.4 43.4
4 26 29.2 34.2 77.6
5 17 19.1 22.4 100.0
Total 76 85.4 100.0
Missing System 13 14.6
Total 89 100.0
Please order the following social media sites according to the frequency in which you use them. ...-Instagram
Frequency Percent Valid Percent Cumulative Percent
Valid 1 5 5.6 6.6 6.6
2 27 30.3 35.5 42.1
3 19 21.3 25.0 67.1
4 17 19.1 22.4 89.5
5 8 9.0 10.5 100.0
Total 76 85.4 100.0
Missing System 13 14.6
Total 89 100.0
MARK311 Final White Paper Deliverable Neier
BowTie Cause Marketing Research 36 Cho, Garton, Khosa, Milord, Martini
Please order the following social media sites according to the frequency in which you use them. ...-Pinterest
Frequency Percent Valid Percent Cumulative Percent
Valid 1 1 1.1 1.3 1.3
2 6 6.7 7.9 9.2
3 12 13.5 15.8 25.0
4 17 19.1 22.4 47.4
5 40 44.9 52.6 100.0
Total 76 85.4 100.0
Missing System 13 14.6
Total 89 100.0
Please order the following social media sites according to the frequency in which you use them. ...-YouTube
Frequency Percent Valid Percent Cumulative Percent
Valid 1 4 4.5 5.3 5.3
2 20 22.5 26.3 31.6
3 27 30.3 35.5 67.1
4 14 15.7 18.4 85.5
5 11 12.4 14.5 100.0
Total 76 85.4 100.0
Missing System 13 14.6
Total 89 100.0
If you saw someone promoting a brand on the following social media sites, how likely or unlikely...-Blogs
Frequency Percent Valid Percent Cumulative Percent
Valid Very Unlikely 24 27.0 31.6 31.6
Unlikely 11 12.4 14.5 46.1
Neither 12 13.5 15.8 61.8
Likely 24 27.0 31.6 93.4
Very Likely 5 5.6 6.6 100.0
Total 76 85.4 100.0
Missing System 13 14.6
Total 89 100.0
If you saw someone promoting a brand on the following social media sites, how likely or unlikely...-Twitter
Frequency Percent Valid Percent Cumulative Percent
Valid Very Unlikely 28 31.5 36.8 36.8
Unlikely 14 15.7 18.4 55.3
Neither 8 9.0 10.5 65.8
Likely 23 25.8 30.3 96.1
Very Likely 3 3.4 3.9 100.0
Total 76 85.4 100.0
Missing System 13 14.6
Total 89 100.0
MARK311 Final White Paper Deliverable Neier
BowTie Cause Marketing Research 37 Cho, Garton, Khosa, Milord, Martini
If you saw someone promoting a brand on the following social media sites, how likely or unlikely...-Pinterest
Frequency Percent Valid Percent Cumulative Percent
Valid Very Unlikely 27 30.3 35.5 35.5
Unlikely 16 18.0 21.1 56.6
Neither 16 18.0 21.1 77.6
Likely 14 15.7 18.4 96.1
Very Likely 3 3.4 3.9 100.0
Total 76 85.4 100.0
Missing System 13 14.6
Total 89 100.0
If you saw someone promoting a brand on the following social media sites, how likely or unlikely...-Facebook
Frequency Percent Valid Percent Cumulative Percent
Valid Very Unlikely 8 9.0 10.4 10.4
Unlikely 6 6.7 7.8 18.2
Neither 6 6.7 7.8 26.0
Likely 47 52.8 61.0 87.0
Very Likely 10 11.2 13.0 100.0
Total 77 86.5 100.0
Missing System 12 13.5
Total 89 100.0
If you saw someone promoting a brand on the following social media sites, how likely or unlikely...-Email
Frequency Percent Valid Percent Cumulative Percent
Valid Very Unlikely 15 16.9 19.5 19.5
Unlikely 19 21.3 24.7 44.2
Neither 13 14.6 16.9 61.0
Likely 24 27.0 31.2 92.2
Very Likely 6 6.7 7.8 100.0
Total 77 86.5 100.0
Missing System 12 13.5
Total 89 100.0
If you saw someone promoting a brand on the following social media sites, how likely or unlikely...-Youtube
Frequency Percent Valid Percent Cumulative Percent
Valid Very Unlikely 11 12.4 14.5 14.5
Unlikely 15 16.9 19.7 34.2
Neither 20 22.5 26.3 60.5
Likely 22 24.7 28.9 89.5
Very Likely 8 9.0 10.5 100.0
Total 76 85.4 100.0
Missing System 13 14.6
Total 89 100.0
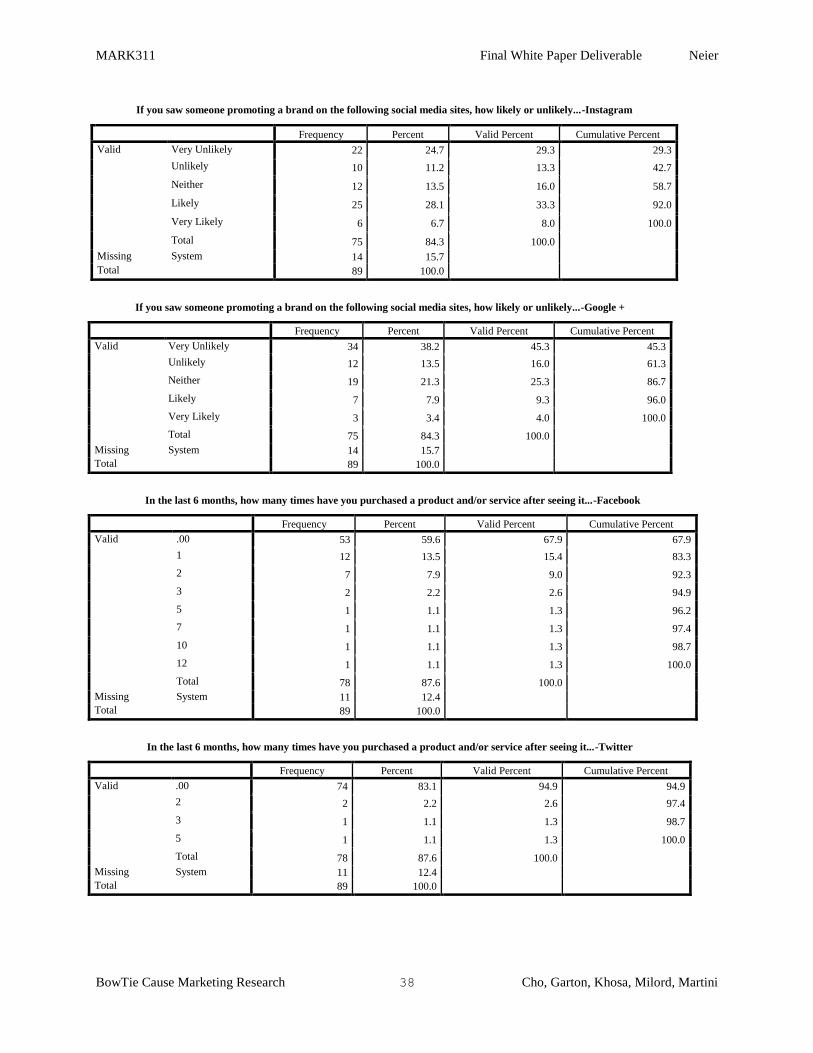
MARK311 Final White Paper Deliverable Neier
BowTie Cause Marketing Research 38 Cho, Garton, Khosa, Milord, Martini
If you saw someone promoting a brand on the following social media sites, how likely or unlikely...-Instagram
Frequency Percent Valid Percent Cumulative Percent
Valid Very Unlikely 22 24.7 29.3 29.3
Unlikely 10 11.2 13.3 42.7
Neither 12 13.5 16.0 58.7
Likely 25 28.1 33.3 92.0
Very Likely 6 6.7 8.0 100.0
Total 75 84.3 100.0
Missing System 14 15.7
Total 89 100.0
If you saw someone promoting a brand on the following social media sites, how likely or unlikely...-Google +
Frequency Percent Valid Percent Cumulative Percent
Valid Very Unlikely 34 38.2 45.3 45.3
Unlikely 12 13.5 16.0 61.3
Neither 19 21.3 25.3 86.7
Likely 7 7.9 9.3 96.0
Very Likely 3 3.4 4.0 100.0
Total 75 84.3 100.0
Missing System 14 15.7
Total 89 100.0
In the last 6 months, how many times have you purchased a product and/or service after seeing it...-Facebook
Frequency Percent Valid Percent Cumulative Percent
Valid .00 53 59.6 67.9 67.9
1 12 13.5 15.4 83.3
2 7 7.9 9.0 92.3
3 2 2.2 2.6 94.9
5 1 1.1 1.3 96.2
7 1 1.1 1.3 97.4
10 1 1.1 1.3 98.7
12 1 1.1 1.3 100.0
Total 78 87.6 100.0
Missing System 11 12.4
Total 89 100.0
In the last 6 months, how many times have you purchased a product and/or service after seeing it...-Twitter
Frequency Percent Valid Percent Cumulative Percent
Valid .00 74 83.1 94.9 94.9
2 2 2.2 2.6 97.4
3 1 1.1 1.3 98.7
5 1 1.1 1.3 100.0
Total 78 87.6 100.0
Missing System 11 12.4
Total 89 100.0
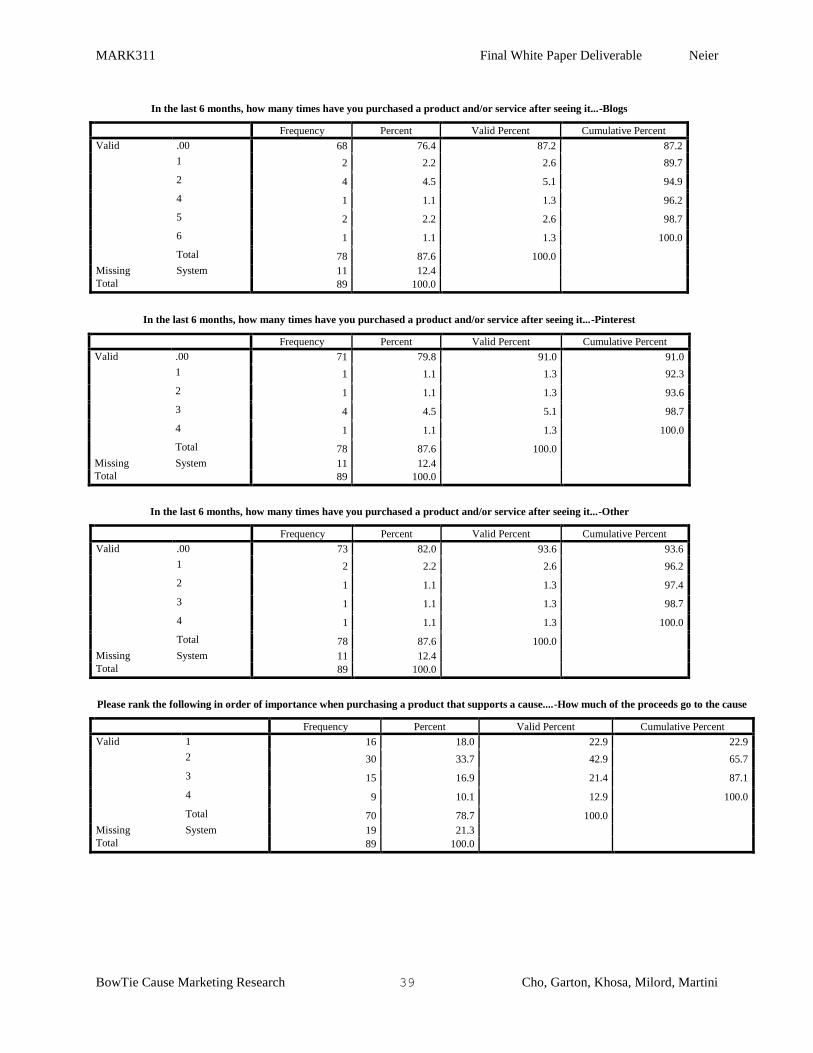
MARK311 Final White Paper Deliverable Neier
BowTie Cause Marketing Research 39 Cho, Garton, Khosa, Milord, Martini
In the last 6 months, how many times have you purchased a product and/or service after seeing it...-Blogs
Frequency Percent Valid Percent Cumulative Percent
Valid .00 68 76.4 87.2 87.2
1 2 2.2 2.6 89.7
2 4 4.5 5.1 94.9
4 1 1.1 1.3 96.2
5 2 2.2 2.6 98.7
6 1 1.1 1.3 100.0
Total 78 87.6 100.0
Missing System 11 12.4
Total 89 100.0
In the last 6 months, how many times have you purchased a product and/or service after seeing it...-Pinterest
Frequency Percent Valid Percent Cumulative Percent
Valid .00 71 79.8 91.0 91.0
1 1 1.1 1.3 92.3
2 1 1.1 1.3 93.6
3 4 4.5 5.1 98.7
4 1 1.1 1.3 100.0
Total 78 87.6 100.0
Missing System 11 12.4
Total 89 100.0
In the last 6 months, how many times have you purchased a product and/or service after seeing it...-Other
Frequency Percent Valid Percent Cumulative Percent
Valid .00 73 82.0 93.6 93.6
1 2 2.2 2.6 96.2
2 1 1.1 1.3 97.4
3 1 1.1 1.3 98.7
4 1 1.1 1.3 100.0
Total 78 87.6 100.0
Missing System 11 12.4
Total 89 100.0
Please rank the following in order of importance when purchasing a product that supports a cause....-How much of the proceeds go to the cause
Frequency Percent Valid Percent Cumulative Percent
Valid 1 16 18.0 22.9 22.9
2 30 33.7 42.9 65.7
3 15 16.9 21.4 87.1
4 9 10.1 12.9 100.0
Total 70 78.7 100.0
Missing System 19 21.3
Total 89 100.0
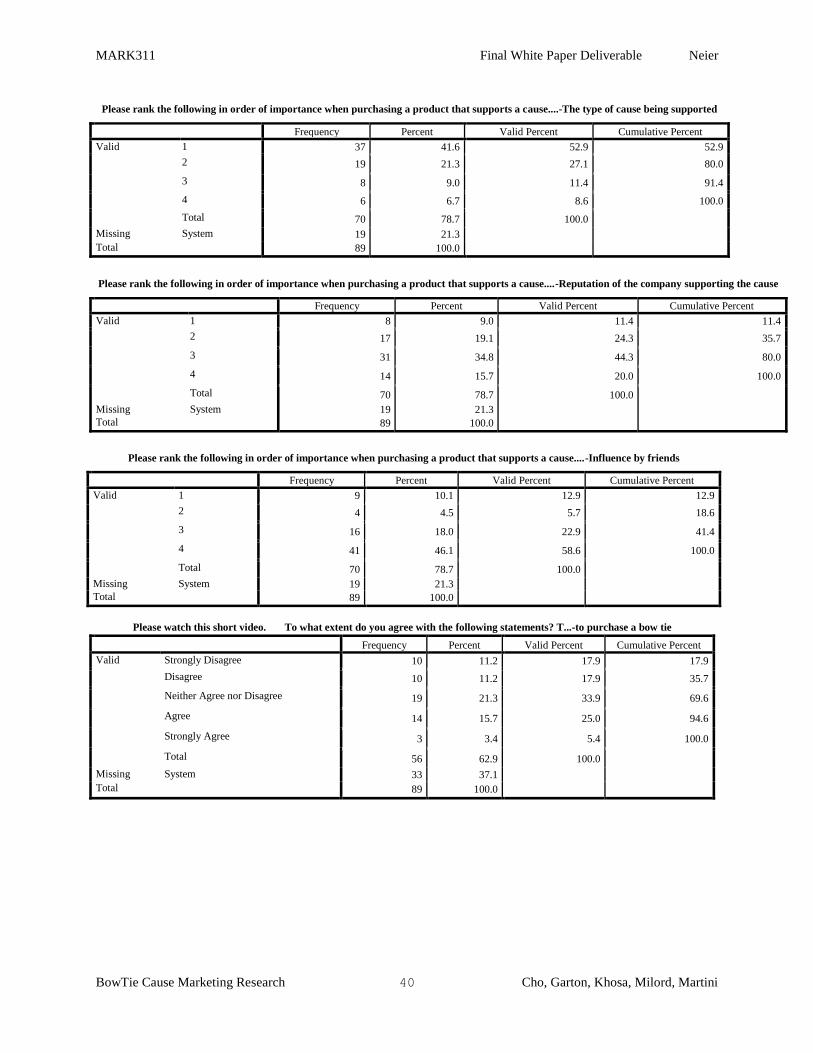
MARK311 Final White Paper Deliverable Neier
BowTie Cause Marketing Research 40 Cho, Garton, Khosa, Milord, Martini
Please rank the following in order of importance when purchasing a product that supports a cause....-The type of cause being supported
Frequency Percent Valid Percent Cumulative Percent
Valid 1 37 41.6 52.9 52.9
2 19 21.3 27.1 80.0
3 8 9.0 11.4 91.4
4 6 6.7 8.6 100.0
Total 70 78.7 100.0
Missing System 19 21.3
Total 89 100.0
Please rank the following in order of importance when purchasing a product that supports a cause....-Reputation of the company supporting the cause
Frequency Percent Valid Percent Cumulative Percent
Valid 1 8 9.0 11.4 11.4
2 17 19.1 24.3 35.7
3 31 34.8 44.3 80.0
4 14 15.7 20.0 100.0
Total 70 78.7 100.0
Missing System 19 21.3
Total 89 100.0
Please rank the following in order of importance when purchasing a product that supports a cause....-Influence by friends
Frequency Percent Valid Percent Cumulative Percent
Valid 1 9 10.1 12.9 12.9
2 4 4.5 5.7 18.6
3 16 18.0 22.9 41.4
4 41 46.1 58.6 100.0
Total 70 78.7 100.0
Missing System 19 21.3
Total 89 100.0
Please watch this short video. To what extent do you agree with the following statements? T...-to purchase a bow tie
Frequency Percent Valid Percent Cumulative Percent
Valid Strongly Disagree 10 11.2 17.9 17.9
Disagree 10 11.2 17.9 35.7
Neither Agree nor Disagree 19 21.3 33.9 69.6
Agree 14 15.7 25.0 94.6
Strongly Agree 3 3.4 5.4 100.0
Total 56 62.9 100.0
Missing System 33 37.1
Total 89 100.0
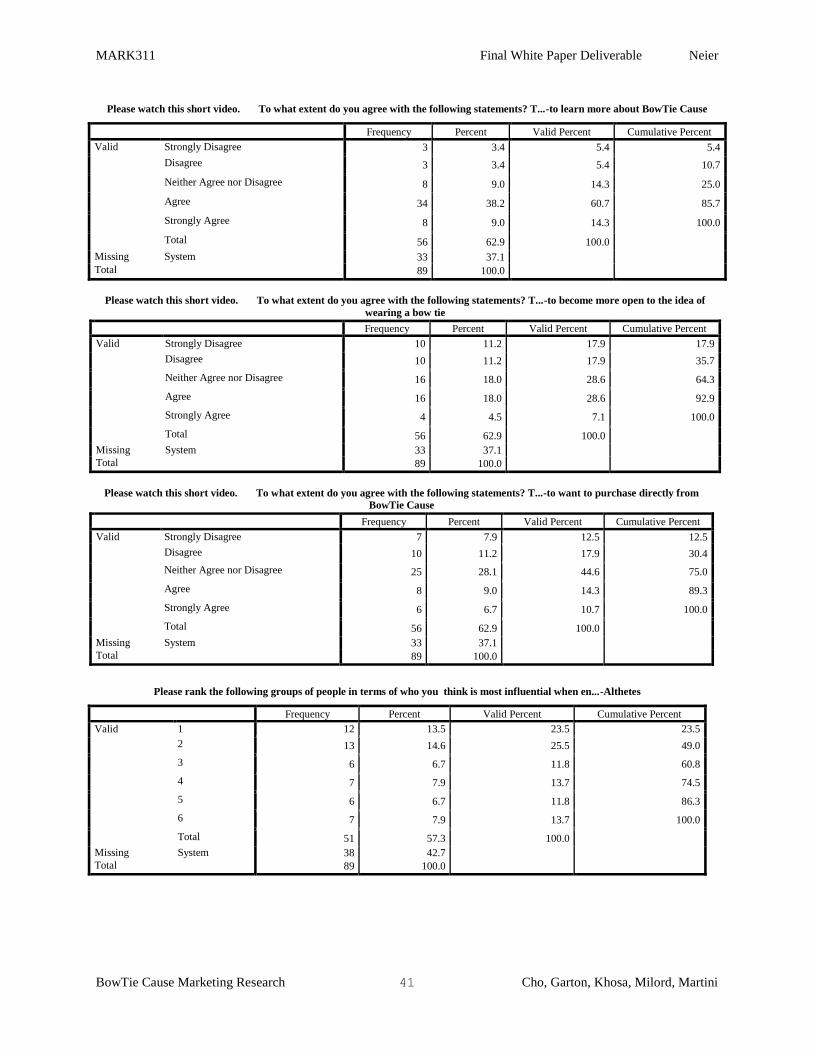
MARK311 Final White Paper Deliverable Neier
BowTie Cause Marketing Research 41 Cho, Garton, Khosa, Milord, Martini
Please watch this short video. To what extent do you agree with the following statements? T...-to learn more about BowTie Cause
Frequency Percent Valid Percent Cumulative Percent
Valid Strongly Disagree 3 3.4 5.4 5.4
Disagree 3 3.4 5.4 10.7
Neither Agree nor Disagree 8 9.0 14.3 25.0
Agree 34 38.2 60.7 85.7
Strongly Agree 8 9.0 14.3 100.0
Total 56 62.9 100.0
Missing System 33 37.1
Total 89 100.0
Please watch this short video. To what extent do you agree with the following statements? T...-to become more open to the idea of
wearing a bow tie
Frequency Percent Valid Percent Cumulative Percent
Valid Strongly Disagree 10 11.2 17.9 17.9
Disagree 10 11.2 17.9 35.7
Neither Agree nor Disagree 16 18.0 28.6 64.3
Agree 16 18.0 28.6 92.9
Strongly Agree 4 4.5 7.1 100.0
Total 56 62.9 100.0
Missing System 33 37.1
Total 89 100.0
Please watch this short video. To what extent do you agree with the following statements? T...-to want to purchase directly from
BowTie Cause
Frequency Percent Valid Percent Cumulative Percent
Valid Strongly Disagree 7 7.9 12.5 12.5
Disagree 10 11.2 17.9 30.4
Neither Agree nor Disagree 25 28.1 44.6 75.0
Agree 8 9.0 14.3 89.3
Strongly Agree 6 6.7 10.7 100.0
Total 56 62.9 100.0
Missing System 33 37.1
Total 89 100.0
Please rank the following groups of people in terms of who you think is most influential when en...-Althetes
Frequency Percent Valid Percent Cumulative Percent
Valid 1 12 13.5 23.5 23.5
2 13 14.6 25.5 49.0
3 6 6.7 11.8 60.8
4 7 7.9 13.7 74.5
5 6 6.7 11.8 86.3
6 7 7.9 13.7 100.0
Total 51 57.3 100.0
Missing System 38 42.7
Total 89 100.0
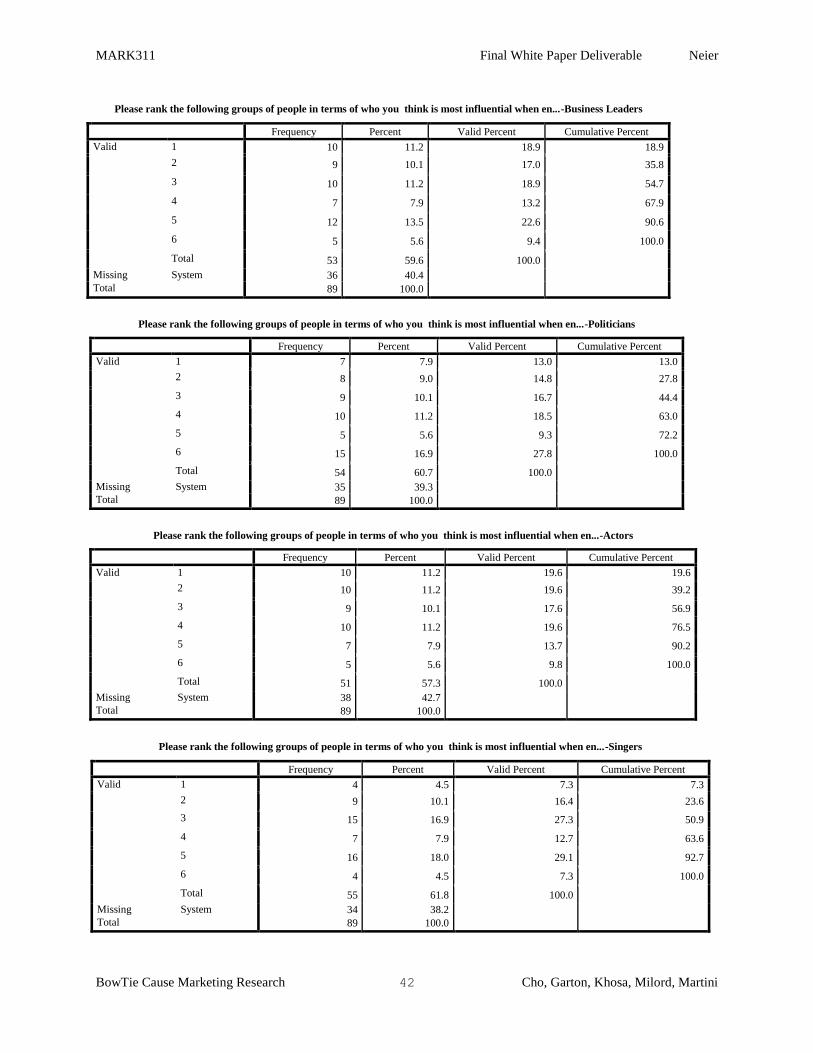
MARK311 Final White Paper Deliverable Neier
BowTie Cause Marketing Research 42 Cho, Garton, Khosa, Milord, Martini
Please rank the following groups of people in terms of who you think is most influential when en...-Business Leaders
Frequency Percent Valid Percent Cumulative Percent
Valid 1 10 11.2 18.9 18.9
2 9 10.1 17.0 35.8
3 10 11.2 18.9 54.7
4 7 7.9 13.2 67.9
5 12 13.5 22.6 90.6
6 5 5.6 9.4 100.0
Total 53 59.6 100.0
Missing System 36 40.4
Total 89 100.0
Please rank the following groups of people in terms of who you think is most influential when en...-Politicians
Frequency Percent Valid Percent Cumulative Percent
Valid 1 7 7.9 13.0 13.0
2 8 9.0 14.8 27.8
3 9 10.1 16.7 44.4
4 10 11.2 18.5 63.0
5 5 5.6 9.3 72.2
6 15 16.9 27.8 100.0
Total 54 60.7 100.0
Missing System 35 39.3
Total 89 100.0
Please rank the following groups of people in terms of who you think is most influential when en...-Actors
Frequency Percent Valid Percent Cumulative Percent
Valid 1 10 11.2 19.6 19.6
2 10 11.2 19.6 39.2
3 9 10.1 17.6 56.9
4 10 11.2 19.6 76.5
5 7 7.9 13.7 90.2
6 5 5.6 9.8 100.0
Total 51 57.3 100.0
Missing System 38 42.7
Total 89 100.0
Please rank the following groups of people in terms of who you think is most influential when en...-Singers
Frequency Percent Valid Percent Cumulative Percent
Valid 1 4 4.5 7.3 7.3
2 9 10.1 16.4 23.6
3 15 16.9 27.3 50.9
4 7 7.9 12.7 63.6
5 16 18.0 29.1 92.7
6 4 4.5 7.3 100.0
Total 55 61.8 100.0
Missing System 34 38.2
Total 89 100.0
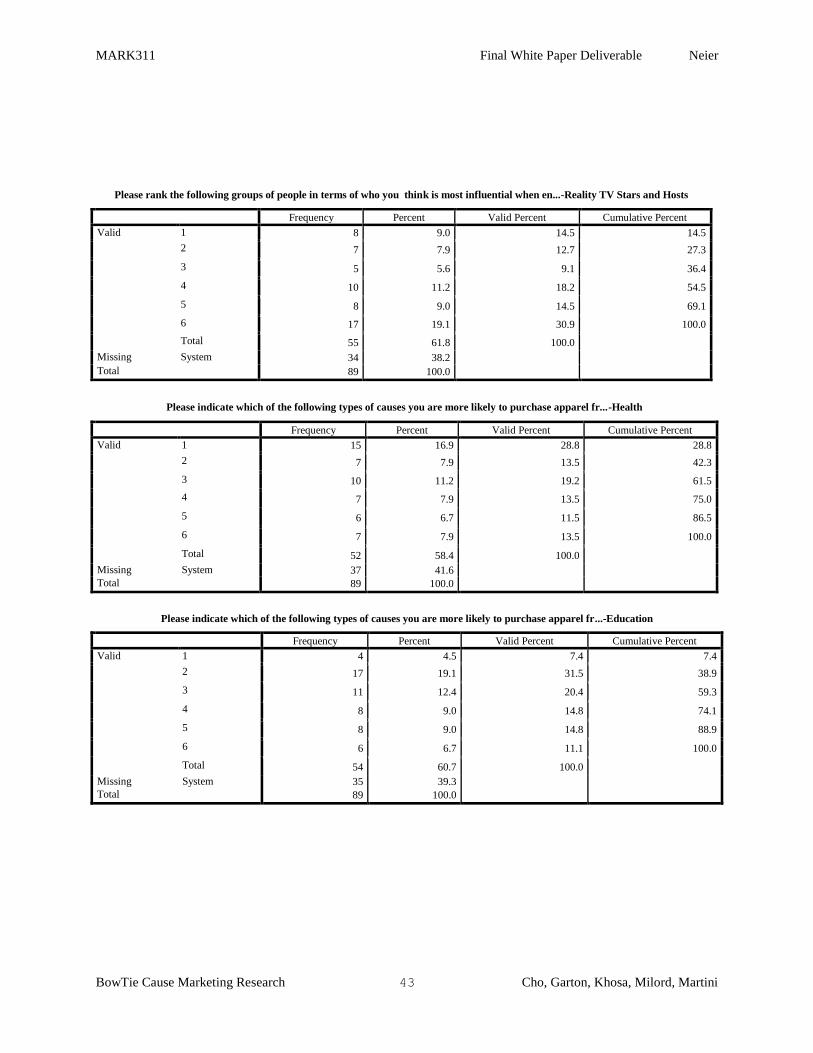
MARK311 Final White Paper Deliverable Neier
BowTie Cause Marketing Research 43 Cho, Garton, Khosa, Milord, Martini
Please rank the following groups of people in terms of who you think is most influential when en...-Reality TV Stars and Hosts
Frequency Percent Valid Percent Cumulative Percent
Valid 1 8 9.0 14.5 14.5
2 7 7.9 12.7 27.3
3 5 5.6 9.1 36.4
4 10 11.2 18.2 54.5
5 8 9.0 14.5 69.1
6 17 19.1 30.9 100.0
Total 55 61.8 100.0
Missing System 34 38.2
Total 89 100.0
Please indicate which of the following types of causes you are more likely to purchase apparel fr...-Health
Frequency Percent Valid Percent Cumulative Percent
Valid 1 15 16.9 28.8 28.8
2 7 7.9 13.5 42.3
3 10 11.2 19.2 61.5
4 7 7.9 13.5 75.0
5 6 6.7 11.5 86.5
6 7 7.9 13.5 100.0
Total 52 58.4 100.0
Missing System 37 41.6
Total 89 100.0
Please indicate which of the following types of causes you are more likely to purchase apparel fr...-Education
Frequency Percent Valid Percent Cumulative Percent
Valid 1 4 4.5 7.4 7.4
2 17 19.1 31.5 38.9
3 11 12.4 20.4 59.3
4 8 9.0 14.8 74.1
5 8 9.0 14.8 88.9
6 6 6.7 11.1 100.0
Total 54 60.7 100.0
Missing System 35 39.3
Total 89 100.0
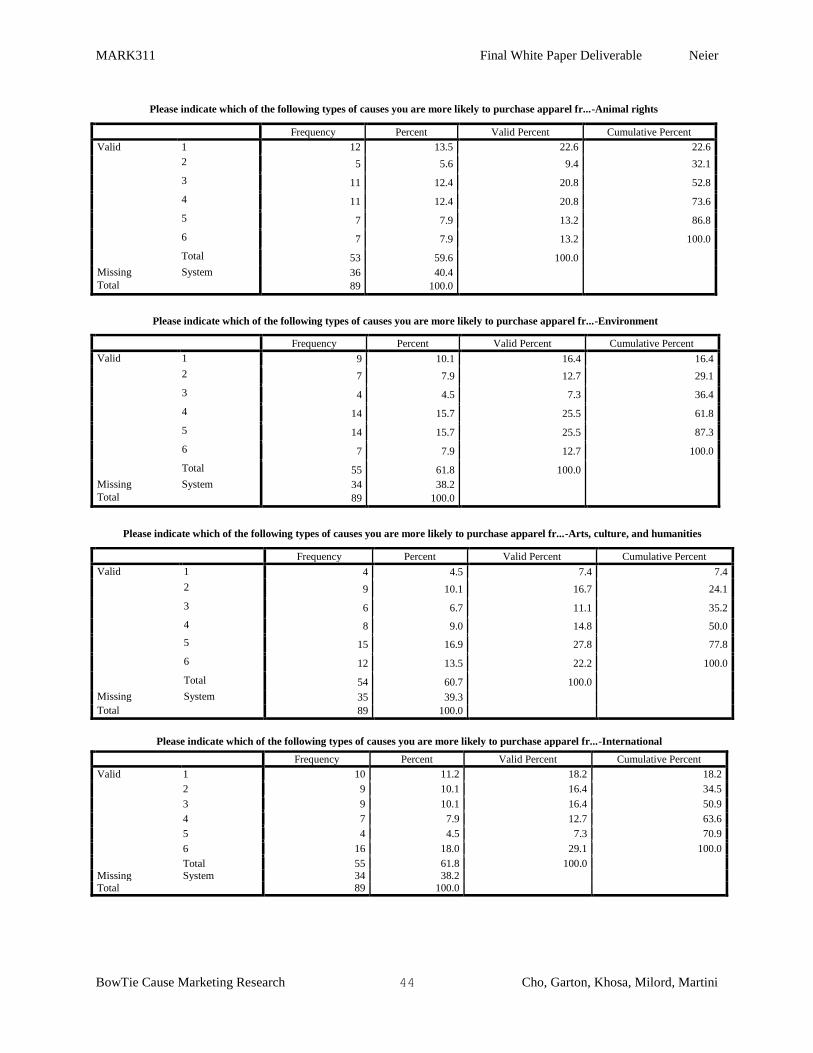
MARK311 Final White Paper Deliverable Neier
BowTie Cause Marketing Research 44 Cho, Garton, Khosa, Milord, Martini
Please indicate which of the following types of causes you are more likely to purchase apparel fr...-Animal rights
Frequency Percent Valid Percent Cumulative Percent
Valid 1 12 13.5 22.6 22.6
2 5 5.6 9.4 32.1
3 11 12.4 20.8 52.8
4 11 12.4 20.8 73.6
5 7 7.9 13.2 86.8
6 7 7.9 13.2 100.0
Total 53 59.6 100.0
Missing System 36 40.4
Total 89 100.0
Please indicate which of the following types of causes you are more likely to purchase apparel fr...-Environment
Frequency Percent Valid Percent Cumulative Percent
Valid 1 9 10.1 16.4 16.4
2 7 7.9 12.7 29.1
3 4 4.5 7.3 36.4
4 14 15.7 25.5 61.8
5 14 15.7 25.5 87.3
6 7 7.9 12.7 100.0
Total 55 61.8 100.0
Missing System 34 38.2
Total 89 100.0
Please indicate which of the following types of causes you are more likely to purchase apparel fr...-Arts, culture, and humanities
Frequency Percent Valid Percent Cumulative Percent
Valid 1 4 4.5 7.4 7.4
2 9 10.1 16.7 24.1
3 6 6.7 11.1 35.2
4 8 9.0 14.8 50.0
5 15 16.9 27.8 77.8
6 12 13.5 22.2 100.0
Total 54 60.7 100.0
Missing System 35 39.3
Total 89 100.0
Please indicate which of the following types of causes you are more likely to purchase apparel fr...-International
Frequency Percent Valid Percent Cumulative Percent
Valid 1 10 11.2 18.2 18.2
2 9 10.1 16.4 34.5
3 9 10.1 16.4 50.9
4 7 7.9 12.7 63.6
5 4 4.5 7.3 70.9
6 16 18.0 29.1 100.0
Total 55 61.8 100.0 Missing System 34 38.2
Total 89 100.0
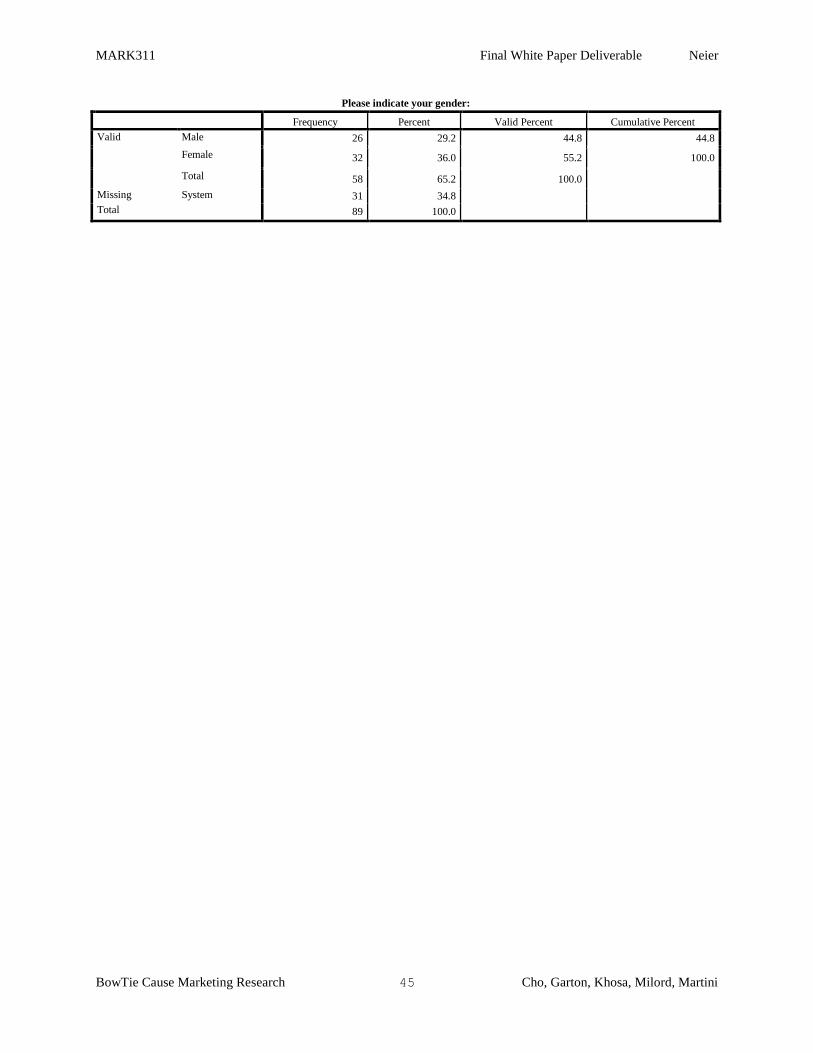
MARK311 Final White Paper Deliverable Neier
BowTie Cause Marketing Research 45 Cho, Garton, Khosa, Milord, Martini
Please indicate your gender:
Frequency Percent Valid Percent Cumulative Percent
Valid Male 26 29.2 44.8 44.8
Female 32 36.0 55.2 100.0
Total 58 65.2 100.0
Missing System 31 34.8
Total 89 100.0
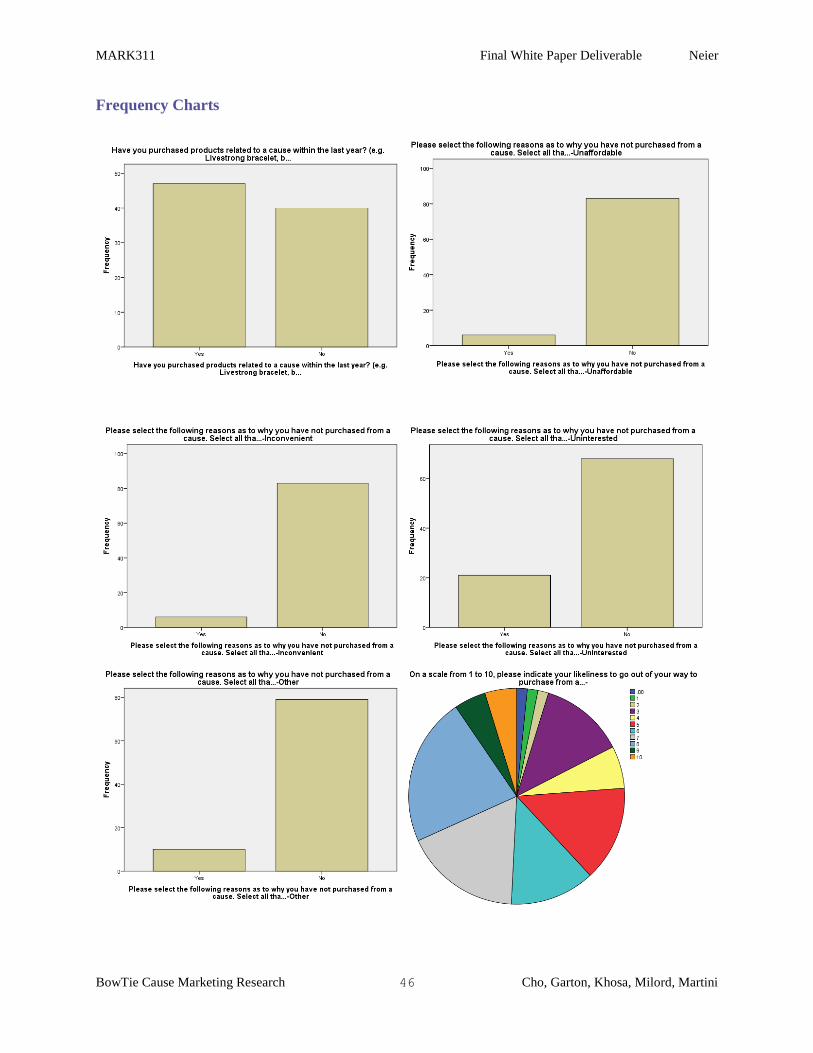
MARK311 Final White Paper Deliverable Neier
BowTie Cause Marketing Research 46 Cho, Garton, Khosa, Milord, Martini
Frequency Charts
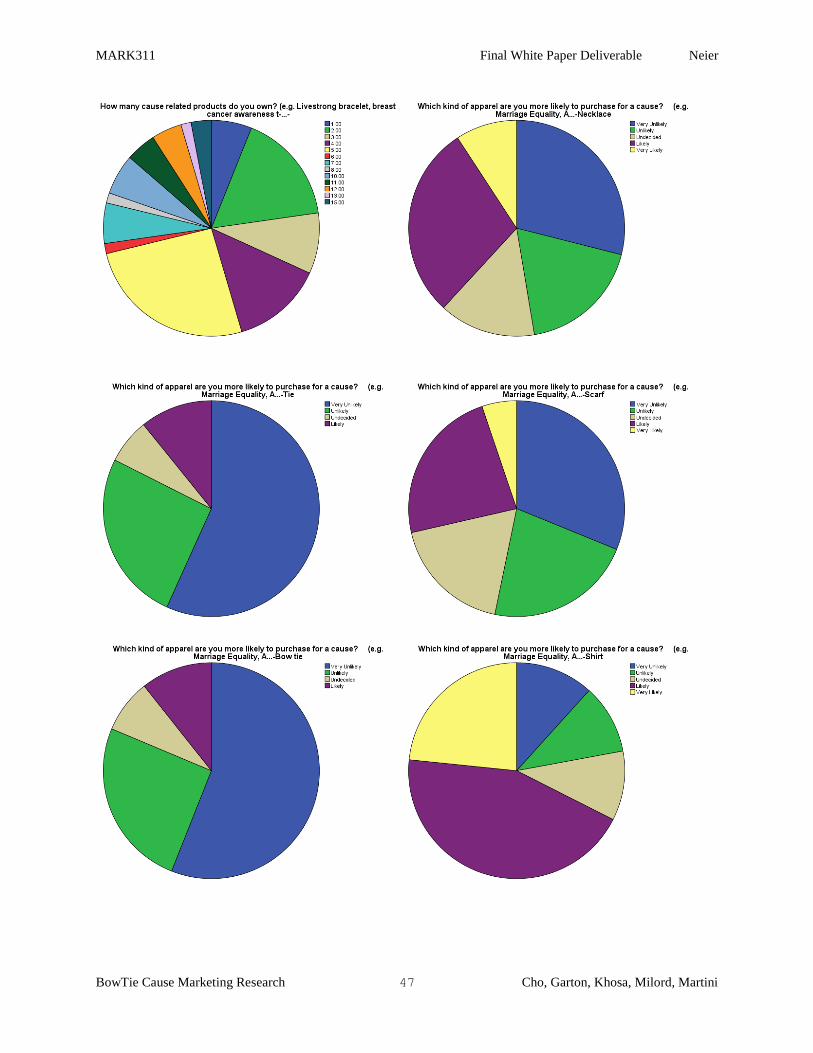
MARK311 Final White Paper Deliverable Neier
BowTie Cause Marketing Research 47 Cho, Garton, Khosa, Milord, Martini
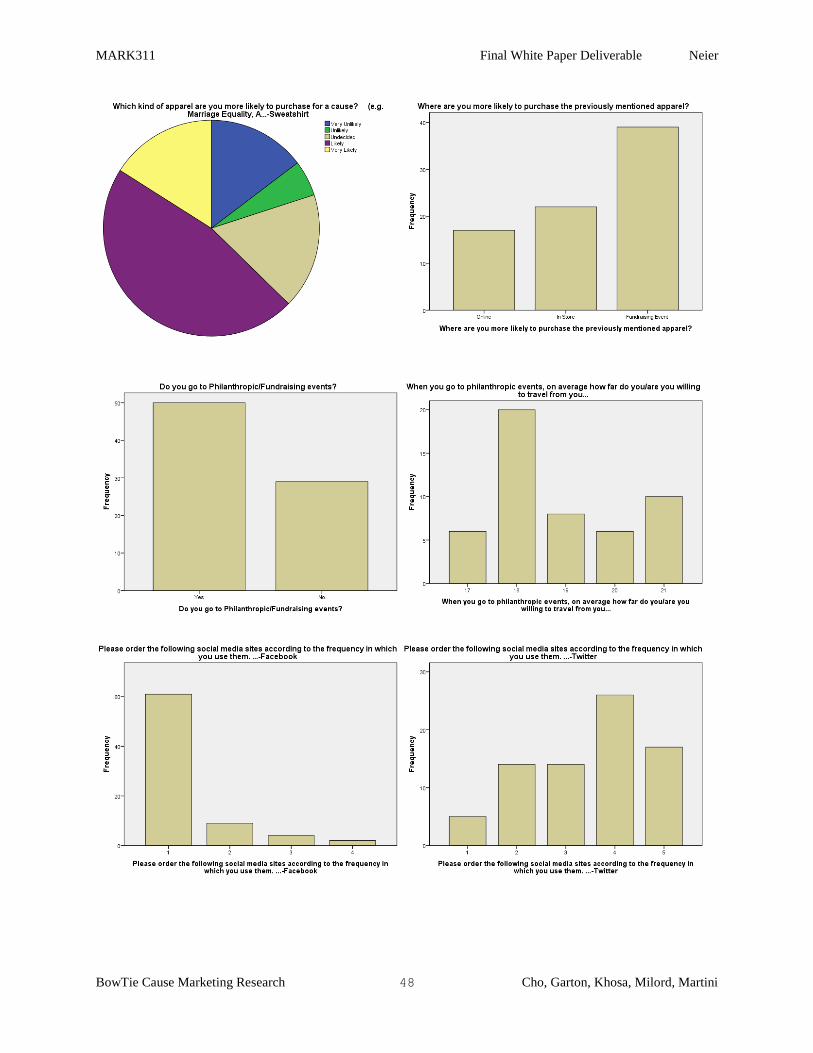
MARK311 Final White Paper Deliverable Neier
BowTie Cause Marketing Research 48 Cho, Garton, Khosa, Milord, Martini
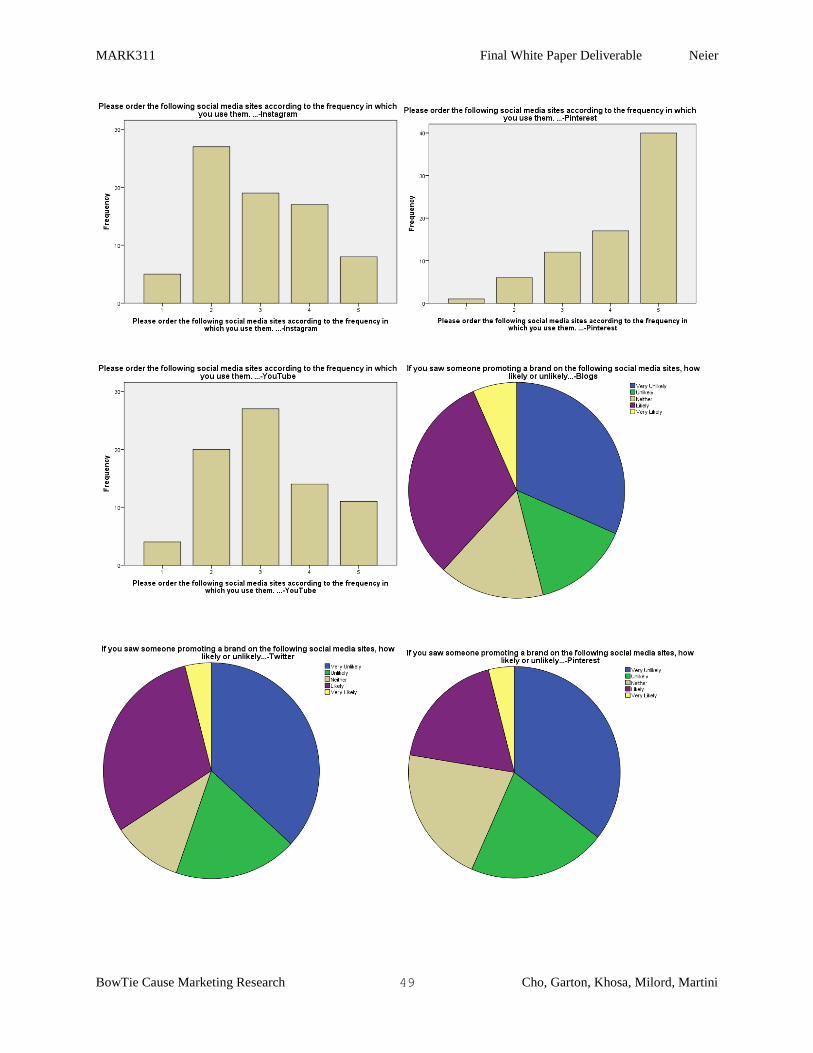
MARK311 Final White Paper Deliverable Neier
BowTie Cause Marketing Research 49 Cho, Garton, Khosa, Milord, Martini
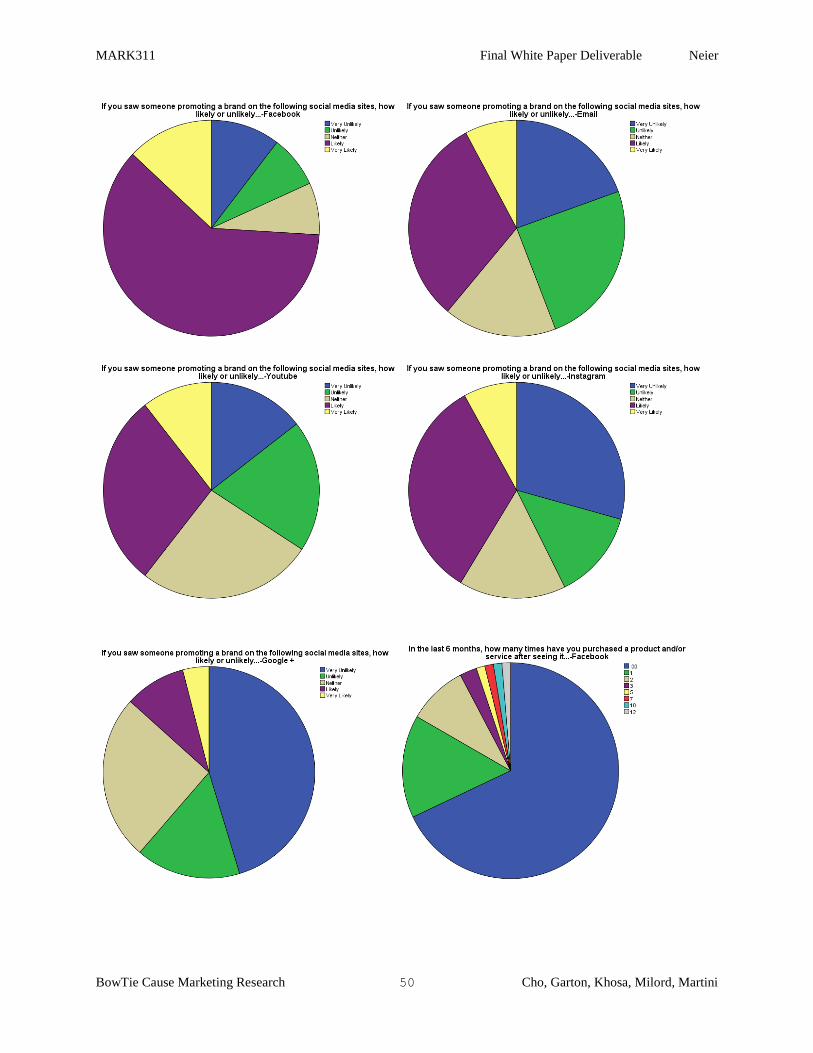
MARK311 Final White Paper Deliverable Neier
BowTie Cause Marketing Research 50 Cho, Garton, Khosa, Milord, Martini
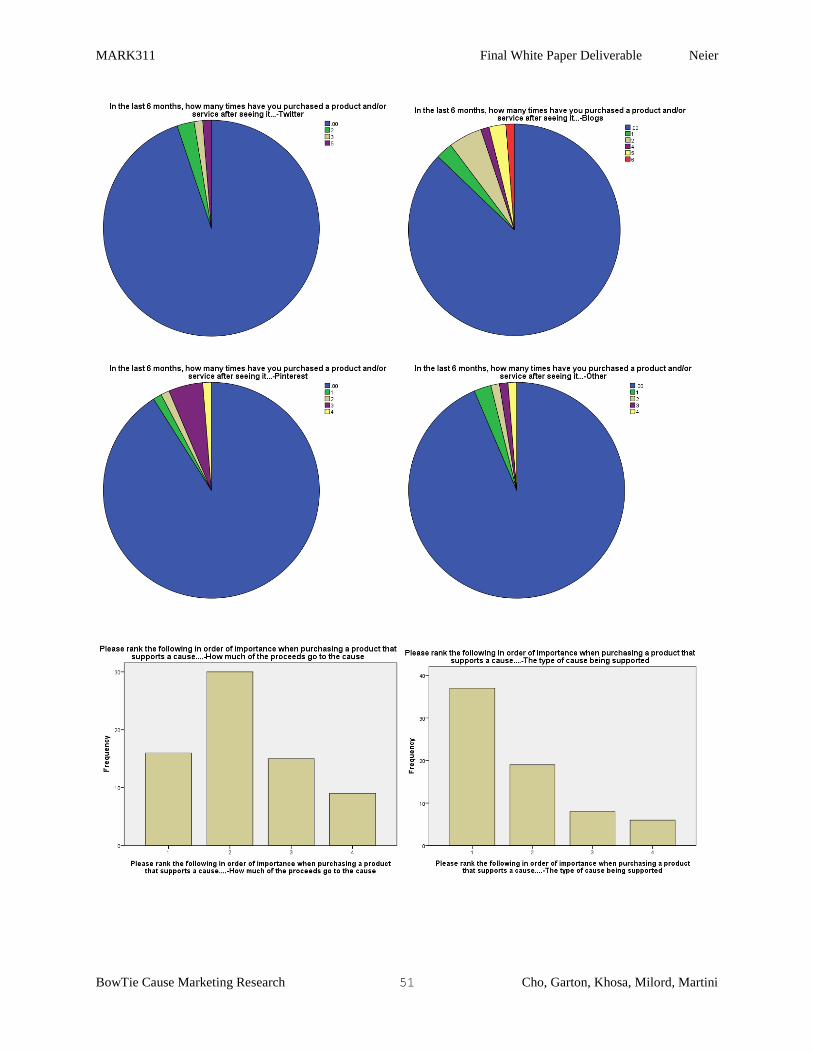
MARK311 Final White Paper Deliverable Neier
BowTie Cause Marketing Research 51 Cho, Garton, Khosa, Milord, Martini
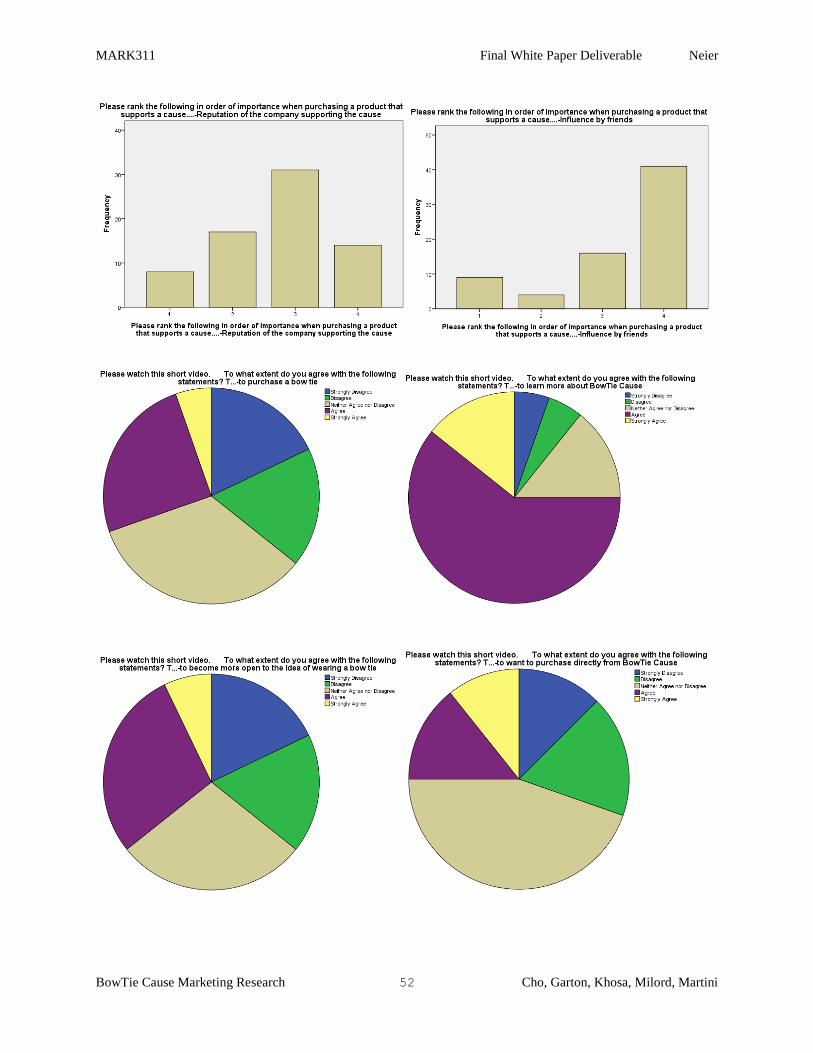
MARK311 Final White Paper Deliverable Neier
BowTie Cause Marketing Research 52 Cho, Garton, Khosa, Milord, Martini
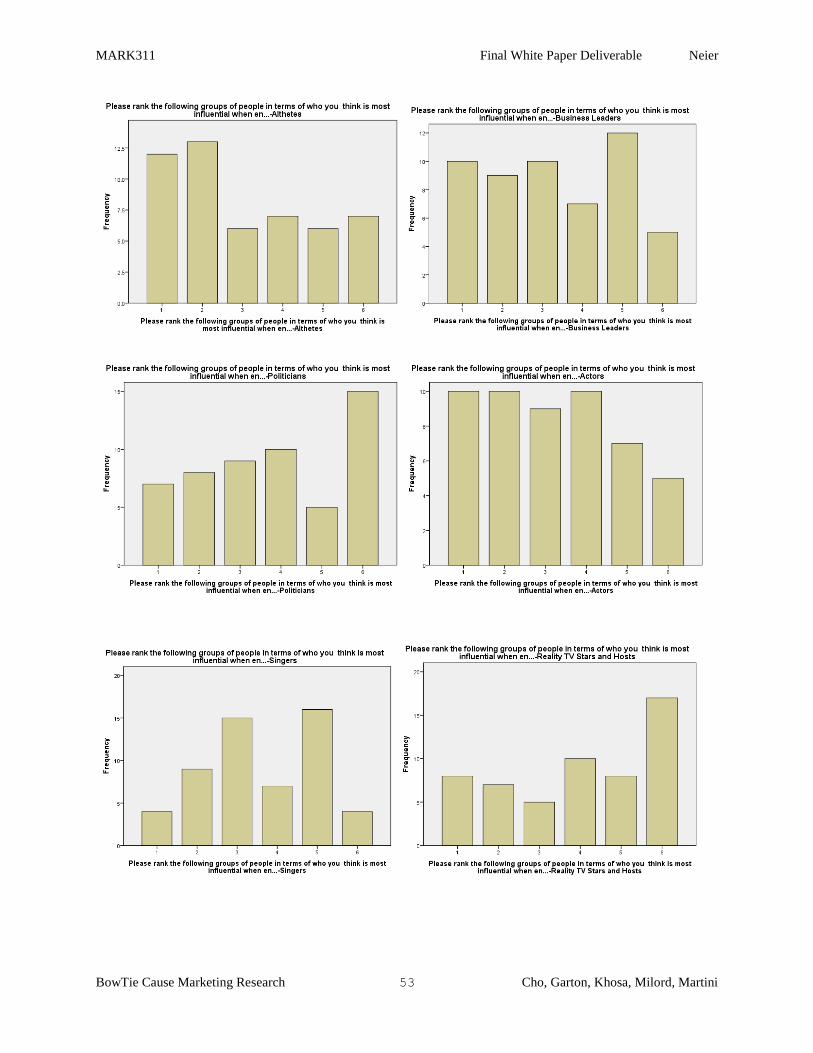
MARK311 Final White Paper Deliverable Neier
BowTie Cause Marketing Research 53 Cho, Garton, Khosa, Milord, Martini
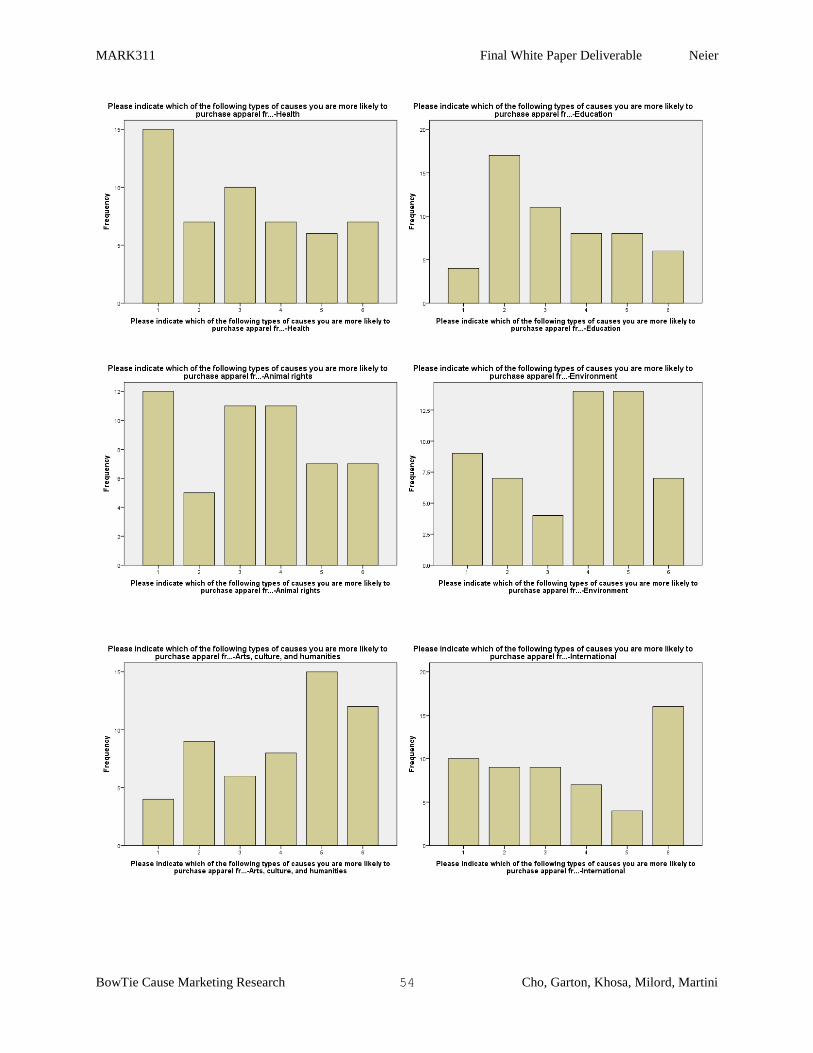
MARK311 Final White Paper Deliverable Neier
BowTie Cause Marketing Research 54 Cho, Garton, Khosa, Milord, Martini

MARK311 Final White Paper Deliverable Neier
BowTie Cause Marketing Research 55 Cho, Garton, Khosa, Milord, Martini
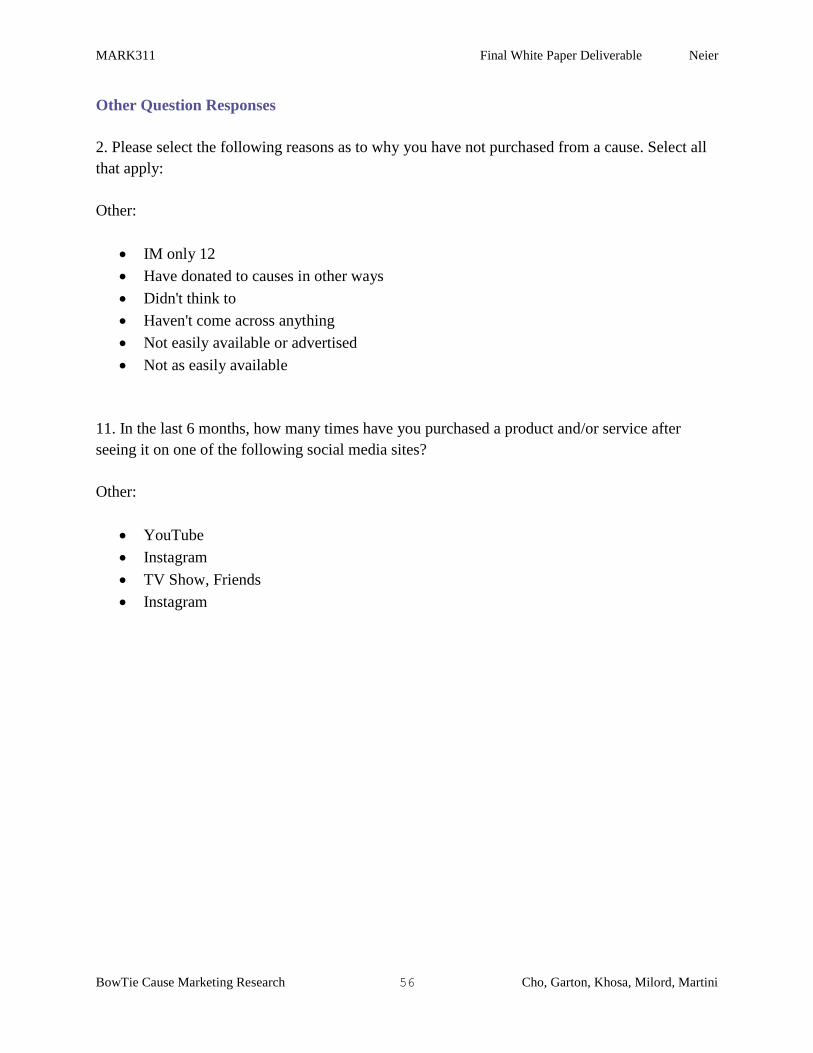
MARK311 Final White Paper Deliverable Neier
BowTie Cause Marketing Research 56 Cho, Garton, Khosa, Milord, Martini
Other Question Responses
2. Please select the following reasons as to why you have not purchased from a cause. Select all
that apply:
Other:
IM only 12
Have donated to causes in other ways
Didn't think to
Haven't come across anything
Not easily available or advertised
Not as easily available
11. In the last 6 months, how many times have you purchased a product and/or service after
seeing it on one of the following social media sites?
Other:
YouTube
TV Show, Friends
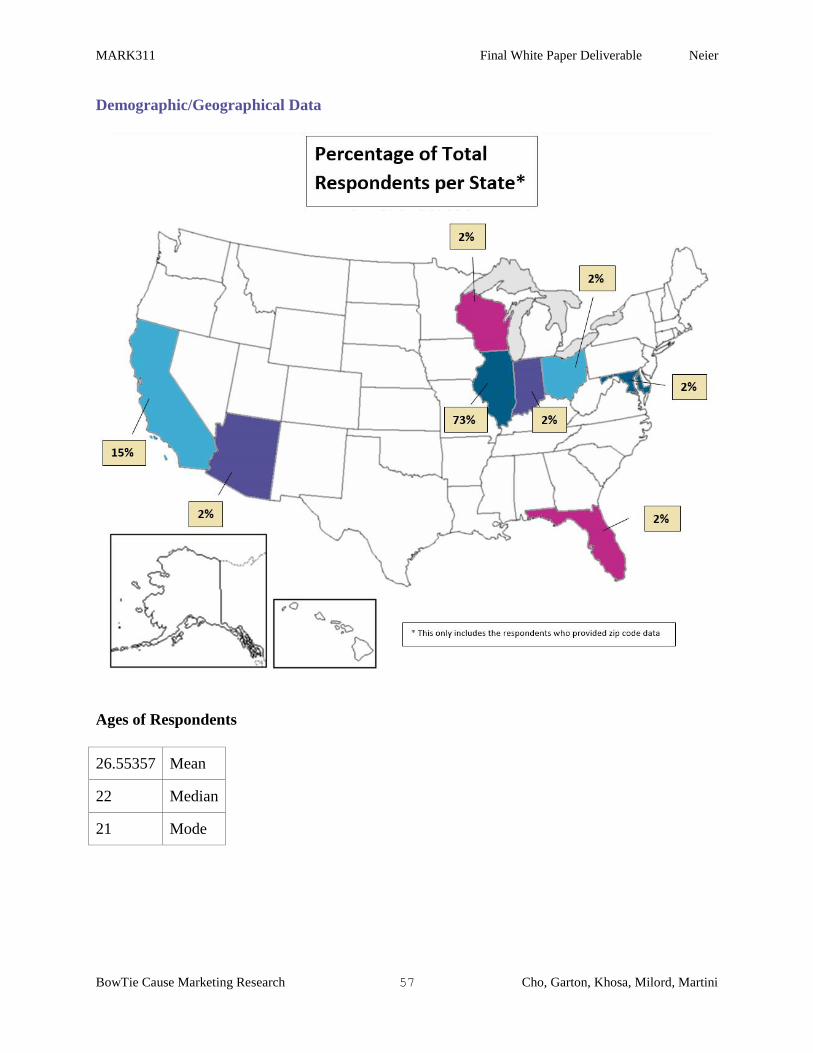
MARK311 Final White Paper Deliverable Neier
BowTie Cause Marketing Research 57 Cho, Garton, Khosa, Milord, Martini
Demographic/Geographical Data
Ages of Respondents
26.55357 Mean
22 Median
21 Mode
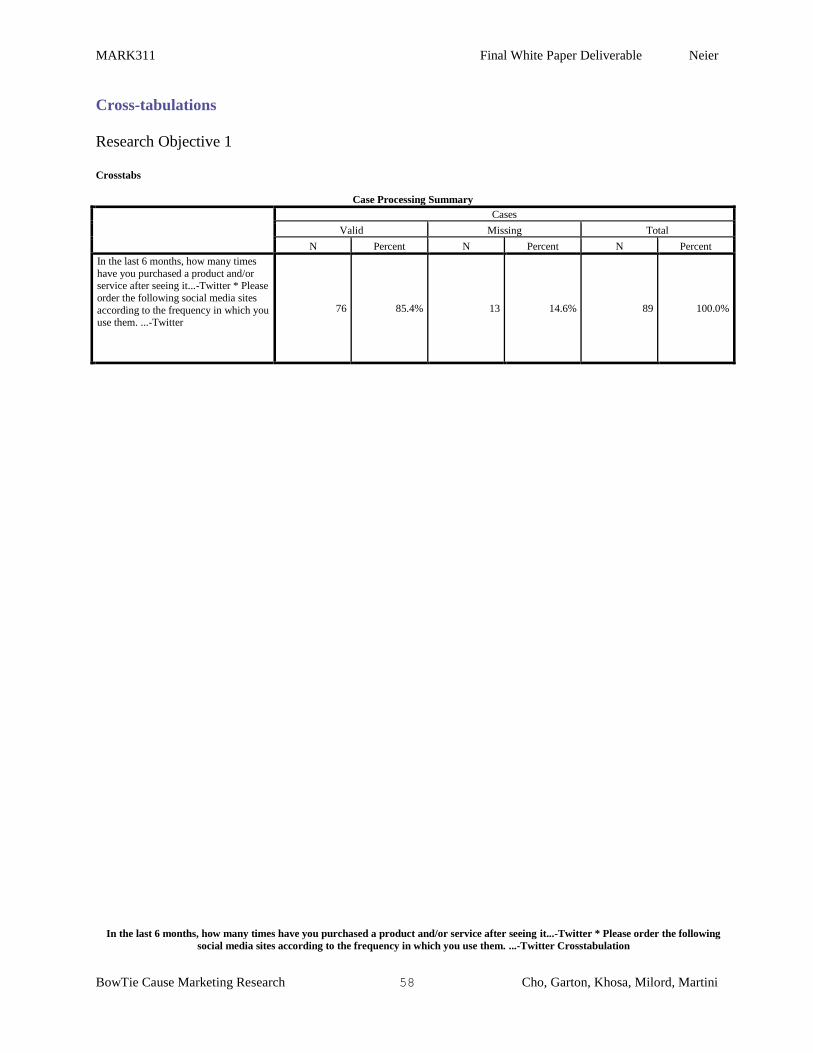
MARK311 Final White Paper Deliverable Neier
BowTie Cause Marketing Research 58 Cho, Garton, Khosa, Milord, Martini
Cross-tabulations
Research Objective 1
Crosstabs
Case Processing Summary
Cases
Valid Missing Total
N Percent N Percent N Percent
In the last 6 months, how many times
have you purchased a product and/or service after seeing it...-Twitter * Please
order the following social media sites
according to the frequency in which you use them. ...-Twitter
76 85.4% 13 14.6% 89 100.0%
In the last 6 months, how many times have you purchased a product and/or service after seeing it...-Twitter * Please order the following
social media sites according to the frequency in which you use them. ...-Twitter Crosstabulation
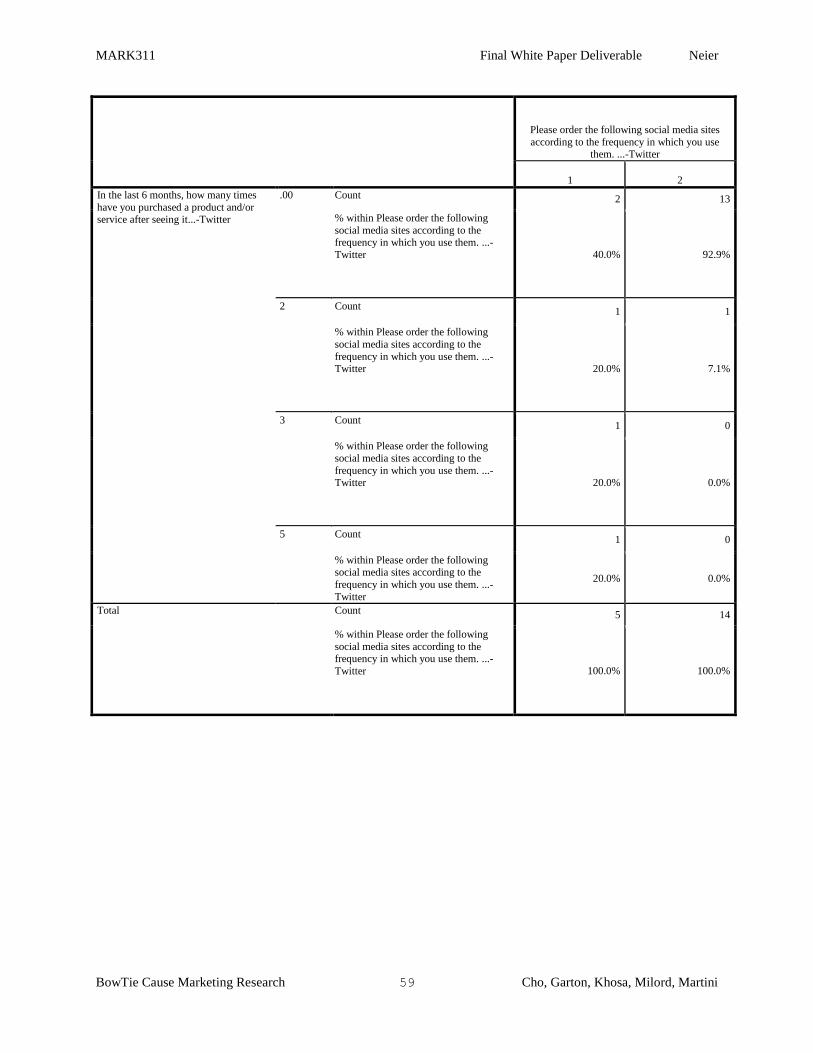
MARK311 Final White Paper Deliverable Neier
BowTie Cause Marketing Research 59 Cho, Garton, Khosa, Milord, Martini
Please order the following social media sites
according to the frequency in which you use them. ...-Twitter
1 2
In the last 6 months, how many times
have you purchased a product and/or service after seeing it...-Twitter
.00 Count 2 13
% within Please order the following
social media sites according to the frequency in which you use them. ...-
Twitter 40.0% 92.9%
2 Count 1 1
% within Please order the following
social media sites according to the
frequency in which you use them. ...-Twitter 20.0% 7.1%
3 Count 1 0
% within Please order the following
social media sites according to the
frequency in which you use them. ...-Twitter 20.0% 0.0%
5 Count 1 0
% within Please order the following
social media sites according to the
frequency in which you use them. ...-
20.0% 0.0%
Total Count 5 14
% within Please order the following
social media sites according to the frequency in which you use them. ...-
Twitter 100.0% 100.0%
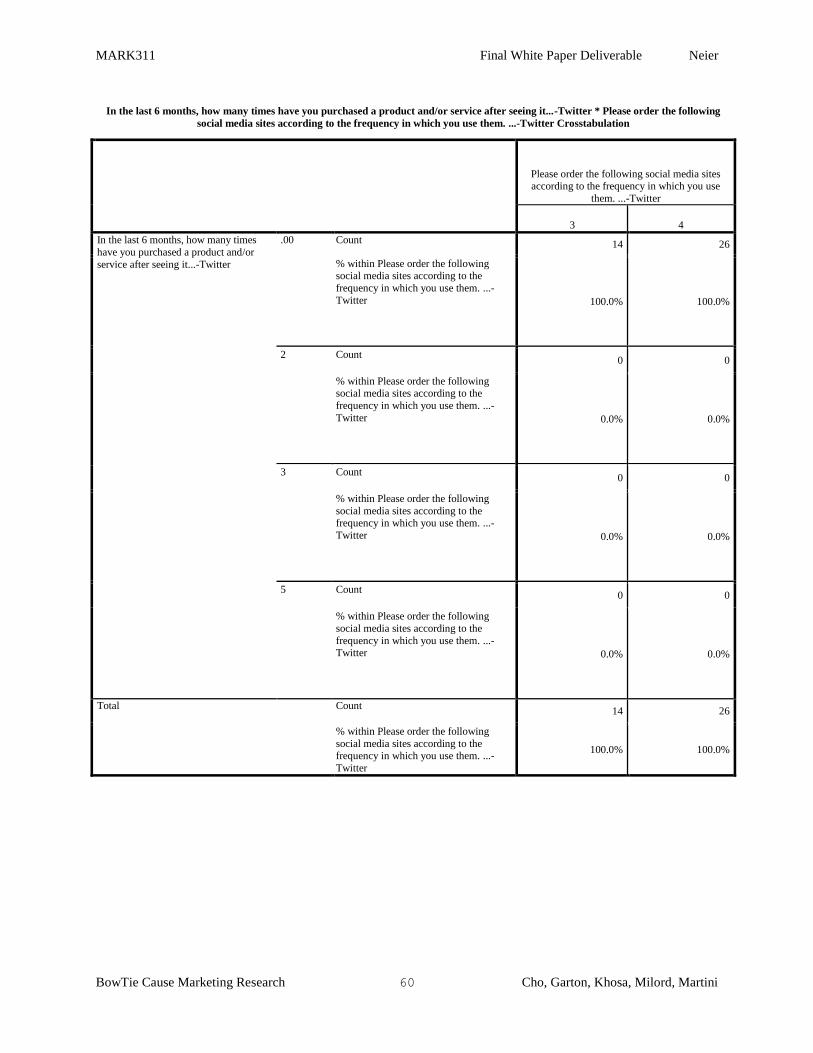
MARK311 Final White Paper Deliverable Neier
BowTie Cause Marketing Research 60 Cho, Garton, Khosa, Milord, Martini
In the last 6 months, how many times have you purchased a product and/or service after seeing it...-Twitter * Please order the following
social media sites according to the frequency in which you use them. ...-Twitter Crosstabulation
Please order the following social media sites according to the frequency in which you use
them. ...-Twitter
3 4
In the last 6 months, how many times
have you purchased a product and/or
service after seeing it...-Twitter
.00 Count 14 26
% within Please order the following social media sites according to the
frequency in which you use them. ...-
Twitter 100.0% 100.0%
2 Count 0 0
% within Please order the following social media sites according to the
frequency in which you use them. ...-
Twitter 0.0% 0.0%
3 Count 0 0
% within Please order the following
social media sites according to the frequency in which you use them. ...-
Twitter 0.0% 0.0%
5 Count 0 0
% within Please order the following
social media sites according to the
frequency in which you use them. ...-Twitter 0.0% 0.0%
Total Count 14 26
% within Please order the following
social media sites according to the frequency in which you use them. ...-
100.0% 100.0%
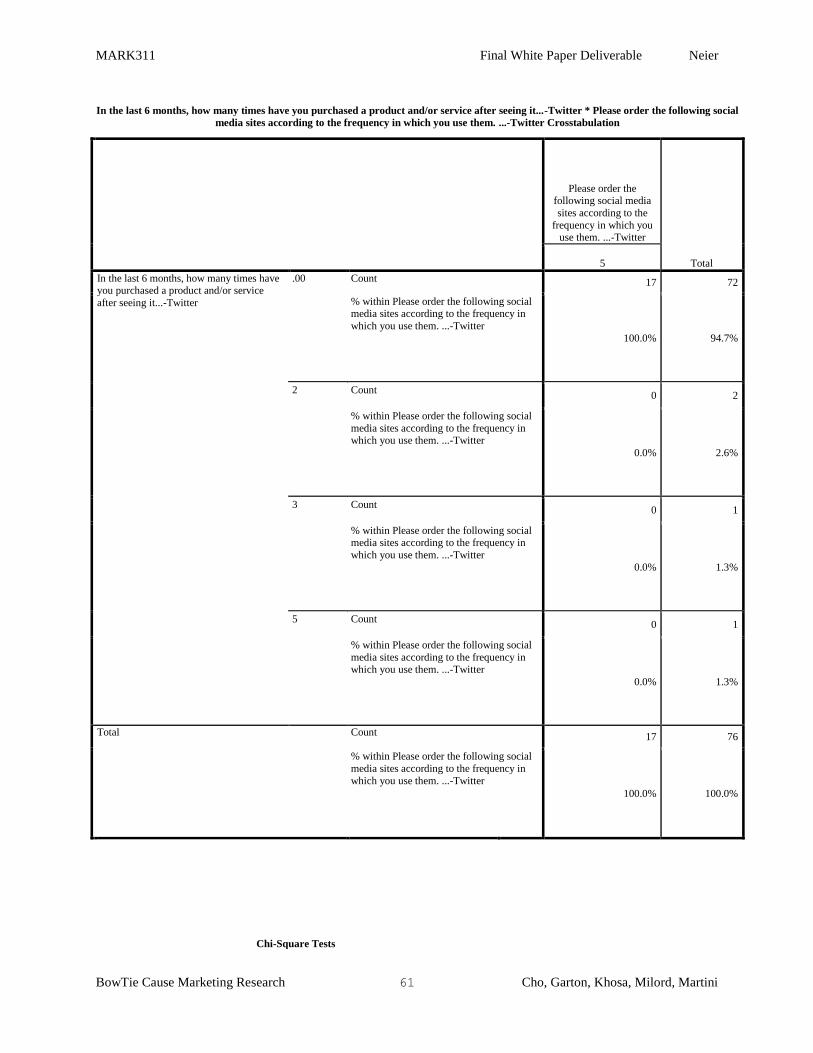
MARK311 Final White Paper Deliverable Neier
BowTie Cause Marketing Research 61 Cho, Garton, Khosa, Milord, Martini
In the last 6 months, how many times have you purchased a product and/or service after seeing it...-Twitter * Please order the following social
media sites according to the frequency in which you use them. ...-Twitter Crosstabulation
Please order the following social media
sites according to the
frequency in which you use them. ...-Twitter
Total 5
In the last 6 months, how many times have you purchased a product and/or service
after seeing it...-Twitter
.00 Count 17 72
% within Please order the following social media sites according to the frequency in
which you use them. ...-Twitter
100.0% 94.7%
2 Count 0 2
% within Please order the following social
media sites according to the frequency in which you use them. ...-Twitter
0.0% 2.6%
3 Count 0 1
% within Please order the following social media sites according to the frequency in
which you use them. ...-Twitter
0.0% 1.3%
5 Count 0 1
% within Please order the following social
media sites according to the frequency in which you use them. ...-Twitter
0.0% 1.3%
Total Count 17 76
% within Please order the following social
media sites according to the frequency in
which you use them. ...-Twitter
100.0% 100.0%
Chi-Square Tests
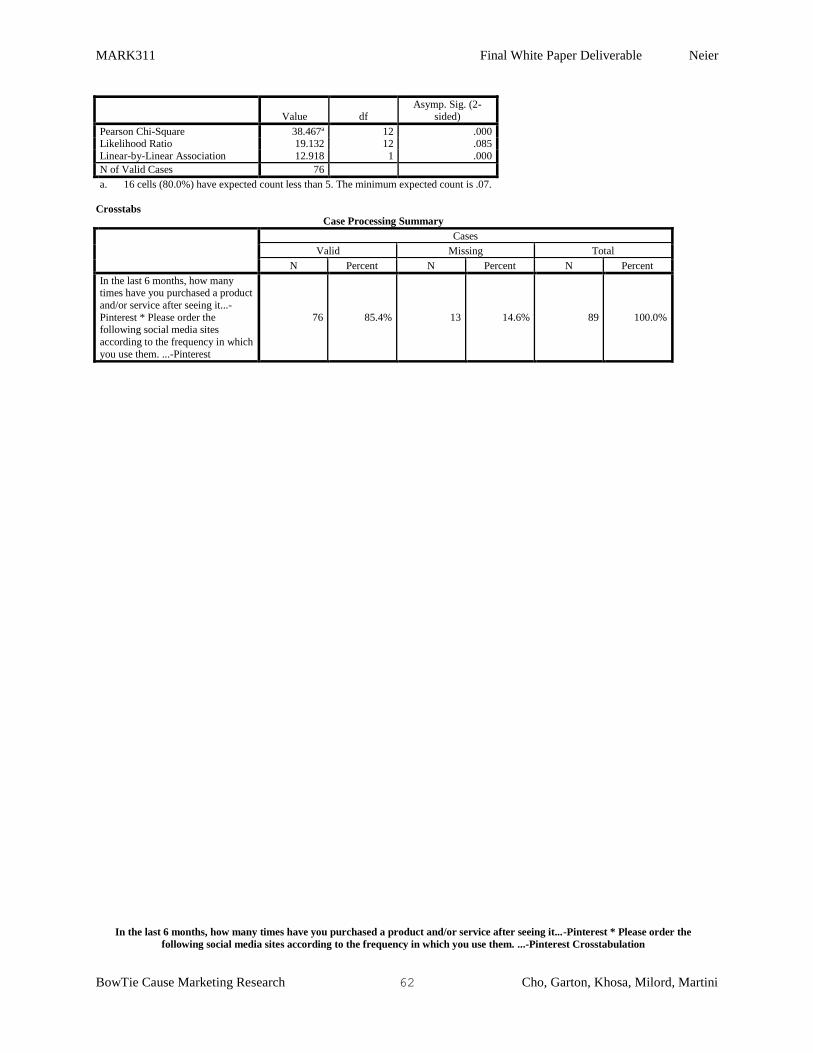
MARK311 Final White Paper Deliverable Neier
BowTie Cause Marketing Research 62 Cho, Garton, Khosa, Milord, Martini
Value df
Asymp. Sig. (2-
sided)
Pearson Chi-Square 38.467a 12 .000 Likelihood Ratio 19.132 12 .085
Linear-by-Linear Association 12.918 1 .000
N of Valid Cases 76
a. 16 cells (80.0%) have expected count less than 5. The minimum expected count is .07.
Crosstabs
Case Processing Summary
Cases
Valid Missing Total
N Percent N Percent N Percent
In the last 6 months, how many times have you purchased a product
and/or service after seeing it...-
Pinterest * Please order the following social media sites
according to the frequency in which
you use them. ...-Pinterest
76 85.4% 13 14.6% 89 100.0%
In the last 6 months, how many times have you purchased a product and/or service after seeing it...-Pinterest * Please order the
following social media sites according to the frequency in which you use them. ...-Pinterest Crosstabulation
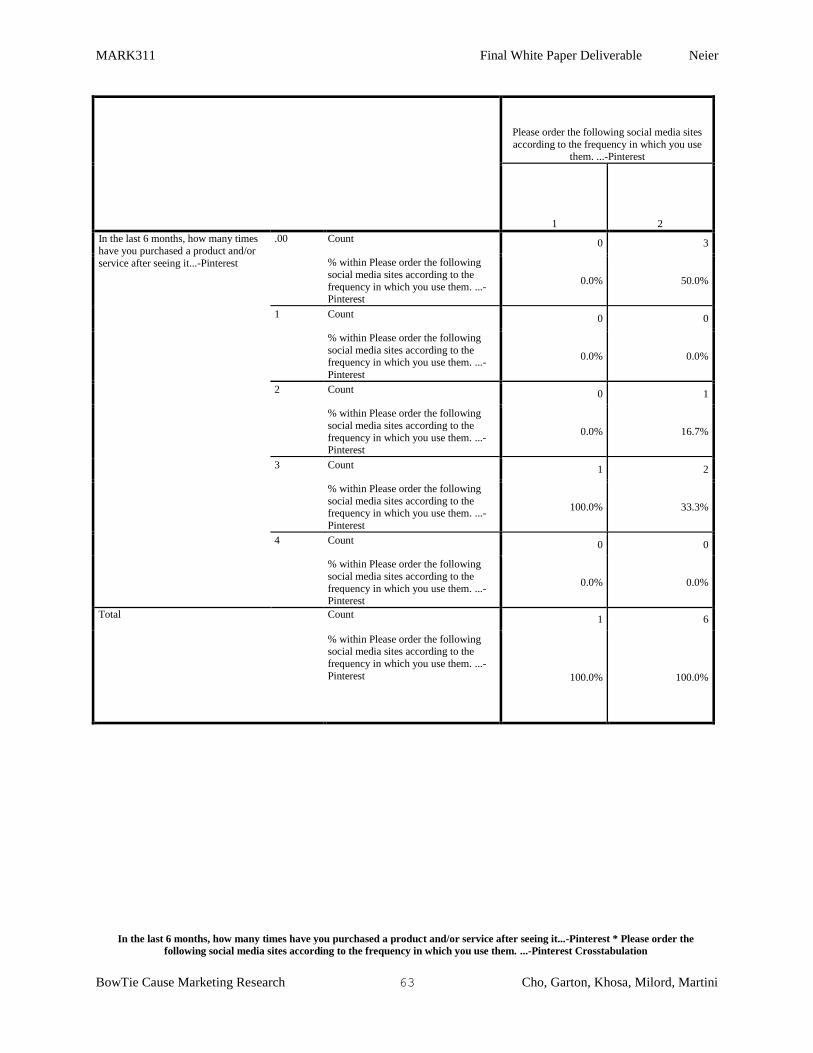
MARK311 Final White Paper Deliverable Neier
BowTie Cause Marketing Research 63 Cho, Garton, Khosa, Milord, Martini
Please order the following social media sites
according to the frequency in which you use them. ...-Pinterest
1 2
In the last 6 months, how many times
have you purchased a product and/or
service after seeing it...-Pinterest
.00 Count 0 3
% within Please order the following
social media sites according to the
frequency in which you use them. ...-Pinterest
0.0% 50.0%
1 Count 0 0
% within Please order the following
social media sites according to the frequency in which you use them. ...-
0.0% 0.0%
2 Count 0 1
% within Please order the following
social media sites according to the
frequency in which you use them. ...-Pinterest
0.0% 16.7%
3 Count 1 2
% within Please order the following
social media sites according to the frequency in which you use them. ...-
100.0% 33.3%
4 Count 0 0
% within Please order the following
social media sites according to the
frequency in which you use them. ...-Pinterest
0.0% 0.0%
Total Count 1 6
% within Please order the following social media sites according to the
frequency in which you use them. ...-
Pinterest 100.0% 100.0%
In the last 6 months, how many times have you purchased a product and/or service after seeing it...-Pinterest * Please order the
following social media sites according to the frequency in which you use them. ...-Pinterest Crosstabulation
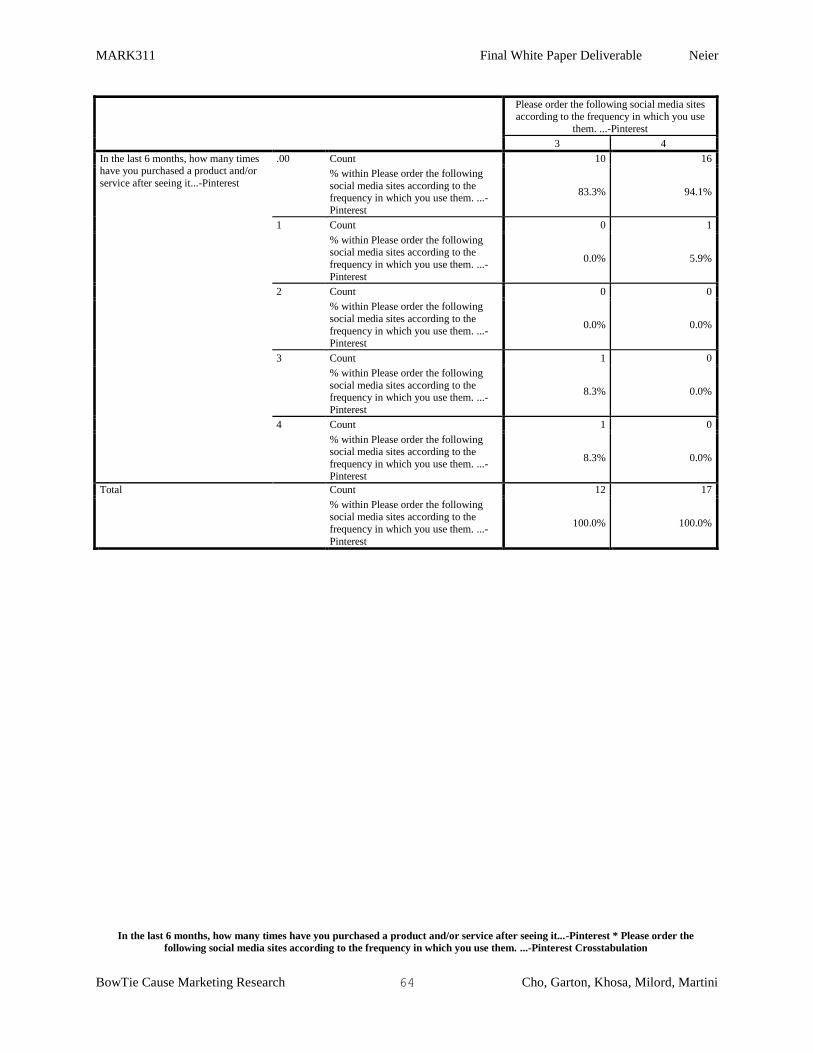
MARK311 Final White Paper Deliverable Neier
BowTie Cause Marketing Research 64 Cho, Garton, Khosa, Milord, Martini
Please order the following social media sites
according to the frequency in which you use
them. ...-Pinterest
3 4
In the last 6 months, how many times have you purchased a product and/or
service after seeing it...-Pinterest
.00 Count 10 16
% within Please order the following
social media sites according to the frequency in which you use them. ...-
83.3% 94.1%
1 Count 0 1
% within Please order the following social media sites according to the
frequency in which you use them. ...-
0.0% 5.9%
2 Count 0 0
% within Please order the following
social media sites according to the
frequency in which you use them. ...-
0.0% 0.0%
3 Count 1 0
% within Please order the following
social media sites according to the frequency in which you use them. ...-
8.3% 0.0%
4 Count 1 0
% within Please order the following social media sites according to the
frequency in which you use them. ...-Pinterest
8.3% 0.0%
Total Count 12 17
% within Please order the following social media sites according to the
frequency in which you use them. ...-
100.0% 100.0%
In the last 6 months, how many times have you purchased a product and/or service after seeing it...-Pinterest * Please order the
following social media sites according to the frequency in which you use them. ...-Pinterest Crosstabulation
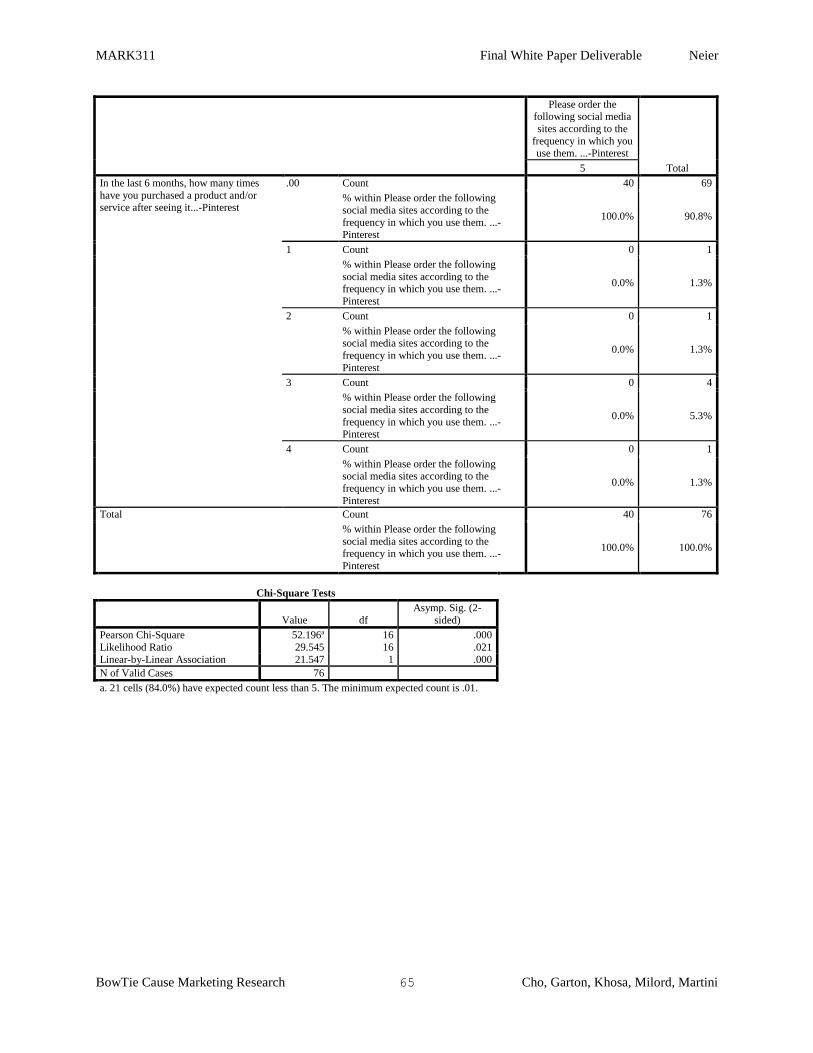
MARK311 Final White Paper Deliverable Neier
BowTie Cause Marketing Research 65 Cho, Garton, Khosa, Milord, Martini
Please order the
following social media
sites according to the
frequency in which you use them. ...-Pinterest
Total 5
In the last 6 months, how many times
have you purchased a product and/or service after seeing it...-Pinterest
.00 Count 40 69
% within Please order the following
social media sites according to the
frequency in which you use them. ...-Pinterest
100.0% 90.8%
1 Count 0 1
% within Please order the following
social media sites according to the frequency in which you use them. ...-
0.0% 1.3%
2 Count 0 1
% within Please order the following
social media sites according to the
frequency in which you use them. ...-
0.0% 1.3%
3 Count 0 4
% within Please order the following
social media sites according to the
frequency in which you use them. ...-Pinterest
0.0% 5.3%
4 Count 0 1
% within Please order the following social media sites according to the
frequency in which you use them. ...-
0.0% 1.3%
Total Count 40 76
% within Please order the following
social media sites according to the frequency in which you use them. ...-
100.0% 100.0%
Chi-Square Tests
Value df
Asymp. Sig. (2-
sided)
Pearson Chi-Square 52.196a 16 .000
Likelihood Ratio 29.545 16 .021
Linear-by-Linear Association 21.547 1 .000
N of Valid Cases 76
a. 21 cells (84.0%) have expected count less than 5. The minimum expected count is .01.
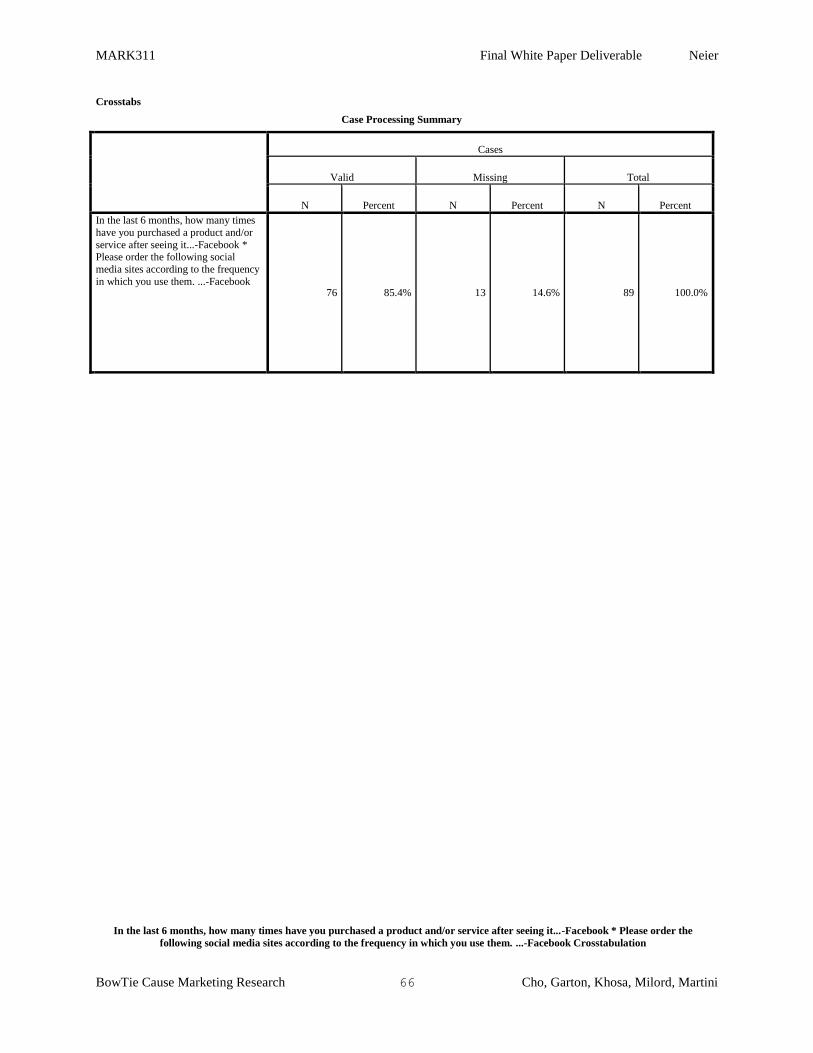
MARK311 Final White Paper Deliverable Neier
BowTie Cause Marketing Research 66 Cho, Garton, Khosa, Milord, Martini
Crosstabs
Case Processing Summary
Cases
Valid Missing Total
N Percent N Percent N Percent
In the last 6 months, how many times
have you purchased a product and/or
service after seeing it...-Facebook * Please order the following social
media sites according to the frequency
in which you use them. ...-Facebook 76 85.4% 13 14.6% 89 100.0%
In the last 6 months, how many times have you purchased a product and/or service after seeing it...-Facebook * Please order the
following social media sites according to the frequency in which you use them. ...-Facebook Crosstabulation

MARK311 Final White Paper Deliverable Neier
BowTie Cause Marketing Research 67 Cho, Garton, Khosa, Milord, Martini
Please order the following social media sites according to the
frequency in which you use them. ...-Facebook
Total 1 2 3 4
In the last 6 months, how
many times have you purchased a product
and/or service after seeing
it...-Facebook
.00 Count 42 5 2 2 51
% within Please order the
following social media
sites according to the frequency in which you
use them. ...-Facebook
68.9% 55.6% 50.0% 100.0% 67.1%
1 Count 10 1 1 0 12
% within Please order the following social media
sites according to the
frequency in which you use them. ...-Facebook
16.4% 11.1% 25.0% 0.0% 15.8%
2 Count 3 3 1 0 7
% within Please order the
following social media
sites according to the
frequency in which you
use them. ...-Facebook
4.9% 33.3% 25.0% 0.0% 9.2%
3 Count 2 0 0 0 2
% within Please order the
following social media
sites according to the frequency in which you
use them. ...-Facebook
3.3% 0.0% 0.0% 0.0% 2.6%
5 Count 1 0 0 0 1
% within Please order the
following social media
sites according to the frequency in which you
use them. ...-Facebook
1.6% 0.0% 0.0% 0.0% 1.3%
7 Count 1 0 0 0 1
% within Please order the following social media
sites according to the
frequency in which you use them. ...-Facebook
1.6% 0.0% 0.0% 0.0% 1.3%
10 Count 1 0 0 0 1
% within Please order the
following social media sites according to the
frequency in which you
use them. ...-Facebook
1.6% 0.0% 0.0% 0.0% 1.3%
12 Count 1 0 0 0 1
In the last 6 months, how many times have you purchased a product and/or service after seeing it...-Facebook * Please order the
following social media sites according to the frequency in which you use them. ...-Facebook Crosstabulation
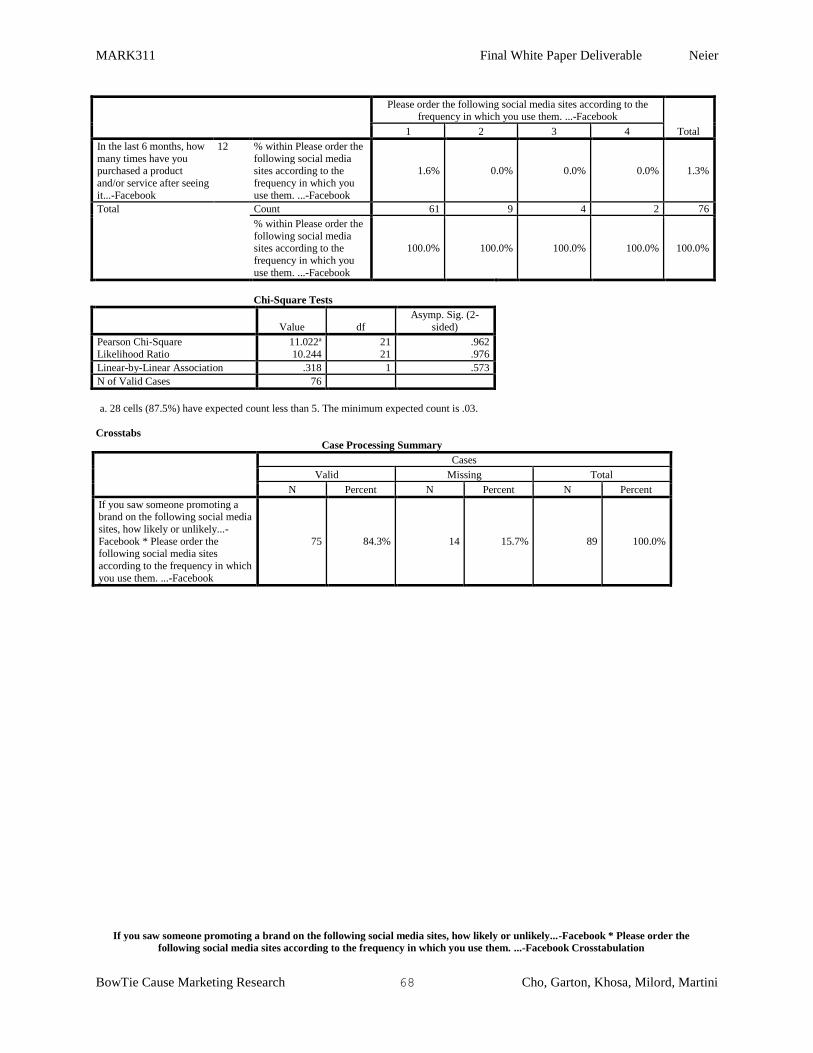
MARK311 Final White Paper Deliverable Neier
BowTie Cause Marketing Research 68 Cho, Garton, Khosa, Milord, Martini
Please order the following social media sites according to the
frequency in which you use them. ...-Facebook
Total 1 2 3 4
In the last 6 months, how
many times have you purchased a product
and/or service after seeing
it...-Facebook
12 % within Please order the
following social media sites according to the
frequency in which you
use them. ...-Facebook
1.6% 0.0% 0.0% 0.0% 1.3%
Total Count 61 9 4 2 76
% within Please order the
following social media sites according to the
frequency in which you
use them. ...-Facebook
100.0% 100.0% 100.0% 100.0% 100.0%
Chi-Square Tests
Value df
Asymp. Sig. (2-
sided)
Pearson Chi-Square 11.022a 21 .962
Likelihood Ratio 10.244 21 .976
Linear-by-Linear Association .318 1 .573
N of Valid Cases 76
a. 28 cells (87.5%) have expected count less than 5. The minimum expected count is .03.
Crosstabs
Case Processing Summary
Cases
Valid Missing Total
N Percent N Percent N Percent
If you saw someone promoting a brand on the following social media
sites, how likely or unlikely...-
Facebook * Please order the following social media sites
according to the frequency in which
you use them. ...-Facebook
75 84.3% 14 15.7% 89 100.0%
If you saw someone promoting a brand on the following social media sites, how likely or unlikely...-Facebook * Please order the
following social media sites according to the frequency in which you use them. ...-Facebook Crosstabulation
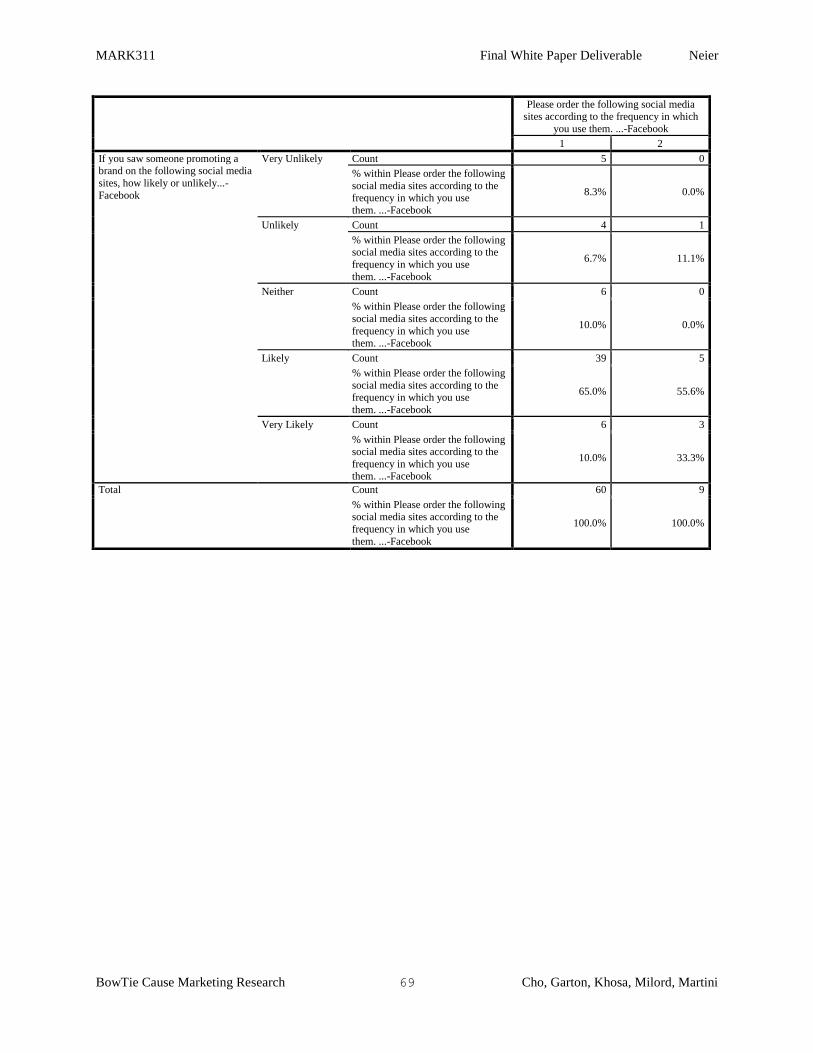
MARK311 Final White Paper Deliverable Neier
BowTie Cause Marketing Research 69 Cho, Garton, Khosa, Milord, Martini
Please order the following social media
sites according to the frequency in which
you use them. ...-Facebook
1 2
If you saw someone promoting a brand on the following social media
sites, how likely or unlikely...-
Very Unlikely Count 5 0
% within Please order the following
social media sites according to the frequency in which you use
them. ...-Facebook
8.3% 0.0%
Unlikely Count 4 1
% within Please order the following social media sites according to the
frequency in which you use
them. ...-Facebook
6.7% 11.1%
Neither Count 6 0
% within Please order the following
social media sites according to the
frequency in which you use
them. ...-Facebook
10.0% 0.0%
Likely Count 39 5
% within Please order the following
social media sites according to the frequency in which you use
them. ...-Facebook
65.0% 55.6%
Very Likely Count 6 3
% within Please order the following social media sites according to the
frequency in which you use them. ...-Facebook
10.0% 33.3%
Total Count 60 9
% within Please order the following social media sites according to the
frequency in which you use
them. ...-Facebook
100.0% 100.0%
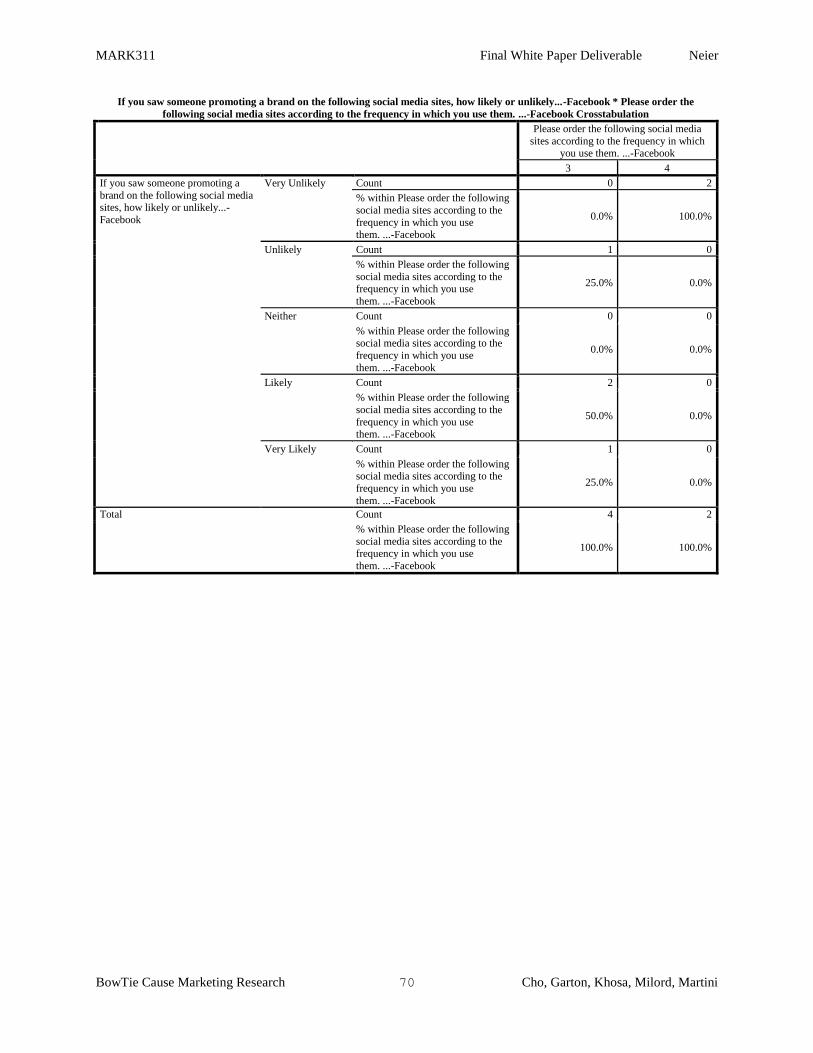
MARK311 Final White Paper Deliverable Neier
BowTie Cause Marketing Research 70 Cho, Garton, Khosa, Milord, Martini
If you saw someone promoting a brand on the following social media sites, how likely or unlikely...-Facebook * Please order the
following social media sites according to the frequency in which you use them. ...-Facebook Crosstabulation
Please order the following social media
sites according to the frequency in which you use them. ...-Facebook
3 4
If you saw someone promoting a
brand on the following social media sites, how likely or unlikely...-
Very Unlikely Count 0 2
% within Please order the following
social media sites according to the
frequency in which you use them. ...-Facebook
0.0% 100.0%
Unlikely Count 1 0
% within Please order the following
social media sites according to the frequency in which you use
them. ...-Facebook
25.0% 0.0%
Neither Count 0 0
% within Please order the following
social media sites according to the
frequency in which you use
them. ...-Facebook
0.0% 0.0%
Likely Count 2 0
% within Please order the following
social media sites according to the
frequency in which you use them. ...-Facebook
50.0% 0.0%
Very Likely Count 1 0
% within Please order the following social media sites according to the
frequency in which you use
them. ...-Facebook
25.0% 0.0%
Total Count 4 2
% within Please order the following
social media sites according to the frequency in which you use
them. ...-Facebook
100.0% 100.0%
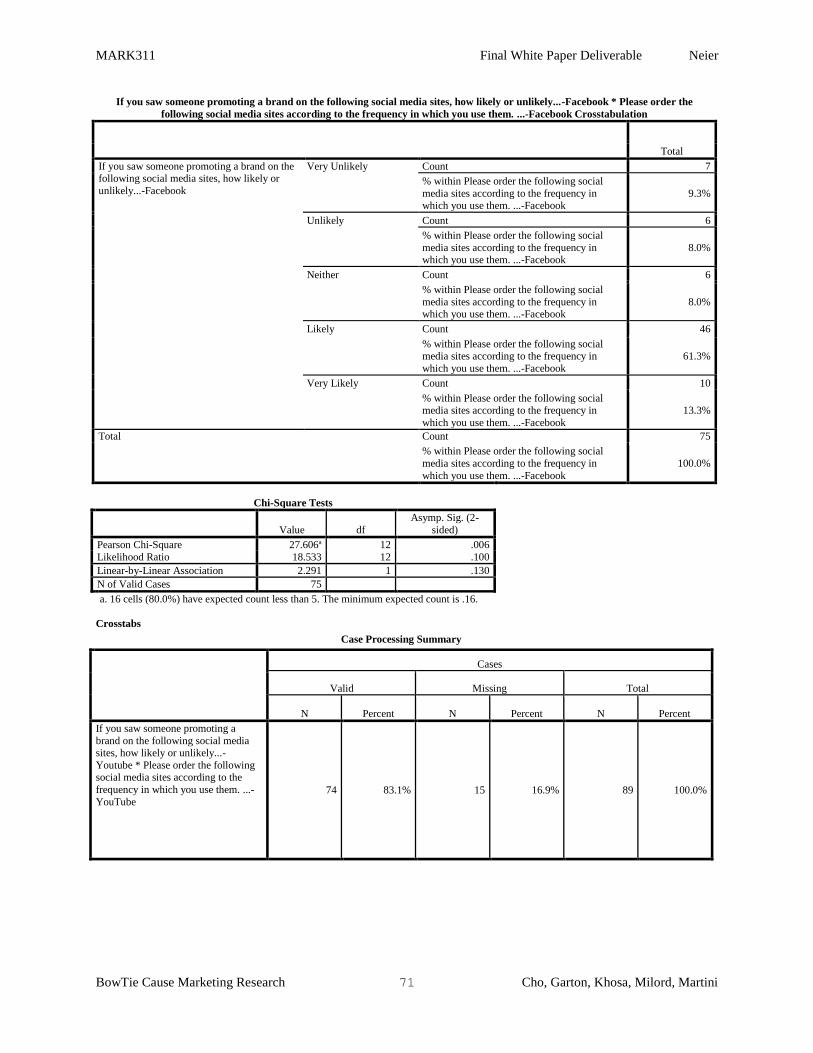
MARK311 Final White Paper Deliverable Neier
BowTie Cause Marketing Research 71 Cho, Garton, Khosa, Milord, Martini
If you saw someone promoting a brand on the following social media sites, how likely or unlikely...-Facebook * Please order the
following social media sites according to the frequency in which you use them. ...-Facebook Crosstabulation
Total
If you saw someone promoting a brand on the following social media sites, how likely or
unlikely...-Facebook
Very Unlikely Count 7
% within Please order the following social
media sites according to the frequency in which you use them. ...-Facebook
9.3%
Unlikely Count 6
% within Please order the following social
media sites according to the frequency in which you use them. ...-Facebook
8.0%
Neither Count 6
% within Please order the following social
media sites according to the frequency in which you use them. ...-Facebook
8.0%
Likely Count 46
% within Please order the following social media sites according to the frequency in
which you use them. ...-Facebook
61.3%
Very Likely Count 10
% within Please order the following social media sites according to the frequency in
which you use them. ...-Facebook
13.3%
Total Count 75
% within Please order the following social
media sites according to the frequency in
which you use them. ...-Facebook
100.0%
Chi-Square Tests
Value df
Asymp. Sig. (2-
sided)
Pearson Chi-Square 27.606a 12 .006
Likelihood Ratio 18.533 12 .100
Linear-by-Linear Association 2.291 1 .130
N of Valid Cases 75
a. 16 cells (80.0%) have expected count less than 5. The minimum expected count is .16.
Crosstabs
Case Processing Summary
Cases
Valid Missing Total
N Percent N Percent N Percent
If you saw someone promoting a
brand on the following social media sites, how likely or unlikely...-
Youtube * Please order the following social media sites according to the
frequency in which you use them. ...-
YouTube 74 83.1% 15 16.9% 89 100.0%
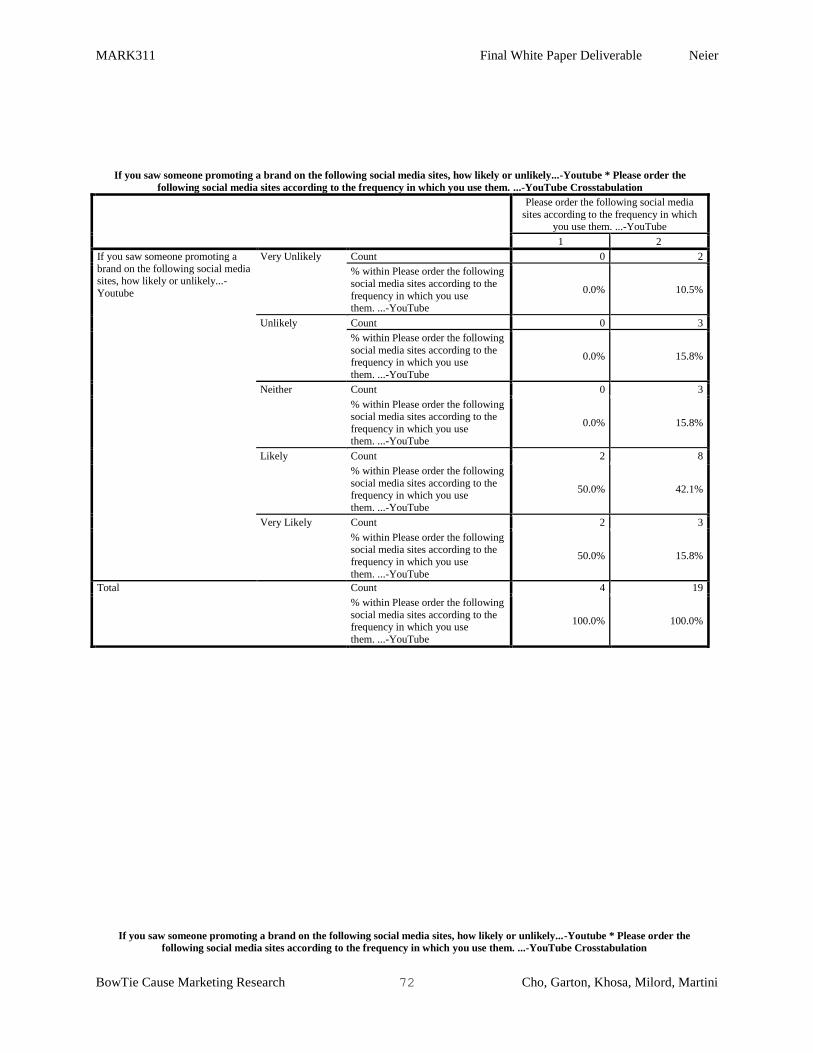
MARK311 Final White Paper Deliverable Neier
BowTie Cause Marketing Research 72 Cho, Garton, Khosa, Milord, Martini
If you saw someone promoting a brand on the following social media sites, how likely or unlikely...-Youtube * Please order the
following social media sites according to the frequency in which you use them. ...-YouTube Crosstabulation
Please order the following social media
sites according to the frequency in which you use them. ...-YouTube
1 2
If you saw someone promoting a
brand on the following social media sites, how likely or unlikely...-
Youtube
Very Unlikely Count 0 2
% within Please order the following
social media sites according to the
frequency in which you use them. ...-YouTube
0.0% 10.5%
Unlikely Count 0 3
% within Please order the following
social media sites according to the frequency in which you use
them. ...-YouTube
0.0% 15.8%
Neither Count 0 3
% within Please order the following social media sites according to the
frequency in which you use them. ...-YouTube
0.0% 15.8%
Likely Count 2 8
% within Please order the following
social media sites according to the frequency in which you use
them. ...-YouTube
50.0% 42.1%
Very Likely Count 2 3
% within Please order the following social media sites according to the
frequency in which you use
them. ...-YouTube
50.0% 15.8%
Total Count 4 19
% within Please order the following
social media sites according to the frequency in which you use
them. ...-YouTube
100.0% 100.0%
If you saw someone promoting a brand on the following social media sites, how likely or unlikely...-Youtube * Please order the
following social media sites according to the frequency in which you use them. ...-YouTube Crosstabulation
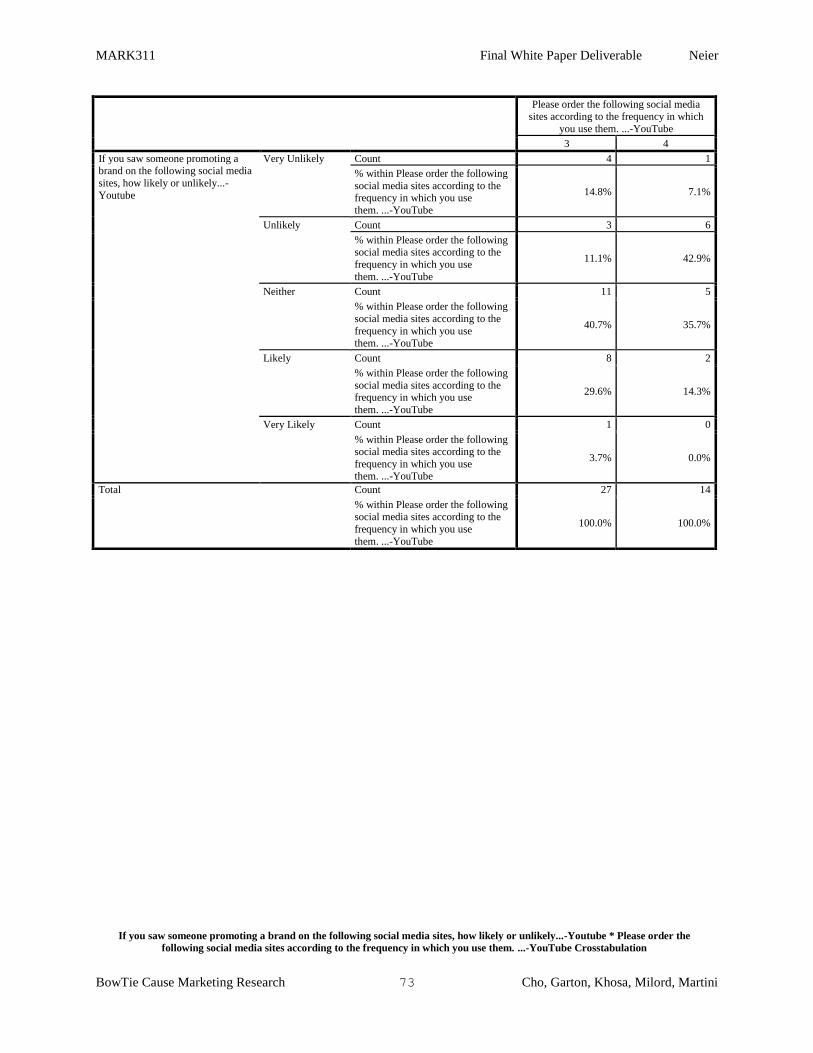
MARK311 Final White Paper Deliverable Neier
BowTie Cause Marketing Research 73 Cho, Garton, Khosa, Milord, Martini
Please order the following social media
sites according to the frequency in which
you use them. ...-YouTube
3 4
If you saw someone promoting a brand on the following social media
sites, how likely or unlikely...-
Youtube
Very Unlikely Count 4 1
% within Please order the following
social media sites according to the frequency in which you use
them. ...-YouTube
14.8% 7.1%
Unlikely Count 3 6
% within Please order the following social media sites according to the
frequency in which you use
them. ...-YouTube
11.1% 42.9%
Neither Count 11 5
% within Please order the following
social media sites according to the
frequency in which you use
them. ...-YouTube
40.7% 35.7%
Likely Count 8 2
% within Please order the following
social media sites according to the frequency in which you use
them. ...-YouTube
29.6% 14.3%
Very Likely Count 1 0
% within Please order the following social media sites according to the
frequency in which you use them. ...-YouTube
3.7% 0.0%
Total Count 27 14
% within Please order the following social media sites according to the
frequency in which you use
them. ...-YouTube
100.0% 100.0%
If you saw someone promoting a brand on the following social media sites, how likely or unlikely...-Youtube * Please order the
following social media sites according to the frequency in which you use them. ...-YouTube Crosstabulation
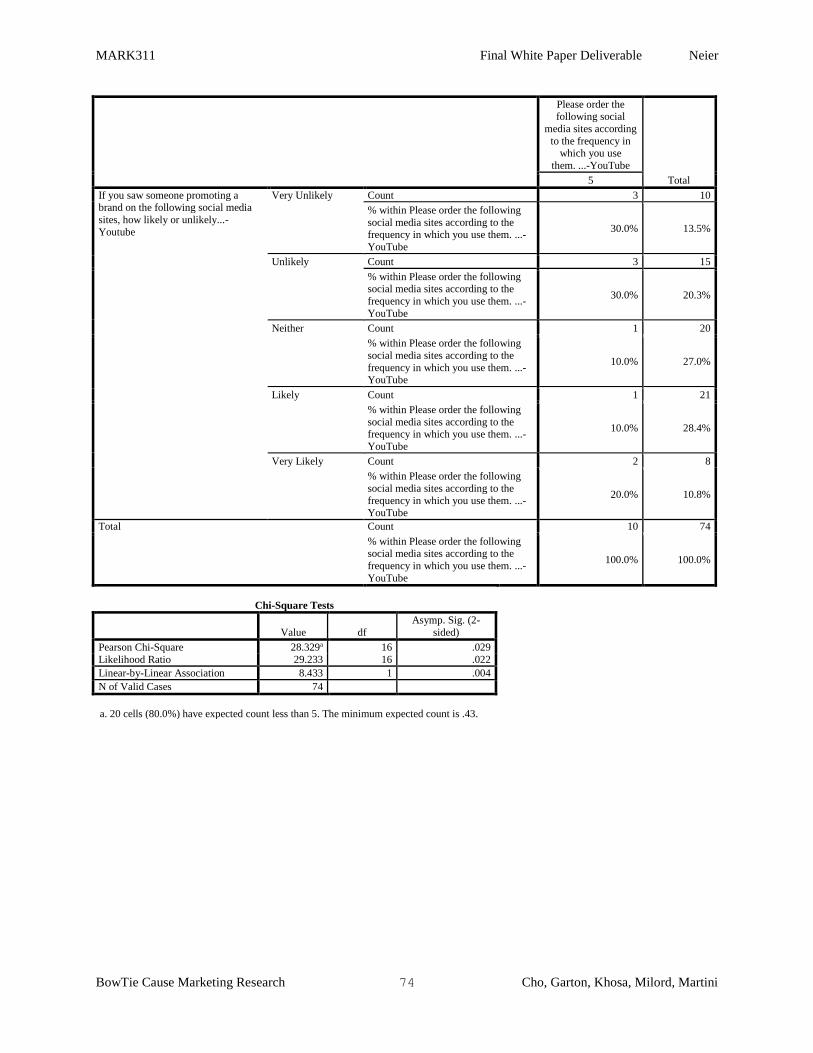
MARK311 Final White Paper Deliverable Neier
BowTie Cause Marketing Research 74 Cho, Garton, Khosa, Milord, Martini
Please order the
following social
media sites according
to the frequency in which you use
them. ...-YouTube
Total 5
If you saw someone promoting a brand on the following social media
sites, how likely or unlikely...-
Youtube
Very Unlikely Count 3 10
% within Please order the following
social media sites according to the frequency in which you use them. ...-
YouTube
30.0% 13.5%
Unlikely Count 3 15
% within Please order the following social media sites according to the
frequency in which you use them. ...-
YouTube
30.0% 20.3%
Neither Count 1 20
% within Please order the following
social media sites according to the
frequency in which you use them. ...-YouTube
10.0% 27.0%
Likely Count 1 21
% within Please order the following
social media sites according to the frequency in which you use them. ...-
YouTube
10.0% 28.4%
Very Likely Count 2 8
% within Please order the following
social media sites according to the
frequency in which you use them. ...-YouTube
20.0% 10.8%
Total Count 10 74
% within Please order the following social media sites according to the
frequency in which you use them. ...-
YouTube
100.0% 100.0%
Chi-Square Tests
Value df
Asymp. Sig. (2-
sided)
Pearson Chi-Square 28.329a 16 .029
Likelihood Ratio 29.233 16 .022
Linear-by-Linear Association 8.433 1 .004
N of Valid Cases 74
a. 20 cells (80.0%) have expected count less than 5. The minimum expected count is .43.
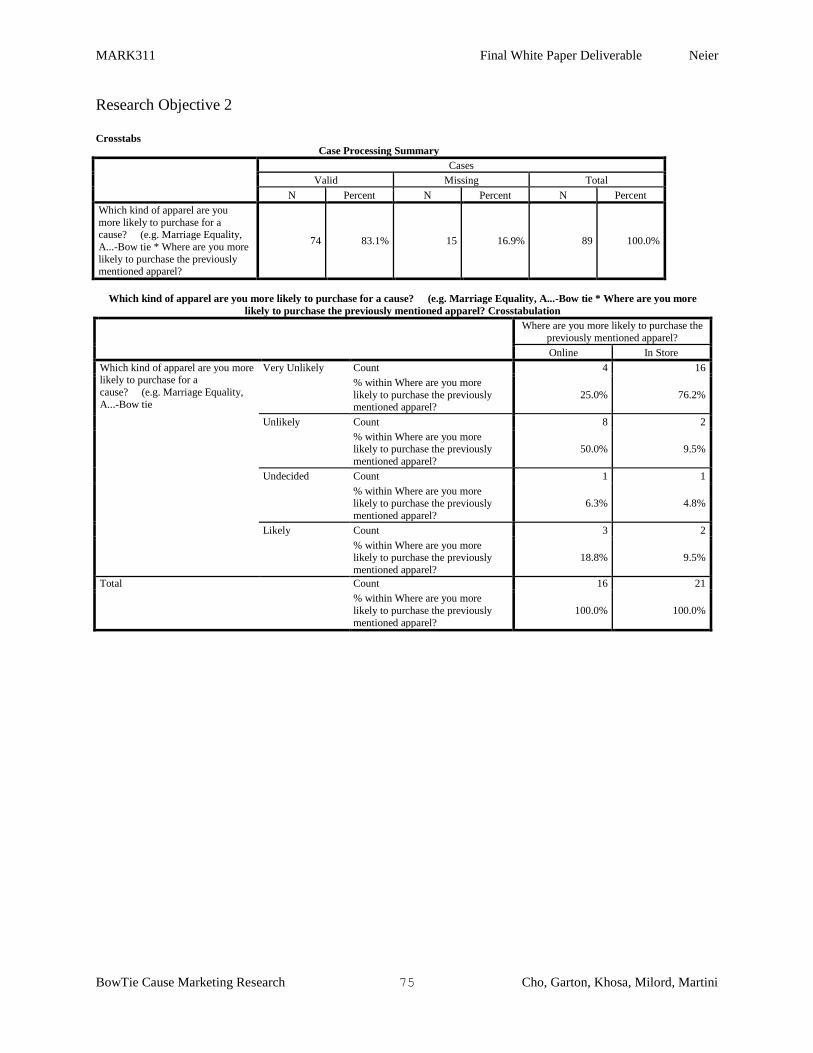
MARK311 Final White Paper Deliverable Neier
BowTie Cause Marketing Research 75 Cho, Garton, Khosa, Milord, Martini
Research Objective 2
Crosstabs
Case Processing Summary
Cases
Valid Missing Total
N Percent N Percent N Percent
Which kind of apparel are you
more likely to purchase for a cause? (e.g. Marriage Equality,
A...-Bow tie * Where are you more
likely to purchase the previously mentioned apparel?
74 83.1% 15 16.9% 89 100.0%
Which kind of apparel are you more likely to purchase for a cause? (e.g. Marriage Equality, A...-Bow tie * Where are you more
likely to purchase the previously mentioned apparel? Crosstabulation
Where are you more likely to purchase the
previously mentioned apparel?
Online In Store
Which kind of apparel are you more likely to purchase for a
cause? (e.g. Marriage Equality,
A...-Bow tie
Very Unlikely Count 4 16
% within Where are you more
likely to purchase the previously mentioned apparel?
25.0% 76.2%
Unlikely Count 8 2
% within Where are you more likely to purchase the previously
mentioned apparel?
50.0% 9.5%
Undecided Count 1 1
% within Where are you more likely to purchase the previously
mentioned apparel?
6.3% 4.8%
Likely Count 3 2
% within Where are you more likely to purchase the previously
mentioned apparel?
18.8% 9.5%
Total Count 16 21
% within Where are you more
likely to purchase the previously
mentioned apparel?
100.0% 100.0%
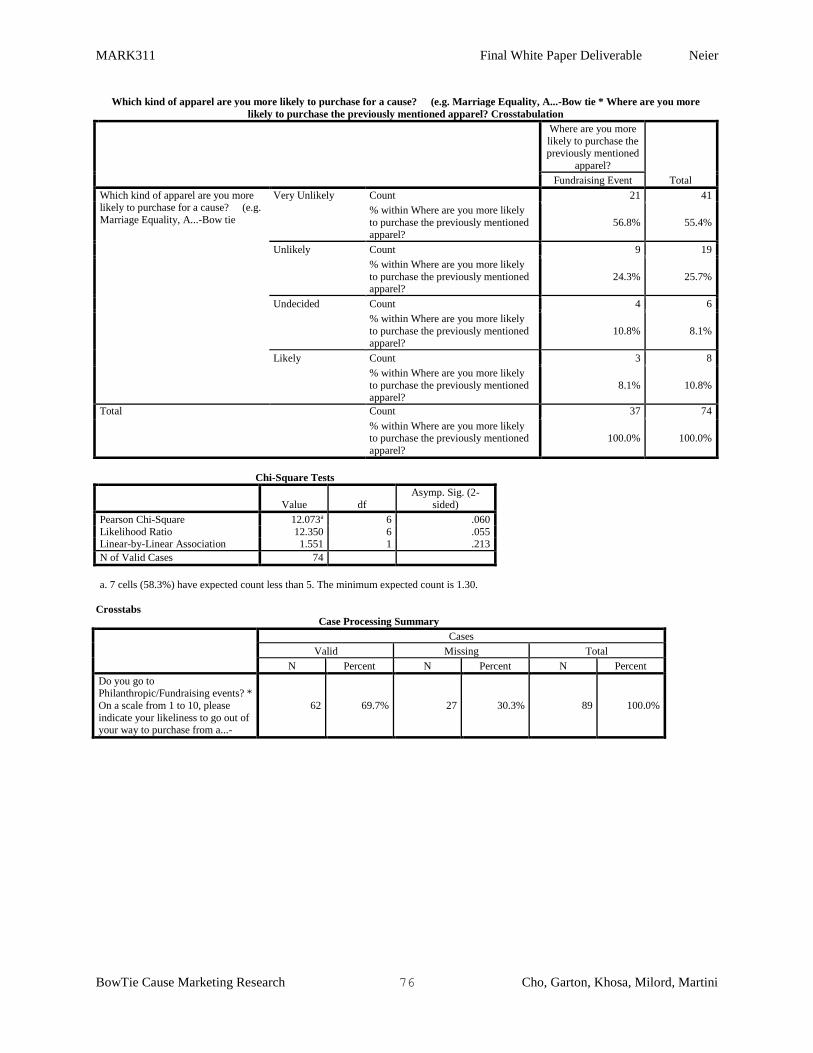
MARK311 Final White Paper Deliverable Neier
BowTie Cause Marketing Research 76 Cho, Garton, Khosa, Milord, Martini
Which kind of apparel are you more likely to purchase for a cause? (e.g. Marriage Equality, A...-Bow tie * Where are you more
likely to purchase the previously mentioned apparel? Crosstabulation
Where are you more
likely to purchase the previously mentioned
apparel?
Total Fundraising Event
Which kind of apparel are you more likely to purchase for a cause? (e.g.
Marriage Equality, A...-Bow tie
Very Unlikely Count 21 41
% within Where are you more likely
to purchase the previously mentioned apparel?
56.8% 55.4%
Unlikely Count 9 19
% within Where are you more likely
to purchase the previously mentioned apparel?
24.3% 25.7%
Undecided Count 4 6
% within Where are you more likely
to purchase the previously mentioned
apparel?
10.8% 8.1%
Likely Count 3 8
% within Where are you more likely
to purchase the previously mentioned apparel?
8.1% 10.8%
Total Count 37 74
% within Where are you more likely to purchase the previously mentioned
apparel?
100.0% 100.0%
Chi-Square Tests
Value df
Asymp. Sig. (2-
sided)
Pearson Chi-Square 12.073a 6 .060
Likelihood Ratio 12.350 6 .055 Linear-by-Linear Association 1.551 1 .213
N of Valid Cases 74
a. 7 cells (58.3%) have expected count less than 5. The minimum expected count is 1.30.
Crosstabs
Case Processing Summary
Cases
Valid Missing Total
N Percent N Percent N Percent
Do you go to Philanthropic/Fundraising events? *
On a scale from 1 to 10, please
indicate your likeliness to go out of your way to purchase from a...-
62 69.7% 27 30.3% 89 100.0%
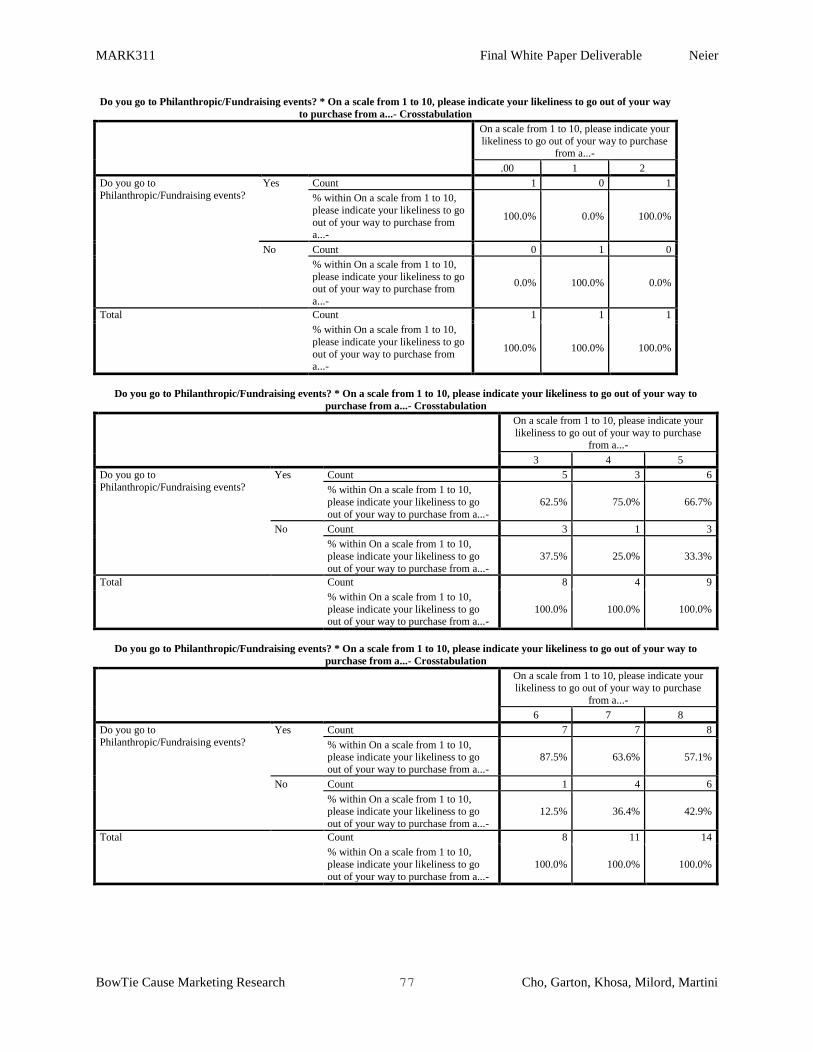
MARK311 Final White Paper Deliverable Neier
BowTie Cause Marketing Research 77 Cho, Garton, Khosa, Milord, Martini
Do you go to Philanthropic/Fundraising events? * On a scale from 1 to 10, please indicate your likeliness to go out of your way
to purchase from a...- Crosstabulation
On a scale from 1 to 10, please indicate your
likeliness to go out of your way to purchase from a...-
.00 1 2
Do you go to
Philanthropic/Fundraising events?
Yes Count 1 0 1
% within On a scale from 1 to 10,
please indicate your likeliness to go
out of your way to purchase from a...-
100.0% 0.0% 100.0%
No Count 0 1 0
% within On a scale from 1 to 10,
please indicate your likeliness to go out of your way to purchase from
a...-
0.0% 100.0% 0.0%
Total Count 1 1 1
% within On a scale from 1 to 10,
please indicate your likeliness to go
out of your way to purchase from a...-
100.0% 100.0% 100.0%
Do you go to Philanthropic/Fundraising events? * On a scale from 1 to 10, please indicate your likeliness to go out of your way to
purchase from a...- Crosstabulation
On a scale from 1 to 10, please indicate your
likeliness to go out of your way to purchase from a...-
3 4 5
Do you go to
Philanthropic/Fundraising events?
Yes Count 5 3 6
% within On a scale from 1 to 10,
please indicate your likeliness to go
out of your way to purchase from a...-
62.5% 75.0% 66.7%
No Count 3 1 3
% within On a scale from 1 to 10,
please indicate your likeliness to go
out of your way to purchase from a...-
37.5% 25.0% 33.3%
Total Count 8 4 9
% within On a scale from 1 to 10,
please indicate your likeliness to go out of your way to purchase from a...-
100.0% 100.0% 100.0%
Do you go to Philanthropic/Fundraising events? * On a scale from 1 to 10, please indicate your likeliness to go out of your way to
purchase from a...- Crosstabulation
On a scale from 1 to 10, please indicate your
likeliness to go out of your way to purchase
from a...-
6 7 8
Do you go to
Philanthropic/Fundraising events?
Yes Count 7 7 8
% within On a scale from 1 to 10, please indicate your likeliness to go
out of your way to purchase from a...-
87.5% 63.6% 57.1%
No Count 1 4 6
% within On a scale from 1 to 10,
please indicate your likeliness to go
out of your way to purchase from a...-
12.5% 36.4% 42.9%
Total Count 8 11 14
% within On a scale from 1 to 10,
please indicate your likeliness to go
out of your way to purchase from a...-
100.0% 100.0% 100.0%
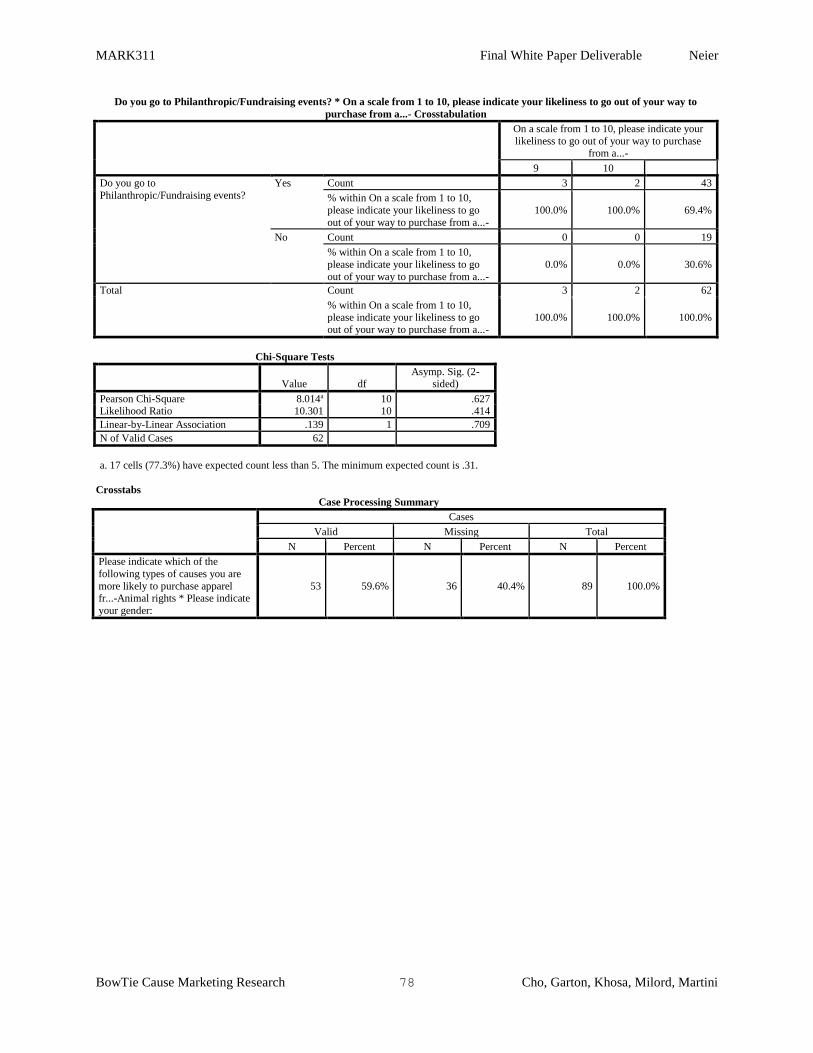
MARK311 Final White Paper Deliverable Neier
BowTie Cause Marketing Research 78 Cho, Garton, Khosa, Milord, Martini
Do you go to Philanthropic/Fundraising events? * On a scale from 1 to 10, please indicate your likeliness to go out of your way to
purchase from a...- Crosstabulation
On a scale from 1 to 10, please indicate your
likeliness to go out of your way to purchase from a...-
9 10
Do you go to
Philanthropic/Fundraising events?
Yes Count 3 2 43
% within On a scale from 1 to 10,
please indicate your likeliness to go
out of your way to purchase from a...-
100.0% 100.0% 69.4%
No Count 0 0 19
% within On a scale from 1 to 10,
please indicate your likeliness to go
out of your way to purchase from a...-
0.0% 0.0% 30.6%
Total Count 3 2 62
% within On a scale from 1 to 10,
please indicate your likeliness to go out of your way to purchase from a...-
100.0% 100.0% 100.0%
Chi-Square Tests
Value df Asymp. Sig. (2-
sided)
Pearson Chi-Square 8.014a 10 .627 Likelihood Ratio 10.301 10 .414
Linear-by-Linear Association .139 1 .709
N of Valid Cases 62
a. 17 cells (77.3%) have expected count less than 5. The minimum expected count is .31.
Crosstabs
Case Processing Summary
Cases
Valid Missing Total
N Percent N Percent N Percent
Please indicate which of the
following types of causes you are
more likely to purchase apparel fr...-Animal rights * Please indicate
your gender:
53 59.6% 36 40.4% 89 100.0%
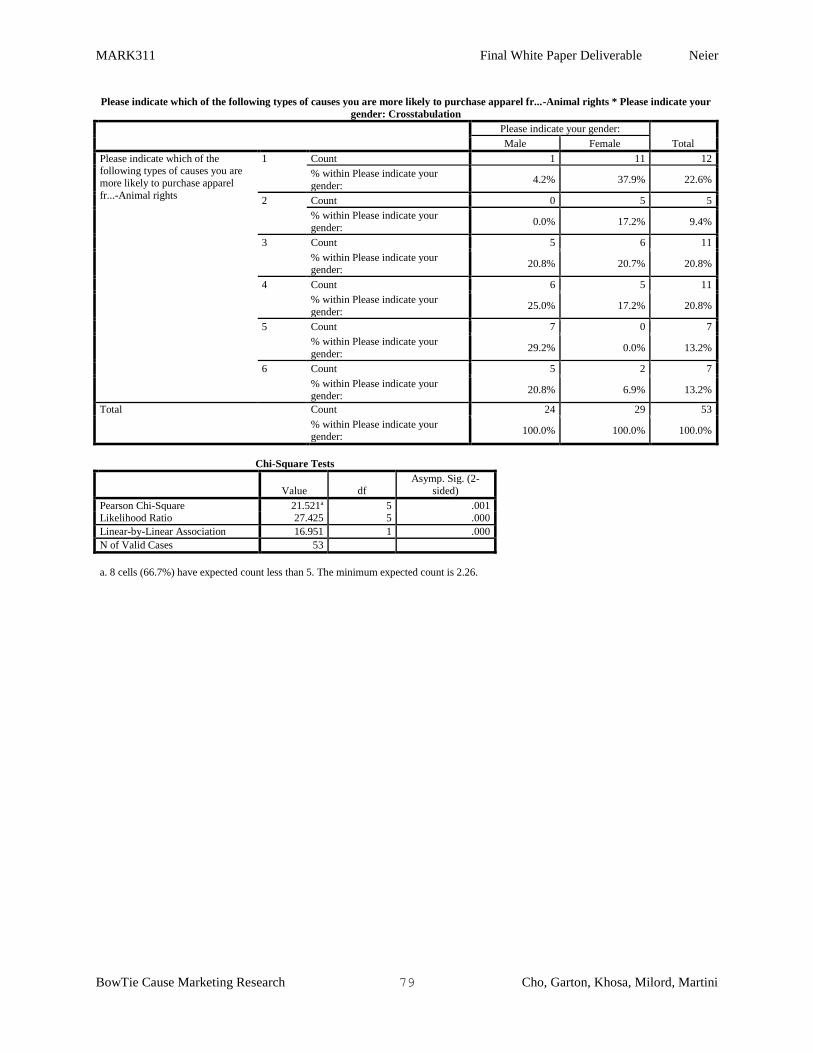
MARK311 Final White Paper Deliverable Neier
BowTie Cause Marketing Research 79 Cho, Garton, Khosa, Milord, Martini
Please indicate which of the following types of causes you are more likely to purchase apparel fr...-Animal rights * Please indicate your
gender: Crosstabulation
Please indicate your gender:
Total Male Female
Please indicate which of the following types of causes you are
more likely to purchase apparel
fr...-Animal rights
1 Count 1 11 12
% within Please indicate your
gender: 4.2% 37.9% 22.6%
2 Count 0 5 5
% within Please indicate your
gender: 0.0% 17.2% 9.4%
3 Count 5 6 11
% within Please indicate your gender:
20.8% 20.7% 20.8%
4 Count 6 5 11
% within Please indicate your
gender: 25.0% 17.2% 20.8%
5 Count 7 0 7
% within Please indicate your
gender: 29.2% 0.0% 13.2%
6 Count 5 2 7
% within Please indicate your gender:
20.8% 6.9% 13.2%
Total Count 24 29 53
% within Please indicate your gender:
100.0% 100.0% 100.0%
Chi-Square Tests
Value df
Asymp. Sig. (2-
sided)
Pearson Chi-Square 21.521a 5 .001
Likelihood Ratio 27.425 5 .000
Linear-by-Linear Association 16.951 1 .000
N of Valid Cases 53
a. 8 cells (66.7%) have expected count less than 5. The minimum expected count is 2.26.
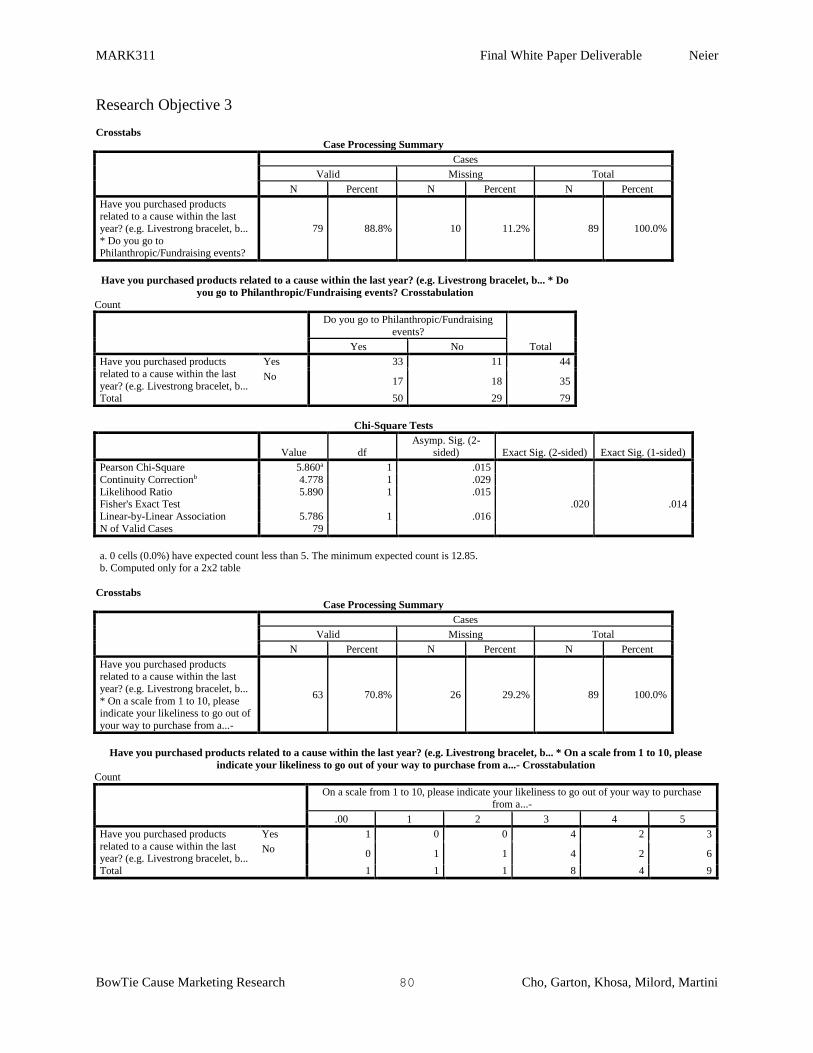
MARK311 Final White Paper Deliverable Neier
BowTie Cause Marketing Research 80 Cho, Garton, Khosa, Milord, Martini
Research Objective 3
Crosstabs
Case Processing Summary
Cases
Valid Missing Total
N Percent N Percent N Percent
Have you purchased products related to a cause within the last
year? (e.g. Livestrong bracelet, b...
* Do you go to Philanthropic/Fundraising events?
79 88.8% 10 11.2% 89 100.0%
Have you purchased products related to a cause within the last year? (e.g. Livestrong bracelet, b... * Do
you go to Philanthropic/Fundraising events? Crosstabulation Count
Do you go to Philanthropic/Fundraising
events?
Total Yes No
Have you purchased products
related to a cause within the last
year? (e.g. Livestrong bracelet, b...
Yes 33 11 44
No 17 18 35
Total 50 29 79
Chi-Square Tests
Value df Asymp. Sig. (2-
sided) Exact Sig. (2-sided) Exact Sig. (1-sided)
Pearson Chi-Square 5.860a 1 .015
Continuity Correctionb 4.778 1 .029
Likelihood Ratio 5.890 1 .015 Fisher's Exact Test .020 .014
Linear-by-Linear Association 5.786 1 .016
N of Valid Cases 79
a. 0 cells (0.0%) have expected count less than 5. The minimum expected count is 12.85. b. Computed only for a 2x2 table
Crosstabs Case Processing Summary
Cases
Valid Missing Total
N Percent N Percent N Percent
Have you purchased products related to a cause within the last
year? (e.g. Livestrong bracelet, b...
* On a scale from 1 to 10, please indicate your likeliness to go out of
your way to purchase from a...-
63 70.8% 26 29.2% 89 100.0%
Have you purchased products related to a cause within the last year? (e.g. Livestrong bracelet, b... * On a scale from 1 to 10, please
indicate your likeliness to go out of your way to purchase from a...- Crosstabulation Count
On a scale from 1 to 10, please indicate your likeliness to go out of your way to purchase
from a...-
.00 1 2 3 4 5
Have you purchased products
related to a cause within the last year? (e.g. Livestrong bracelet, b...
Yes 1 0 0 4 2 3
No 0 1 1 4 2 6
Total 1 1 1 8 4 9
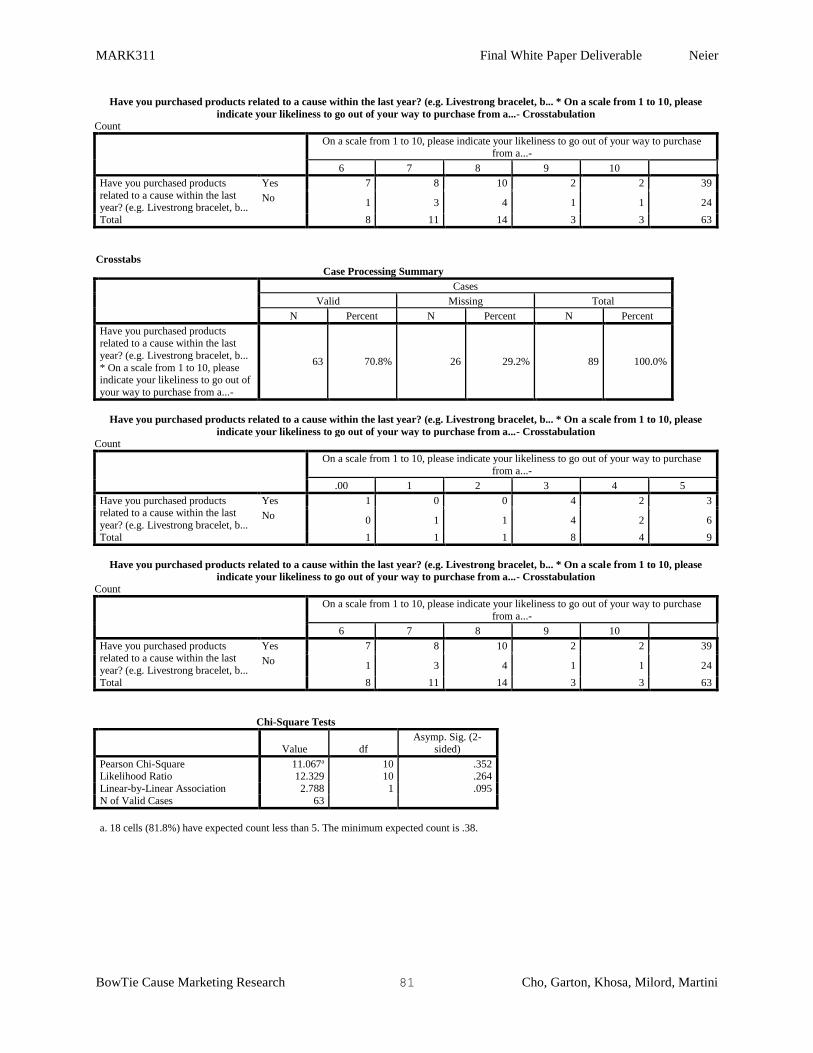
MARK311 Final White Paper Deliverable Neier
BowTie Cause Marketing Research 81 Cho, Garton, Khosa, Milord, Martini
Have you purchased products related to a cause within the last year? (e.g. Livestrong bracelet, b... * On a scale from 1 to 10, please
indicate your likeliness to go out of your way to purchase from a...- Crosstabulation Count
On a scale from 1 to 10, please indicate your likeliness to go out of your way to purchase from a...-
6 7 8 9 10
Have you purchased products
related to a cause within the last year? (e.g. Livestrong bracelet, b...
Yes 7 8 10 2 2 39
No 1 3 4 1 1 24
Total 8 11 14 3 3 63
Crosstabs
Case Processing Summary
Cases
Valid Missing Total
N Percent N Percent N Percent
Have you purchased products
related to a cause within the last
year? (e.g. Livestrong bracelet, b...
* On a scale from 1 to 10, please indicate your likeliness to go out of
your way to purchase from a...-
63 70.8% 26 29.2% 89 100.0%
Have you purchased products related to a cause within the last year? (e.g. Livestrong bracelet, b... * On a scale from 1 to 10, please
indicate your likeliness to go out of your way to purchase from a...- Crosstabulation Count
On a scale from 1 to 10, please indicate your likeliness to go out of your way to purchase
from a...-
.00 1 2 3 4 5
Have you purchased products related to a cause within the last
year? (e.g. Livestrong bracelet, b...
Yes 1 0 0 4 2 3
No 0 1 1 4 2 6
Total 1 1 1 8 4 9
Have you purchased products related to a cause within the last year? (e.g. Livestrong bracelet, b... * On a scale from 1 to 10, please
indicate your likeliness to go out of your way to purchase from a...- Crosstabulation Count
On a scale from 1 to 10, please indicate your likeliness to go out of your way to purchase
from a...-
6 7 8 9 10
Have you purchased products related to a cause within the last
year? (e.g. Livestrong bracelet, b...
Yes 7 8 10 2 2 39
No 1 3 4 1 1 24
Total 8 11 14 3 3 63
Chi-Square Tests
Value df Asymp. Sig. (2-
sided)
Pearson Chi-Square 11.067a 10 .352 Likelihood Ratio 12.329 10 .264
Linear-by-Linear Association 2.788 1 .095
N of Valid Cases 63
a. 18 cells (81.8%) have expected count less than 5. The minimum expected count is .38.
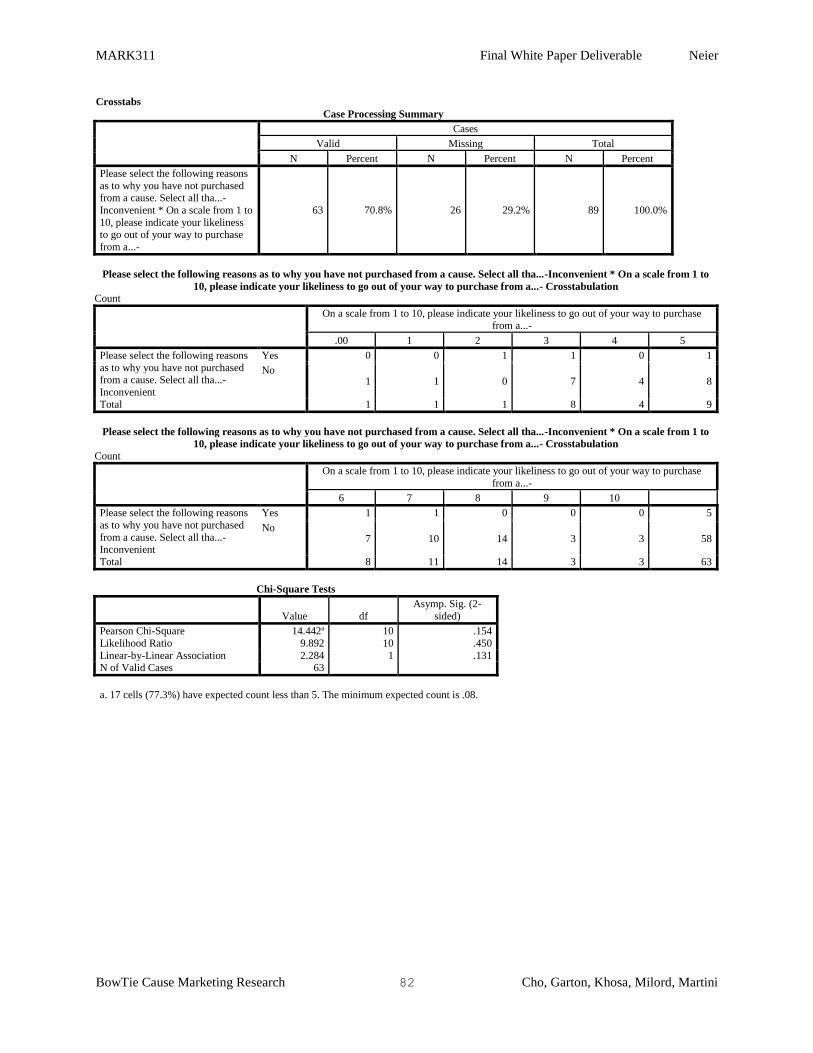
MARK311 Final White Paper Deliverable Neier
BowTie Cause Marketing Research 82 Cho, Garton, Khosa, Milord, Martini
Crosstabs
Case Processing Summary
Cases
Valid Missing Total
N Percent N Percent N Percent
Please select the following reasons
as to why you have not purchased from a cause. Select all tha...-
Inconvenient * On a scale from 1 to
10, please indicate your likeliness to go out of your way to purchase
from a...-
63 70.8% 26 29.2% 89 100.0%
Please select the following reasons as to why you have not purchased from a cause. Select all tha...-Inconvenient * On a scale from 1 to
10, please indicate your likeliness to go out of your way to purchase from a...- Crosstabulation Count
On a scale from 1 to 10, please indicate your likeliness to go out of your way to purchase from a...-
.00 1 2 3 4 5
Please select the following reasons
as to why you have not purchased from a cause. Select all tha...-
Inconvenient
Yes 0 0 1 1 0 1
No 1 1 0 7 4 8
Total 1 1 1 8 4 9
Please select the following reasons as to why you have not purchased from a cause. Select all tha...-Inconvenient * On a scale from 1 to
10, please indicate your likeliness to go out of your way to purchase from a...- Crosstabulation Count
On a scale from 1 to 10, please indicate your likeliness to go out of your way to purchase
from a...-
6 7 8 9 10
Please select the following reasons
as to why you have not purchased
from a cause. Select all tha...-Inconvenient
Yes 1 1 0 0 0 5
No 7 10 14 3 3 58
Total 8 11 14 3 3 63
Chi-Square Tests
Value df
Asymp. Sig. (2-
sided)
Pearson Chi-Square 14.442a 10 .154
Likelihood Ratio 9.892 10 .450
Linear-by-Linear Association 2.284 1 .131 N of Valid Cases 63
a. 17 cells (77.3%) have expected count less than 5. The minimum expected count is .08.
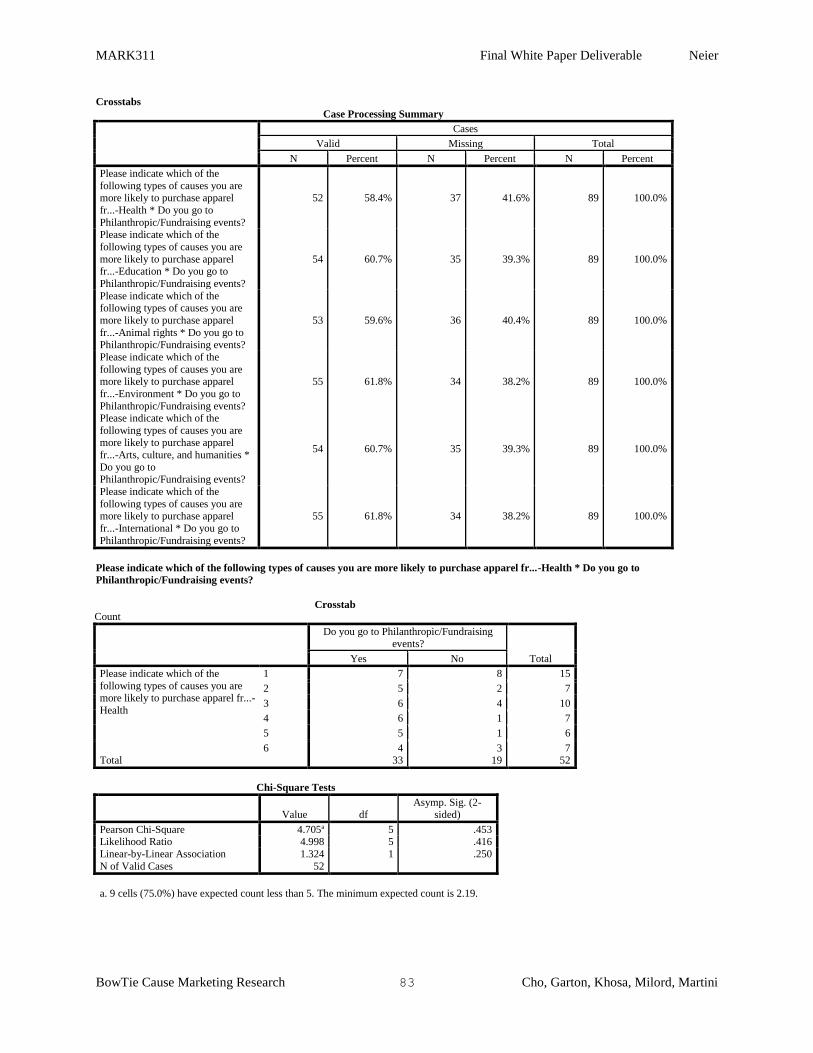
MARK311 Final White Paper Deliverable Neier
BowTie Cause Marketing Research 83 Cho, Garton, Khosa, Milord, Martini
Crosstabs
Case Processing Summary
Cases
Valid Missing Total
N Percent N Percent N Percent
Please indicate which of the
following types of causes you are more likely to purchase apparel
fr...-Health * Do you go to
Philanthropic/Fundraising events?
52 58.4% 37 41.6% 89 100.0%
Please indicate which of the
following types of causes you are
more likely to purchase apparel fr...-Education * Do you go to
Philanthropic/Fundraising events?
54 60.7% 35 39.3% 89 100.0%
Please indicate which of the following types of causes you are
more likely to purchase apparel
fr...-Animal rights * Do you go to
Philanthropic/Fundraising events?
53 59.6% 36 40.4% 89 100.0%
Please indicate which of the
following types of causes you are more likely to purchase apparel
fr...-Environment * Do you go to
Philanthropic/Fundraising events?
55 61.8% 34 38.2% 89 100.0%
Please indicate which of the
following types of causes you are more likely to purchase apparel
fr...-Arts, culture, and humanities *
Do you go to Philanthropic/Fundraising events?
54 60.7% 35 39.3% 89 100.0%
Please indicate which of the
following types of causes you are more likely to purchase apparel
fr...-International * Do you go to
Philanthropic/Fundraising events?
55 61.8% 34 38.2% 89 100.0%
Please indicate which of the following types of causes you are more likely to purchase apparel fr...-Health * Do you go to
Philanthropic/Fundraising events?
Crosstab Count
Do you go to Philanthropic/Fundraising events?
Total Yes No
Please indicate which of the
following types of causes you are more likely to purchase apparel fr...-
Health
1 7 8 15
2 5 2 7
3 6 4 10
4 6 1 7
5 5 1 6
6 4 3 7 Total 33 19 52
Chi-Square Tests
Value df Asymp. Sig. (2-
sided)
Pearson Chi-Square 4.705a 5 .453 Likelihood Ratio 4.998 5 .416
Linear-by-Linear Association 1.324 1 .250
N of Valid Cases 52
a. 9 cells (75.0%) have expected count less than 5. The minimum expected count is 2.19.
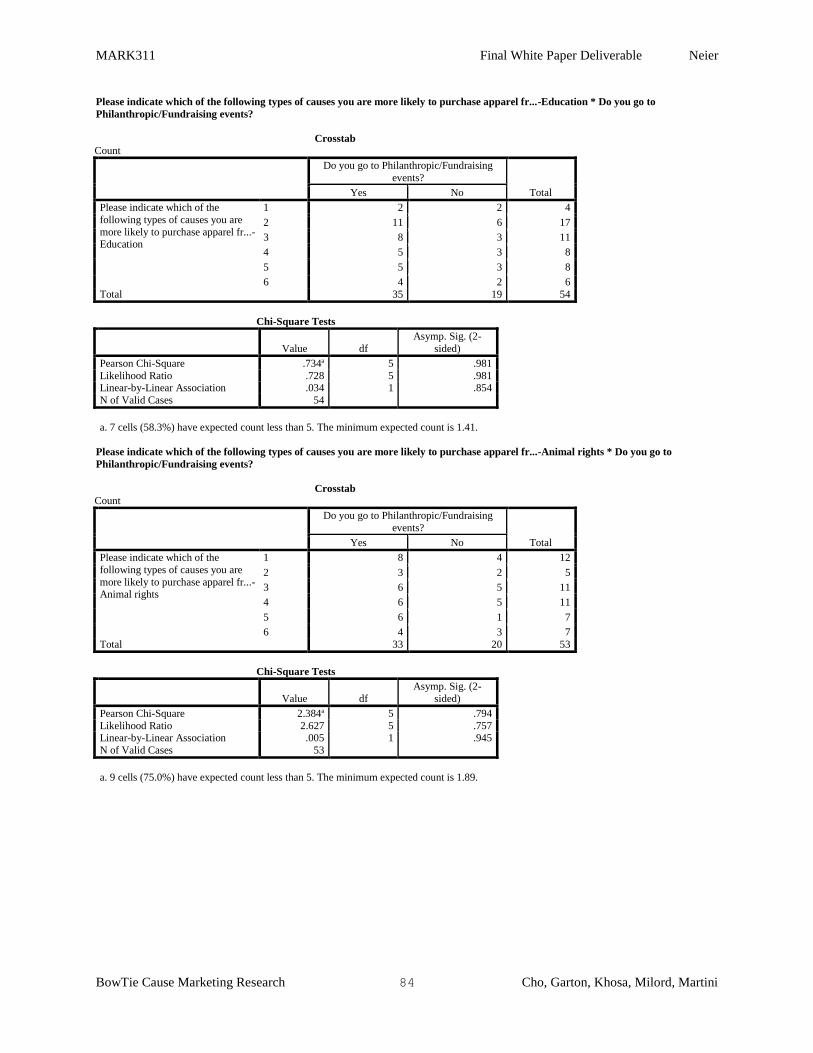
MARK311 Final White Paper Deliverable Neier
BowTie Cause Marketing Research 84 Cho, Garton, Khosa, Milord, Martini
Please indicate which of the following types of causes you are more likely to purchase apparel fr...-Education * Do you go to
Philanthropic/Fundraising events?
Crosstab Count
Do you go to Philanthropic/Fundraising
events?
Total Yes No
Please indicate which of the
following types of causes you are
more likely to purchase apparel fr...-Education
1 2 2 4
2 11 6 17
3 8 3 11
4 5 3 8
5 5 3 8
6 4 2 6
Total 35 19 54
Chi-Square Tests
Value df
Asymp. Sig. (2-
sided)
Pearson Chi-Square .734a 5 .981
Likelihood Ratio .728 5 .981 Linear-by-Linear Association .034 1 .854
N of Valid Cases 54
a. 7 cells (58.3%) have expected count less than 5. The minimum expected count is 1.41.
Please indicate which of the following types of causes you are more likely to purchase apparel fr...-Animal rights * Do you go to
Philanthropic/Fundraising events?
Crosstab Count
Do you go to Philanthropic/Fundraising
events?
Total Yes No
Please indicate which of the
following types of causes you are
more likely to purchase apparel fr...-Animal rights
1 8 4 12
2 3 2 5
3 6 5 11
4 6 5 11
5 6 1 7
6 4 3 7
Total 33 20 53
Chi-Square Tests
Value df
Asymp. Sig. (2-
sided)
Pearson Chi-Square 2.384a 5 .794
Likelihood Ratio 2.627 5 .757 Linear-by-Linear Association .005 1 .945
N of Valid Cases 53
a. 9 cells (75.0%) have expected count less than 5. The minimum expected count is 1.89.
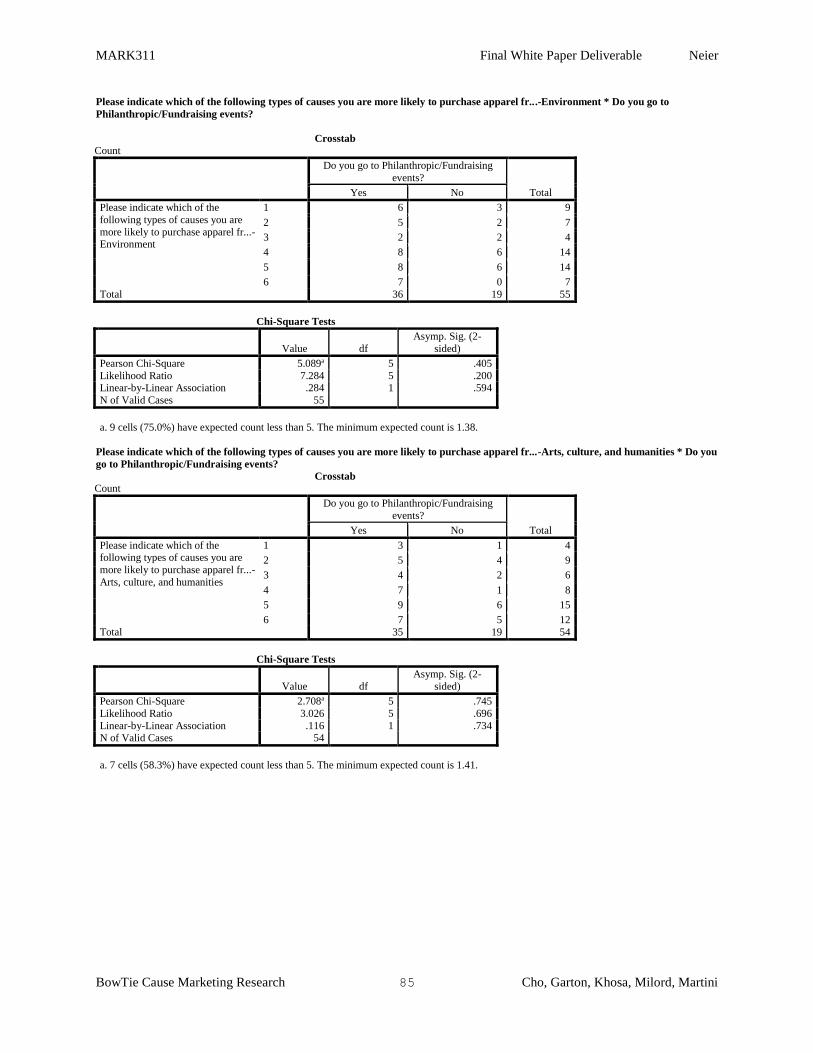
MARK311 Final White Paper Deliverable Neier
BowTie Cause Marketing Research 85 Cho, Garton, Khosa, Milord, Martini
Please indicate which of the following types of causes you are more likely to purchase apparel fr...-Environment * Do you go to
Philanthropic/Fundraising events?
Crosstab Count
Do you go to Philanthropic/Fundraising
events?
Total Yes No
Please indicate which of the
following types of causes you are
more likely to purchase apparel fr...-Environment
1 6 3 9
2 5 2 7
3 2 2 4
4 8 6 14
5 8 6 14
6 7 0 7
Total 36 19 55
Chi-Square Tests
Value df
Asymp. Sig. (2-
sided)
Pearson Chi-Square 5.089a 5 .405
Likelihood Ratio 7.284 5 .200 Linear-by-Linear Association .284 1 .594
N of Valid Cases 55
a. 9 cells (75.0%) have expected count less than 5. The minimum expected count is 1.38.
Please indicate which of the following types of causes you are more likely to purchase apparel fr...-Arts, culture, and humanities * Do you
go to Philanthropic/Fundraising events?
Crosstab Count
Do you go to Philanthropic/Fundraising
events?
Total Yes No
Please indicate which of the following types of causes you are
more likely to purchase apparel fr...-
Arts, culture, and humanities
1 3 1 4
2 5 4 9
3 4 2 6
4 7 1 8
5 9 6 15
6 7 5 12
Total 35 19 54
Chi-Square Tests
Value df
Asymp. Sig. (2-
sided)
Pearson Chi-Square 2.708a 5 .745
Likelihood Ratio 3.026 5 .696
Linear-by-Linear Association .116 1 .734 N of Valid Cases 54
a. 7 cells (58.3%) have expected count less than 5. The minimum expected count is 1.41.
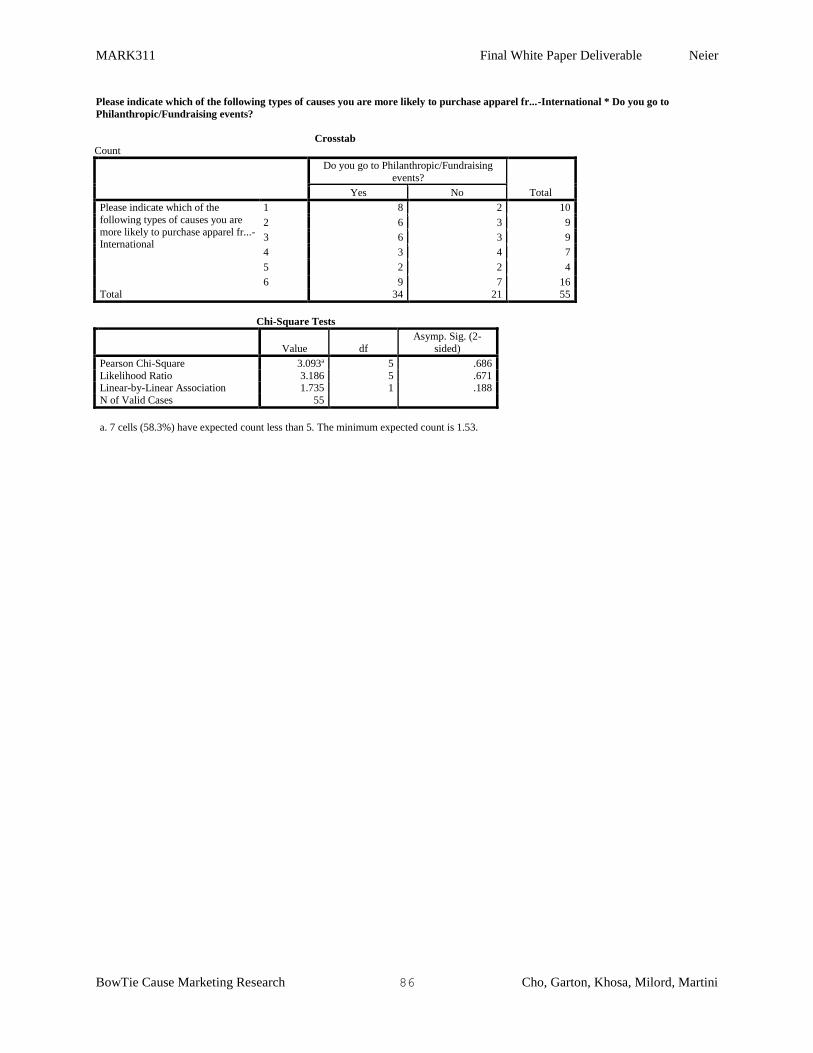
MARK311 Final White Paper Deliverable Neier
BowTie Cause Marketing Research 86 Cho, Garton, Khosa, Milord, Martini
Please indicate which of the following types of causes you are more likely to purchase apparel fr...-International * Do you go to
Philanthropic/Fundraising events?
Crosstab Count
Do you go to Philanthropic/Fundraising
events?
Total Yes No
Please indicate which of the
following types of causes you are
more likely to purchase apparel fr...-International
1 8 2 10
2 6 3 9
3 6 3 9
4 3 4 7
5 2 2 4
6 9 7 16
Total 34 21 55
Chi-Square Tests
Value df
Asymp. Sig. (2-
sided)
Pearson Chi-Square 3.093a 5 .686
Likelihood Ratio 3.186 5 .671 Linear-by-Linear Association 1.735 1 .188
N of Valid Cases 55
a. 7 cells (58.3%) have expected count less than 5. The minimum expected count is 1.53.

MARK311 Final White Paper Deliverable Neier
BowTie Cause Marketing Research 87 Cho, Garton, Khosa, Milord, Martini
Research Objective 4
Crosstab
On a scale from 1 to 10, please indicate your
likeliness to go out of your way to purchase from a...-
4.00 5.00 6.00
When you go to philanthropic events,
on average how far do you/are you
willing to travel from you...
17 Count 1 1 1
% within On a scale from 1 to 10,
please indicate your likeliness to go
out of your way to purchase from a...- 33.3% 16.7% 14.3%
18 Count 0 4 4
% within On a scale from 1 to 10,
please indicate your likeliness to go
out of your way to purchase from a...- 0.0% 66.7% 57.1%
19 Count 0 1 0
% within On a scale from 1 to 10,
please indicate your likeliness to go out of your way to purchase from a...-
0.0% 16.7% 0.0%
20 Count 0 0 0
% within On a scale from 1 to 10,
please indicate your likeliness to go out of your way to purchase from a...-
0.0% 0.0% 0.0%
21 Count 2 0 2
% within On a scale from 1 to 10,
please indicate your likeliness to go
out of your way to purchase from a...- 66.7% 0.0% 28.6%
Total Count 3 6 7
% within On a scale from 1 to 10,
please indicate your likeliness to go
out of your way to purchase from a...- 100.0% 100.0% 100.0%
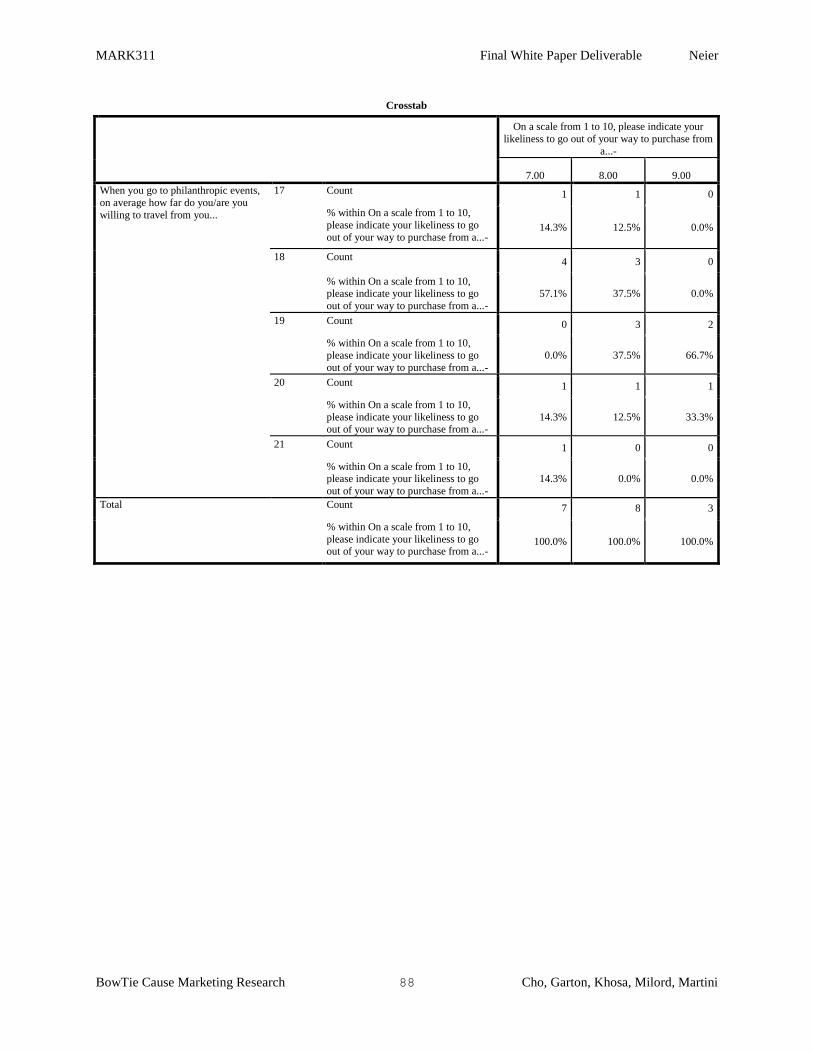
MARK311 Final White Paper Deliverable Neier
BowTie Cause Marketing Research 88 Cho, Garton, Khosa, Milord, Martini
Crosstab
On a scale from 1 to 10, please indicate your
likeliness to go out of your way to purchase from
a...-
7.00 8.00 9.00
When you go to philanthropic events,
on average how far do you/are you
willing to travel from you...
17 Count 1 1 0
% within On a scale from 1 to 10,
please indicate your likeliness to go
out of your way to purchase from a...- 14.3% 12.5% 0.0%
18 Count 4 3 0
% within On a scale from 1 to 10, please indicate your likeliness to go
out of your way to purchase from a...-
57.1% 37.5% 0.0%
19 Count 0 3 2
% within On a scale from 1 to 10,
please indicate your likeliness to go
out of your way to purchase from a...-
0.0% 37.5% 66.7%
20 Count 1 1 1
% within On a scale from 1 to 10,
please indicate your likeliness to go out of your way to purchase from a...-
14.3% 12.5% 33.3%
21 Count 1 0 0
% within On a scale from 1 to 10, please indicate your likeliness to go
out of your way to purchase from a...-
14.3% 0.0% 0.0%
Total Count 7 8 3
% within On a scale from 1 to 10,
please indicate your likeliness to go out of your way to purchase from a...-
100.0% 100.0% 100.0%
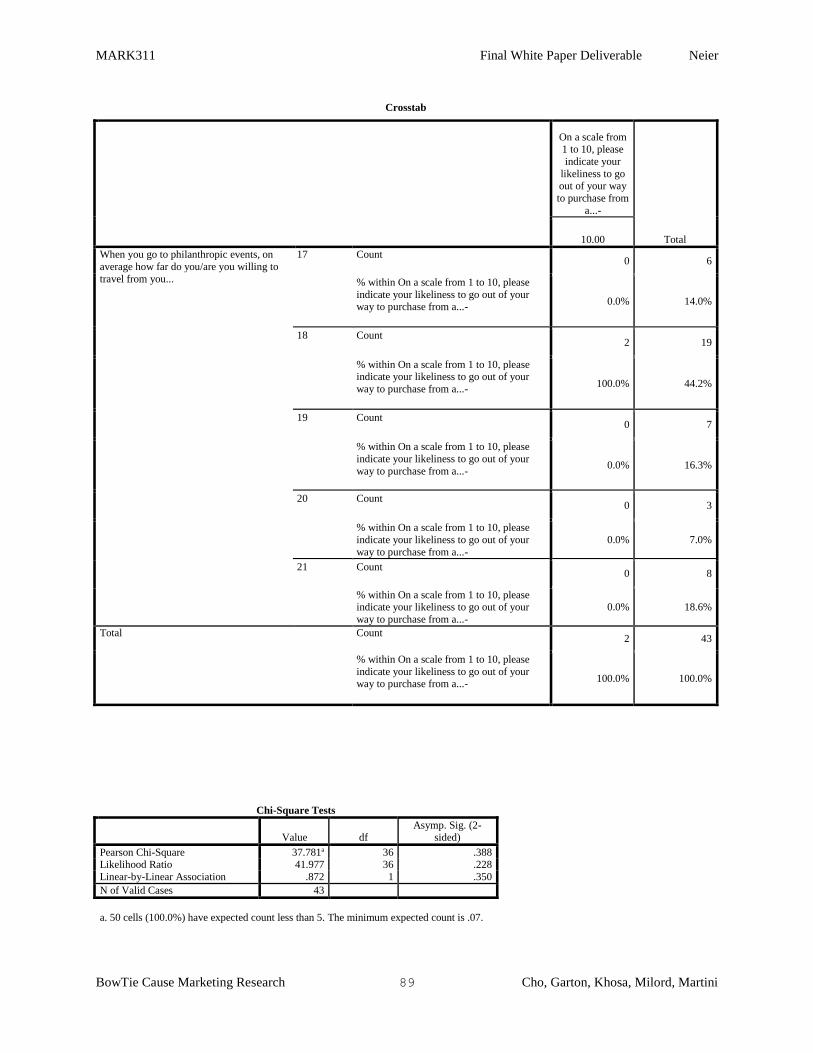
MARK311 Final White Paper Deliverable Neier
BowTie Cause Marketing Research 89 Cho, Garton, Khosa, Milord, Martini
Crosstab
On a scale from 1 to 10, please
indicate your
likeliness to go out of your way
to purchase from
a...-
Total 10.00
When you go to philanthropic events, on
average how far do you/are you willing to
travel from you...
17 Count 0 6
% within On a scale from 1 to 10, please
indicate your likeliness to go out of your way to purchase from a...-
0.0% 14.0%
18 Count 2 19
% within On a scale from 1 to 10, please indicate your likeliness to go out of your
way to purchase from a...- 100.0% 44.2%
19 Count 0 7
% within On a scale from 1 to 10, please
indicate your likeliness to go out of your
way to purchase from a...- 0.0% 16.3%
20 Count 0 3
% within On a scale from 1 to 10, please
indicate your likeliness to go out of your
way to purchase from a...-
0.0% 7.0%
21 Count 0 8
% within On a scale from 1 to 10, please indicate your likeliness to go out of your
way to purchase from a...-
0.0% 18.6%
Total Count 2 43
% within On a scale from 1 to 10, please
indicate your likeliness to go out of your way to purchase from a...-
100.0% 100.0%
Chi-Square Tests
Value df Asymp. Sig. (2-
sided)
Pearson Chi-Square 37.781a 36 .388 Likelihood Ratio 41.977 36 .228
Linear-by-Linear Association .872 1 .350
N of Valid Cases 43
a. 50 cells (100.0%) have expected count less than 5. The minimum expected count is .07.
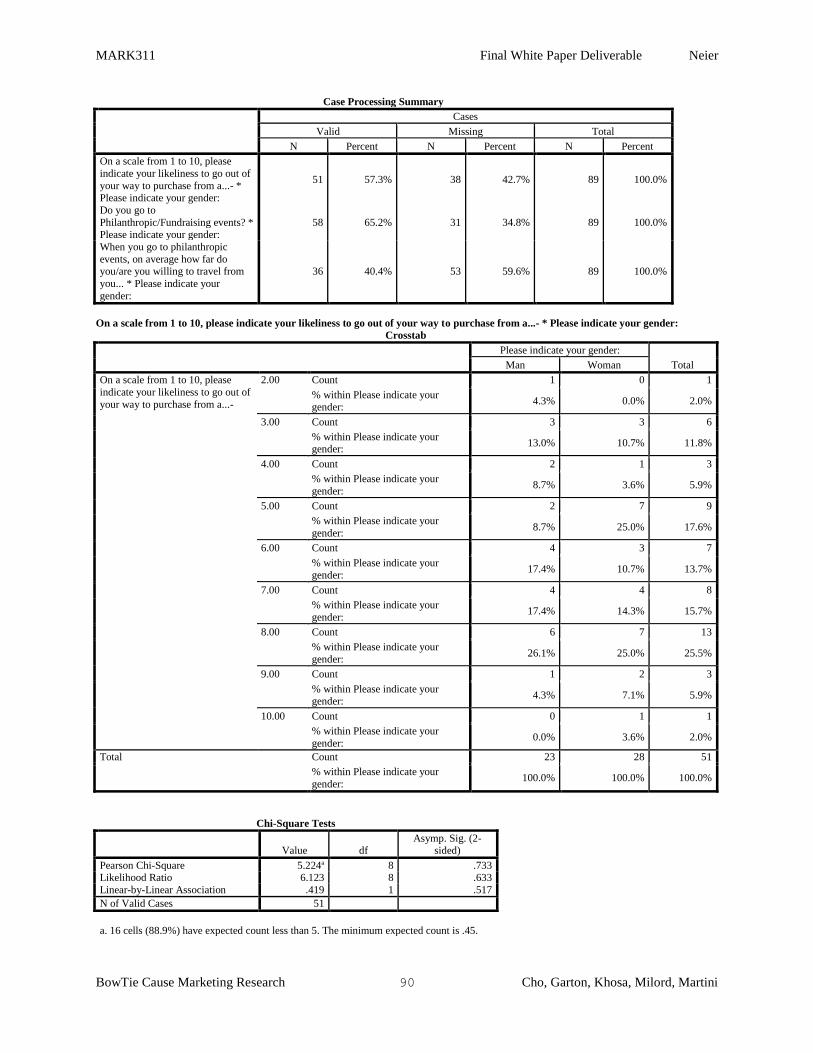
MARK311 Final White Paper Deliverable Neier
BowTie Cause Marketing Research 90 Cho, Garton, Khosa, Milord, Martini
Case Processing Summary
Cases
Valid Missing Total
N Percent N Percent N Percent
On a scale from 1 to 10, please
indicate your likeliness to go out of
your way to purchase from a...- * Please indicate your gender:
51 57.3% 38 42.7% 89 100.0%
Do you go to
Philanthropic/Fundraising events? * Please indicate your gender:
58 65.2% 31 34.8% 89 100.0%
When you go to philanthropic
events, on average how far do you/are you willing to travel from
you... * Please indicate your
gender:
36 40.4% 53 59.6% 89 100.0%
On a scale from 1 to 10, please indicate your likeliness to go out of your way to purchase from a...- * Please indicate your gender:
Crosstab
Please indicate your gender:
Total Man Woman
On a scale from 1 to 10, please
indicate your likeliness to go out of
your way to purchase from a...-
2.00 Count 1 0 1
% within Please indicate your gender:
4.3% 0.0% 2.0%
3.00 Count 3 3 6
% within Please indicate your gender:
13.0% 10.7% 11.8%
4.00 Count 2 1 3
% within Please indicate your
gender: 8.7% 3.6% 5.9%
5.00 Count 2 7 9
% within Please indicate your
gender: 8.7% 25.0% 17.6%
6.00 Count 4 3 7
% within Please indicate your
gender: 17.4% 10.7% 13.7%
7.00 Count 4 4 8
% within Please indicate your
gender: 17.4% 14.3% 15.7%
8.00 Count 6 7 13
% within Please indicate your
gender: 26.1% 25.0% 25.5%
9.00 Count 1 2 3
% within Please indicate your gender:
4.3% 7.1% 5.9%
10.00 Count 0 1 1
% within Please indicate your
gender: 0.0% 3.6% 2.0%
Total Count 23 28 51
% within Please indicate your
gender: 100.0% 100.0% 100.0%
Chi-Square Tests
Value df Asymp. Sig. (2-
sided)
Pearson Chi-Square 5.224a 8 .733 Likelihood Ratio 6.123 8 .633
Linear-by-Linear Association .419 1 .517
N of Valid Cases 51
a. 16 cells (88.9%) have expected count less than 5. The minimum expected count is .45.
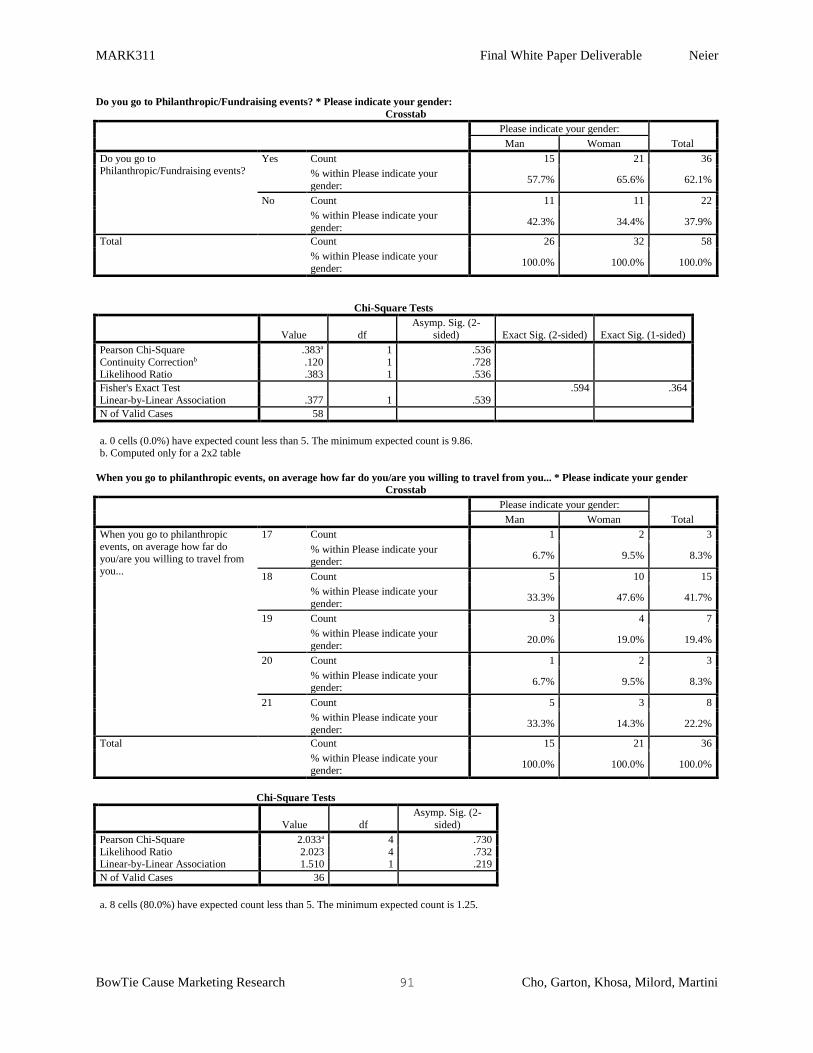
MARK311 Final White Paper Deliverable Neier
BowTie Cause Marketing Research 91 Cho, Garton, Khosa, Milord, Martini
Do you go to Philanthropic/Fundraising events? * Please indicate your gender:
Crosstab
Please indicate your gender:
Total Man Woman
Do you go to Philanthropic/Fundraising events?
Yes Count 15 21 36
% within Please indicate your
gender: 57.7% 65.6% 62.1%
No Count 11 11 22
% within Please indicate your
gender: 42.3% 34.4% 37.9%
Total Count 26 32 58
% within Please indicate your
gender: 100.0% 100.0% 100.0%
Chi-Square Tests
Value df
Asymp. Sig. (2-
sided) Exact Sig. (2-sided) Exact Sig. (1-sided)
Pearson Chi-Square .383a 1 .536
Continuity Correctionb .120 1 .728 Likelihood Ratio .383 1 .536
Fisher's Exact Test .594 .364
Linear-by-Linear Association .377 1 .539
N of Valid Cases 58
a. 0 cells (0.0%) have expected count less than 5. The minimum expected count is 9.86. b. Computed only for a 2x2 table
When you go to philanthropic events, on average how far do you/are you willing to travel from you... * Please indicate your gender
Crosstab
Please indicate your gender:
Total Man Woman
When you go to philanthropic
events, on average how far do
you/are you willing to travel from you...
17 Count 1 2 3
% within Please indicate your gender:
6.7% 9.5% 8.3%
18 Count 5 10 15
% within Please indicate your
gender: 33.3% 47.6% 41.7%
19 Count 3 4 7
% within Please indicate your
gender: 20.0% 19.0% 19.4%
20 Count 1 2 3
% within Please indicate your gender:
6.7% 9.5% 8.3%
21 Count 5 3 8
% within Please indicate your
gender: 33.3% 14.3% 22.2%
Total Count 15 21 36
% within Please indicate your
gender: 100.0% 100.0% 100.0%
Chi-Square Tests
Value df
Asymp. Sig. (2-
sided)
Pearson Chi-Square 2.033a 4 .730
Likelihood Ratio 2.023 4 .732 Linear-by-Linear Association 1.510 1 .219
N of Valid Cases 36
a. 8 cells (80.0%) have expected count less than 5. The minimum expected count is 1.25.
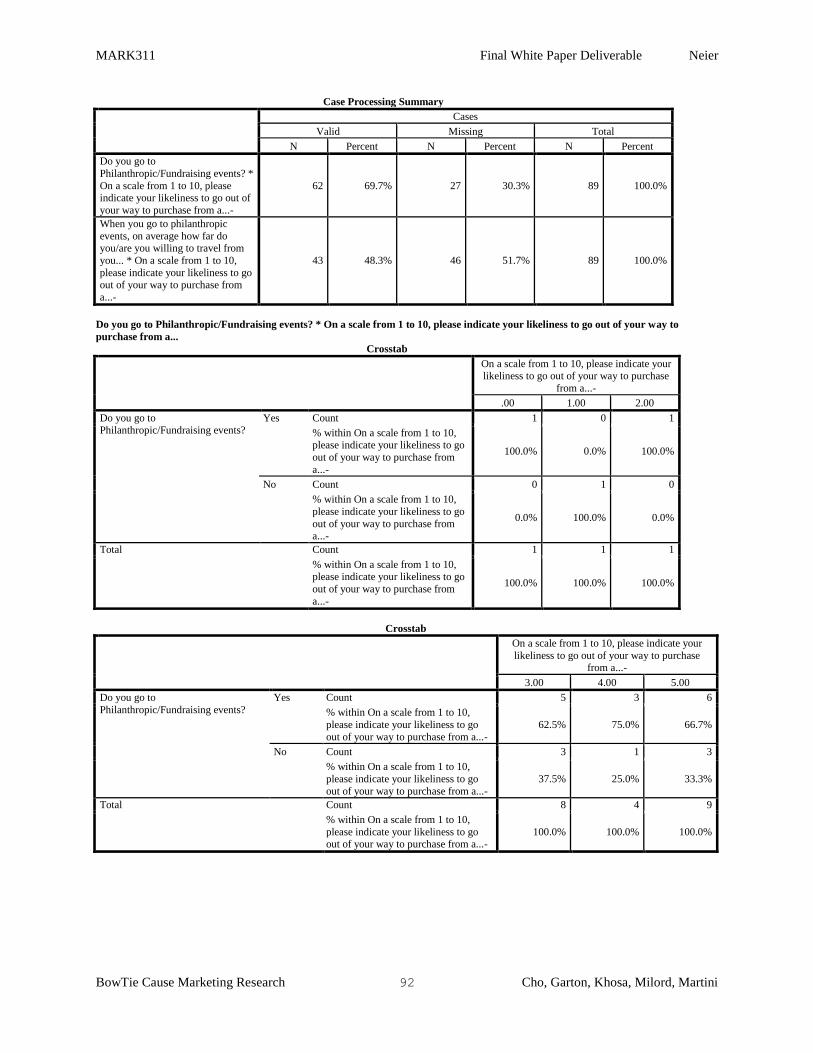
MARK311 Final White Paper Deliverable Neier
BowTie Cause Marketing Research 92 Cho, Garton, Khosa, Milord, Martini
Case Processing Summary
Cases
Valid Missing Total
N Percent N Percent N Percent
Do you go to
Philanthropic/Fundraising events? *
On a scale from 1 to 10, please indicate your likeliness to go out of
your way to purchase from a...-
62 69.7% 27 30.3% 89 100.0%
When you go to philanthropic
events, on average how far do you/are you willing to travel from
you... * On a scale from 1 to 10,
please indicate your likeliness to go out of your way to purchase from
a...-
43 48.3% 46 51.7% 89 100.0%
Do you go to Philanthropic/Fundraising events? * On a scale from 1 to 10, please indicate your likeliness to go out of your way to
purchase from a...
Crosstab
On a scale from 1 to 10, please indicate your likeliness to go out of your way to purchase
from a...-
.00 1.00 2.00
Do you go to Philanthropic/Fundraising events?
Yes Count 1 0 1
% within On a scale from 1 to 10, please indicate your likeliness to go
out of your way to purchase from
a...-
100.0% 0.0% 100.0%
No Count 0 1 0
% within On a scale from 1 to 10,
please indicate your likeliness to go
out of your way to purchase from a...-
0.0% 100.0% 0.0%
Total Count 1 1 1
% within On a scale from 1 to 10,
please indicate your likeliness to go
out of your way to purchase from
a...-
100.0% 100.0% 100.0%
Crosstab
On a scale from 1 to 10, please indicate your
likeliness to go out of your way to purchase from a...-
3.00 4.00 5.00
Do you go to
Philanthropic/Fundraising events?
Yes Count 5 3 6
% within On a scale from 1 to 10,
please indicate your likeliness to go
out of your way to purchase from a...-
62.5% 75.0% 66.7%
No Count 3 1 3
% within On a scale from 1 to 10,
please indicate your likeliness to go
out of your way to purchase from a...-
37.5% 25.0% 33.3%
Total Count 8 4 9
% within On a scale from 1 to 10,
please indicate your likeliness to go out of your way to purchase from a...-
100.0% 100.0% 100.0%
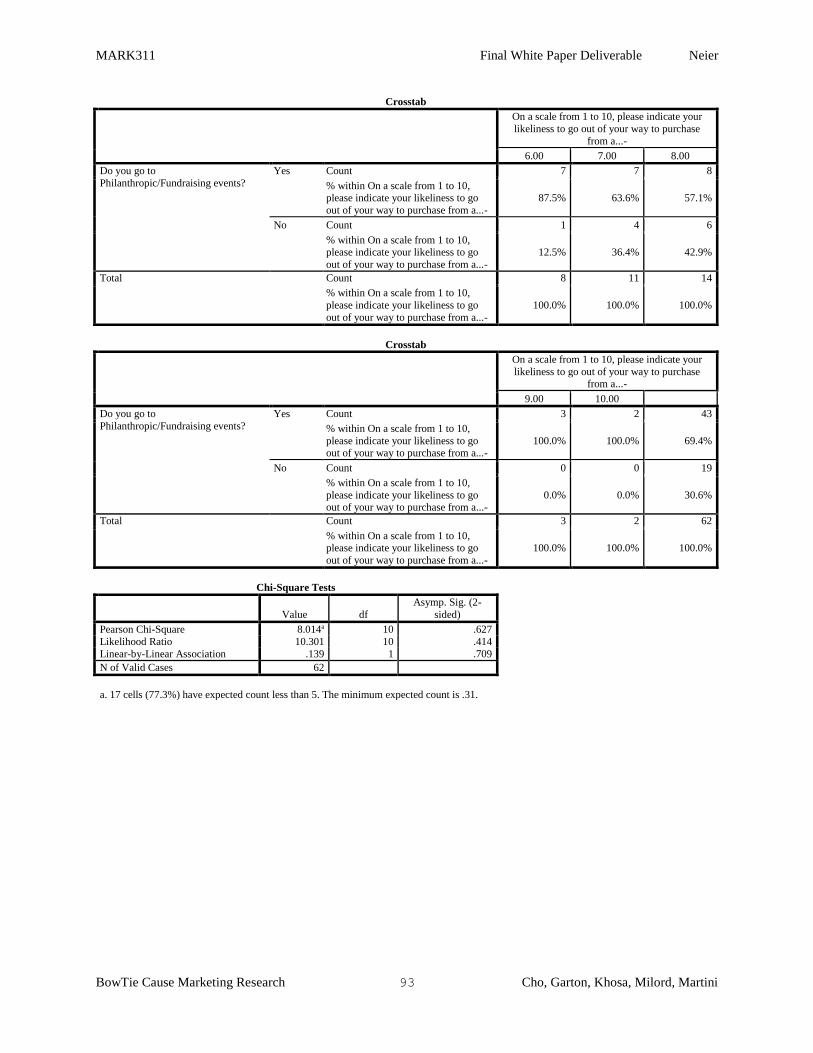
MARK311 Final White Paper Deliverable Neier
BowTie Cause Marketing Research 93 Cho, Garton, Khosa, Milord, Martini
Crosstab
On a scale from 1 to 10, please indicate your
likeliness to go out of your way to purchase
from a...-
6.00 7.00 8.00
Do you go to
Philanthropic/Fundraising events?
Yes Count 7 7 8
% within On a scale from 1 to 10, please indicate your likeliness to go
out of your way to purchase from a...-
87.5% 63.6% 57.1%
No Count 1 4 6
% within On a scale from 1 to 10, please indicate your likeliness to go
out of your way to purchase from a...-
12.5% 36.4% 42.9%
Total Count 8 11 14
% within On a scale from 1 to 10,
please indicate your likeliness to go
out of your way to purchase from a...-
100.0% 100.0% 100.0%
Crosstab
On a scale from 1 to 10, please indicate your
likeliness to go out of your way to purchase from a...-
9.00 10.00
Do you go to
Philanthropic/Fundraising events?
Yes Count 3 2 43
% within On a scale from 1 to 10,
please indicate your likeliness to go out of your way to purchase from a...-
100.0% 100.0% 69.4%
No Count 0 0 19
% within On a scale from 1 to 10,
please indicate your likeliness to go out of your way to purchase from a...-
0.0% 0.0% 30.6%
Total Count 3 2 62
% within On a scale from 1 to 10, please indicate your likeliness to go
out of your way to purchase from a...-
100.0% 100.0% 100.0%
Chi-Square Tests
Value df
Asymp. Sig. (2-
sided)
Pearson Chi-Square 8.014a 10 .627
Likelihood Ratio 10.301 10 .414
Linear-by-Linear Association .139 1 .709
N of Valid Cases 62
a. 17 cells (77.3%) have expected count less than 5. The minimum expected count is .31.
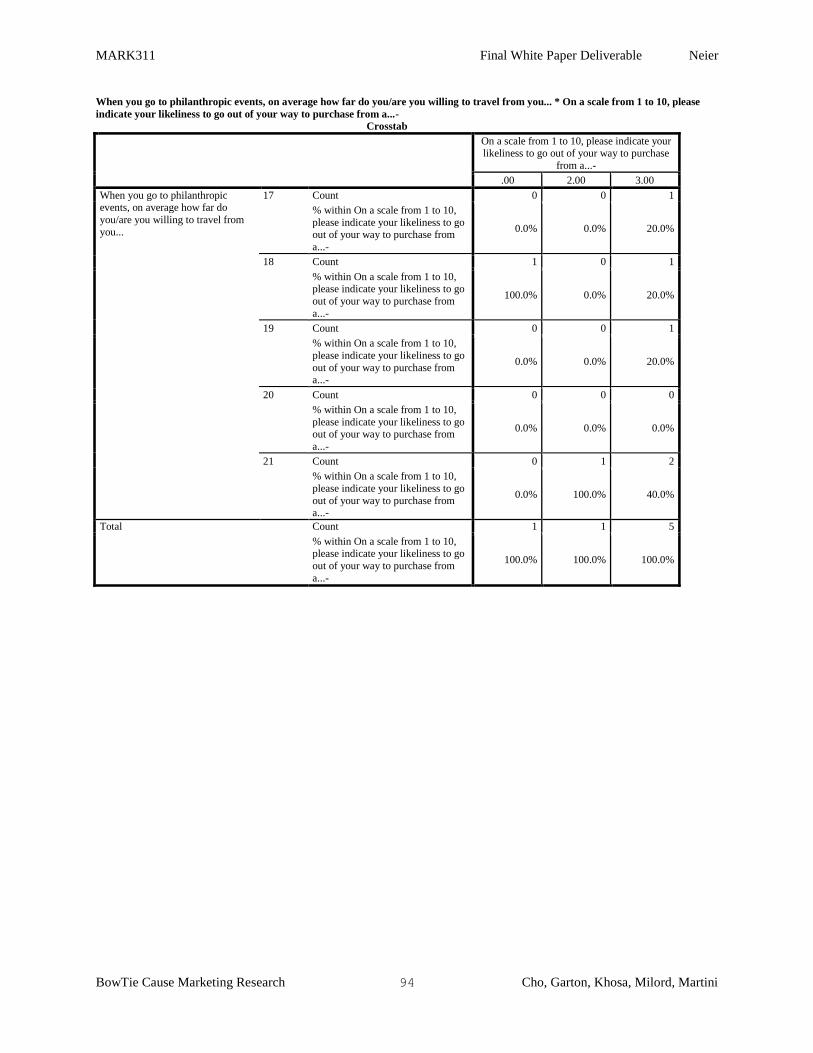
MARK311 Final White Paper Deliverable Neier
BowTie Cause Marketing Research 94 Cho, Garton, Khosa, Milord, Martini
When you go to philanthropic events, on average how far do you/are you willing to travel from you... * On a scale from 1 to 10, please
indicate your likeliness to go out of your way to purchase from a...-
Crosstab
On a scale from 1 to 10, please indicate your likeliness to go out of your way to purchase
from a...-
.00 2.00 3.00
When you go to philanthropic events, on average how far do
you/are you willing to travel from
you...
17 Count 0 0 1
% within On a scale from 1 to 10,
please indicate your likeliness to go out of your way to purchase from
a...-
0.0% 0.0% 20.0%
18 Count 1 0 1
% within On a scale from 1 to 10, please indicate your likeliness to go
out of your way to purchase from
a...-
100.0% 0.0% 20.0%
19 Count 0 0 1
% within On a scale from 1 to 10,
please indicate your likeliness to go
out of your way to purchase from a...-
0.0% 0.0% 20.0%
20 Count 0 0 0
% within On a scale from 1 to 10,
please indicate your likeliness to go out of your way to purchase from
a...-
0.0% 0.0% 0.0%
21 Count 0 1 2
% within On a scale from 1 to 10,
please indicate your likeliness to go
out of your way to purchase from a...-
0.0% 100.0% 40.0%
Total Count 1 1 5
% within On a scale from 1 to 10, please indicate your likeliness to go
out of your way to purchase from
a...-
100.0% 100.0% 100.0%
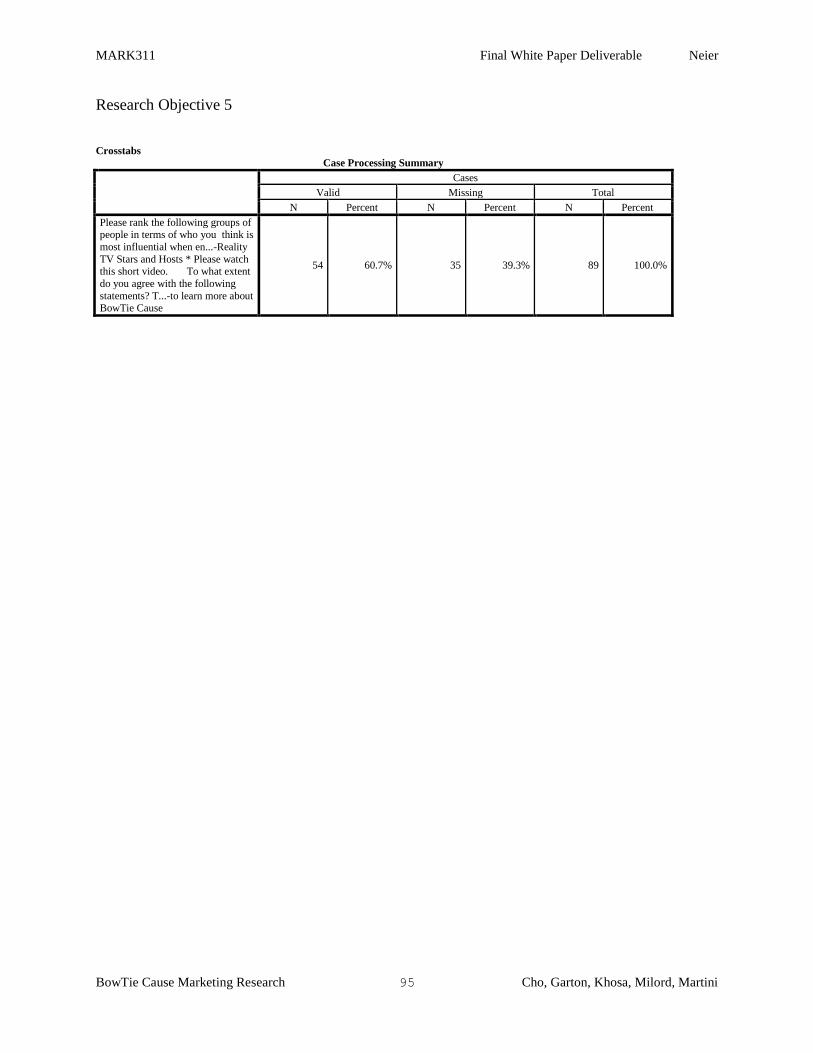
MARK311 Final White Paper Deliverable Neier
BowTie Cause Marketing Research 95 Cho, Garton, Khosa, Milord, Martini
Research Objective 5
Crosstabs
Case Processing Summary
Cases
Valid Missing Total
N Percent N Percent N Percent
Please rank the following groups of people in terms of who you think is
most influential when en...-Reality
TV Stars and Hosts * Please watch this short video. To what extent
do you agree with the following
statements? T...-to learn more about BowTie Cause
54 60.7% 35 39.3% 89 100.0%
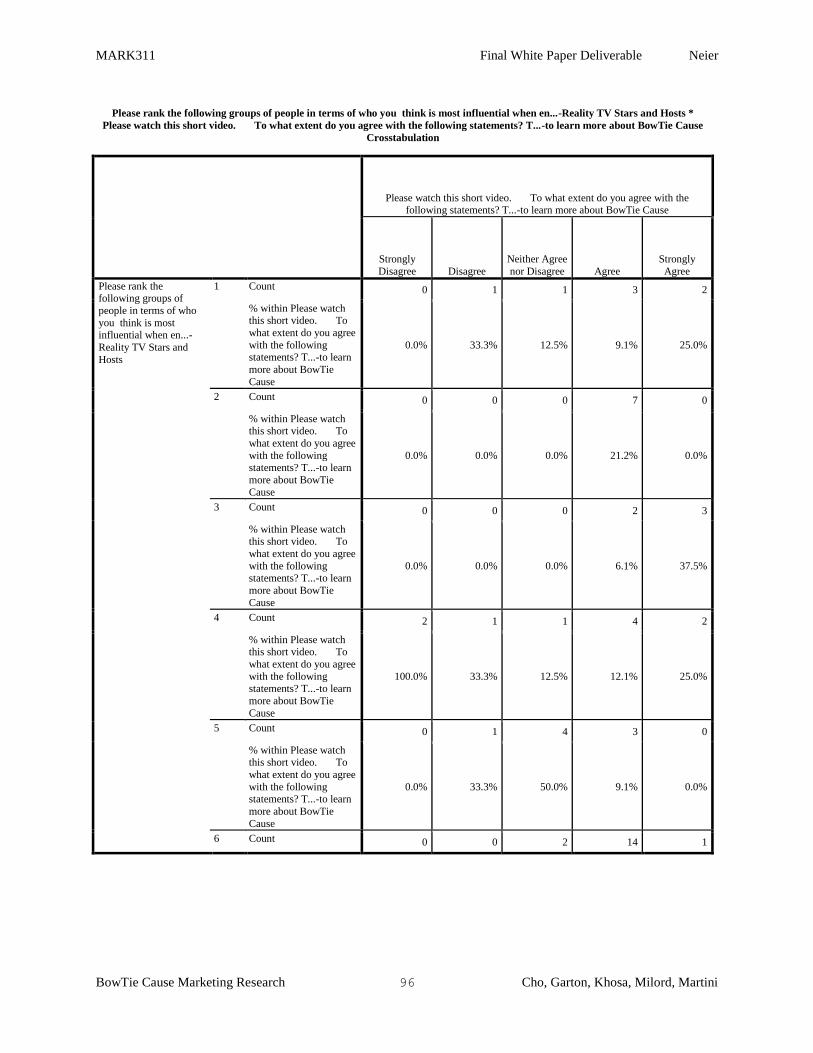
MARK311 Final White Paper Deliverable Neier
BowTie Cause Marketing Research 96 Cho, Garton, Khosa, Milord, Martini
Please rank the following groups of people in terms of who you think is most influential when en...-Reality TV Stars and Hosts *
Please watch this short video. To what extent do you agree with the following statements? T...-to learn more about BowTie Cause
Crosstabulation
Please watch this short video. To what extent do you agree with the following statements? T...-to learn more about BowTie Cause
Strongly
Disagree Disagree
Neither Agree
nor Disagree Agree
Strongly
Agree
Please rank the following groups of
people in terms of who
you think is most influential when en...-
Reality TV Stars and
Hosts
1 Count 0 1 1 3 2
% within Please watch this short video. To
what extent do you agree
with the following statements? T...-to learn
more about BowTie
Cause
0.0% 33.3% 12.5% 9.1% 25.0%
2 Count 0 0 0 7 0
% within Please watch this short video. To
what extent do you agree
with the following statements? T...-to learn
more about BowTie
Cause
0.0% 0.0% 0.0% 21.2% 0.0%
3 Count 0 0 0 2 3
% within Please watch this short video. To
what extent do you agree
with the following
statements? T...-to learn
more about BowTie
Cause
0.0% 0.0% 0.0% 6.1% 37.5%
4 Count 2 1 1 4 2
% within Please watch this short video. To
what extent do you agree
with the following statements? T...-to learn
more about BowTie
Cause
100.0% 33.3% 12.5% 12.1% 25.0%
5 Count 0 1 4 3 0
% within Please watch this short video. To
what extent do you agree
with the following statements? T...-to learn
more about BowTie
Cause
0.0% 33.3% 50.0% 9.1% 0.0%
6 Count 0 0 2 14 1
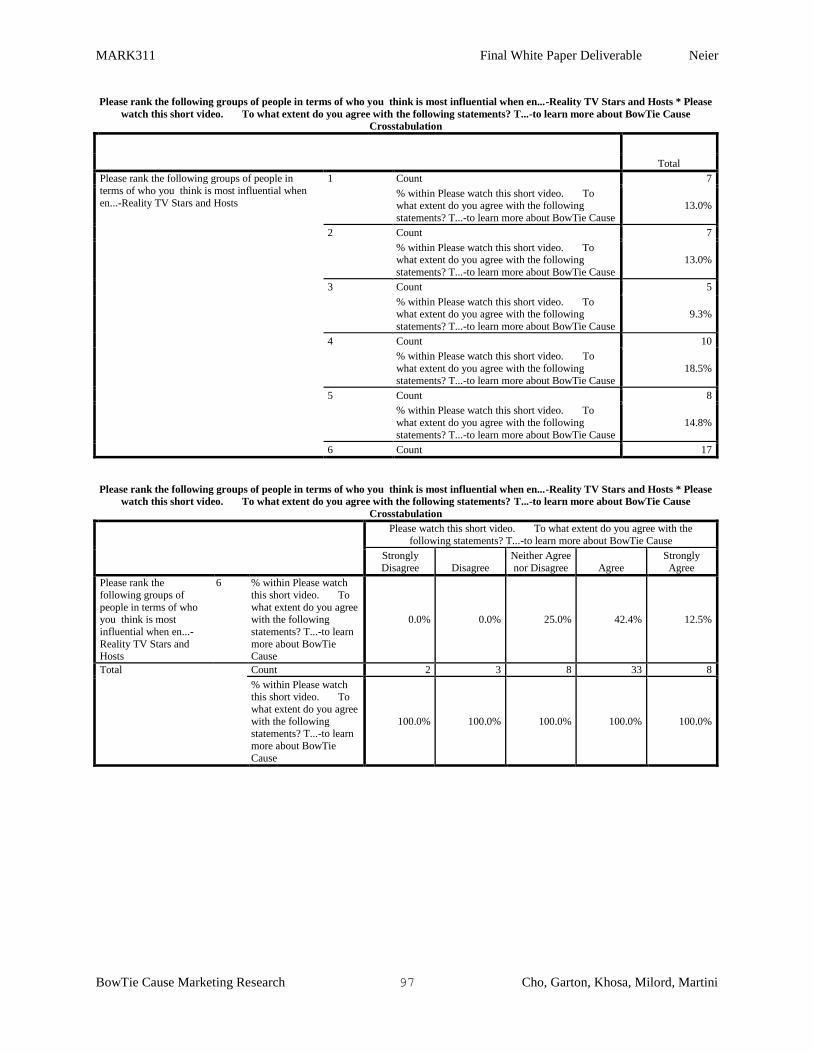
MARK311 Final White Paper Deliverable Neier
BowTie Cause Marketing Research 97 Cho, Garton, Khosa, Milord, Martini
Please rank the following groups of people in terms of who you think is most influential when en...-Reality TV Stars and Hosts * Please
watch this short video. To what extent do you agree with the following statements? T...-to learn more about BowTie Cause
Crosstabulation
Total
Please rank the following groups of people in
terms of who you think is most influential when
en...-Reality TV Stars and Hosts
1 Count 7
% within Please watch this short video. To what extent do you agree with the following
statements? T...-to learn more about BowTie Cause
13.0%
2 Count 7
% within Please watch this short video. To what extent do you agree with the following
statements? T...-to learn more about BowTie Cause
13.0%
3 Count 5
% within Please watch this short video. To what extent do you agree with the following
statements? T...-to learn more about BowTie Cause
9.3%
4 Count 10
% within Please watch this short video. To
what extent do you agree with the following
statements? T...-to learn more about BowTie Cause
18.5%
5 Count 8
% within Please watch this short video. To
what extent do you agree with the following
statements? T...-to learn more about BowTie Cause
14.8%
6 Count 17
Please rank the following groups of people in terms of who you think is most influential when en...-Reality TV Stars and Hosts * Please
watch this short video. To what extent do you agree with the following statements? T...-to learn more about BowTie Cause
Crosstabulation
Please watch this short video. To what extent do you agree with the
following statements? T...-to learn more about BowTie Cause
Strongly
Disagree Disagree
Neither Agree
nor Disagree Agree
Strongly
Agree
Please rank the
following groups of
people in terms of who you think is most
influential when en...-
Reality TV Stars and Hosts
6 % within Please watch
this short video. To
what extent do you agree with the following
statements? T...-to learn
more about BowTie Cause
0.0% 0.0% 25.0% 42.4% 12.5%
Total Count 2 3 8 33 8
% within Please watch this short video. To
what extent do you agree
with the following statements? T...-to learn
more about BowTie
Cause
100.0% 100.0% 100.0% 100.0% 100.0%
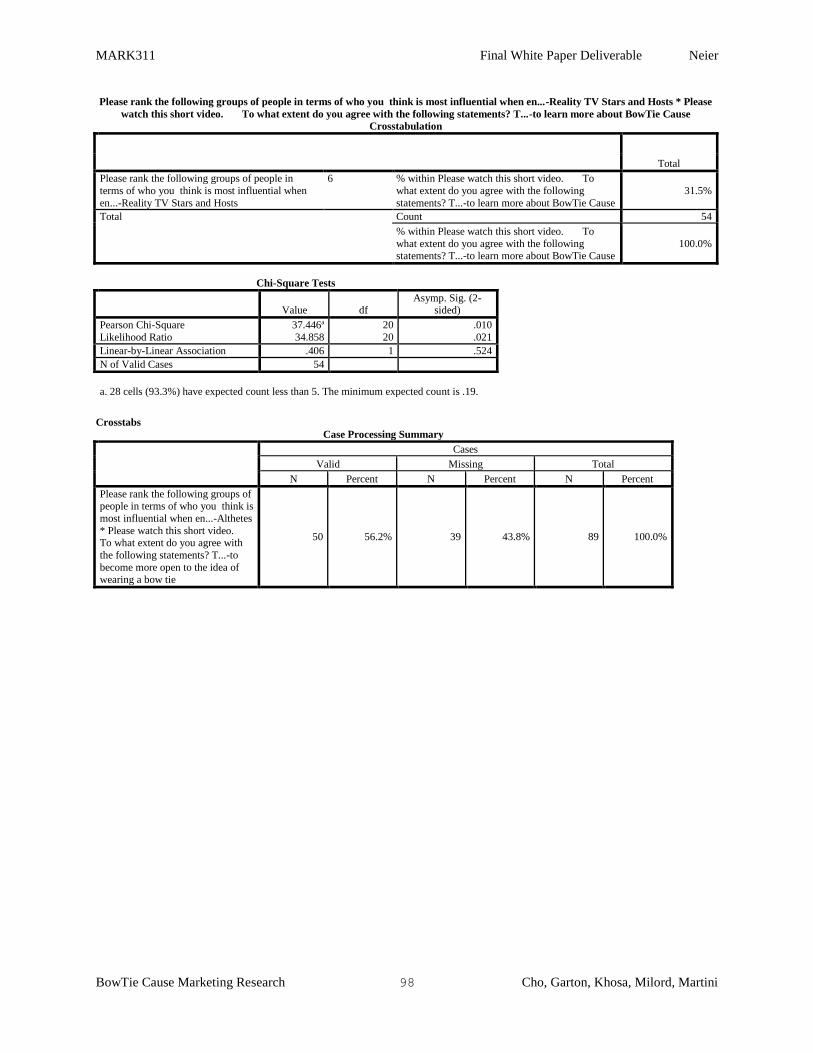
MARK311 Final White Paper Deliverable Neier
BowTie Cause Marketing Research 98 Cho, Garton, Khosa, Milord, Martini
Please rank the following groups of people in terms of who you think is most influential when en...-Reality TV Stars and Hosts * Please
watch this short video. To what extent do you agree with the following statements? T...-to learn more about BowTie Cause
Crosstabulation
Total
Please rank the following groups of people in
terms of who you think is most influential when
en...-Reality TV Stars and Hosts
6 % within Please watch this short video. To
what extent do you agree with the following
statements? T...-to learn more about BowTie Cause
31.5%
Total Count 54
% within Please watch this short video. To
what extent do you agree with the following statements? T...-to learn more about BowTie Cause
100.0%
Chi-Square Tests
Value df Asymp. Sig. (2-
sided)
Pearson Chi-Square 37.446a 20 .010
Likelihood Ratio 34.858 20 .021
Linear-by-Linear Association .406 1 .524
N of Valid Cases 54
a. 28 cells (93.3%) have expected count less than 5. The minimum expected count is .19.
Crosstabs
Case Processing Summary
Cases
Valid Missing Total
N Percent N Percent N Percent
Please rank the following groups of people in terms of who you think is
most influential when en...-Althetes
* Please watch this short video. To what extent do you agree with
the following statements? T...-to
become more open to the idea of
wearing a bow tie
50 56.2% 39 43.8% 89 100.0%
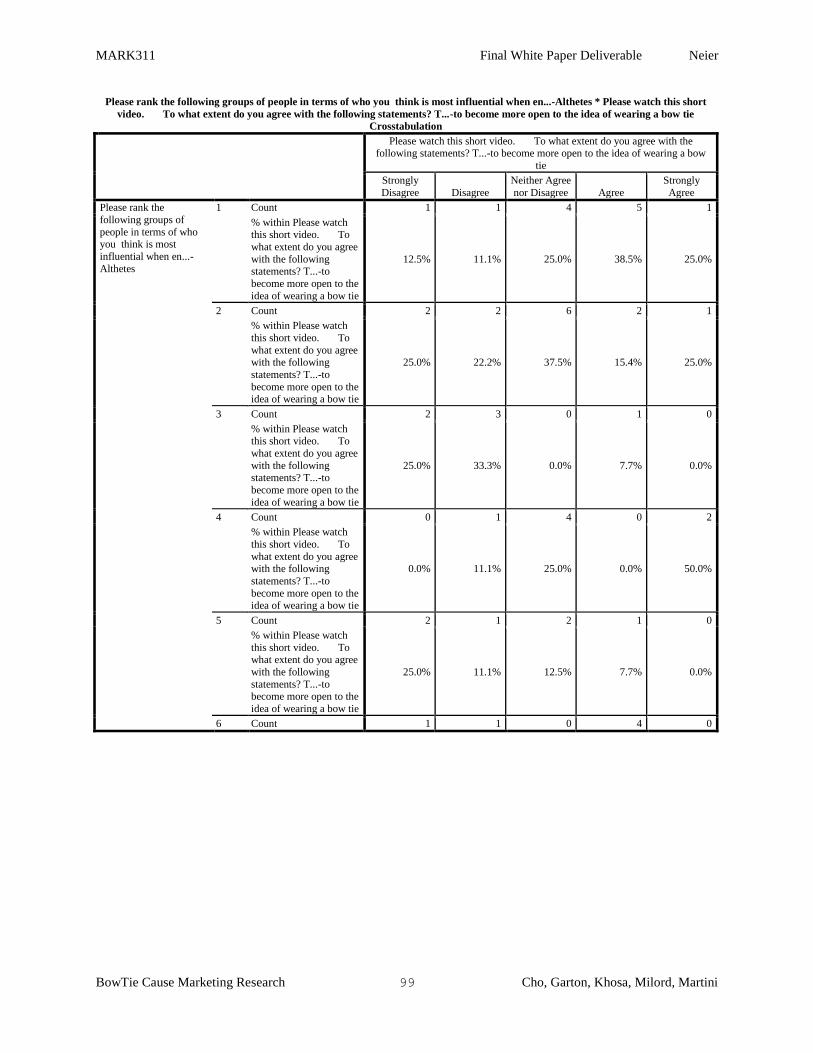
MARK311 Final White Paper Deliverable Neier
BowTie Cause Marketing Research 99 Cho, Garton, Khosa, Milord, Martini
Please rank the following groups of people in terms of who you think is most influential when en...-Althetes * Please watch this short
video. To what extent do you agree with the following statements? T...-to become more open to the idea of wearing a bow tie
Crosstabulation
Please watch this short video. To what extent do you agree with the following statements? T...-to become more open to the idea of wearing a bow
tie
Strongly
Disagree Disagree
Neither Agree
nor Disagree Agree
Strongly
Agree
Please rank the
following groups of
people in terms of who you think is most
influential when en...-
Althetes
1 Count 1 1 4 5 1
% within Please watch this short video. To
what extent do you agree
with the following statements? T...-to
become more open to the
idea of wearing a bow tie
12.5% 11.1% 25.0% 38.5% 25.0%
2 Count 2 2 6 2 1
% within Please watch
this short video. To
what extent do you agree with the following
statements? T...-to
become more open to the idea of wearing a bow tie
25.0% 22.2% 37.5% 15.4% 25.0%
3 Count 2 3 0 1 0
% within Please watch this short video. To
what extent do you agree
with the following statements? T...-to
become more open to the
idea of wearing a bow tie
25.0% 33.3% 0.0% 7.7% 0.0%
4 Count 0 1 4 0 2
% within Please watch
this short video. To
what extent do you agree with the following
statements? T...-to
become more open to the idea of wearing a bow tie
0.0% 11.1% 25.0% 0.0% 50.0%
5 Count 2 1 2 1 0
% within Please watch
this short video. To what extent do you agree
with the following
statements? T...-to become more open to the
idea of wearing a bow tie
25.0% 11.1% 12.5% 7.7% 0.0%
6 Count 1 1 0 4 0
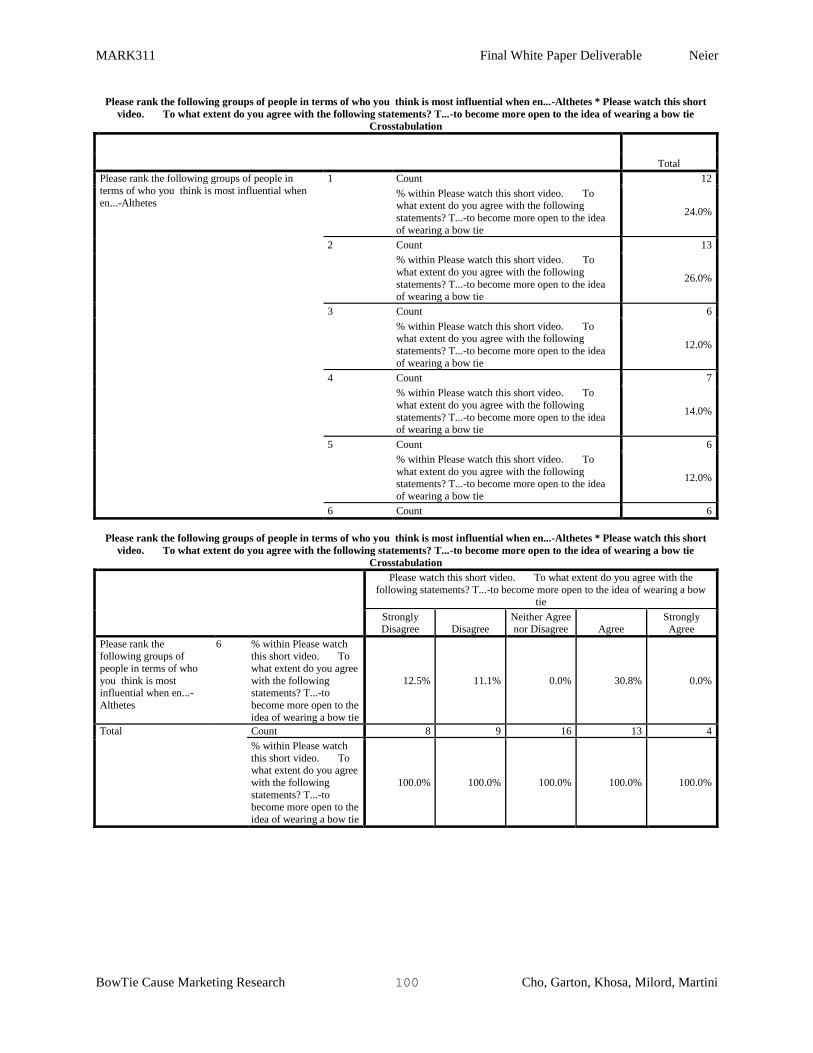
MARK311 Final White Paper Deliverable Neier
BowTie Cause Marketing Research 100 Cho, Garton, Khosa, Milord, Martini
Please rank the following groups of people in terms of who you think is most influential when en...-Althetes * Please watch this short
video. To what extent do you agree with the following statements? T...-to become more open to the idea of wearing a bow tie
Crosstabulation
Total
Please rank the following groups of people in
terms of who you think is most influential when
en...-Althetes
1 Count 12
% within Please watch this short video. To what extent do you agree with the following
statements? T...-to become more open to the idea
of wearing a bow tie
24.0%
2 Count 13
% within Please watch this short video. To
what extent do you agree with the following
statements? T...-to become more open to the idea of wearing a bow tie
26.0%
3 Count 6
% within Please watch this short video. To what extent do you agree with the following
statements? T...-to become more open to the idea
of wearing a bow tie
12.0%
4 Count 7
% within Please watch this short video. To
what extent do you agree with the following
statements? T...-to become more open to the idea of wearing a bow tie
14.0%
5 Count 6
% within Please watch this short video. To
what extent do you agree with the following statements? T...-to become more open to the idea
of wearing a bow tie
12.0%
6 Count 6
Please rank the following groups of people in terms of who you think is most influential when en...-Althetes * Please watch this short
video. To what extent do you agree with the following statements? T...-to become more open to the idea of wearing a bow tie
Crosstabulation
Please watch this short video. To what extent do you agree with the
following statements? T...-to become more open to the idea of wearing a bow tie
Strongly Disagree Disagree
Neither Agree nor Disagree Agree
Strongly Agree
Please rank the following groups of
people in terms of who
you think is most influential when en...-
Althetes
6 % within Please watch this short video. To
what extent do you agree
with the following statements? T...-to
become more open to the
idea of wearing a bow tie
12.5% 11.1% 0.0% 30.8% 0.0%
Total Count 8 9 16 13 4
% within Please watch
this short video. To what extent do you agree
with the following
statements? T...-to
become more open to the
idea of wearing a bow tie
100.0% 100.0% 100.0% 100.0% 100.0%
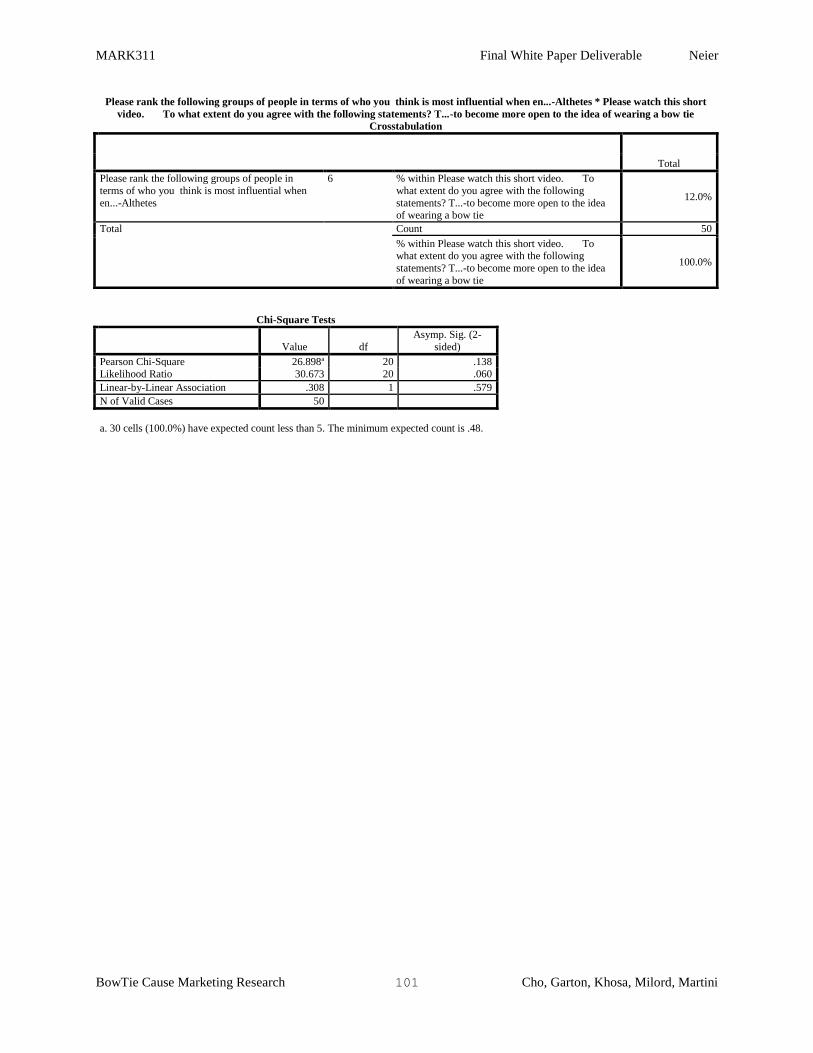
MARK311 Final White Paper Deliverable Neier
BowTie Cause Marketing Research 101 Cho, Garton, Khosa, Milord, Martini
Please rank the following groups of people in terms of who you think is most influential when en...-Althetes * Please watch this short
video. To what extent do you agree with the following statements? T...-to become more open to the idea of wearing a bow tie
Crosstabulation
Total
Please rank the following groups of people in
terms of who you think is most influential when
en...-Althetes
6 % within Please watch this short video. To
what extent do you agree with the following
statements? T...-to become more open to the idea of wearing a bow tie
12.0%
Total Count 50
% within Please watch this short video. To what extent do you agree with the following
statements? T...-to become more open to the idea
of wearing a bow tie
100.0%
Chi-Square Tests
Value df
Asymp. Sig. (2-
sided)
Pearson Chi-Square 26.898a 20 .138
Likelihood Ratio 30.673 20 .060
Linear-by-Linear Association .308 1 .579
N of Valid Cases 50
a. 30 cells (100.0%) have expected count less than 5. The minimum expected count is .48.
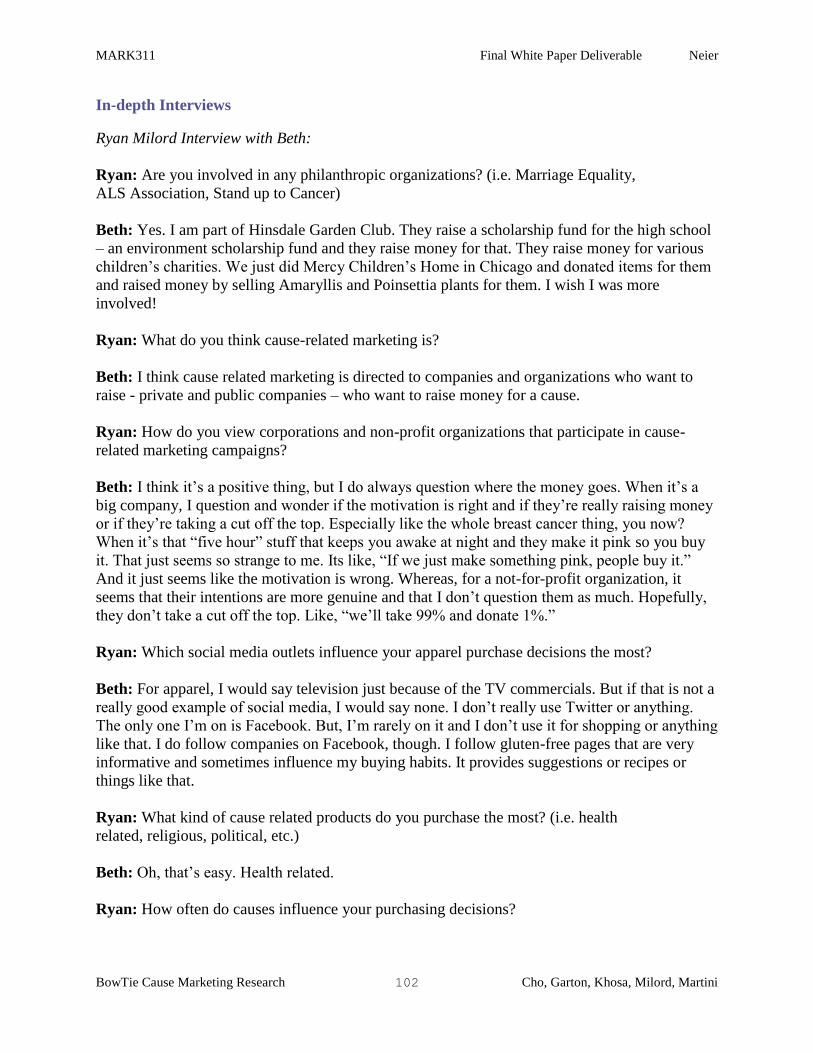
MARK311 Final White Paper Deliverable Neier
BowTie Cause Marketing Research 102 Cho, Garton, Khosa, Milord, Martini
In-depth Interviews
Ryan Milord Interview with Beth:
Ryan: Are you involved in any philanthropic organizations? (i.e. Marriage Equality,
ALS Association, Stand up to Cancer)
Beth: Yes. I am part of Hinsdale Garden Club. They raise a scholarship fund for the high school
– an environment scholarship fund and they raise money for that. They raise money for various
children’s charities. We just did Mercy Children’s Home in Chicago and donated items for them
and raised money by selling Amaryllis and Poinsettia plants for them. I wish I was more
involved!
Ryan: What do you think cause-related marketing is?
Beth: I think cause related marketing is directed to companies and organizations who want to
raise - private and public companies – who want to raise money for a cause.
Ryan: How do you view corporations and non-profit organizations that participate in cause-
related marketing campaigns?
Beth: I think it’s a positive thing, but I do always question where the money goes. When it’s a
big company, I question and wonder if the motivation is right and if they’re really raising money
or if they’re taking a cut off the top. Especially like the whole breast cancer thing, you now?
When it’s that “five hour” stuff that keeps you awake at night and they make it pink so you buy
it. That just seems so strange to me. Its like, “If we just make something pink, people buy it.”
And it just seems like the motivation is wrong. Whereas, for a not-for-profit organization, it
seems that their intentions are more genuine and that I don’t question them as much. Hopefully,
they don’t take a cut off the top. Like, “we’ll take 99% and donate 1%.”
Ryan: Which social media outlets influence your apparel purchase decisions the most?
Beth: For apparel, I would say television just because of the TV commercials. But if that is not a
really good example of social media, I would say none. I don’t really use Twitter or anything.
The only one I’m on is Facebook. But, I’m rarely on it and I don’t use it for shopping or anything
like that. I do follow companies on Facebook, though. I follow gluten-free pages that are very
informative and sometimes influence my buying habits. It provides suggestions or recipes or
things like that.
Ryan: What kind of cause related products do you purchase the most? (i.e. health
related, religious, political, etc.)
Beth: Oh, that’s easy. Health related.
Ryan: How often do causes influence your purchasing decisions?
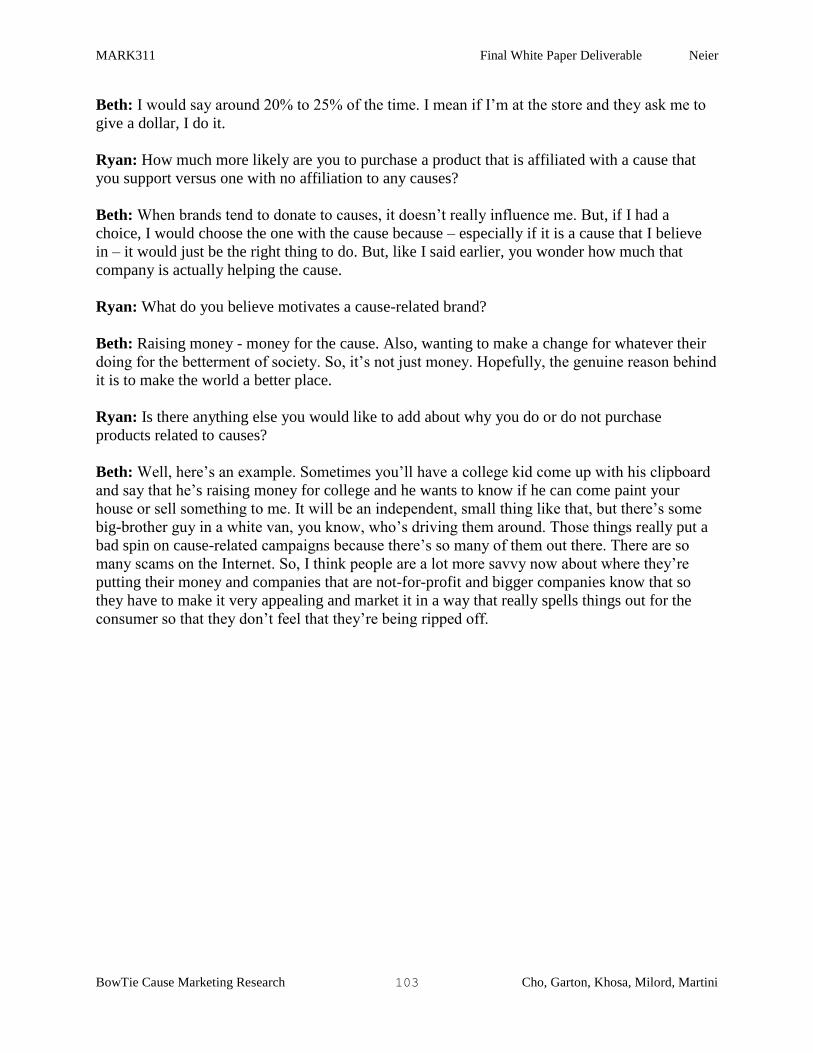
MARK311 Final White Paper Deliverable Neier
BowTie Cause Marketing Research 103 Cho, Garton, Khosa, Milord, Martini
Beth: I would say around 20% to 25% of the time. I mean if I’m at the store and they ask me to
give a dollar, I do it.
Ryan: How much more likely are you to purchase a product that is affiliated with a cause that
you support versus one with no affiliation to any causes?
Beth: When brands tend to donate to causes, it doesn’t really influence me. But, if I had a
choice, I would choose the one with the cause because – especially if it is a cause that I believe
in – it would just be the right thing to do. But, like I said earlier, you wonder how much that
company is actually helping the cause.
Ryan: What do you believe motivates a cause-related brand?
Beth: Raising money - money for the cause. Also, wanting to make a change for whatever their
doing for the betterment of society. So, it’s not just money. Hopefully, the genuine reason behind
it is to make the world a better place.
Ryan: Is there anything else you would like to add about why you do or do not purchase
products related to causes?
Beth: Well, here’s an example. Sometimes you’ll have a college kid come up with his clipboard
and say that he’s raising money for college and he wants to know if he can come paint your
house or sell something to me. It will be an independent, small thing like that, but there’s some
big-brother guy in a white van, you know, who’s driving them around. Those things really put a
bad spin on cause-related campaigns because there’s so many of them out there. There are so
many scams on the Internet. So, I think people are a lot more savvy now about where they’re
putting their money and companies that are not-for-profit and bigger companies know that so
they have to make it very appealing and market it in a way that really spells things out for the
consumer so that they don’t feel that they’re being ripped off.
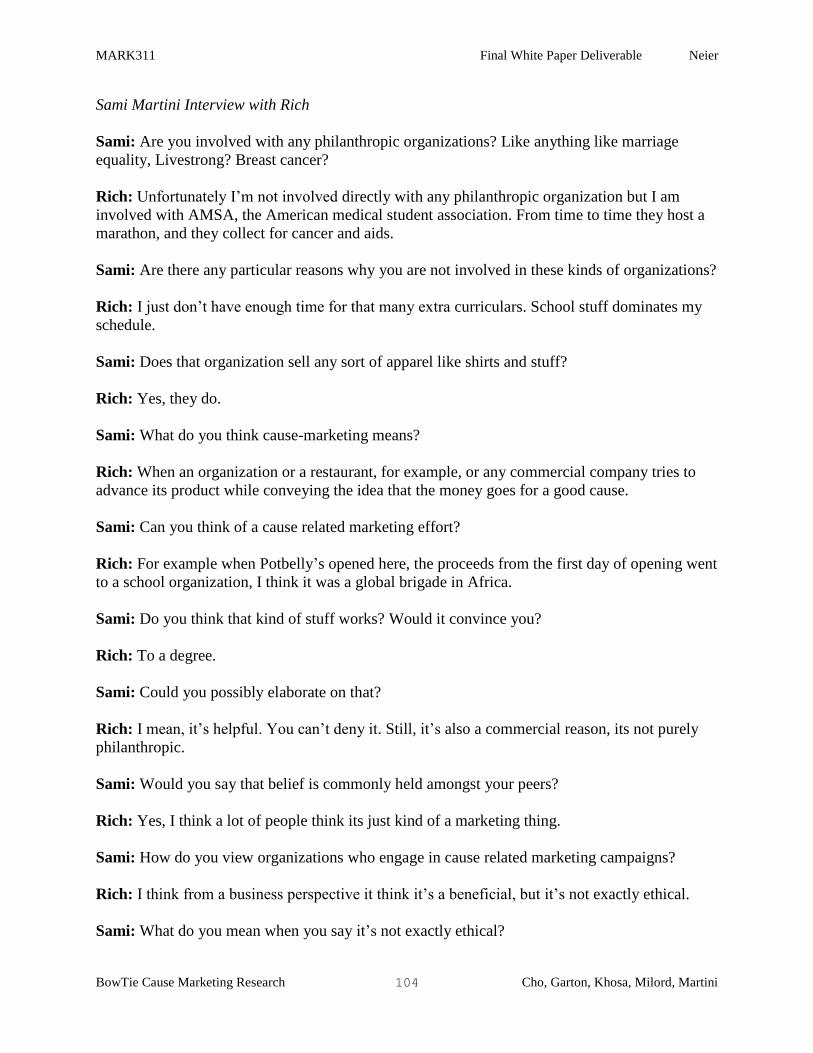
MARK311 Final White Paper Deliverable Neier
BowTie Cause Marketing Research 104 Cho, Garton, Khosa, Milord, Martini
Sami Martini Interview with Rich
Sami: Are you involved with any philanthropic organizations? Like anything like marriage
equality, Livestrong? Breast cancer?
Rich: Unfortunately I’m not involved directly with any philanthropic organization but I am
involved with AMSA, the American medical student association. From time to time they host a
marathon, and they collect for cancer and aids.
Sami: Are there any particular reasons why you are not involved in these kinds of organizations?
Rich: I just don’t have enough time for that many extra curriculars. School stuff dominates my
schedule.
Sami: Does that organization sell any sort of apparel like shirts and stuff?
Rich: Yes, they do.
Sami: What do you think cause-marketing means?
Rich: When an organization or a restaurant, for example, or any commercial company tries to
advance its product while conveying the idea that the money goes for a good cause.
Sami: Can you think of a cause related marketing effort?
Rich: For example when Potbelly’s opened here, the proceeds from the first day of opening went
to a school organization, I think it was a global brigade in Africa.
Sami: Do you think that kind of stuff works? Would it convince you?
Rich: To a degree.
Sami: Could you possibly elaborate on that?
Rich: I mean, it’s helpful. You can’t deny it. Still, it’s also a commercial reason, its not purely
philanthropic.
Sami: Would you say that belief is commonly held amongst your peers?
Rich: Yes, I think a lot of people think its just kind of a marketing thing.
Sami: How do you view organizations who engage in cause related marketing campaigns?
Rich: I think from a business perspective it think it’s a beneficial, but it’s not exactly ethical.
Sami: What do you mean when you say it’s not exactly ethical?
MARK311 Final White Paper Deliverable Neier
BowTie Cause Marketing Research 105 Cho, Garton, Khosa, Milord, Martini
Rich: I’m not saying it’s unethical I’m just saying it’s mostly a business thing. It’s not ethical or
unethical.
Sami: Do you use social media?
Rich: Oh yeah I’m always on Facebook.
Sami: So what social media outlets influence your apparel purchase decisions? Do you feel that
Facebook influences that?
Rich: Personally, not too much. For other people, it may influence them a lot. My sisters are
influenced a lot but not me.
Sami: Could you elaborate, how do you think your sisters are affected by Facebook apparel
marketing?
Rich: I think they see different styles and different things being worn of social media and they
decide to purchase it.
Sami: What kind of cause related products do you purchase the most? It could be anything
related to a cause.
Rich: I definitely do sometimes. For example there’s an on campus organization called the MSA
(Muslim student association), and I always buy their t-shirts to support their organization.
Sami: Do you only buy t-shirts for an organization that you’re a member of, or that you’re
associated with?
Rich: No, I just buy things when I think it will help something I support. It doesn’t matter
whether I’m involved in the organization or not.
Sami: Tell me more about the MSA. Are they the student organization that you are involved
most in? How would you say you are involved in them?
Rich: I go to their on campus events, speaker events, etc. I go maybe twice or three times a
month.
Sami: And the MSA is a religious organization, right? What do they do?
Rich: They promote relations between Muslims on campus, and they help them get together
basically and they bring in speakers and hold several events promoting faith-based ideas.
Sami: So are most MSA members Muslim?
Rich: the organization itself is all Muslim, yes.
MARK311 Final White Paper Deliverable Neier
BowTie Cause Marketing Research 106 Cho, Garton, Khosa, Milord, Martini
Rich: So when they sell shirts do the proceeds all go to the MSA or do they fundraise for other
causes?
Rich: Sometimes they go to the MSA sometimes the MSA supports a cause and fundraises for it.
For example they once fundraised to build wells in Africa (through an organization).
Rich: Was that a successful initiative?
Rich: Yes, it was, if I remember correctly they funded all of it successfully.
Rich: So did people participate more for this cause?
Rich: Yes, I found that when the MSA advocates for a specific cause where everyone knows
where the proceeds are going, they usually can sell more t-shirts related to those causes. They’re
more successful events.
Sami: Do you only have a Facebook account?
Rich: I do have a twitter account, but I hardly ever use it.
Sami: Would you say you’re more likely to buy a product that is affiliated with a cause that you
support, versus a product that is unaffiliated with a product? Is that something you factor in?
Rich: I don’t think its something I factor in very often or think about, however if I knew for a
fact that something would go to a cause I support I would choose that product amongst its
competitors.
Sami: going back to the wells…why do you think that was so successful?
Rich: I think it plays into the emotions of people. People feel good about when they help others,
and if they know they can just purchase a t-shirt and help then I think they would be glad to do it.
Sami: Do you factor in how much money goes to the cause as part of your decision?
Rich: Oh yeah, definitely. If I see an organization that is clear in its dealings and that gives as
much money as it can to the cause it supports, then I’m much more likely to buy it. The problem
with organizations these days is that you can’t trust all of them. You don’t know how much of
the proceeds go to the true cause sometimes. There’s been a lot of instances where an
organization will paint a more dire situation than there really is to benefit out of it. Many
organizations donate most of the proceeds to their members.
Sami: Do you know an example of that kind of organizational fraud?
Rich: I don’t know if you remember the KONY 2012 situation, but that’s what comes to my
mind when I think about that kind of stuff.
MARK311 Final White Paper Deliverable Neier
BowTie Cause Marketing Research 107 Cho, Garton, Khosa, Milord, Martini
Sami: Are you less likely to trust organizations that advertise causes?
Rich: Not necessarily, no, I like to give them the benefit of the doubt. I can’t really say I would
trust an organization more or less if they employ cause related marketing.
Sami: Is there anything else you would like to add about why you do or do not purchase
products related to causes?
Rich: I think if it’s a good product with a good cause, I’ll buy it. At the end of the day it’s more
about the product itself, not about the cause.
Sami: So do you think that no cause can make a product, but a product can make a cause?
Rich: Yes, I would agree with that statement.
Sami: Would you buy an unappealing cause t-shirt?
Rich: No, it should still look good.
Sami: Would you say cause-related marketing influences your purchasing behavior?
Rich: I agree that it does, but only sometimes. It depends a lot on the product itself. If its not a
good product, I’m not going to buy it. Another thing to consider is affordability and convenience.
I also care a lot about the trustworthiness of the organization itself. I’d like to see the history of
the organization itself.
Sami: Do you think social media influences your purchase decisions?
Rich: To a degree. It mostly influences me in terms of food (restaurants and stuff). It does not
really affect my clothes purchases.
MARK311 Final White Paper Deliverable Neier
BowTie Cause Marketing Research 108 Cho, Garton, Khosa, Milord, Martini
Monica Khosa Interview with Guadalupe
Monica: OK so my first question is: Are you involved in any philanthropic organizations?
Something like for marriage equality, ALS Association, Standing up to Cancer or breast cancer
awareness - anything like that?
Guadalupe: Not like officially part of but I do support like philanthropic charities, but I also
work for In Advancement for Loyola. So I work for the annual living team and work with the
student philanthropy group at Loyola so like a student group. I did donate to the ALS thing but I
think that was because of the ice bucket challenge and social media pressure and stuff. But, yeah,
I do consider myself a philanthropic person and I celebrated Giving Tuesday and yeah.
Monica: What do you think Cause-related marketing is?
Guadalupe: I think it’s raising awareness for the cause by different means. It could be through
social media or like advertising or sponsorships and stuff. Pretty much creating awareness for
your cause.
Monica: How do you view corporations and non-profit organizations that participate in cause-
related marketing campaigns?
Guadalupe: I think its good - especially if it’s for a good cause. And I think that nonprofits need
to have corporations invest in them because for them it is really hard to make a profit. And like I
work like I said in Loyola Development and since it is a private institution we do get all of our
donations privately. So, we’re not state funded or anything like that. So, a lot of corporations
fund Loyola and I like didn’t even know that before. Its nice to know that corporations invest in
causes cause without support from corporations it is hard to make a profit.
Monica: so like for bigger corporations if they supported something more philanthropic would
your view on them be more positive after you had found that out.
Guadalupe: Definitely. I think philanthropy in a corporation is really important because it shows
that they are willing to give back and they’re not all just for profit cause some corporations are
just for solely for profit.
Monica: Which social-media outlets influence your apparel purchasing decisions the most?
Guadalupe: I would probably say Twitter and Instagram. Facebook not so much just because it
is really saturated with advertising and stuff. And I tend to follow Twitter more for like facts and
news and like cause related things rather than Facebook. I feel like a lot of things posted on
Facebook are false. I don’t know why but it seems like Twitter is more trustworthy because you
have the verification.
Monica: So if you saw an ad on Twitter you would be more likely to buy something from that?
Guadalupe: Yeah I would.
MARK311 Final White Paper Deliverable Neier
BowTie Cause Marketing Research 109 Cho, Garton, Khosa, Milord, Martini
Monica: What kind of cause-related products do you purchase the most? Health-
related/religious/political/something for children/pets
Guadalupe: I would say something for the greater good kind of like the world. So like world
hunger, no water, that kind of thing. And also for medicine like breast cancer.
Monica (follow-up): So those bigger world issues?
Guadalupe: Yeah
Monica: And what would you say would be the second most important?
Guadalupe: Probably affinity based. So things I’m interested in. I don’t know what that would
be at this time. But something like dancing. I would probably support the Joffrey Ballet or like a
cause that was like personal. I would support children's cancer cause one of my friends little
brother had leukemia. So like stuff that I have a personal affinity towards rather than something
than something that is unrelated to myself in any way.
Monica: How often do causes influence your purchasing decisions?
Julia: I would say it influences it but not to a point where I would rather make a purchase for a
cause. So if its like I’m already thinking of buying something and I’m on the fence and if it did
support something I would be like Oh yeah definitely I’d do that.
Monica: So it’s more of a second thought?
Yeah its not a - I’m gonna seek out a purchasing opportunity because it supports a cause. It’s
more like ohhh ok yeah. Like if I see an ad and its like 20 percent of something I’m already
going to buy or something I was inclined to buy is supporting this cause like the proceeds go to
charity it would finalize my decision but its not something I would seek out.
Monica: how much more likely are you to purchase a product that is affiliated with a cause you
support versus one with no affiliation?
Julia: Yeah I feel like I’ve already answered that.
Monica: What do you believe motivates a cause-related brand?
Julia: Umm
Monica: Do you think they truly care about the cause?
Julia: I think its foundation cares about the cause but the people behind it might not necessarily.
But I think for the greater good of the company and the cause they probably believe in it and do
it because somewhere someone had to start that particular organization because they strongly
MARK311 Final White Paper Deliverable Neier
BowTie Cause Marketing Research 110 Cho, Garton, Khosa, Milord, Martini
believed in it. So I think it only makes sense that they do it because they believe in it not to make
a profit.
Monica: What about those bigger corporations like Coca Cola that have a campaign saying that
they do philanthropy, do you think that they truly care about the cause or do you just think that
its marketing?
Julia: I think its marketing. I’m sure that in some cases it would be related cause like what if the
top executive has a wife that’s battling ALS right so he would be more inclined to support that.
But I think the majority of the corporations we’re supporting breast cancer because its an
important thing and it will make us look good for doing it and breast cancer is getting a benefit
from it. It’s more of a partnership rather than a true belief in the cause. But, I’m sure there are
those off-cases but its mostly marketing.
Monica: Is there anything else you would like to add about why you do or do not purchase
products related to causes?
Julia: I think at this point, like I’ve said I think I am philanthropic like I really don't have that
much to give to different charities because I don’t make enough to do that. But I do try to give a
little bit at least like I said I’d more inclined to support more causes when purchasing something
when its an added bonus. Like I was in the pet store the other day and I donated an extra $5 with
my purchase to go to a homeless animal shelter but I think I’d be more inclined to support more
causes when I do make more money.
Monica: So right now you would rather donate money rather than buy a product?
Julia: Probably yeah unless it’s something I really want. I would never go buy something that’s
random that I would never use. It would have to benefit me too. You know what I mean?
Monica: Do you think cause-related marketing influences your purchasing behavior?
Julia: Probably. Yeah. I think all marketing influence purchasing behavior. It’s like subliminal
too. Like I was watching TV the other day and there was a bunch of Reese’s commercials during
this one show and like after that I just had to go buy Reese’s cause it was just like all I wanted.
And I was like dammit! It worked! That’s what they want me to do! And I’ve been eating them
ever since so I was like really mad that it influenced me but it’s so true. If you see enough of it
and you see the benefits especially when you like get like…. So like I write solicitations for
Loyola so like in that realm you think of other causes like the effort that goes into it and the
stories that they put and the testimonials of what you are supporting look at what its done for
these people. It pulls at your heartstrings and that makes you want to support it.
Monica: So something more emotional?
Julia: Yeah yeah
MARK311 Final White Paper Deliverable Neier
BowTie Cause Marketing Research 111 Cho, Garton, Khosa, Milord, Martini
RaShelle Garton Interview with Tim
RaShelle: Are you involved in any philanthropic organizations such as marriage equality, ALS
association, stand up to cancer?
Tim: No I am not right now. I can potentially see myself doing it in the future though.
RaShelle: Okay, any specific organizations that you know of that stand out to you?
Tim: Stand up to cancer would be a good one, I know that’s, you know, always in need and, you
know, getting rid of cancer would be a great thing.
RaShelle: Okay. In your opinion, what do you think the definition of cause-related marketing is?
Tim: I’m not really sure, umm.
RaShelle: It’s not a term that most people are familiar with but when you hear those words, if
you can tell me the first things that pop into your mind when you hear that.
Tim: Organizations that relate to a very specific cause. You know, like standing up to cancer I
feel would be one. In terms of the marketing, maybe going after a specific population who would
get interested in their cause.
RaShelle: Okay, yeah. How do you view corporations and non-profit organizations that
participate in cause-related marketing campaigns?
Tim: As long as they aren’t spending a lot of their money towards the marketing part, you know
instead of towards the actual cause, I’m totally cool with it. It’s a great way to make people
aware of what they’re doing and telling people or letting people know what they are all about.
RaShelle: True. So which social media outlets influence your apparel purchase decisions the
most?
Tim: Ah for apparel, ahhh…
RaShelle: If any…
Tim: Google is usually my biggest thing, Facebook, any kind of site or way of finding out about
products that they have, I’ll research into it depending on what they are.
RaShelle: Are there any sites that you wouldn’t necessarily look into further? I don’t know, for
example, like spam in Email, you know, a lot of people just totally brush that off because they’re
used to spam. Do you have any opinions about that or other social media sites?
Tim: Yeah I feel Email isn’t as effective as maybe it once used to be just because it gets so
overloaded with spam and you tend to look for something specific in your Email and then delete
MARK311 Final White Paper Deliverable Neier
BowTie Cause Marketing Research 112 Cho, Garton, Khosa, Milord, Martini
everything else. Maybe sites like Twitter aren’t as effective because anyone can post it there. I
feel like there is a lot more false advertising on the Twitter site than on a Google site for
example.
RaShelle: Okay. What kind of cause related products do you purchase the most? Like if you
purchase cause-related products, is it more health related, religious, political, educational?
Tim: I would say educational and health would probably be, not that I actually do at the moment
but those are two that I would focus on the most just because they’re, I feel those are more
directed at me just because of my age group and my lifestyle than the other ones.
RaShelle: Okay. How often do causes influence your purchasing decisions?
Tim: If I’m looking to purchase something cause-related then, you know…. (Long pause) Start
over, can you ask it again?
RaShelle: Okay. How often do causes influence your purchasing decisions?
Tim: Not so much, I mean, when I’m needing or purchasing something and I see that there is
something that’s going towards a cause it will, might sway me a little more, you know like to
help with or purchase that versus something that, you know, isn’t influencing my decision. Like
if it’s, you know they say a certain amount is going to this cause versus nothing is going toward a
cause, I’m going to go towards the one with the cause to help out in that way.
RaShelle: mmhmm…Would you be willing to spend a little bit more on the same product if you
knew that a certain percentage was going to a certain cause?
Tim: Oh absolutely.
RaShelle: How much more likely are you to purchase a product that is affiliated with a cause
that you support versus one with no affiliation to any causes?
Tim: Oh I’d be much more likely to purchase one that’s affiliated to a cause I believe in, you
know it would be like hitting two birds with one stone, if I can help out a cause while also
making a purchase that I also want, I see that as a much more beneficial gain than one that
doesn’t have the, or doesn’t put anything toward a cause or anything.
RaShelle: Would you be willing to travel out of your way in order to get that specific cause-
related item?
Tim: Unless there was something…(pause) I don’t know, I don’t know how to answer that. Most
likely no, but if there was something that like I felt strong about and can help out, then yeah I
would.
MARK311 Final White Paper Deliverable Neier
BowTie Cause Marketing Research 113 Cho, Garton, Khosa, Milord, Martini
RaShelle: What do you think the breaking point.. No that’s not how I want to word it. What’s
the furthest do you think you would travel, lets say in driving time to pick something up that
does support the cause that you like?
Tim: I mean it’s hard to answer, but well I’d probably go 10-15 minutes farther.
RaShelle: Okay
Tim: You know if it meant, you know having..
RaShelle: Getting that specific item?
Tim: Exactly, yeah.
RaShelle: What do you believe motives a cause-related brand? Or maybe, what motivates you to
believe in a cause-related brand? I believe that should’ve been the way it was worded.
Tim: How they actually contribute to their cause, you know if they say 100% of the proceeds go
towards this cause and I know that ahead of time, you know, that will motivate me a lot more as
opposed to one where you don’t, that they’re kind of shady about how much they’re putting
towards it, you know they aren’t very direct, because then it’s sort of like, well if I’m going to
spend extra and they’re profiting, they’re taking 75% of that just for profit and then donating the
rest, well I’m just paying for you guys instead of it going towards the cause. So if they were to
say, or to be very upfront about it, that would influence me or motivate me a lot more to go with
that.
RaShelle: Very true. When you think of, um, a situation like that where an organization does
reveal what percentage of the proceeds go to each specific cause, do you think it’s better for
them to give you a percentage of each item or a dollar amount of each item that goes to the
cause?
Tim: You know, I’m…
RaShelle: Or if that even affects you.
Tim: That wouldn’t really affect me either way as long as I know a good portion of it is, you
know, going towards the cause. I mean, if it was a high dollar amount then percentage. If it was
just like a low dollar amount then knowing that there would be a certain dollar amount because
it’s like if a $5 item and they say 10%, it’s like well 50 cents is going towards it versus if they
say $1.
RaShelle: True
Tim: I feel like that would help out a little more depending on that.
MARK311 Final White Paper Deliverable Neier
BowTie Cause Marketing Research 114 Cho, Garton, Khosa, Milord, Martini
RaShelle: Very true. Um is there anything else you would like to add about why you do or do
not purchase products related to causes?
Tim: Nothing like that. I mean as long as the site is very upfront about what they are selling and
what percentage of the profit or whatever is going toward their cause, you know that’ll, to me
that influences me a lot more than, you know, kind of making me feel bad for not doing it, like...
I don’t know…
RaShelle: Okay. Um on to our last question. Does cause-related marketing influence your
purchasing behavior?
Tim: Yes, because if they aren’t marketing, I don’t usually go out of my way to find out if a
product is, a product I’m purchasing is going towards a cause or not. If I know, I’ll go out of my
way if I know that there is, that I can purchase an item and it’s going towards a cause-related
thing. You know, but I don’t go on the internet and search for what purchase I can make that will
go toward a cause, but if they make me aware of it before I do that then I will have a little more
knowledge and be able to actually know about it as opposed to just know on my own.
RaShelle: Okay. Ah real quick a follow up question to that is what do you think is the best way
to, for you to be aware, of a cause-related product? Like how can a company get your attention
and influence you, like what would be the best way for that to happen?
Tim: Well in today’s day and age, I hate saying it but marketing through celebrities or like
seeing it out there in the open makes me a lot more aware of it. You know if I just see something
on a computer screen, it’s sort of hard to see how its being affected or how it is. But if you see it
being endorsed by people who I respect or something, that goes a long way in terms of making
me aware or making me maybe more apt to seek that out as opposed to just seeing it on the
internet.
RaShelle: Are there any specific celebrities or type of celebrities that would influence you the
most in that aspect?
Tim: I mean, it’s not necessarily a specific type of celebrity, but more just a, like it could be a
sports celebrity or anything like that, it’s just that I have to believe in them as a person and know
that they are genuine.
RaShelle: So someone like respectable and..
Tim: Respectable exactly. Like if I were to see Tom Hanks, for example, marketing something,
I’d feel a lot stronger about that then if I were to see someone like Mike Tyson, for example,
endorsing that. So depending on who it is, it can sway me a lot more.
RaShelle: mmhmm. Okay, well I believe that is it unless you want to add anything else?
Tim: No, that is it.
MARK311 Final White Paper Deliverable Neier
BowTie Cause Marketing Research 115 Cho, Garton, Khosa, Milord, Martini
RaShelle: Allright well, thank you for your time.
Tim: My pleasure, thank you.
MARK311 Final White Paper Deliverable Neier
BowTie Cause Marketing Research 116 Cho, Garton, Khosa, Milord, Martini
April Cho Interview with Christine
April: I am working with a cause-related company, who donates money when their customers
buy each product, for my marketing class, so all questions might be related to cause-related
marketing.
Christine: Okay.
April: Are you involved in any philanthropic organizations, such as Marriage Equality and
Breast Cancer?
Christine: Ummm..No. Not at all.
April: All right. If not, are there any particular reasons why you are not involved in these kinds
of organizations?
Christine: I don’t have time.
April: What do you think cause-related marketing is?
Christine: Cause-related marketing? Umm... The way that… It’s like marketing that you umm...
when the... I guess it involved two different kinds of companies and they have to work together
in order to benefit like a charity
April: How do you view corporations and non-profit organizations that participate in cause-
related marketing campaigns?
Christine: I think is good that the corporations do it obviously and I feel like non-profit
organizations have to do it, cause they don’t gain any profits, so I think it could say corporations
do it as like a kind of philanthropy or giving like a boost in their morale companies.
April: Which social media outlets influence your apparel purchase decisions the most?
Christine: Twitter, and Instagram?
April: Have you really seen cause-related campaigns or advertisements on those social media?
Cause honestly, I haven’t seen any of them on social media.
Christine: Yeah. Not right now. I don’t think. I know that there are like.. I haven’t personally
seen it, but I’ve heard about it though. Cause it’s like old.. I wasn’t looking at exact time. But it’s
kind of like when I researched certain things, they came up as old posts. And I was like oh they
had cool things and it looks like nice they did kind of thing. There were lots of fashion events
that they giving back.
April: If you saw someone promoting a brand on the social media sites, how likely or unlikely
are you to investigate the brand further?
MARK311 Final White Paper Deliverable Neier
BowTie Cause Marketing Research 117 Cho, Garton, Khosa, Milord, Martini
Christine: I guess it’s like questionable rumors or questionable means like the way they are
doing, but if there’s not anyone saying anything then, I wouldn’t probably investigate.
April: Have you ever purchased cause-related products, like you didn’t even know when you
bought it, but later, you found out it was cause-related products. OR
Christine: Toms are definitely cause-related products and I knew that before purchasing. And
I’m sure I think there are others like small things that are probably I didn’t know when I got.
Like a bag, this gives two cents to somebody.
April: How much causes influence people’s purchasing decisions?
Christine: Like cause in general? There might be probably huge in general. I’ve seen, cause I’m
a college student, so…
April: How much more likely are you to purchase a product that is affiliated with a cause that
you support versus one with no affiliation to any causes?
Christine: Cause. On the other one I guess cause doesn’t necessarily matter to me. It’s nice I
guess. But you are like oh you are helping somebody in Africa or like when they have organic
policy. I like that a lot. I like organic. If they have that kind of cause behind them, I would like to
buy them. It depends on the products, but I would buy the products I like rather than cause-
related products. The cause is important, but it’s not important factor to me deciding the
products.
April: What motivates cause-related products or brands?
Christine: I think that those products either the business owner or the corporations have the
strong belief that the cause should be supported in like, not just their daily lives. Cause they
might support their daily lives, but they should like support in their working lives. That probably
something to do with it or I think it’s like the relevant is differentiating, differentiating the factor
that can kind of gain them access into the market.
April: Is there anything else you would like to add about why you do or do not purchase
products related to causes?
Christine: I think it takes a lot of effort to continually buy something from more a cause and to
look on to it. I’m not actively looking for. Sometimes it does not even pop up. It just depends on
the situation you run across. So it’s not that I don’t want to buy something from cause, but it’s
just I have to make sure if there’s a cause with it.
April: Does cause-related marketing influence on your purchasing behavior?
Christine: A little bit. Like I said, if it’s something like be going to eco-friendly. Just because I
think it’s a good cause.
MARK311 Final White Paper Deliverable Neier
BowTie Cause Marketing Research 118 Cho, Garton, Khosa, Milord, Martini
April: How do you think of corporations who seek only for their profit and other corporations
who donate their profits for philanthropic reasons?
Christine: In some ways, you have to make sure how business plans are strategic, how they
gaining money and what their utilizing them towards. I think it’s just depends on ethic of how
they are using their money. Cause even the people that are giving for specific reasons, or
whatever, may not actually giving the money really well in terms of transparency. Cause, in
Africa, you give money to the government and people don’t actually see it if the government
takes it. So, you have to really look into where your money going and what’s being benefits. Not
just like giving it for free but also doing stuff with it that actually benefit to people.
MARK311 Final White Paper Deliverable Neier
BowTie Cause Marketing Research 119 Cho, Garton, Khosa, Milord, Martini
Resumes
Ryan Milord [email protected]
(561) 789-7525
1040 W. Granville Ave.
Apartment #218
Chicago, IL 60660
Objective: To obtain work experience in which I can utilize my marketing, theatrical, and analytical skills to
promote company and self-growth
Education: Loyola University Chicago, Chicago, IL
Bachelors of Business Administration, Marketing Expected May 2015
Bachelors of Arts, Theatre Expected May 2015
GPA: 3.599/4.0
Work Experience: Porchlight Music Theatre, Chicago, IL 2014
Production & Administrative Intern
· Filmed and edited promotional videos for the company
· Helped manage and document customer’s needs and purchases
House Manager for Sweeney Todd 2014
· Coordinated with the Box Office and Stage Management to keep performances on time
· Provided customer service to patrons
Next Theatre, Evanston, IL
Marketing Intern 2014
· Developed promotional e-blasts to help market the company
· Updated and promoted the company’s presence on social media
Milord Company, Bridgeview, IL
Laborer 2010-2013
· Updated and restructured company documents while systematizing the physical assets
· Worked as a laborer at the office and on various construction job sites
Volunteer Experience:
Habitat for Humanity, Hinsdale, IL
Volunteer 2010-2011
· Assisted in the building of two houses in West Virginia for underprivileged families
Activities: Theatre
· Took acting classes at Acting Studio Chicago and Piven Theatre
· Performed in several college productions including: Twelfth Night, From Here: Voices of Queer
Rome and Beijing, Reality, Dreams, and the Problem of Evil, and Dog Sees God
· Performing arts background has provided me with effective acting, social, and public speaking
skills
Skills
· Experience with Microsoft Office (Word, Excel, PowerPoint), Constant Contact, Total Info,
iMovie, various social media platforms, AutoCAD, Revit, and Inventor
MARK311 Final White Paper Deliverable Neier
BowTie Cause Marketing Research 120 Cho, Garton, Khosa, Milord, Martini
Monica H. Khosa 1437 W Devon, Chicago, IL 60660
[email protected] | (312) 919-2940
Education
Loyola University Chicago Chicago, IL
Quinlan School of Business
B.B.A Finance and Marketing Expected Graduation: May 2015
International Experience
Bach Khoa Ho Chi Minh City, Vietnam
Ho Chi Minh City University of Technology January 2014 – May 2014
· Took courses focusing on the economic progression and boom of South East Asia
· Culturally adapted to the local customs within both the city and in the villages through a
homestay program with a non-English speaking Vietnamese family.
Khobates Industries Sdn Bhd Kuala Lumpur, Malaysia
Market Strategy Intern May 2013 – August 2013
· Coordinated product promotions with Groupon
· Researched and implemented market strategies for expansion of East Malaysia market base
· Designed product templates for Fruisër Salon Series
Professional Experience: Legal Assistant/Intern, Arthur B. Adler & Associates August 2012 – December 2013
Chicago, IL
· Hired on after internship
· Entrusted with logistical management of various confidential legal documents
· Facilitated media collection for supporting evidence in cases
Achievements: Loyola University Vietnam Center Environmental Science Grant January 2014 – May 2014
Mentor: Justin Babcock
· Conducted research on the impending consumer market of electric bikes in urban cities
such as Hanoi and Ho Chi Minh City
Marketing Research Participant, GfK NextGeneration Competition, Chicago October 2014 - November 2014
Mentor: Stacy Neier
· Conducted quantitative SPSS and qualitative research to identify opportunities for
· Supported data insights from primary surveys, focus groups, and in-depth interviews with secondary data
information.
Affiliations
· Alpha Kappa Psi – Gamma Iota Chapter 2011 - Present
· The International Business Society 2013 - Present
o Vice President Fall 2013
· The Investment Bank & Financial Markets Association (IBFMA) 2014 - Present
Skills:
· Proficient in Malay and rudimentary Spanish
· Flexible in location and easily adaptable to new environments
· Knowledgeable with market research tools such as Qualtrics and SPSS
· Efficient in Microsoft programs including MS Word, MS PowerPoint, MS Access and MS Excel (Pivot
Tables, Scenario Manager, Goal Seek, Financial Functions)
MARK311 Final White Paper Deliverable Neier
BowTie Cause Marketing Research 121 Cho, Garton, Khosa, Milord, Martini
Sami Martini 6301 North Sheridan Road Apt 20k, Chicago, Il 60660
(630)-880-8465 [email protected]
EDUCATION:
Loyola University Chicago Fall 2011-Spring
Quinlan School of Business
B.B.A Marketing Expected graduation: May 2015
Hinsdale Central High School Fall 2007-Spring Graduation:
2011
Hinsdale, IL
EXPERIENCE:
Syrian Refugee Field Hospital Volunteer Winter 2013
Idlib Province, Syria
Observed physicians perform surgeries on civilians with war related injuries
Handled and organized surgical equipment during procedures
Documented all observed war related atrocities
Provided emotional support to patients
Loyola University Research Fellow Summer 2012
Loyola University Chicago
Extracted bacterial DNA from simulated aquatic samples.
Amplified DNA for genomic analysis using PCR
Discussed significance of data with lab mentor
Loyola University Research Volunteer Fall 2011-Spring 2012
Loyola University Chicago
Sanitized lab equipment such as beakers, test tubes, and Erlenmeyer flasks
Organized bench areas to ensure lab safety
Completed training in sample collection, DNA amplification, DNA extraction, solution pipetting, gel
electrophoresis preparation, downstream applications, agar preparation, and lab record keeping
Instructed in proper operation of equipment such as PCR thermal cycler, centrifuge, UV trans illuminator,
and test tube vortex
SKILLS:
Native Arabic and English speaker
Concise and efficient communicator
Research data interpretation
MARK311 Final White Paper Deliverable Neier
BowTie Cause Marketing Research 122 Cho, Garton, Khosa, Milord, Martini
MARK311 Final White Paper Deliverable Neier
BowTie Cause Marketing Research 123 Cho, Garton, Khosa, Milord, Martini
RaShelle Garton Chicago, IL Phone: (858) 232-8755 E-Mail: [email protected]
1
Objective Detail-oriented finance student with excellent customer service skills seeking to pursue a career in financial and statistical data
analysis while continuously learning and gaining experience.
Key Skills PeopleSoft
SPSS Software
Microsoft Office Suite
Leadership and management skills
Problem solver with a positive work ethic
Results oriented
Dedicated with a desire to learn
Cooperative team player
Optimal time management abilities
Confident and assertive
Education
Expected 12/2014
Loyola University Chicago
Quinlan School of Business: BBA in Finance
Relevant Coursework:
Financial Institutions – Studied and researched interest rate risk, securitization managing risk, product diversification, bank
holding companies, liquidity risk management, and the economies of scope and scale topics.
Business Information Systems - Studied and researched the purpose and composition of information systems, the utilization of
technology, and actively developed business applications using productivity tools.
Business Writing – Wrote business letters, memos, emails, presentations, and reports using MS Word and PowerPoint with
tight deadlines.
Financial Accounting - Studied and researched the accounting cycle, assets, liabilities, owners' equity, net income, cash flows,
financial statements, required disclosures, taxation, and auditing.
Managerial Accounting - Studied internal decision marketing, product costing, cost-volume-profit analysis, budgetary control,
and incremental analysis.
Business Statistics – Learned how to use SPSS software. Studied and researched constructing and interpreting a scatter plot, joint
frequency table, and various types of bar charts, computing the coefficient of variation and z -scores, formulating null and
alternative hypotheses, and understanding the basic assumptions behind single and multiple regression models.
Experience
BJ’s Restaurants Inc., Carlsbad, CA
Server 10/2009 – 07/2012
Collected payments and processed transactions for parties of up to 40 guests.
Provided education about the food and beverage menu, ingredients, and food preparation.
Checked patrons’ identification to ensure that they met the minimum age requirement for alcohol consumption.
Collaborated with the management and service team to improve workflow and quality of customer service provided.
Islands Restaurants, Encinitas, CA
Server 05/2008 – 05/2011
Greeted guests in a professional manner and provided excellent customer service.
Prepared checks that itemize and total meal costs and sales taxes.
Supervised assigned waiting area and ensured tables were clean and cleared according to the facility’s sanitation standards.
Assisted host or hostess by answering phones to take reservations or to-go orders, and by greeting, seating, and thanking guests.