Embed Size (px)
Citation preview
WEBSHOPPERS 201634TH EDITION
www.ebit.com.br www.buscapecompany.com
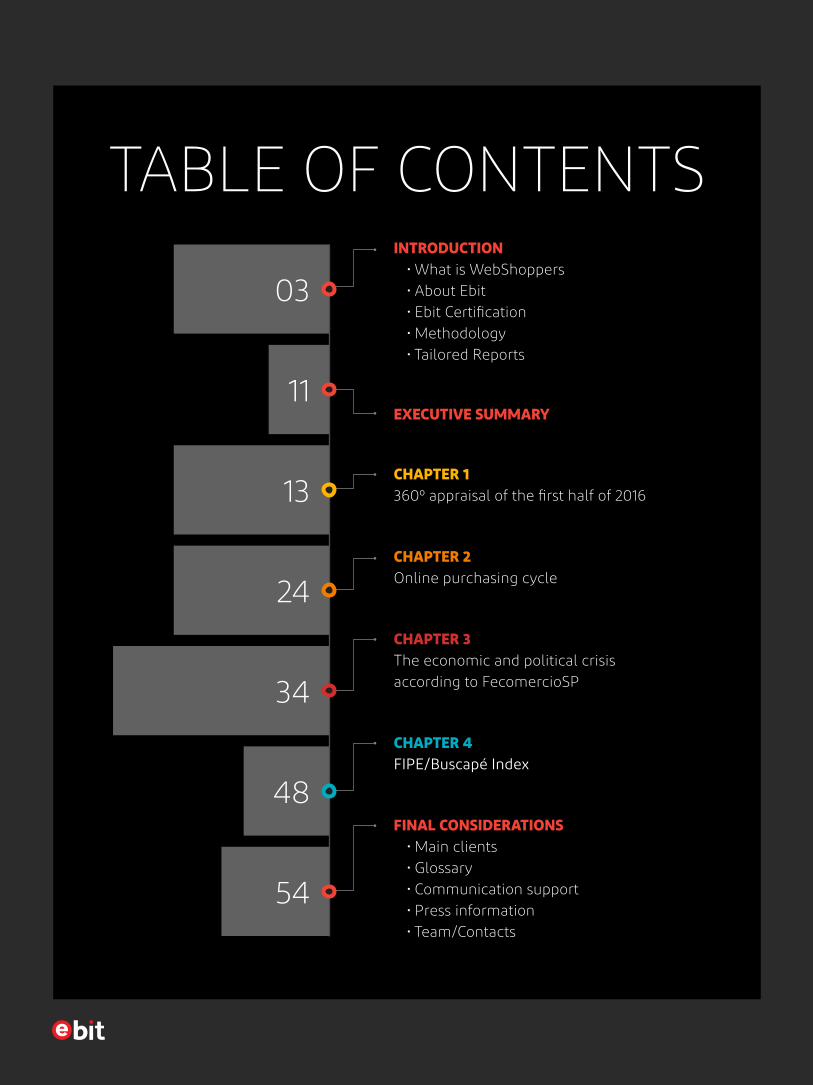
TABLE OF CONTENTSINTRODUCTION
• What is WebShoppers • About Ebit • Ebit Certification
• Methodology • Tailored Reports
EXECUTIVE SUMMARY
CHAPTER 1 360º appraisal of the first half of 2016
CHAPTER 2 Online purchasing cycle
CHAPTER 3 The economic and political crisis according to FecomercioSP
CHAPTER 4 FIPE/Buscapé Index
FINAL CONSIDERATIONS • Main clients • Glossary • Communication support
• Press information • Team/Contacts
03
24
11
34
13
48
54
INTRODUCTION
3
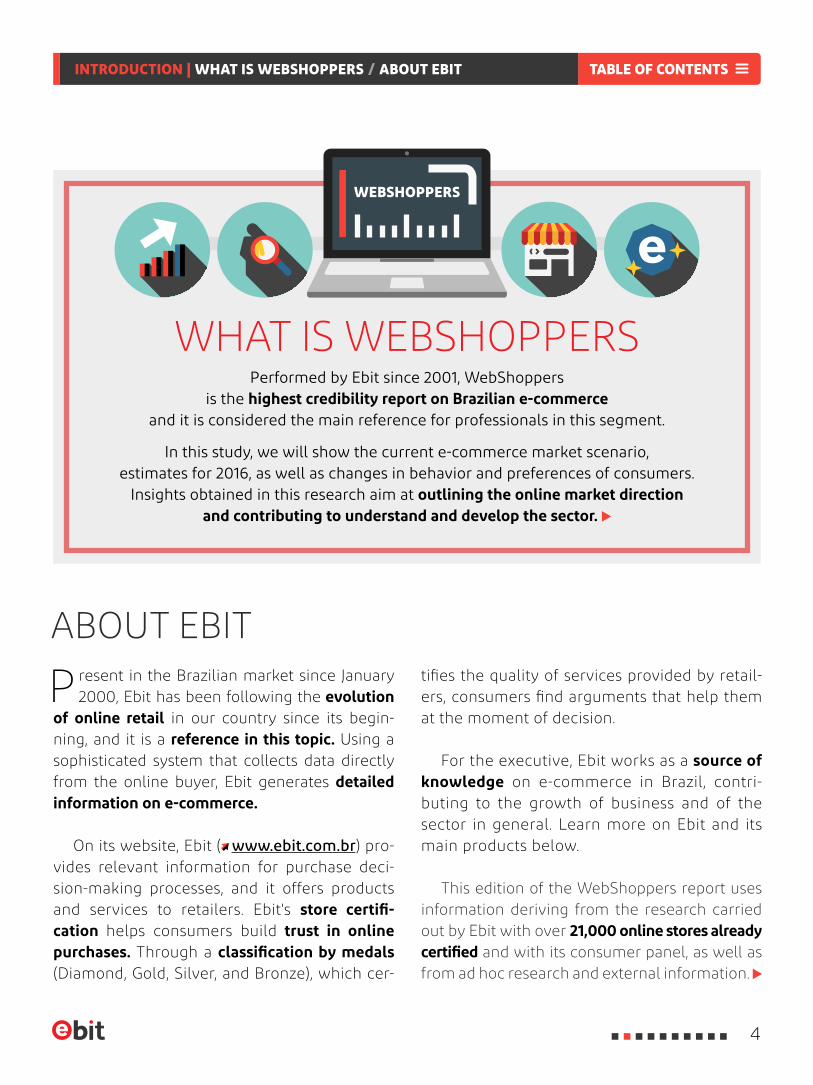
WHAT IS WEBSHOPPERSPerformed by Ebit since 2001, WebShoppers
is the highest credibility report on Brazilian e-commerce and it is considered the main reference for professionals in this segment.
In this study, we will show the current e-commerce market scenario,estimates for 2016, as well as changes in behavior and preferences of consumers.
Insights obtained in this research aim at outlining the online market direction and contributing to understand and develop the sector.
P resent in the Brazilian market since January 2000, Ebit has been following the evolution
of online retail in our country since its begin-ning, and it is a reference in this topic. Using a sophisticated system that collects data directly from the online buyer, Ebit generates detailed information on e-commerce.
On its website, Ebit ( www.ebit.com.br) pro-vides relevant information for purchase deci-sion-making processes, and it offers products and services to retailers. Ebit's store certifi-cation helps consumers build trust in online purchases. Through a classification by medals (Diamond, Gold, Silver, and Bronze), which cer-
tifies the quality of services provided by retail-ers, consumers find arguments that help them at the moment of decision.
For the executive, Ebit works as a source of knowledge on e-commerce in Brazil, contri- buting to the growth of business and of the sector in general. Learn more on Ebit and its main products below.
This edition of the WebShoppers report uses information deriving from the research carried out by Ebit with over 21,000 online stores already certified and with its consumer panel, as well as from ad hoc research and external information.
ABOUT EBIT
WEBSHOPPERS
TABLE OF CONTENTS
4
INTRODUCTION | WHAT IS WEBSHOPPERS / ABOUT EBIT
0976 8765 6543 0987
09 17
Pesquisa E-bit
DIAMOND BRONZESILVERGOLD
E bit has partnerships with over 21,000 online stores. Once the con-
sumers complete a purchase on one of these stores, they are invited to answer a survey. There are three steps: one im-mediately after the effective purchase and another some days after, to assess delivery, and the third one is about product usability. The process is auto-matic and simple, done over the Inter-net. Through these evaluations, Ebit calculates a score for each store and classifies them by medals (Diamond, Gold, Silver, and Bronze).
EBIT CERTIFICATION
METHODOLOGY
BENEFITS FOR CONSUMERS
S ince January, 2000, Ebit has already collected over 25 million questionnaires, answered af-
ter the online purchase process, and over 300,000 new questionnaires are added to this value on a monthly basis. This compiled information gener-ates monthly Business Intelligence reports that indicate the social demographic profile of the e-consumer, as well as the most sold products, most frequently used means of payment, re-pur-chase indicators, among other pieces of informa-tion. Through another WebShoppers edition, Ebit wishes to continue to contribute to developing In-ternet and e-commerce in Brazil.
T he Ebit Store classification builds trust in online purchases and en-
sures a higher quality service for all users. Through the medal classifica-tion, which verify the quality of the services provided by the retailers, the consumer finds arguments that help them at the moment of decision.
Pesquisa E-bit
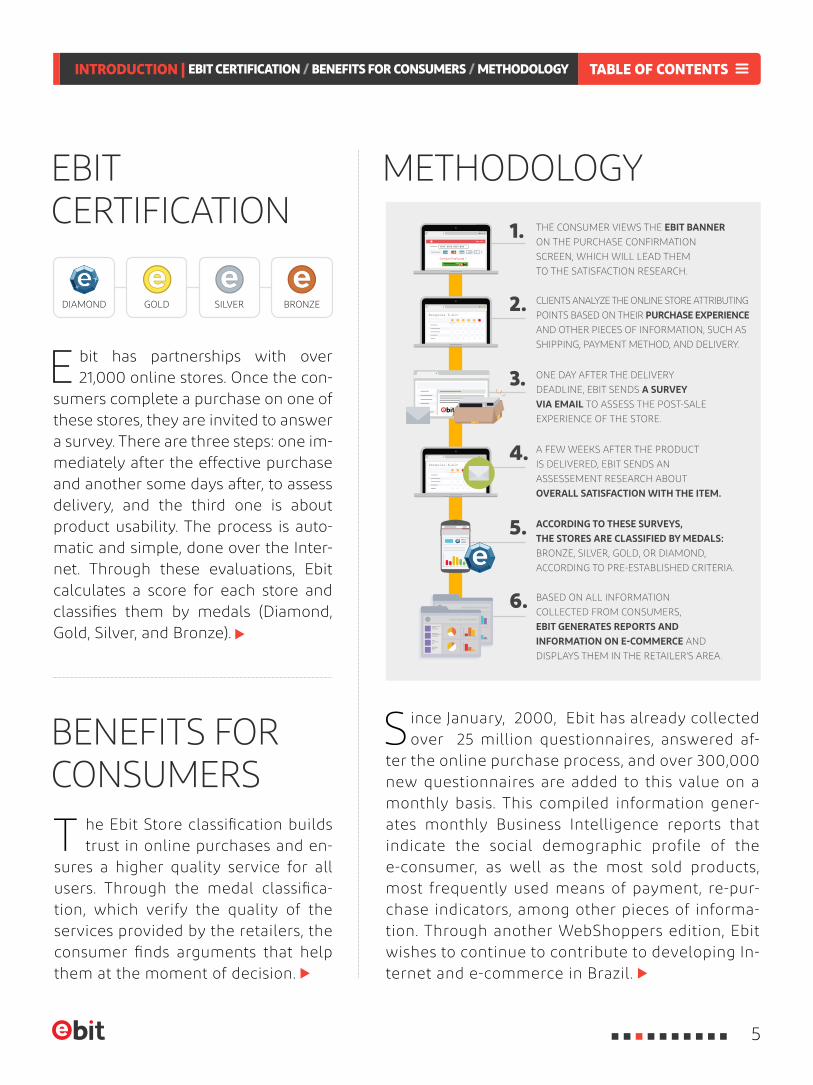
THE CONSUMER VIEWS THE EBIT BANNER ON THE PURCHASE CONFIRMATION
SCREEN, WHICH WILL LEAD THEM
TO THE SATISFACTION RESEARCH.
ONE DAY AFTER THE DELIVERY
DEADLINE, EBIT SENDS A SURVEY VIA EMAIL TO ASSESS THE POST-SALE
EXPERIENCE OF THE STORE.
ACCORDING TO THESE SURVEYS, THE STORES ARE CLASSIFIED BY MEDALS: BRONZE, SILVER, GOLD, OR DIAMOND,
ACCORDING TO PRE-ESTABLISHED CRITERIA.
BASED ON ALL INFORMATION
COLLECTED FROM CONSUMERS, EBIT GENERATES REPORTS AND INFORMATION ON E-COMMERCE AND
DISPLAYS THEM IN THE RETAILER'S AREA.
CLIENTS ANALYZE THE ONLINE STORE ATTRIBUTING
POINTS BASED ON THEIR PURCHASE EXPERIENCE
AND OTHER PIECES OF INFORMATION, SUCH AS
SHIPPING, PAYMENT METHOD, AND DELIVERY.
A FEW WEEKS AFTER THE PRODUCT
IS DELIVERED, EBIT SENDS AN
ASSESSEMENT RESEARCH ABOUT
OVERALL SATISFACTION WITH THE ITEM.
1.
4.
2.
5.
6.
3.
TABLE OF CONTENTS
5
INTRODUCTION | EBIT CERTIFICATION / BENEFITS FOR CONSUMERS / METHODOLOGY
BI-YEARLY
MONTHLY
DAILY
6
1
The questionnaires, answered on a daily basis by consumers, feed Ebit's databa-
se, and by cross checking this information, the company has valuable reports which outli-ne consumer profile and also comparatively analyze the services provided by online stores, regarding points such as delivery, product pri-ce, means of payment, NPS®, among others.
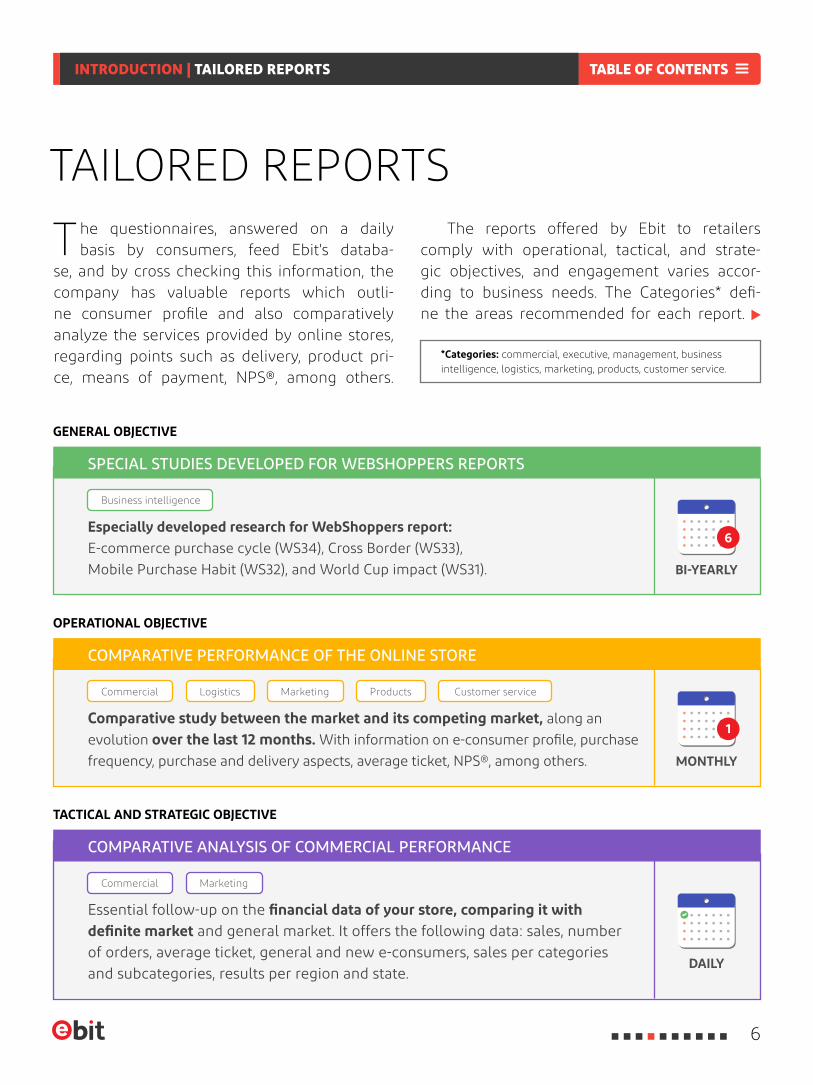
The reports offered by Ebit to retailers comply with operational, tactical, and strate-gic objectives, and engagement varies accor-ding to business needs. The Categories* defi-ne the areas recommended for each report.
TAILORED REPORTS
*Categories: commercial, executive, management, business intelligence, logistics, marketing, products, customer service.
SPECIAL STUDIES DEVELOPED FOR WEBSHOPPERS REPORTS
COMPARATIVE PERFORMANCE OF THE ONLINE STORE
COMPARATIVE ANALYSIS OF COMMERCIAL PERFORMANCE
Especially developed research for WebShoppers report: E-commerce purchase cycle (WS34), Cross Border (WS33),Mobile Purchase Habit (WS32), and World Cup impact (WS31).
Comparative study between the market and its competing market, along an evolution over the last 12 months. With information on e-consumer profile, purchase frequency, purchase and delivery aspects, average ticket, NPS®, among others.
Essential follow-up on the financial data of your store, comparing it with definite market and general market. It offers the following data: sales, number of orders, average ticket, general and new e-consumers, sales per categories and subcategories, results per region and state.
GENERAL OBJECTIVE
OPERATIONAL OBJECTIVE
TACTICAL AND STRATEGIC OBJECTIVE
Business intelligence
Commercial
Commercial
Logistics Marketing
Marketing
Products Customer service
TABLE OF CONTENTS
6
INTRODUCTION | TAILORED REPORTS
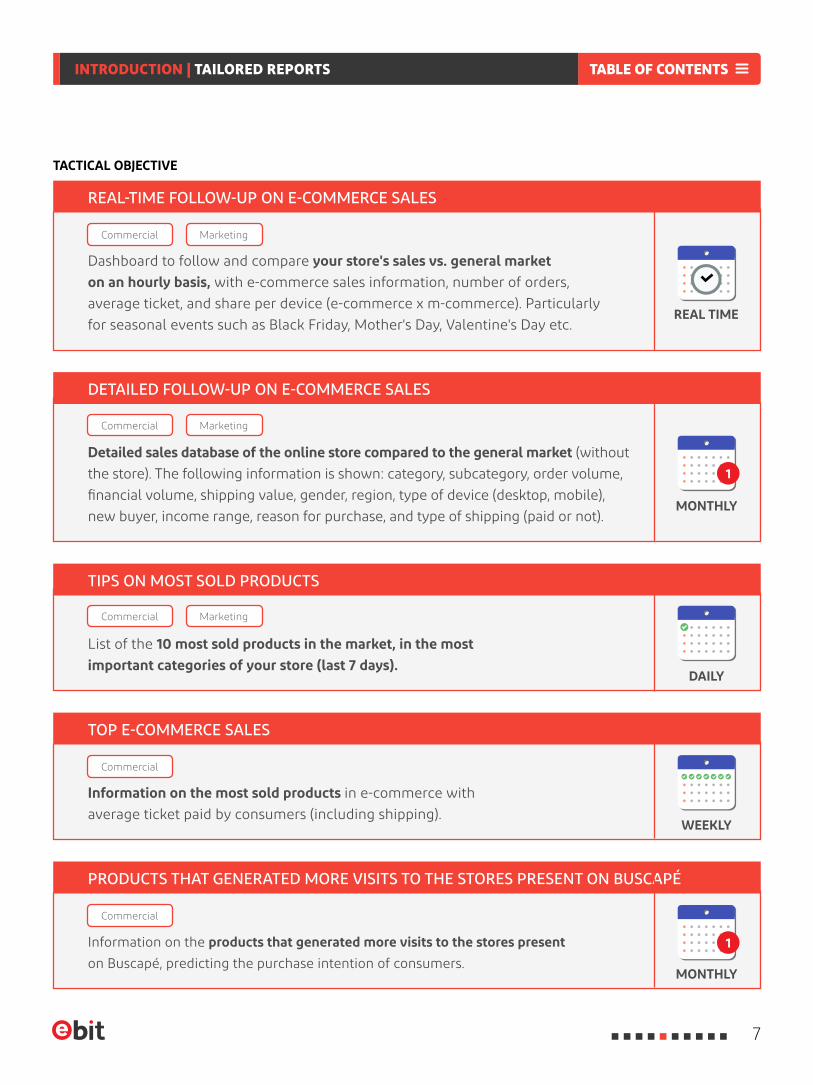
PRODUCTS THAT GENERATED MORE VISITS TO THE STORES PRESENT ON BUSCAPÉ
DAILY
MONTHLY
REAL TIME
WEEKLY
MONTHLY
1
1
REAL-TIME FOLLOW-UP ON E-COMMERCE SALES
DETAILED FOLLOW-UP ON E-COMMERCE SALES
TIPS ON MOST SOLD PRODUCTS
TOP E-COMMERCE SALES
Dashboard to follow and compare your store's sales vs. general market on an hourly basis, with e-commerce sales information, number of orders, average ticket, and share per device (e-commerce x m-commerce). Particularly for seasonal events such as Black Friday, Mother's Day, Valentine's Day etc.
Detailed sales database of the online store compared to the general market (without the store). The following information is shown: category, subcategory, order volume, financial volume, shipping value, gender, region, type of device (desktop, mobile), new buyer, income range, reason for purchase, and type of shipping (paid or not).
List of the 10 most sold products in the market, in the most important categories of your store (last 7 days).
Information on the most sold products in e-commerce with average ticket paid by consumers (including shipping).
Information on the products that generated more visits to the stores present on Buscapé, predicting the purchase intention of consumers.
TACTICAL OBJECTIVE
Commercial
Commercial
Commercial
Commercial
Commercial
Marketing
Marketing
Marketing
TABLE OF CONTENTS
7
INTRODUCTION | TAILORED REPORTS
REAL TIME
DAILY
DAILY
DAILY
WEEKLY
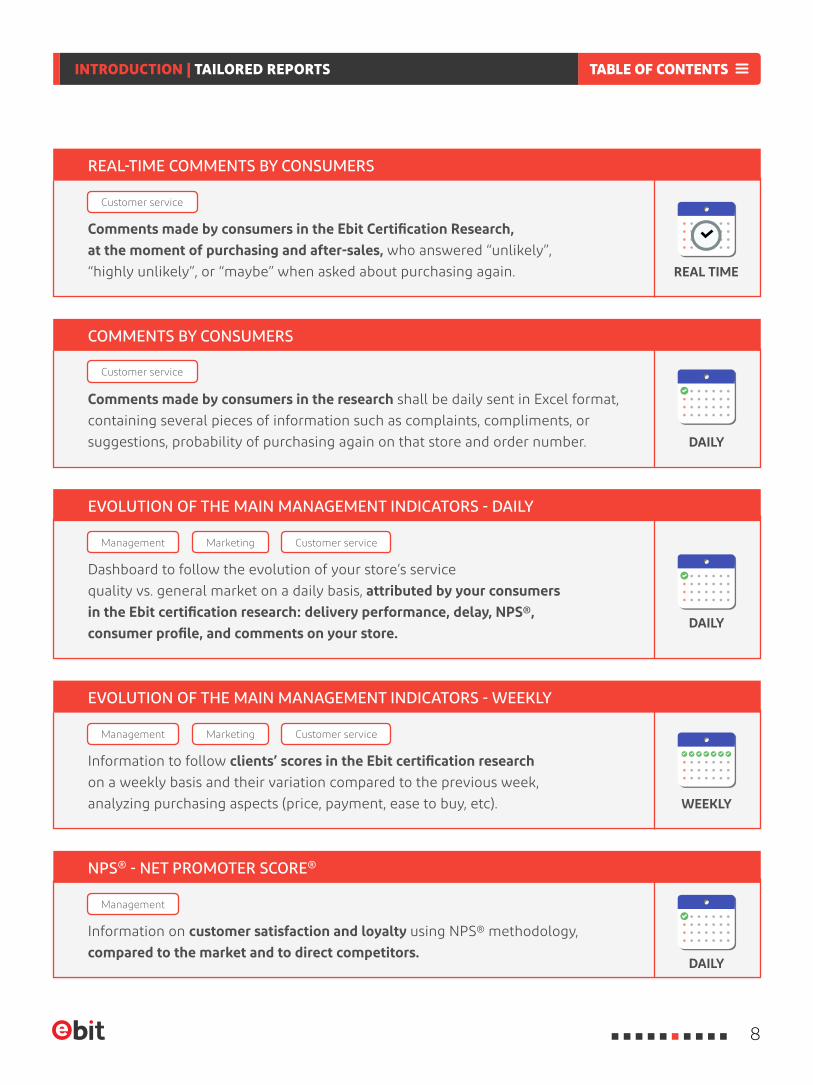
REAL-TIME COMMENTS BY CONSUMERS
COMMENTS BY CONSUMERS
EVOLUTION OF THE MAIN MANAGEMENT INDICATORS - DAILY
Comments made by consumers in the Ebit Certification Research, at the moment of purchasing and after-sales, who answered “unlikely”, “highly unlikely”, or “maybe” when asked about purchasing again.
Comments made by consumers in the research shall be daily sent in Excel format, containing several pieces of information such as complaints, compliments, or suggestions, probability of purchasing again on that store and order number.
Dashboard to follow the evolution of your store’s service quality vs. general market on a daily basis, attributed by your consumers in the Ebit certification research: delivery performance, delay, NPS®, consumer profile, and comments on your store.
Customer service
Customer service
Management
Management
Management
Customer service
Customer service
Marketing
Marketing
NPS® - NET PROMOTER SCORE®
Information on customer satisfaction and loyalty using NPS® methodology, compared to the market and to direct competitors.
EVOLUTION OF THE MAIN MANAGEMENT INDICATORS - WEEKLY
Information to follow clients’ scores in the Ebit certification research on a weekly basis and their variation compared to the previous week, analyzing purchasing aspects (price, payment, ease to buy, etc).
TABLE OF CONTENTS
8
INTRODUCTION | TAILORED REPORTS
DAILY
MONTHLY
1
MONTHLY
1
QUARTERLY
3
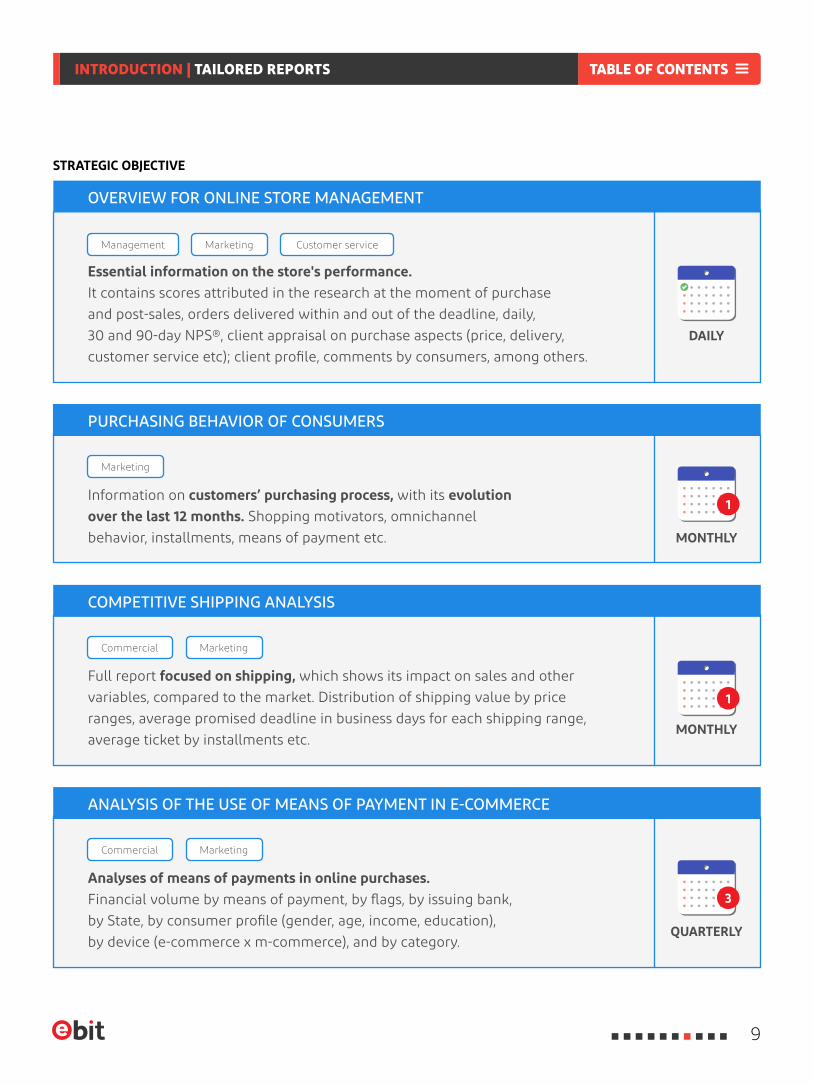
OVERVIEW FOR ONLINE STORE MANAGEMENT
COMPETITIVE SHIPPING ANALYSIS
ANALYSIS OF THE USE OF MEANS OF PAYMENT IN E-COMMERCE
PURCHASING BEHAVIOR OF CONSUMERS
Essential information on the store's performance.It contains scores attributed in the research at the moment of purchase and post-sales, orders delivered within and out of the deadline, daily, 30 and 90-day NPS®, client appraisal on purchase aspects (price, delivery, customer service etc); client profile, comments by consumers, among others.
Full report focused on shipping, which shows its impact on sales and other variables, compared to the market. Distribution of shipping value by price ranges, average promised deadline in business days for each shipping range, average ticket by installments etc.
Analyses of means of payments in online purchases.Financial volume by means of payment, by flags, by issuing bank, by State, by consumer profile (gender, age, income, education),by device (e-commerce x m-commerce), and by category.
Information on customers’ purchasing process, with its evolution over the last 12 months. Shopping motivators, omnichannel behavior, installments, means of payment etc.
STRATEGIC OBJECTIVE
Management Customer serviceMarketing
Marketing
Commercial
Commercial
Marketing
Marketing
TABLE OF CONTENTS
9
INTRODUCTION | TAILORED REPORTS
MONTHLY
MONTHLY
1
1
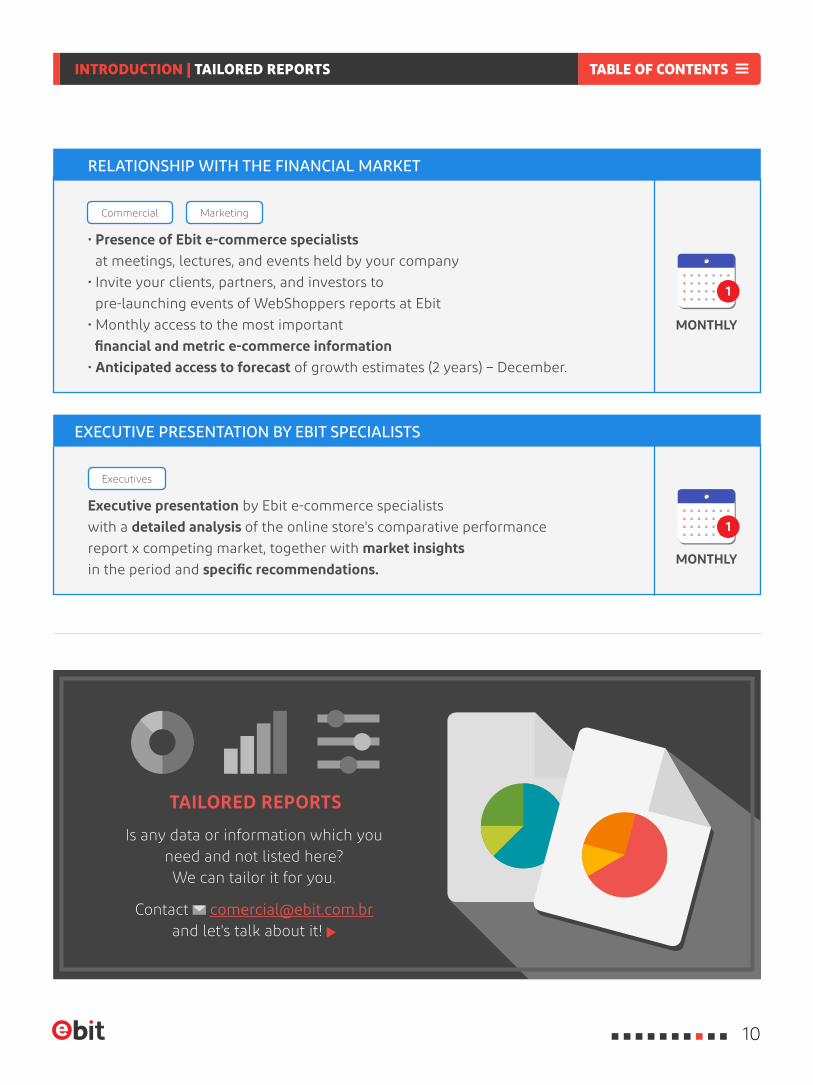
TAILORED REPORTS
Is any data or information which you need and not listed here?We can tailor it for you.
Contact [email protected]
and let's talk about it!
EXECUTIVE PRESENTATION BY EBIT SPECIALISTS
Executive presentation by Ebit e-commerce specialistswith a detailed analysis of the online store's comparative performance report x competing market, together with market insightsin the period and specific recommendations.
RELATIONSHIP WITH THE FINANCIAL MARKET
• Presence of Ebit e-commerce specialists at meetings, lectures, and events held by your company• Invite your clients, partners, and investors to pre-launching events of WebShoppers reports at Ebit• Monthly access to the most important financial and metric e-commerce information• Anticipated access to forecast of growth estimates (2 years) – December.
Commercial
Executives
Marketing
TABLE OF CONTENTS
10
INTRODUCTION | TAILORED REPORTS
T the current economic and political moment in Bra-
zil has posed several obsta-cles to the growth trajectory observed over the last years, with clear impacts on the pro-ductive activity and on em-ployment levels throughout national territory. After the adoption of a comprehensive tax policy between 2009 and 2014, Brazilian public deficit
EXECUTIVE SUMMARYges in the Government. The last two months of the first half of 2016 signaled a react- ion regarding sales recovery, which caused e-commerce market to reach a nominal growth of 5.2% in the period, with R$ 19.6 billion in sales.
The main e-commerce high-lights of the first half of the year are outlined on the next page.
increased substantially, espe-cially in 2015, thus generating several obstacles and a lack of optimism by retail consumers in the country.
Following this unfavorable scenario, Brazilian e-commer- ce did not show any growth in the first months of the year, when it started to show some reaction after a few chan-
TABLE OF CONTENTS
11
INTRODUCTION | EXECUTIVE SUMMARY
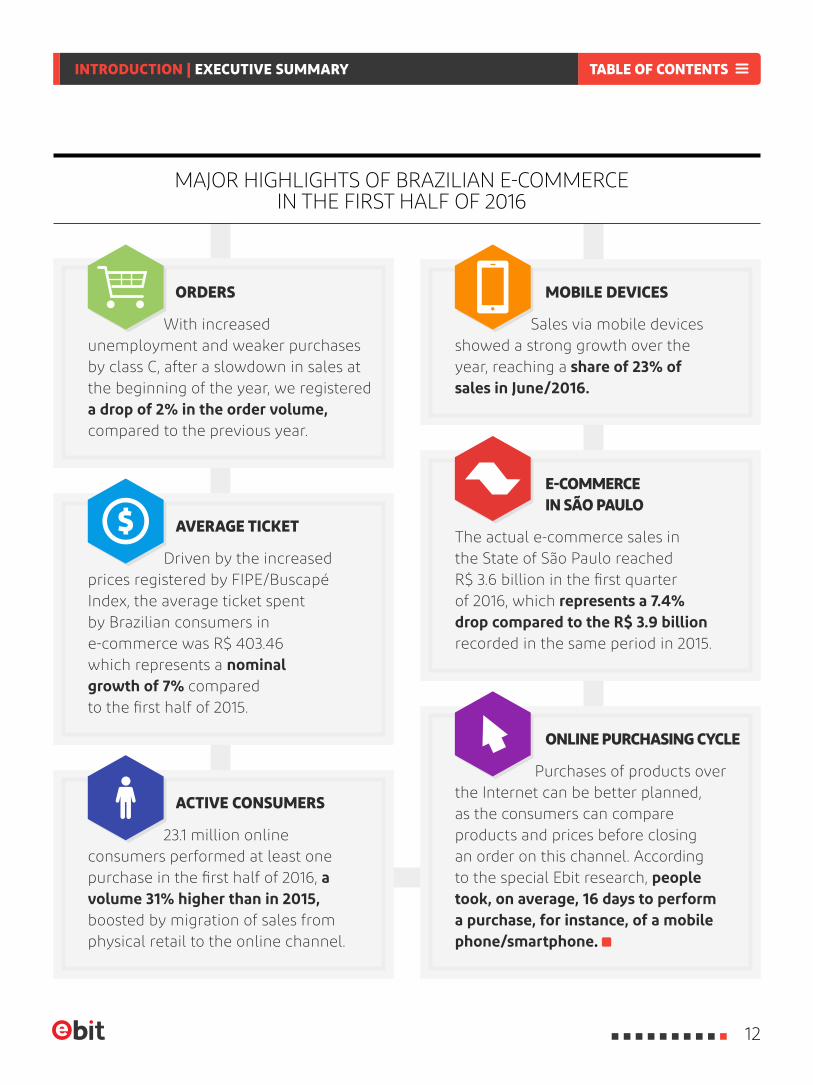
MAJOR HIGHLIGHTS OF BRAZILIAN E-COMMERCE IN THE FIRST HALF OF 2016
Driven by the increased prices registered by FIPE/Buscapé Index, the average ticket spent by Brazilian consumers in e-commerce was R$ 403.46 which represents a nominal growth of 7% compared to the first half of 2015.
23.1 million online consumers performed at least one purchase in the first half of 2016, a volume 31% higher than in 2015, boosted by migration of sales from physical retail to the online channel.
ORDERS
AVERAGE TICKET
ACTIVE CONSUMERS
With increased unemployment and weaker purchases by class C, after a slowdown in sales at the beginning of the year, we registered a drop of 2% in the order volume, compared to the previous year.
The actual e-commerce sales in the State of São Paulo reached R$ 3.6 billion in the first quarter of 2016, which represents a 7.4% drop compared to the R$ 3.9 billion recorded in the same period in 2015.
Sales via mobile devices showed a strong growth over the year, reaching a share of 23% of sales in June/2016.
E-COMMERCE IN SÃO PAULO
MOBILE DEVICES
ONLINE PURCHASING CYCLE
Purchases of products over the Internet can be better planned, as the consumers can compare products and prices before closing an order on this channel. According to the special Ebit research, people took, on average, 16 days to perform a purchase, for instance, of a mobile phone/smartphone.
TABLE OF CONTENTS
12
INTRODUCTION | EXECUTIVE SUMMARY

CHAPTER 1
13
360º APPRAISAL OF THE FIRST
HALF OF 2016
360º APPRAISAL OF THE FIRST HALF OF 2016
I n addition to the challenges of the macro-economic moment of the country, online re-tail was affected in the first half of 2016 by
increased product prices, as registered by the FIPE/Buscapé Index (chapter IV), changes in the ICMS billing model, and also by the downfall if
AMIDST A TROUBLED POLITICAL AND ECONOMIC MOMENT IN BRAZIL, E-COMMERCE IN THE FIRST HALF OF THE YEAR WAS MARKED BY THE FACT THAT
MANY COMPANIES IN THE SECTOR HAD TO RETHINK THEIR STRATEGIES AND REVIEW THEIR EXPENSES IN SEARCH FOR SURVIVAL AND GROWTH
the “Good Law”, which ensured a zero PIS/Cofins aliquot for computing and telecom products (In summary increasing taxes).
In this scenario, the solution for companies in the sector was to improve online consumer
TABLE OF CONTENTSCHAPTER 1 | 360º APPRAISAL OF THE FIRST HALF OF 2016
14
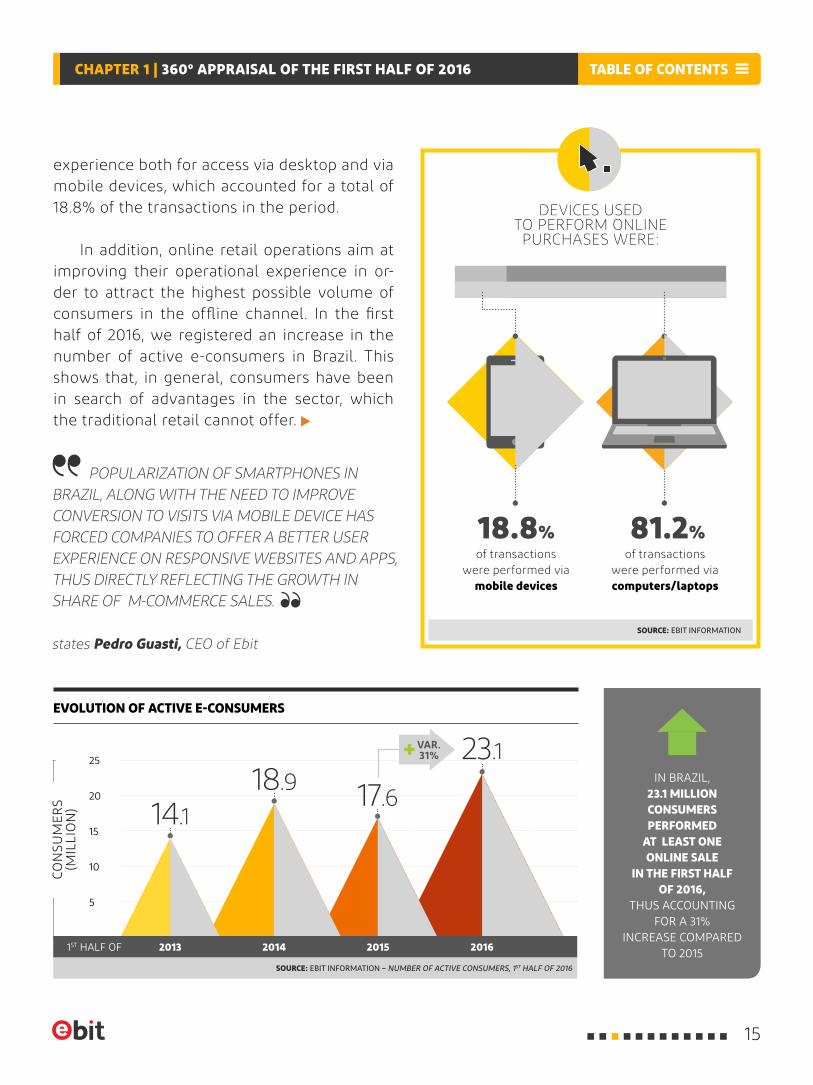
experience both for access via desktop and via mobile devices, which accounted for a total of 18.8% of the transactions in the period.
In addition, online retail operations aim at improving their operational experience in or-der to attract the highest possible volume of consumers in the offline channel. In the first half of 2016, we registered an increase in the number of active e-consumers in Brazil. This shows that, in general, consumers have been in search of advantages in the sector, which the traditional retail cannot offer.
POPULARIZATION OF SMARTPHONES IN BRAZIL, ALONG WITH THE NEED TO IMPROVECONVERSION TO VISITS VIA MOBILE DEVICE HAS FORCED COMPANIES TO OFFER A BETTER USER EXPERIENCE ON RESPONSIVE WEBSITES AND APPS, THUS DIRECTLY REFLECTING THE GROWTH IN SHARE OF M-COMMERCE SALES.
states Pedro Guasti, CEO of Ebit
IN BRAZIL, 23.1 MILLION CONSUMERS PERFORMED
AT LEAST ONE ONLINE SALE
IN THE FIRST HALF OF 2016,
THUS ACCOUNTING FOR A 31%
INCREASE COMPARED TO 2015
of transactionswere performed via
mobile devices
of transactionswere performed via computers/laptops
DEVICES USED TO PERFORM ONLINE
PURCHASES WERE:
81.2%18.8%
EVOLUTION OF ACTIVE E-CONSUMERS
SOURCE: EBIT INFORMATION – NUMBER OF ACTIVE CONSUMERS, 1ST HALF OF 2016
10
15
5
20
25
CON
SUM
ERS
(MIL
LIO
N)
VAR. 31%
20131ST HALF OF 2014 2015 2016
14.118.9 17.6
23.1
SOURCE: EBIT INFORMATION
TABLE OF CONTENTSCHAPTER 1 | 360º APPRAISAL OF THE FIRST HALF OF 2016
15
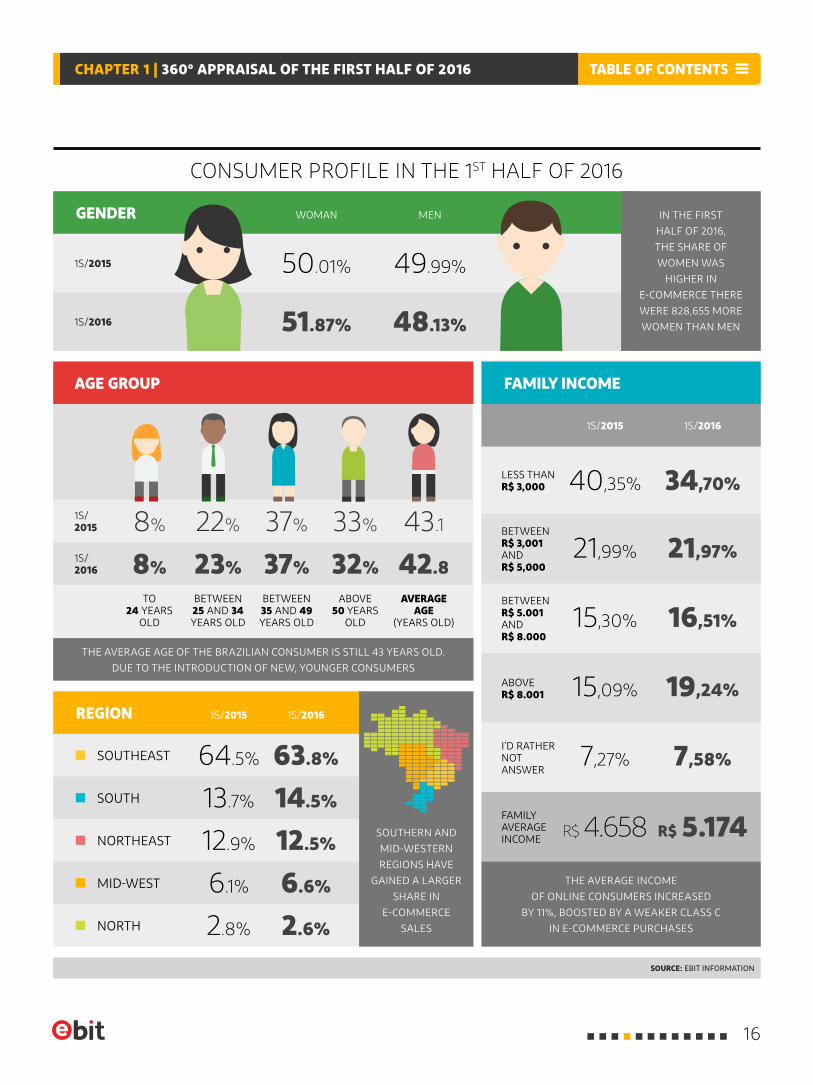
CONSUMER PROFILE IN THE 1ST HALF OF 2016
SOURCE: EBIT INFORMATION
REGION
WOMAN
1S/2016
1S/ 2015
1S/ 2016
1S/2015
MEN
49.99%50.01%
48.13%51.87%
TO 24 YEARS
OLD
BETWEEN 25 AND 34 YEARS OLD
ABOVE 50 YEARS
OLD
AVERAGE AGE
(YEARS OLD)
BETWEEN 35 AND 49 YEARS OLD
8%
8%
22%
23%
37%
37%
33%
32%
43.1
42.8
FAMILYAVERAGEINCOME
THE AVERAGE INCOME
OF ONLINE CONSUMERS INCREASED
BY 11%, BOOSTED BY A WEAKER CLASS C
IN E-COMMERCE PURCHASES
THE AVERAGE AGE OF THE BRAZILIAN CONSUMER IS STILL 43 YEARS OLD.
DUE TO THE INTRODUCTION OF NEW, YOUNGER CONSUMERS
LESS THAN R$ 3,000
BETWEEN R$ 3,001 AND R$ 5,000
ABOVE R$ 8.001
I’D RATHER NOTANSWER
BETWEEN R$ 5.001 AND R$ 8.000
SOUTHEAST
SOUTH
NORTHEAST
MID-WEST
NORTH
FAMILY INCOME
SOUTHERN AND
MID-WESTERN
REGIONS HAVE
GAINED A LARGER
SHARE IN
E-COMMERCE
SALES
IN THE FIRST
HALF OF 2016,
THE SHARE OF
WOMEN WAS
HIGHER IN
E-COMMERCE THERE
WERE 828,655 MORE
WOMEN THAN MEN
GENDER
1S/2015 1S/2016
AGE GROUP
64.5%
13.7%
12.9%
6.1%
2.8%
63.8%
14.5%
12.5%
6.6%
2.6%
1S/2015
R$ 4.658
40,35%
21,99%
15,30%
15,09%
7,27%
1S/2016
R$ 5.174
34,70%
21,97%
16,51%
19,24%
7,58%
TABLE OF CONTENTSCHAPTER 1 | 360º APPRAISAL OF THE FIRST HALF OF 2016
16
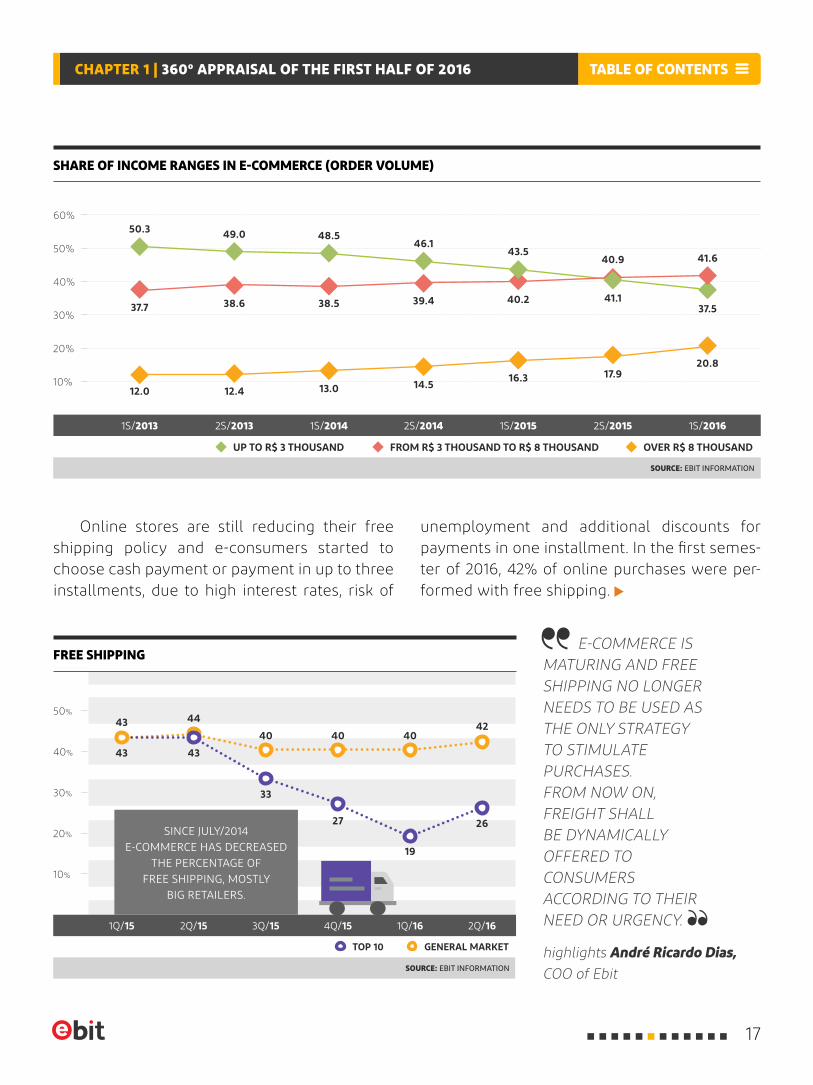
unemployment and additional discounts for payments in one installment. In the first semes-ter of 2016, 42% of online purchases were per-formed with free shipping.
E-COMMERCE IS MATURING AND FREE SHIPPING NO LONGER NEEDS TO BE USED AS THE ONLY STRATEGY TO STIMULATE PURCHASES. FROM NOW ON, FREIGHT SHALL BE DYNAMICALLY OFFERED TO CONSUMERS ACCORDING TO THEIR NEED OR URGENCY.
Online stores are still reducing their free shipping policy and e-consumers started to choose cash payment or payment in up to three installments, due to high interest rates, risk of
highlights André Ricardo Dias, COO of Ebit
SHARE OF INCOME RANGES IN E-COMMERCE (ORDER VOLUME)
SOURCE: EBIT INFORMATION
TOP 10 GENERAL MARKET
30%
50%
20%
10%
40% 43
33
19
43
27 26
4340 40
44
4042
1Q/15 3Q/152Q/15 4Q/15 2Q/161Q/16
SOURCE: EBIT INFORMATION
UP TO R$ 3 THOUSAND FROM R$ 3 THOUSAND TO R$ 8 THOUSAND OVER R$ 8 THOUSAND
1S/2013 1S/20162S/20151S/20152S/20141S/20142S/2013
FREE SHIPPING
10%
30%
50%
20%
40%
60%
SINCE JULY/2014 E-COMMERCE HAS DECREASED
THE PERCENTAGE OF FREE SHIPPING, MOSTLY
BIG RETAILERS.
50.348.5
43.5
49.046.1
41.1
41.6
38.5 40.238.6 39.4
40.9
37.537.7
12.0 12.4 13.0 14.516.3 17.9
20.8
TABLE OF CONTENTSCHAPTER 1 | 360º APPRAISAL OF THE FIRST HALF OF 2016
17
SOURCE: EBIT INFORMATION
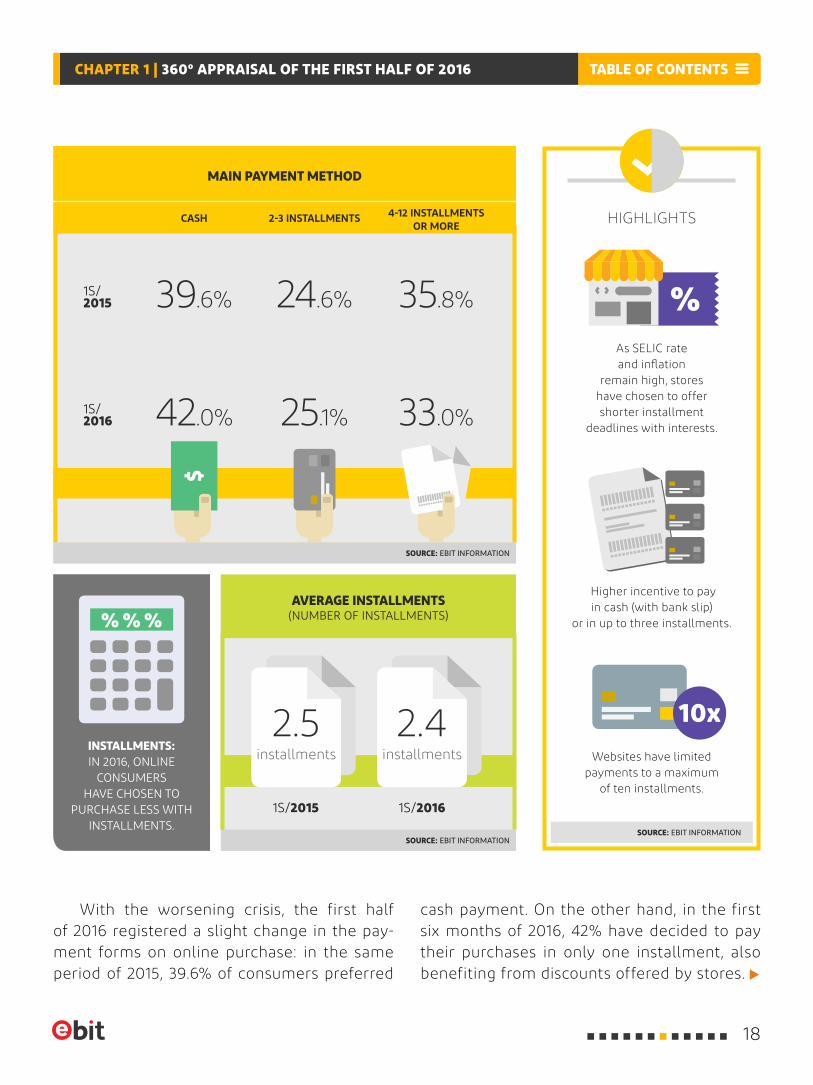
With the worsening crisis, the first half of 2016 registered a slight change in the pay-ment forms on online purchase: in the same period of 2015, 39.6% of consumers preferred
cash payment. On the other hand, in the first six months of 2016, 42% have decided to pay their purchases in only one installment, also benefiting from discounts offered by stores.
HIGHLIGHTS
As SELIC rate and inflation
remain high, stores have chosen to offer shorter installment
deadlines with interests.
Higher incentive to pay in cash (with bank slip)
or in up to three installments.
Websites have limited payments to a maximum
of ten installments.
SOURCE: EBIT INFORMATION
INSTALLMENTS:IN 2016, ONLINE
CONSUMERS HAVE CHOSEN TO
PURCHASE LESS WITH INSTALLMENTS.
AVERAGE INSTALLMENTS(NUMBER OF INSTALLMENTS)
MAIN PAYMENT METHOD
CASH 2-3 INSTALLMENTS 4-12 INSTALLMENTS OR MORE
2.5installments
2.4installments
39.6%
42.0%
24.6%
25.1%
35.8%
33.0%
1S/2015 1S/2016
1S/2015
1S/2016
SOURCE: EBIT INFORMATION
TABLE OF CONTENTSCHAPTER 1 | 360º APPRAISAL OF THE FIRST HALF OF 2016
18
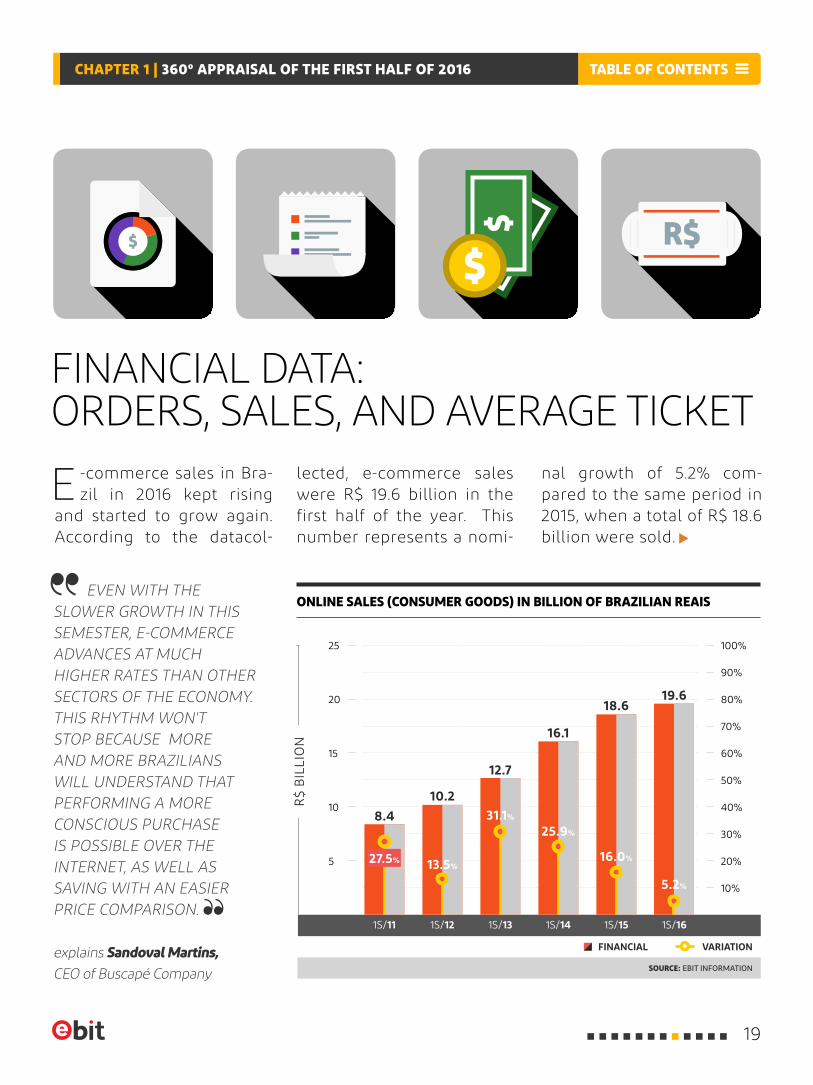
FINANCIAL DATA: ORDERS, SALES, AND AVERAGE TICKET
E -commerce sales in Bra-zil in 2016 kept rising
and started to grow again. According to the datacol-
EVEN WITH THE SLOWER GROWTH IN THIS SEMESTER, E-COMMERCE ADVANCES AT MUCH HIGHER RATES THAN OTHER SECTORS OF THE ECONOMY. THIS RHYTHM WON'T STOP BECAUSE MORE AND MORE BRAZILIANS WILL UNDERSTAND THAT PERFORMING A MORE CONSCIOUS PURCHASE IS POSSIBLE OVER THE INTERNET, AS WELL AS SAVING WITH AN EASIER PRICE COMPARISON.
explains Sandoval Martins, CEO of Buscapé Company
lected, e-commerce sales were R$ 19.6 billion in the first half of the year. This number represents a nomi-
nal growth of 5.2% com-pared to the same period in 2015, when a total of R$ 18.6 billion were sold.
ONLINE SALES (CONSUMER GOODS) IN BILLION OF BRAZILIAN REAIS
SOURCE: EBIT INFORMATION
FINANCIAL VARIATION
10
30%
20
70%
60%
40%
80%
5 20%
10%
15
50%
25
90%
100%
R$
BIL
LIO
N
1S/11 1S/141S/13 1S/161S/12 1S/15
27.5%
8.4
12.7
18.6
10.2
16.1
19.6
31.1%
16.0%13.5%
25.9%
5.2%
TABLE OF CONTENTSCHAPTER 1 | 360º APPRAISAL OF THE FIRST HALF OF 2016
19
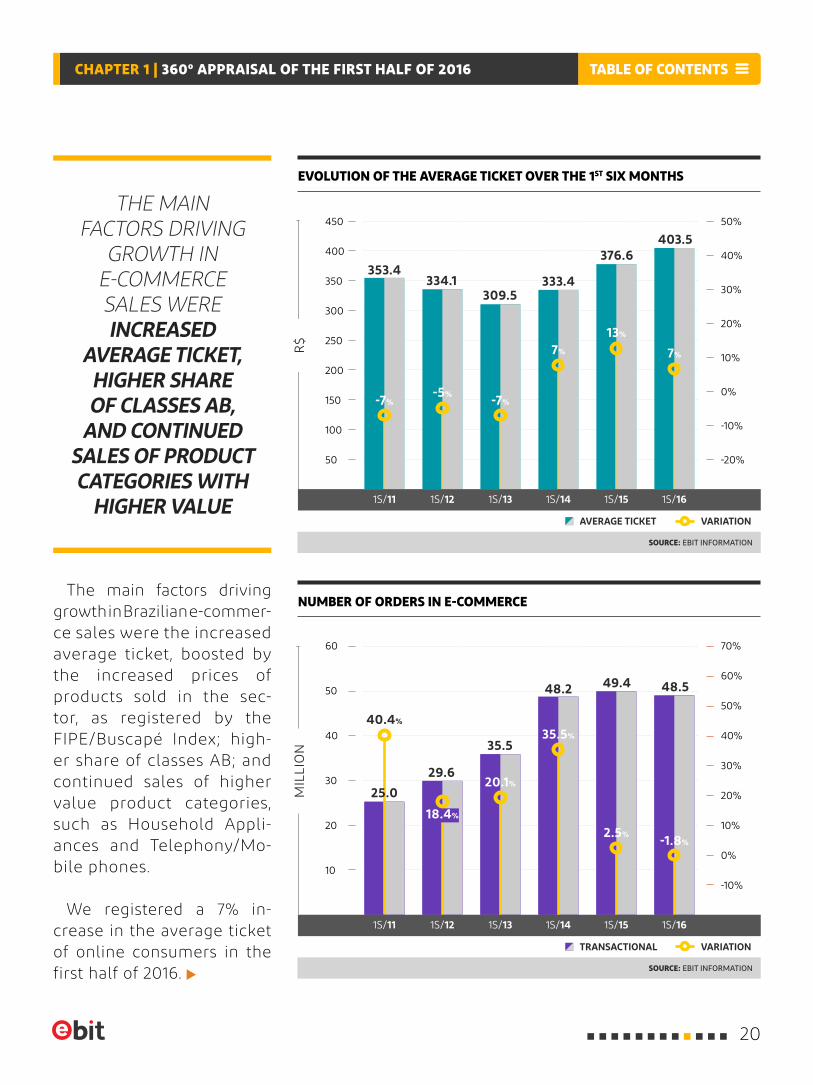
The main factors driving growth in Brazilian e-commer- ce sales were the increased average ticket, boosted by the increased prices of products sold in the sec-tor, as registered by the FIPE/Buscapé Index; high-er share of classes AB; and continued sales of higher value product categories, such as Household Appli-ances and Telephony/Mo-bile phones.
We registered a 7% in-crease in the average ticket of online consumers in the first half of 2016.
THE MAIN FACTORS DRIVING
GROWTH IN E-COMMERCE SALES WERE INCREASED
AVERAGE TICKET, HIGHER SHARE OF CLASSES AB,
AND CONTINUED SALES OF PRODUCT CATEGORIES WITH
HIGHER VALUE
EVOLUTION OF THE AVERAGE TICKET OVER THE 1ST SIX MONTHS
NUMBER OF ORDERS IN E-COMMERCE
SOURCE: EBIT INFORMATION
SOURCE: EBIT INFORMATION
AVERAGE TICKET
TRANSACTIONAL
VARIATION
-20%
-10%
20%
30%
10%
20%
-10%
0%
30%
40%
0%
10%
450
60
350
40
250
20
150
50
400
50
300
30
200
10
100
40%
50%
50%
60%
70%
R$
MIL
LIO
N
VARIATION
353.4
309.5
376.6
334.1 333.4
403.5
25.0
35.5
49.4
29.6
48.2 48.5
40.4%
1S/11 1S/141S/13 1S/161S/12 1S/15
18.4%
-5% -7%
7%
13%
7%
-7%
20.1%
35.5%
2.5% -1.8%
1S/11 1S/141S/13 1S/161S/12 1S/15
TABLE OF CONTENTSCHAPTER 1 | 360º APPRAISAL OF THE FIRST HALF OF 2016
20
HIGHLIGHTS
MOST SOLD CATEGORIES: IN VOLUME OF ORDERS
MOST SOLD CATEGORIES: IN SALES
SOURCE: EBIT INFORMATION – 1ST HALF OF 2016
BOOKS /SUBSCRIPTIONS /
BOOKLETS
FASHION & ACCESSORIES
HOUSE & DECOR
HOUSEHOLD APPLIANCES
FASHION & ACCESSORIES
BOOKS /SUBSCRIPTIONS /
BOOKLETS
ELECTRONIC DEVICES
ELECTRONIC DEVICES
HOUSEHOLD APPLIANCES
HEALTH / COSMETICS
& PERFUMERY
COMPUTING
TELEPHONY / MOBILE PHONES
HEALTH / COSMETICS
& PERFUMERY
SPORTS& LEISURE
SPORTS& LEISURE
COMPUTING
TELEPHONY / MOBILE PHONES
AUTOMOTIVEACCESSORIES
TOYS & GAMES
HOUSE & DECOR
14%
5%
9%
24%
12%
4%
5%
12%
13%
5%
6%
20%
12%
3%
4%
10%
9%
3%
2%
7%
SOURCE: EBIT INFORMATION – 1ST HALF OF 2016
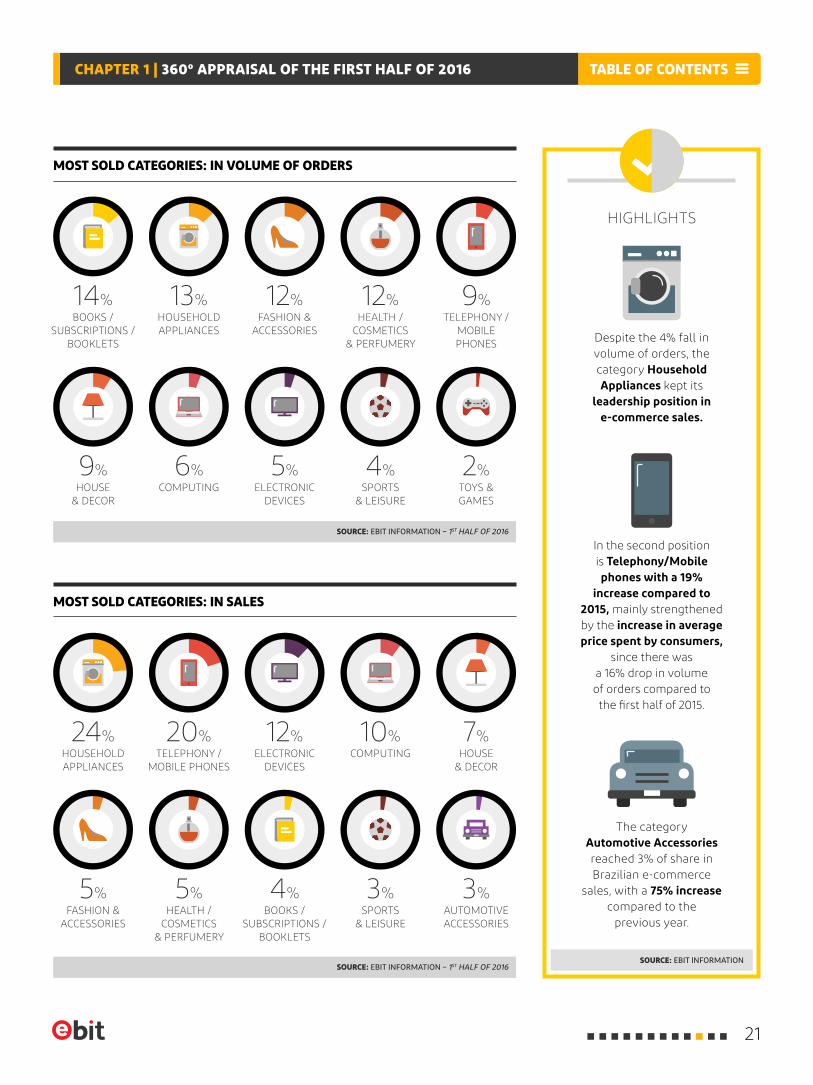
Despite the 4% fall in volume of orders, the category Household Appliances kept its
leadership position in e-commerce sales.
In the second position is Telephony/Mobile phones with a 19%
increase compared to 2015, mainly strengthened by the increase in average price spent by consumers,
since there was a 16% drop in volume of orders compared to the first half of 2015.
The category Automotive Accessories reached 3% of share in Brazilian e-commerce
sales, with a 75% increase compared to the
previous year.
SOURCE: EBIT INFORMATION
TABLE OF CONTENTSCHAPTER 1 | 360º APPRAISAL OF THE FIRST HALF OF 2016
21
DELIVERY AND SATISFACTION: NPS® AND DELIVERY DEADLINE
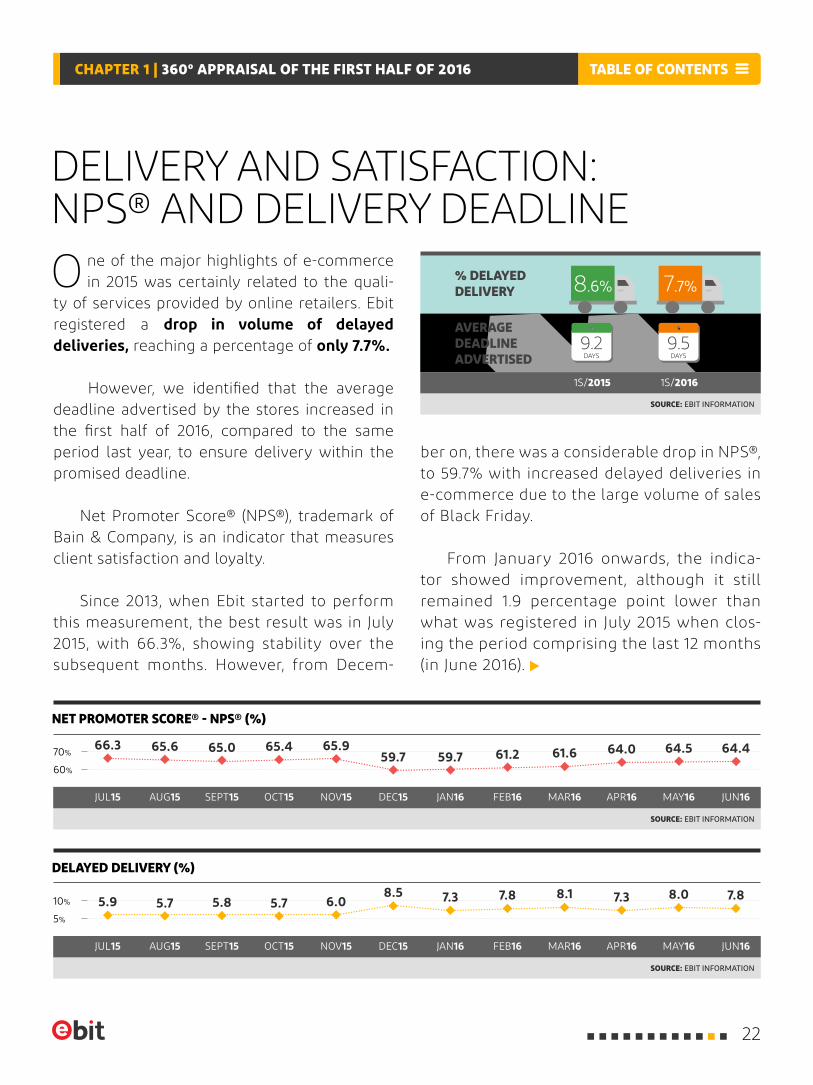
O ne of the major highlights of e-commerce in 2015 was certainly related to the quali-
ty of services provided by online retailers. Ebit registered a drop in volume of delayed deliveries, reaching a percentage of only 7.7%.
However, we identified that the average deadline advertised by the stores increased in the first half of 2016, compared to the same period last year, to ensure delivery within the promised deadline.
Net Promoter Score® (NPS®), trademark of Bain & Company, is an indicator that measures client satisfaction and loyalty.
Since 2013, when Ebit started to perform this measurement, the best result was in July 2015, with 66.3%, showing stability over the subsequent months. However, from Decem-
ber on, there was a considerable drop in NPS®, to 59.7% with increased delayed deliveries in e-commerce due to the large volume of sales of Black Friday.
From January 2016 onwards, the indica-tor showed improvement, although it still remained 1.9 percentage point lower than what was registered in July 2015 when clos-ing the period comprising the last 12 months (in June 2016).
10%
70%
5%
60%
NET PROMOTER SCORE® - NPS® (%)
DELAYED DELIVERY (%)
SOURCE: EBIT INFORMATION
SOURCE: EBIT INFORMATION
SOURCE: EBIT INFORMATION
JAN16
JAN16
JUL15
JUL15
APR16
APR16
OCT15
OCT15
FEB16
FEB16
AUG15
AUG15
MAY16
MAY16
NOV15
NOV15
MAR16
MAR16
SEPT15
SEPT15
JUN16
JUN16
DEC15
DEC15
1S/2015 1S/2016
% DELAYED DELIVERY
AVERAGE DEADLINE ADVERTISED
65.0
5.8
65.4
5.7
59.7
7.3
61.2
7.8
66.3
5.9
65.6
5.7
65.9
6.0
59.7
8.5
61.6
8.1
64.0
7.3
64.4
7.8
64.5
8.0
8.6% 7.7%
9.5DAYS
9.2DAYS
TABLE OF CONTENTSCHAPTER 1 | 360º APPRAISAL OF THE FIRST HALF OF 2016
22
PROJECTION FOR 2016
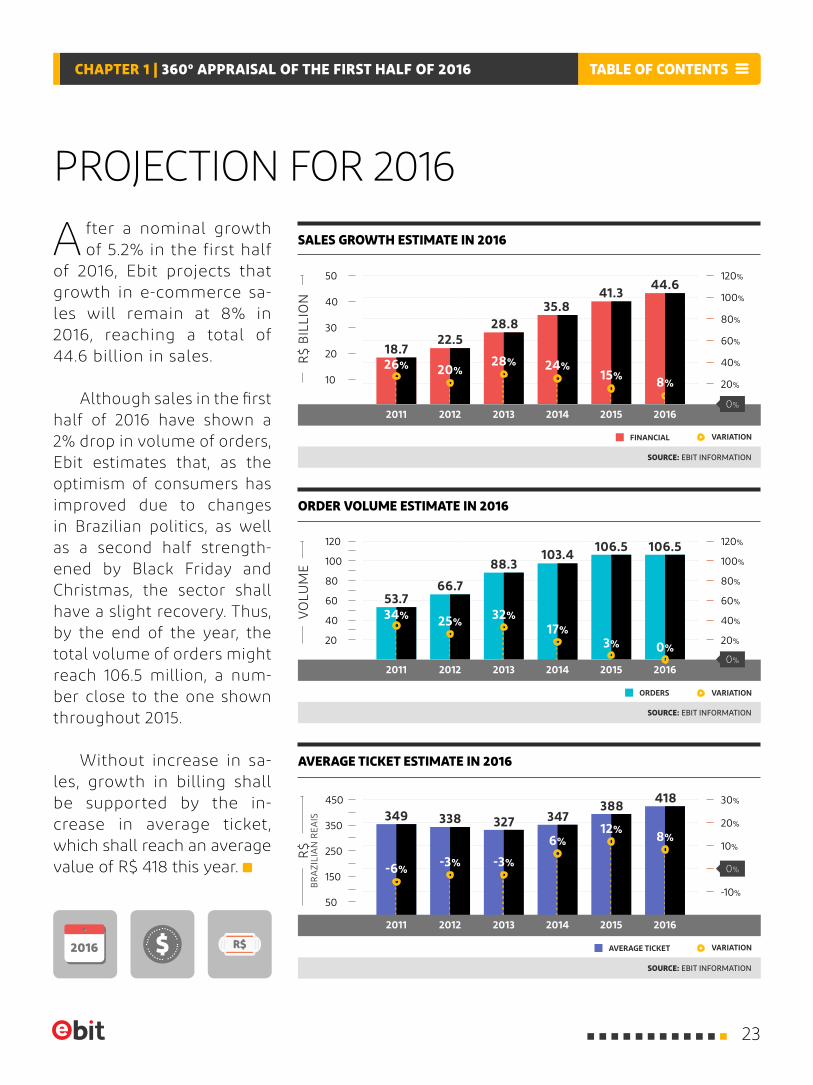
A fter a nominal growth of 5.2% in the first half
of 2016, Ebit projects that growth in e-commerce sa-les will remain at 8% in 2016, reaching a total of 44.6 billion in sales.
Although sales in the first half of 2016 have shown a 2% drop in volume of orders, Ebit estimates that, as the optimism of consumers has improved due to changes in Brazilian politics, as well as a second half strength- ened by Black Friday and Christmas, the sector shall have a slight recovery. Thus, by the end of the year, the total volume of orders might reach 106.5 million, a num-ber close to the one shown throughout 2015.
Without increase in sa-les, growth in billing shall be supported by the in-crease in average ticket, which shall reach an average value of R$ 418 this year.
AVERAGE TICKET ESTIMATE IN 2016
ORDER VOLUME ESTIMATE IN 2016
SALES GROWTH ESTIMATE IN 2016
SOURCE: EBIT INFORMATION
SOURCE: EBIT INFORMATION
SOURCE: EBIT INFORMATION
450
350
250
150
50
50
40
30
20
10
30%
120%120
120%
10%
80%80
80%
20%
100%100
100%
-10%
40%40
40%
60%60
60%
20%20
20%
R$
R$
BIL
LIO
NV
OLU
ME
0%
BR
AZI
LIA
N R
EAIS
AVERAGE TICKET
ORDERS
FINANCIAL
VARIATION
VARIATION
VARIATION
2011 20142013 20162012 20150%
2011 20142013 20162012 2015
2011 20142013 20162012 20150%
18.7
53.7
349 338 327 347388 418
66.7
88.3103.4 106.5 106.5
22.528.8
35.841.3
44.6
26%
34%
-6%-3% -3%
6%12% 8%
17%25%
3%
32%
0%
20%28% 24%
15% 8%
2016
TABLE OF CONTENTSCHAPTER 1 | 360º APPRAISAL OF THE FIRST HALF OF 2016
23
ONLINE PURCHASING
CYCLE
CHAPTER 2
24
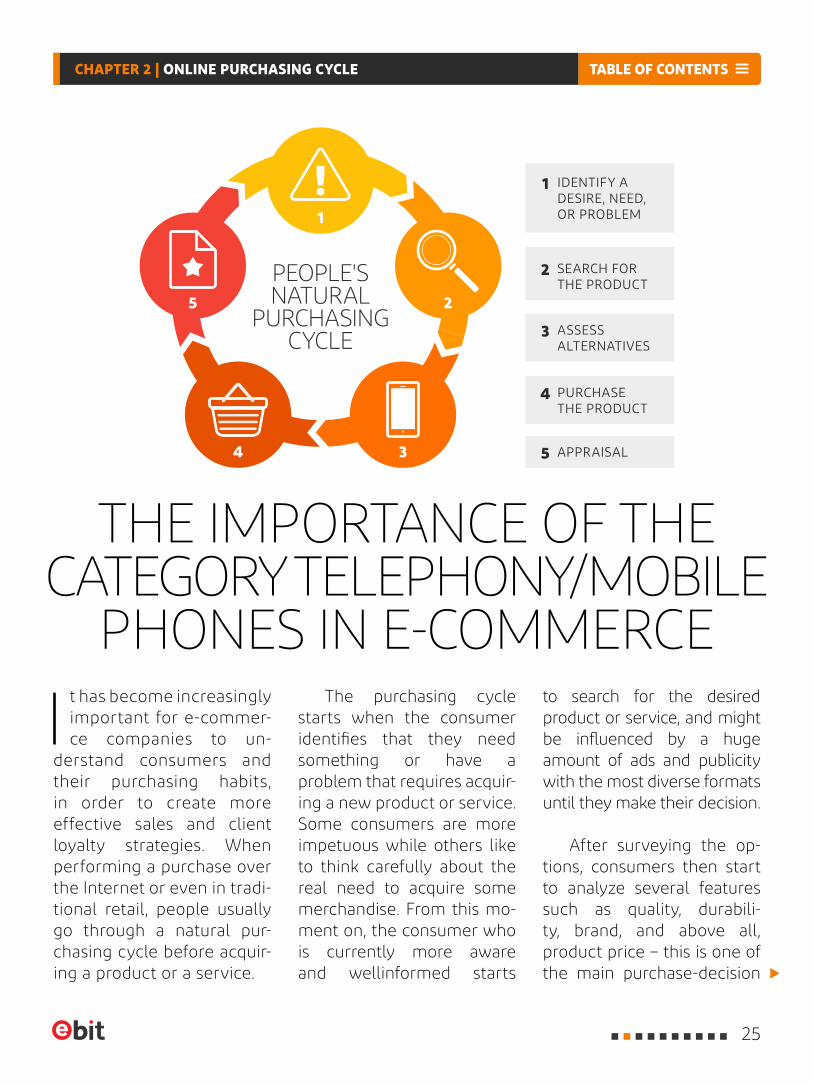
I t has become increasingly important for e-commer- ce companies to un-
derstand consumers and their purchasing habits, in order to create more effective sales and client loyalty strategies. When performing a purchase over the Internet or even in tradi-tional retail, people usually go through a natural pur-chasing cycle before acquir-ing a product or a service.
THE IMPORTANCE OF THE CATEGORY TELEPHONY/MOBILE
PHONES IN E-COMMERCEThe purchasing cycle
starts when the consumer identifies that they need something or have a problem that requires acquir-ing a new product or service. Some consumers are more impetuous while others like to think carefully about the real need to acquire some merchandise. From this mo-ment on, the consumer who is currently more aware and wellinformed starts
to search for the desired product or service, and might be influenced by a huge amount of ads and publicity with the most diverse formats until they make their decision.
After surveying the op-tions, consumers then start to analyze several features such as quality, durabili-ty, brand, and above all, product price – this is one of the main purchase-decision
IDENTIFY A DESIRE, NEED, OR PROBLEM
1
SEARCH FOR THE PRODUCT
2
APPRAISAL5
ASSESS ALTERNATIVES
3
PURCHASE THE PRODUCT
4
1
2
34
5
PEOPLE'S NATURAL
PURCHASING CYCLE
TABLE OF CONTENTSCHAPTER 2 | ONLINE PURCHASING CYCLE
25

factors. After making their decision, having weighed up all benefits as well as negative points, con-sumers decide to buy the product with the best cost-benefit ratio.
In this scenario, the question posed by many companies in the sector is: "What is the process and time to purchase a product in different categories by e-commerce websites?"
We know that the cate-gory Telephony and Mobile phones has been gaining rel-evance with online practices over the last years, with in-creasing share in the nation-al e-commerce market. In 2013, this category occupied the sixth position in volume of orders, with a 6% share of sales; in 2014, it rose to the fourth position with 8% of share in online purchases. In 2015, the category rose again, reaching the third position in the ranking of most sold cate-gories in the Brazilian e-com-merce, with a total of 11% of sales in volume of orders.
Having increasingly be-come an object of desire and a need for Brazilians, who
used to having smartphones for personal and professional use several times a day, this category reached the sec-ond position in e-commerce sales in Brazil, with an aver-age price of R$ 867 in the first half of 2016. In the first six months of 2016 alone, Ebit
estimates that approxima- tely 3.98 million smart-phones were sold in the Brazilian e-commerce. This high sales volume makes Brazil a large market for manufacturers and Telecom operators, whose mission is to broaden the installed 3G and 4G base over the next years. By crossing check-ing information obtained by PNAD survey with data from Teleco/Anatel, Ebit estimates there are approximately 100 million users who have some type of mobile phone with Internet connection.
An article in portal Ex-ame.com in 2015 estimat-ed that Brazilians like to ex-change mobile phones, on average, every year and one month, thus generating a po-tential market/year of 100 million new devices in Brazil.
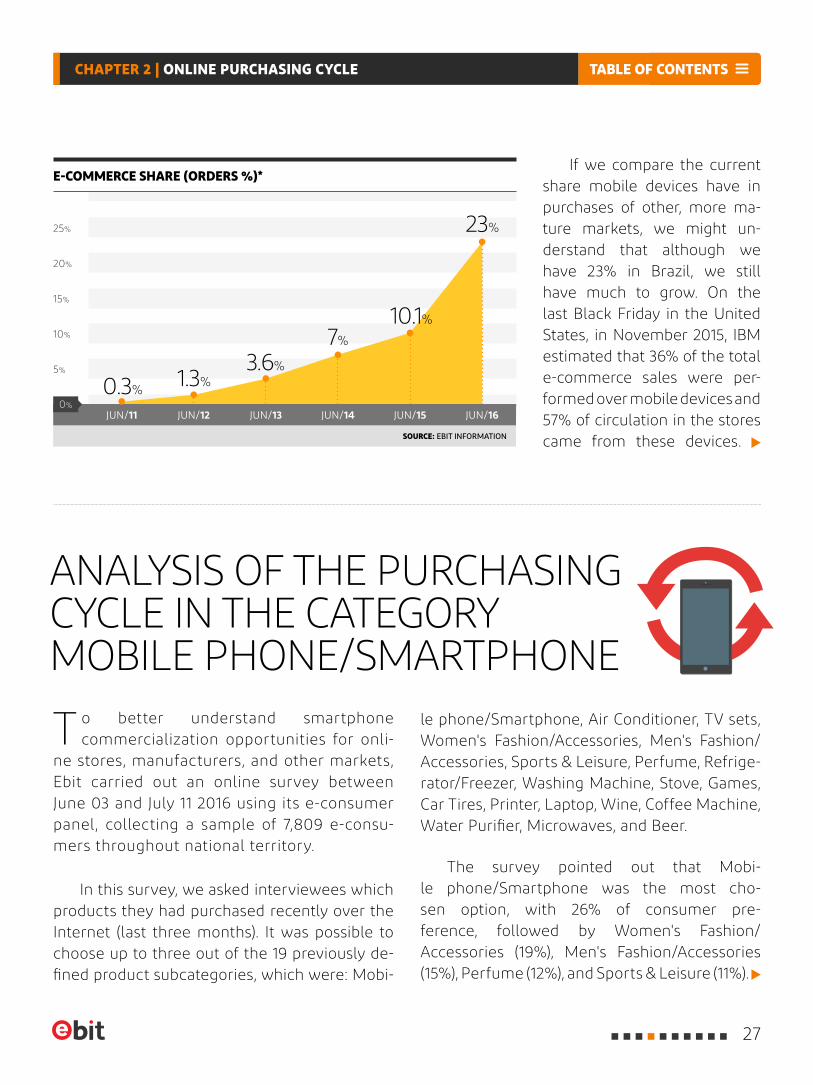
The increasing use of smartphones and mobile phones has been largely de-bated and displayed in the last Ebit Webshoppers re-ports. The share of online purchases via mobile devices, which was practically non-exis-tent in June 2011 (0.3%), has risen to 23% in five years, a 6,300% growth over the period.
THE INTERNET HAS SIGNIFICANTLY
CHANGED THE WAY HOW
PEOPE ACQUIRE A PRODUCT OR SERVICE
AS THE RULE IS NO LONGER HOW
TO FIND YOUR CLIENTS BUT HOW TO BE FOUND
BY THEM IN A NON-INVASIVE MANNER AND
WITH CREDIBILITY.
says André Ricardo Dias,COO of Ebit
TABLE OF CONTENTSCHAPTER 2 | ONLINE PURCHASING CYCLE
26
ANALYSIS OF THE PURCHASING CYCLE IN THE CATEGORY MOBILE PHONE/SMARTPHONE
T o better understand smartphone commercialization opportunities for onli-
ne stores, manufacturers, and other markets, Ebit carried out an online survey between June 03 and July 11 2016 using its e-consumer panel, collecting a sample of 7,809 e-consu-mers throughout national territory.
In this survey, we asked interviewees which products they had purchased recently over the Internet (last three months). It was possible to choose up to three out of the 19 previously de-fined product subcategories, which were: Mobi-
le phone/Smartphone, Air Conditioner, TV sets, Women's Fashion/Accessories, Men's Fashion/Accessories, Sports & Leisure, Perfume, Refrige-rator/Freezer, Washing Machine, Stove, Games, Car Tires, Printer, Laptop, Wine, Coffee Machine, Water Purifier, Microwaves, and Beer.
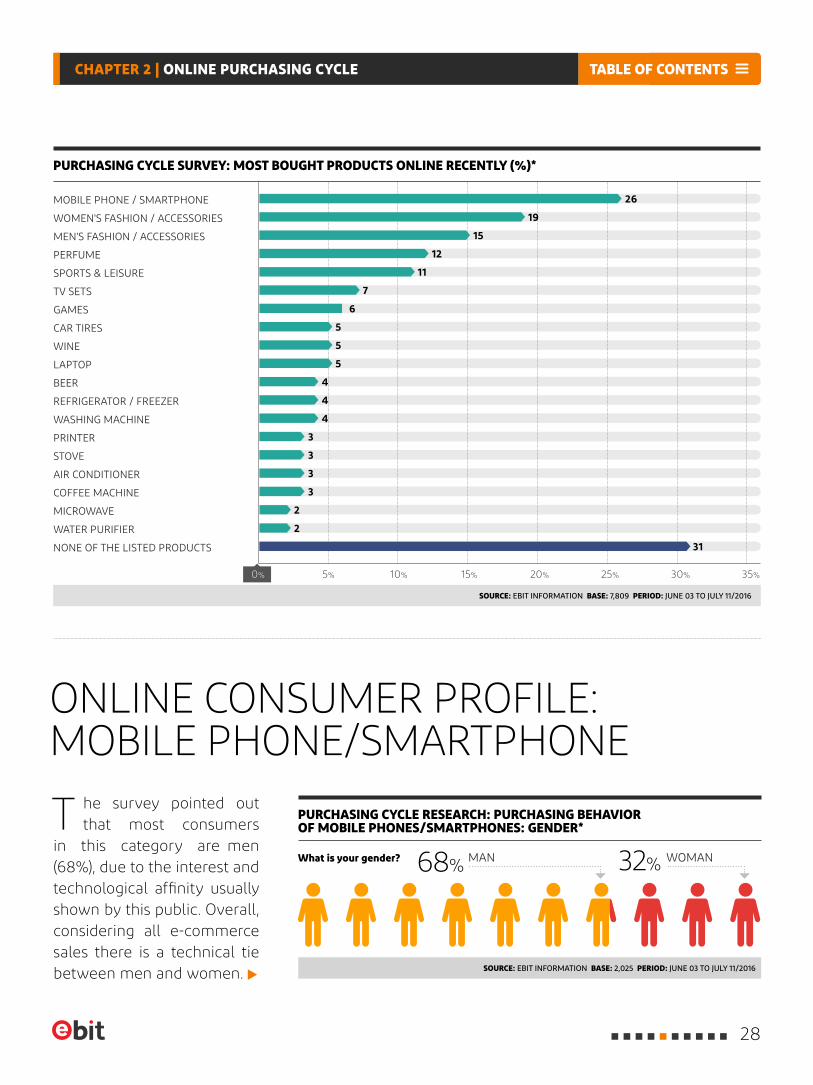
The survey pointed out that Mobi-le phone/Smartphone was the most cho-sen option, with 26% of consumer pre-ference, followed by Women's Fashion/ Accessories (19%), Men's Fashion/Accessories (15%), Perfume (12%), and Sports & Leisure (11%).
If we compare the current share mobile devices have in purchases of other, more ma-ture markets, we might un-derstand that although we have 23% in Brazil, we still have much to grow. On the last Black Friday in the United States, in November 2015, IBM estimated that 36% of the total e-commerce sales were per-formed over mobile devices and 57% of circulation in the stores came from these devices.
E-COMMERCE SHARE (ORDERS %)*
SOURCE: EBIT INFORMATION
20%
25%
15%
5%
10%
JUN/13JUN/11 JUN/12 JUN/14 JUN/16JUN/15
0.3%
7%
1.3%
10.1%
3.6%
23%
0%
TABLE OF CONTENTSCHAPTER 2 | ONLINE PURCHASING CYCLE
27
ONLINE CONSUMER PROFILE: MOBILE PHONE/SMARTPHONE
T he survey pointed out that most consumers
in this category are men (68%), due to the interest and technological affinity usually shown by this public. Overall, considering all e-commerce sales there is a technical tie between men and women.
PURCHASING CYCLE SURVEY: MOST BOUGHT PRODUCTS ONLINE RECENTLY (%)*
SOURCE: EBIT INFORMATION BASE: 7,809 PERIOD: JUNE 03 TO JULY 11/2016
What is your gender?
SOURCE: EBIT INFORMATION BASE: 2,025 PERIOD: JUNE 03 TO JULY 11/2016
PURCHASING CYCLE RESEARCH: PURCHASING BEHAVIOR OF MOBILE PHONES/SMARTPHONES: GENDER*
PERFUME
CAR TIRES
REFRIGERATOR / FREEZER
PRINTER
WOMEN'S FASHION / ACCESSORIES
TV SETS
LAPTOP
AIR CONDITIONER
STOVE
WATER PURIFIER
MOBILE PHONE / SMARTPHONE
SPORTS & LEISURE
WINE
WASHING MACHINE
COFFEE MACHINE
MEN'S FASHION / ACCESSORIES
GAMES
BEER
MICROWAVE
NONE OF THE LISTED PRODUCTS
0% 5% 15% 25% 35%10% 20% 30%
MAN WOMAN32%68%
26
6
4
15
5
3
11
4
3
2
19
5
3
12
5
3
7
4
2
31
TABLE OF CONTENTSCHAPTER 2 | ONLINE PURCHASING CYCLE
28
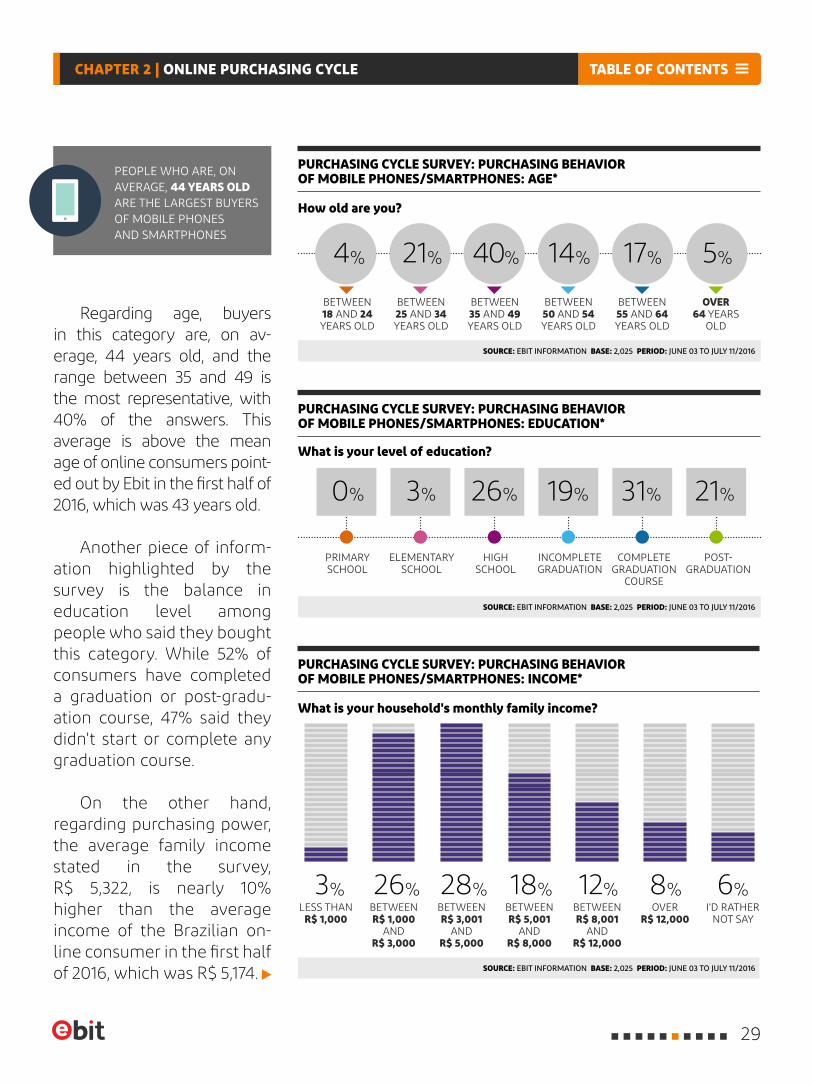
Regarding age, buyers in this category are, on av-erage, 44 years old, and the range between 35 and 49 is the most representative, with 40% of the answers. This average is above the mean age of online consumers point-ed out by Ebit in the first half of 2016, which was 43 years old.
Another piece of inform- ation highlighted by the survey is the balance in education level among people who said they bought this category. While 52% of consumers have completed a graduation or post-gradu-ation course, 47% said they didn't start or complete any graduation course.
On the other hand, regarding purchasing power, the average family income stated in the survey, R$ 5,322, is nearly 10% higher than the average income of the Brazilian on-line consumer in the first half of 2016, which was R$ 5,174.
PEOPLE WHO ARE, ON AVERAGE, 44 YEARS OLD ARE THE LARGEST BUYERS OF MOBILE PHONES AND SMARTPHONES
SOURCE: EBIT INFORMATION BASE: 2,025 PERIOD: JUNE 03 TO JULY 11/2016
SOURCE: EBIT INFORMATION BASE: 2,025 PERIOD: JUNE 03 TO JULY 11/2016
SOURCE: EBIT INFORMATION BASE: 2,025 PERIOD: JUNE 03 TO JULY 11/2016
BETWEEN18 AND 24 YEARS OLD
PRIMARY SCHOOL
ELEMENTARY SCHOOL
HIGH SCHOOL
INCOMPLETE GRADUATION
COMPLETE GRADUATION
COURSE
POST-GRADUATION
LESS THAN R$ 1,000
BETWEEN R$ 3,001
AND R$ 5,000
OVER R$ 12,000
BETWEEN R$ 1,000
AND R$ 3,000
BETWEEN R$ 8,001
AND R$ 12,000
BETWEEN R$ 5,001
AND R$ 8,000
I'D RATHER NOT SAY
BETWEEN 55 AND 64 YEARS OLD
OVER 64 YEARS
OLD
BETWEEN 35 AND 49 YEARS OLD
BETWEEN 25 AND 34 YEARS OLD
BETWEEN 50 AND 54 YEARS OLD
How old are you?
What is your level of education?
What is your household's monthly family income?
40% 17%21% 14% 5%4%
0% 21%31%26% 19%3%
3% 28% 8%26% 12%18% 6%
PURCHASING CYCLE SURVEY: PURCHASING BEHAVIOR OF MOBILE PHONES/SMARTPHONES: INCOME*
PURCHASING CYCLE SURVEY: PURCHASING BEHAVIOR OF MOBILE PHONES/SMARTPHONES: AGE*
PURCHASING CYCLE SURVEY: PURCHASING BEHAVIOR OF MOBILE PHONES/SMARTPHONES: EDUCATION*
TABLE OF CONTENTSCHAPTER 2 | ONLINE PURCHASING CYCLE
29
PURCHASING BEHAVIOR: MOBILE PHONE/SMARTPHONE
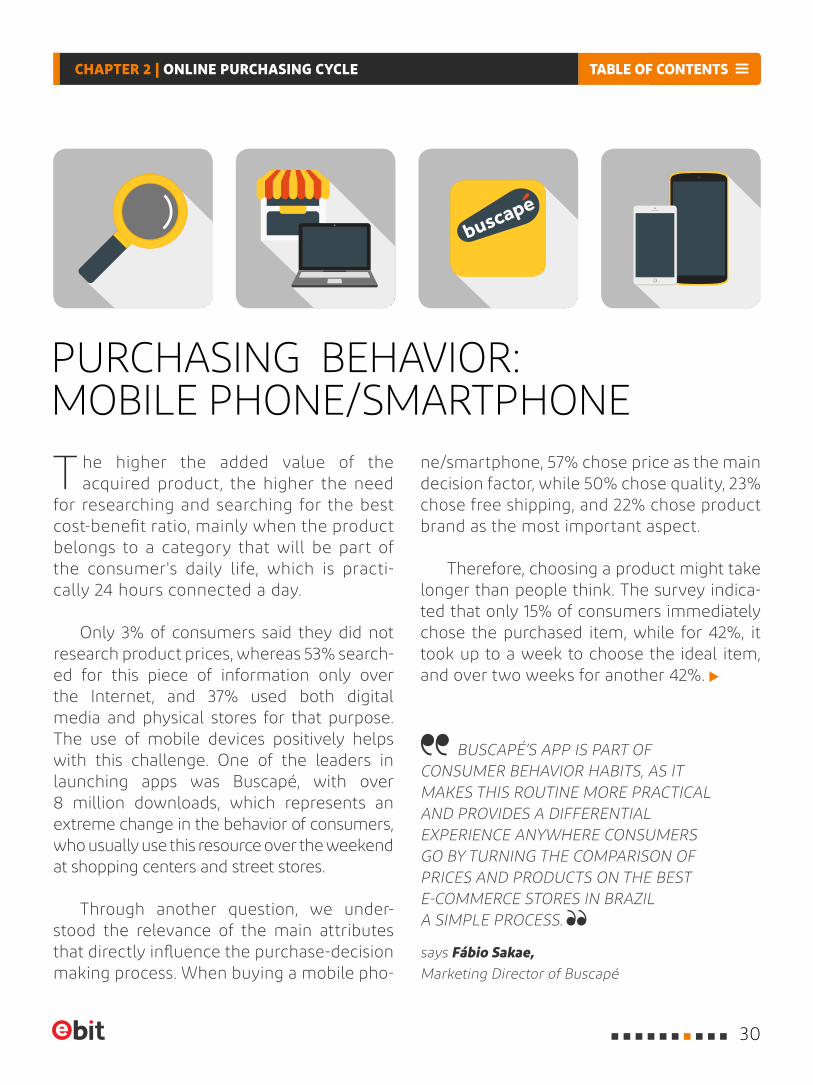
T he higher the added value of the acquired product, the higher the need
for researching and searching for the best cost-benefit ratio, mainly when the product belongs to a category that will be part of the consumer's daily life, which is practi-cally 24 hours connected a day.
Only 3% of consumers said they did not research product prices, whereas 53% search- ed for this piece of information only over the Internet, and 37% used both digital media and physical stores for that purpose. The use of mobile devices positively helps with this challenge. One of the leaders in launching apps was Buscapé, with over 8 million downloads, which represents an extreme change in the behavior of consumers, who usually use this resource over the weekend at shopping centers and street stores.
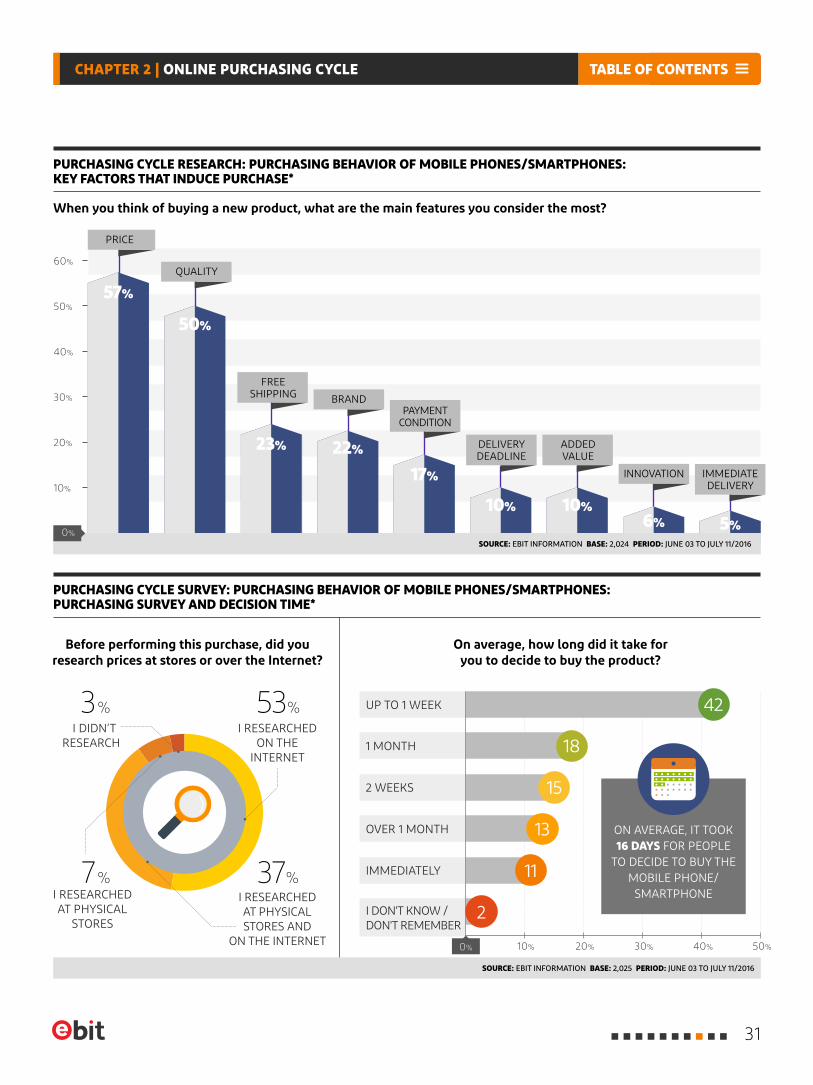
Through another question, we under- stood the relevance of the main attributes that directly influence the purchase-decision making process. When buying a mobile pho-
ne/smartphone, 57% chose price as the main decision factor, while 50% chose quality, 23% chose free shipping, and 22% chose product brand as the most important aspect.
Therefore, choosing a product might take longer than people think. The survey indica-ted that only 15% of consumers immediately chose the purchased item, while for 42%, it took up to a week to choose the ideal item, and over two weeks for another 42%.
BUSCAPÉ’S APP IS PART OF CONSUMER BEHAVIOR HABITS, AS IT MAKES THIS ROUTINE MORE PRACTICAL AND PROVIDES A DIFFERENTIAL EXPERIENCE ANYWHERE CONSUMERS GO BY TURNING THE COMPARISON OF PRICES AND PRODUCTS ON THE BEST E-COMMERCE STORES IN BRAZIL A SIMPLE PROCESS.
says Fábio Sakae, Marketing Director of Buscapé
TABLE OF CONTENTSCHAPTER 2 | ONLINE PURCHASING CYCLE
30
PURCHASING CYCLE RESEARCH: PURCHASING BEHAVIOR OF MOBILE PHONES/SMARTPHONES: KEY FACTORS THAT INDUCE PURCHASE*
PURCHASING CYCLE SURVEY: PURCHASING BEHAVIOR OF MOBILE PHONES/SMARTPHONES: PURCHASING SURVEY AND DECISION TIME*
SOURCE: EBIT INFORMATION BASE: 2,025 PERIOD: JUNE 03 TO JULY 11/2016
Before performing this purchase, did youresearch prices at stores or over the Internet?
When you think of buying a new product, what are the main features you consider the most?
On average, how long did it take foryou to decide to buy the product?
20%
60%
50%
40%
10%
30%
I DON'T KNOW / DON'T REMEMBER
UP TO 1 WEEK
1 MONTH
2 WEEKS
OVER 1 MONTH
IMMEDIATELY
40% 50%10% 20% 30%0%
57%
17%
23%
10%
50%
10%
22%
6% 5%
7
3%
% 37%
%53
0% SOURCE: EBIT INFORMATION BASE: 2,024 PERIOD: JUNE 03 TO JULY 11/2016
PRICE
QUALITY
IMMEDIATE DELIVERY
INNOVATION
ADDED VALUE
DELIVERY DEADLINE
PAYMENT CONDITION
BRAND
FREE SHIPPING
18
15
13
11
2
I RESEARCHED ON THE
INTERNET
I DIDN’T RESEARCH
I RESEARCHEDAT PHYSICAL STORES AND
ON THE INTERNET
I RESEARCHEDAT PHYSICAL
STORES
42
ON AVERAGE, IT TOOK 16 DAYS FOR PEOPLE
TO DECIDE TO BUY THE MOBILE PHONE/
SMARTPHONE
TABLE OF CONTENTSCHAPTER 2 | ONLINE PURCHASING CYCLE
31
PURCHASING FREQUENCY OF MOBILE PHONE/SMARTPHONE
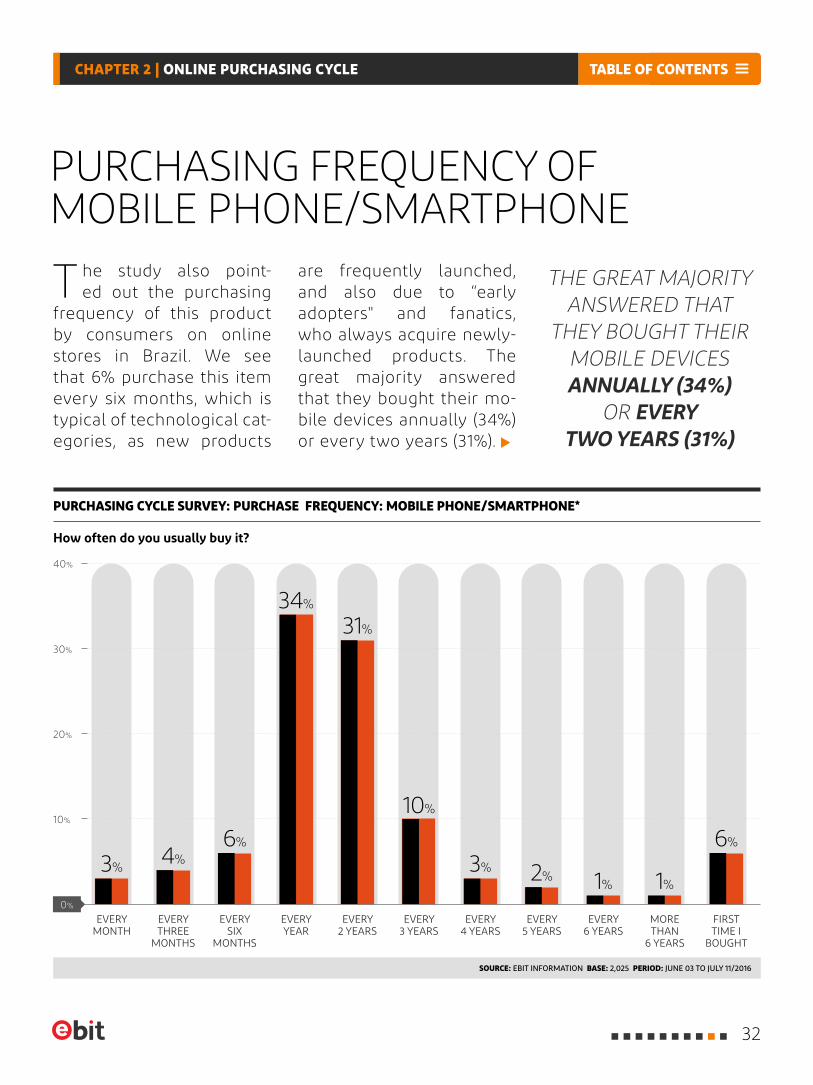
T he study also point-ed out the purchasing
frequency of this product by consumers on online stores in Brazil. We see that 6% purchase this item every six months, which is typical of technological cat-egories, as new products
THE GREAT MAJORITY ANSWERED THAT
THEY BOUGHT THEIR MOBILE DEVICES ANNUALLY (34%)
OR EVERY TWO YEARS (31%)
are frequently launched, and also due to “early adopters" and fanatics, who always acquire newly- launched products. The great majority answered that they bought their mo-bile devices annually (34%) or every two years (31%).
PURCHASING CYCLE SURVEY: PURCHASE FREQUENCY: MOBILE PHONE/SMARTPHONE*
How often do you usually buy it?
SOURCE: EBIT INFORMATION BASE: 2,025 PERIOD: JUNE 03 TO JULY 11/2016
EVERY MONTH
EVERY 2 YEARS
EVERY 3 YEARS
EVERY SIX
MONTHS
EVERY 5 YEARS
MORE THAN
6 YEARS
EVERY THREE
MONTHS
EVERY 4 YEARS
EVERY YEAR
EVERY 6 YEARS
FIRST TIME I
BOUGHT
20%
40%
10%
30%
0%
3%
31%
1%
6%
3%
6%4%
10%
1%
34%
2%
TABLE OF CONTENTSCHAPTER 2 | ONLINE PURCHASING CYCLE
32
*IN QUESTIONS THAT USE SELECTION BOXES, THE TOTAL NUMBER OF ANSWERS MIGHT BE HIGHER THAN THE NUMBERS OF INTERVIEWEES. THIS MIGHT CAUSE THE TOTAL PERCENTAGES OF THE ANSWER TO EXCEED 100%.
RELATIONSHIP BRAND x PRICE IN DECIDING TO PURCHASE A MOBILE PHONE/SMARTPHONE
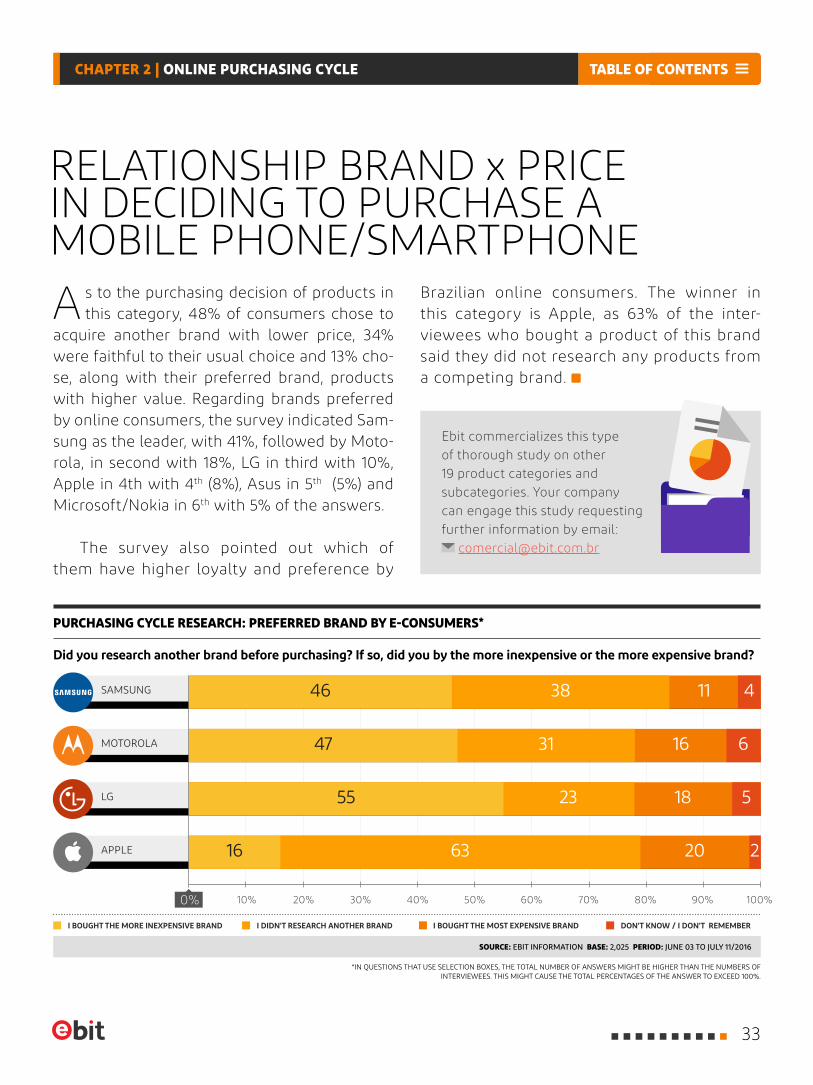
A s to the purchasing decision of products in this category, 48% of consumers chose to
acquire another brand with lower price, 34% were faithful to their usual choice and 13% cho-se, along with their preferred brand, products with higher value. Regarding brands preferred by online consumers, the survey indicated Sam-sung as the leader, with 41%, followed by Moto-rola, in second with 18%, LG in third with 10%, Apple in 4th with 4th (8%), Asus in 5th (5%) and Microsoft/Nokia in 6th with 5% of the answers.
The survey also pointed out which of them have higher loyalty and preference by
Brazilian online consumers. The winner in this category is Apple, as 63% of the inter-viewees who bought a product of this brand said they did not research any products from a competing brand.
Ebit commercializes this type of thorough study on other 19 product categories and subcategories. Your company can engage this study requesting further information by email:
SOURCE: EBIT INFORMATION BASE: 2,025 PERIOD: JUNE 03 TO JULY 11/2016
Did you research another brand before purchasing? If so, did you by the more inexpensive or the more expensive brand?
PURCHASING CYCLE RESEARCH: PREFERRED BRAND BY E-CONSUMERS*
0% 50% 100%10% 60%20% 70%40% 90%30% 80%
I BOUGHT THE MORE INEXPENSIVE BRAND I DIDN'T RESEARCH ANOTHER BRAND I BOUGHT THE MOST EXPENSIVE BRAND DON'T KNOW / I DON'T REMEMBER
SAMSUNG
MOTOROLA
APPLE
LG
216 2063
5182355
4113846
6163147
TABLE OF CONTENTSCHAPTER 2 | ONLINE PURCHASING CYCLE
33
THE ECONOMIC AND POLITICAL
CRISIS,according to FecomercioSP
34
CHAPTER 3
B razil is probably experiencing the great-est crisis of its history. GDP (Gross Domes-tic Product) shall decrease approximately
3.5% in 2016, after having registered a 3.8% drop last year. It will be the first time since the 1930's that the Brazilian economy registers a retraction for two consecutive years. The per capita income shall drop for the third consecutive year and re-tail sales in São Paulo, which dropped 3% in 2014 and 6% in 2015, shall remain unchanged in 2016 in an optimistic scenario, according to data and
projections by the Federation of Goods, Services, and Tourism of the State of São Paulo – Fecomer-cioSP. Consequently, unemployment rate has exceeded 11%. Over 100 thousand formal job vacancies have been eliminated per month in our country. In the trade in goods and services of the State of São Paulo, over 260 thousand job positions have already been extinguished in one year, according to the survey conducted by the federation based on data of the General Regis-try of Employed and Unemployed – CAGED.
THE ECONOMIC AND POLITICAL CRISIS,
ACCORDING TO FECOMERCIOSP
TABLE OF CONTENTSCHAPTER 3 | THE ECONOMIC AND POLITICAL CRISIS, according to FecomercioSP
35
DESPITE THE DEPRESSION IN THE ECONOMIC ACTIVITY
AND THE CONSEQUENT INCREASE IN UNEMPLOYMENT, INFLATION
REMAINS HIGH – ALTHOUGHTHE LAST DATA HAVE
INDICATED A SLOWDOWN – AND INTERESTS ARE ALSO HIGH
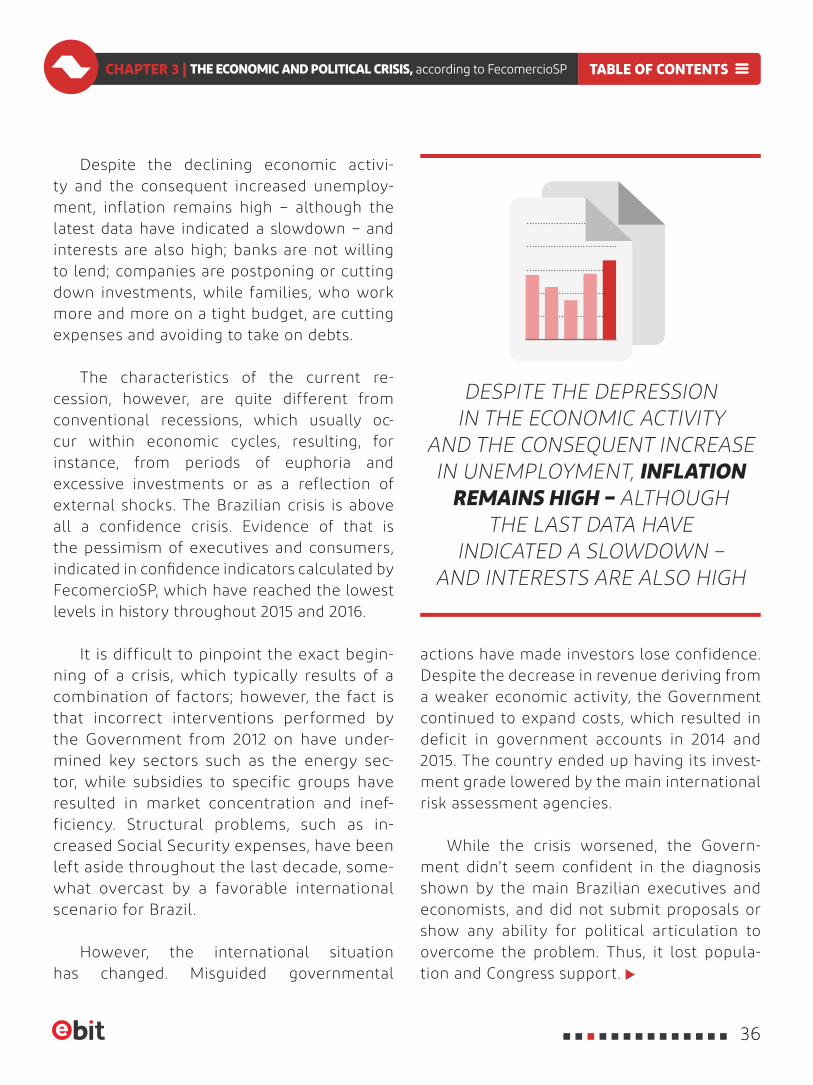
Despite the declining economic activi-ty and the consequent increased unemploy-ment, inflation remains high – although the latest data have indicated a slowdown – and interests are also high; banks are not willing to lend; companies are postponing or cutting down investments, while families, who work more and more on a tight budget, are cutting expenses and avoiding to take on debts.
The characteristics of the current re-cession, however, are quite different from conventional recessions, which usually oc-cur within economic cycles, resulting, for instance, from periods of euphoria and excessive investments or as a reflection of external shocks. The Brazilian crisis is above all a confidence crisis. Evidence of that is the pessimism of executives and consumers, indicated in confidence indicators calculated by FecomercioSP, which have reached the lowest levels in history throughout 2015 and 2016.
It is difficult to pinpoint the exact begin-ning of a crisis, which typically results of a combination of factors; however, the fact is that incorrect interventions performed by the Government from 2012 on have under-mined key sectors such as the energy sec-tor, while subsidies to specific groups have resulted in market concentration and inef-ficiency. Structural problems, such as in-creased Social Security expenses, have been left aside throughout the last decade, some-what overcast by a favorable international scenario for Brazil.
However, the international situation has changed. Misguided governmental
actions have made investors lose confidence. Despite the decrease in revenue deriving from a weaker economic activity, the Government continued to expand costs, which resulted in deficit in government accounts in 2014 and 2015. The country ended up having its invest-ment grade lowered by the main international risk assessment agencies.
While the crisis worsened, the Govern-ment didn't seem confident in the diagnosis shown by the main Brazilian executives and economists, and did not submit proposals or show any ability for political articulation to overcome the problem. Thus, it lost popula-tion and Congress support.
TABLE OF CONTENTSCHAPTER 3 | THE ECONOMIC AND POLITICAL CRISIS, according to FecomercioSP
36
THE CRISIS AND RETAIL IN SÃO PAULO
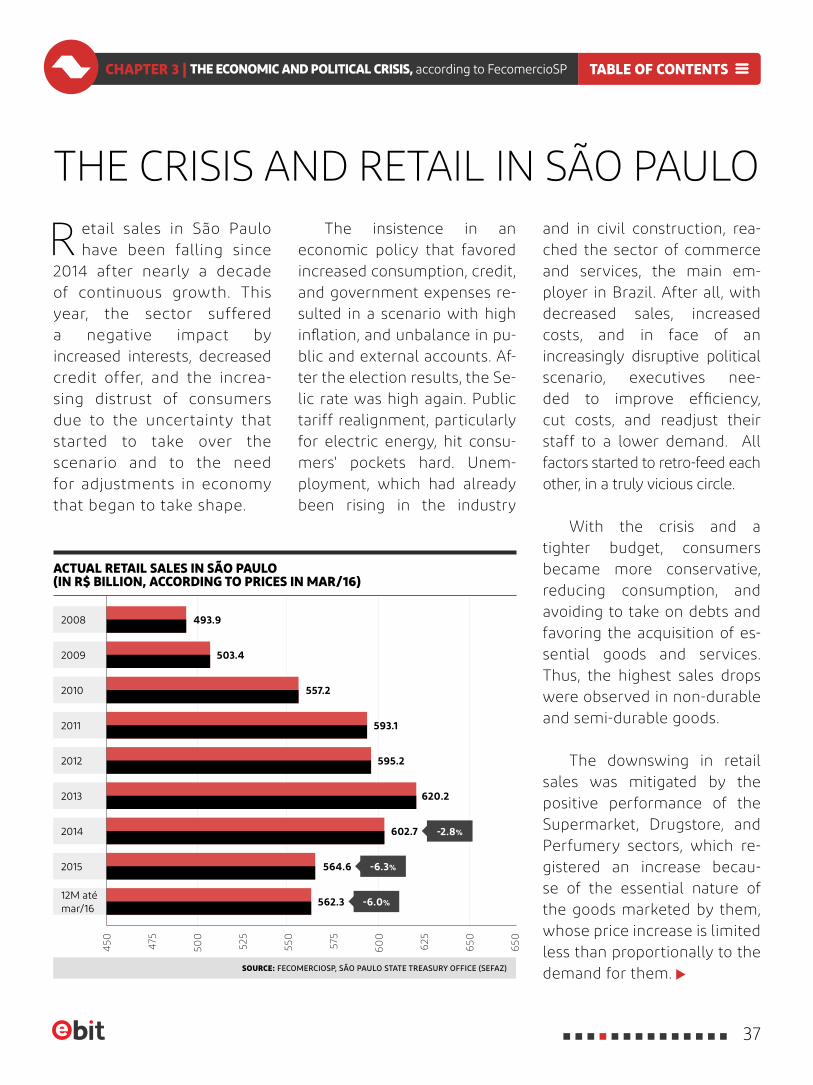
R etail sales in São Paulo have been falling since
2014 after nearly a decade of continuous growth. This year, the sector suffered a negative impact by increased interests, decreased credit offer, and the increa-sing distrust of consumers due to the uncertainty that started to take over the scenario and to the need for adjustments in economy that began to take shape.
The insistence in an economic policy that favored increased consumption, credit, and government expenses re-sulted in a scenario with high inflation, and unbalance in pu-blic and external accounts. Af-ter the election results, the Se-lic rate was high again. Public tariff realignment, particularly for electric energy, hit consu-mers' pockets hard. Unem-ployment, which had already been rising in the industry
and in civil construction, rea-ched the sector of commerce and services, the main em-ployer in Brazil. After all, with decreased sales, increased costs, and in face of an increasingly disruptive political scenario, executives nee-ded to improve efficiency, cut costs, and readjust their staff to a lower demand. All factors started to retro-feed each other, in a truly vicious circle.
With the crisis and a tighter budget, consumers became more conservative, reducing consumption, and avoiding to take on debts and favoring the acquisition of es-sential goods and services. Thus, the highest sales drops were observed in non-durable and semi-durable goods.
The downswing in retail sales was mitigated by the positive performance of the Supermarket, Drugstore, and Perfumery sectors, which re-gistered an increase becau-se of the essential nature of the goods marketed by them, whose price increase is limited less than proportionally to the demand for them.
ACTUAL RETAIL SALES IN SÃO PAULO (IN R$ BILLION, ACCORDING TO PRICES IN MAR/16)
SOURCE: FECOMERCIOSP, SÃO PAULO STATE TREASURY OFFICE (SEFAZ)
2008
2012
2010
2014
2009
2013
2011
2015
12M até mar/16
525
625475
575
450 55
0
650
650
500
60
0
493.9
503.4
557.2
593.1
595.2
620.2
602.7
564.6
562.3
-2.8%
-6.3%
-6.0%
TABLE OF CONTENTSCHAPTER 3 | THE ECONOMIC AND POLITICAL CRISIS, according to FecomercioSP
37
F rom 2015 on, with the launching of the E-commerce Conjunctural Research (PCCE),
FecomercioSP, in partnership with Ebit, start-ed to systematically investigate the behavior of sales performed over the Internet, the so-called e-commerce. This was due to the acknowledg-ment of the increasing and undeniable relevance this segment has been gaining in the Brazilian retail in general and in São Paulo, particularly.
The process of monthly monitoring e-commerce required the elaboration of an exclusive methodology, which, in turn, allowed
E-COMMERCE IN SÃO PAULO
(FECOMERCIOSP/EBIT SURVEY)
ENABLED THE KNOWLEDGE OF E-COMMERCE
SHARE IN RETAIL SALES, AS WELL AS THE INDICATOR
BEHAVIOR OVER TIME
for surveying unprecedented information on commerce in São Paulo and for elaborating, for instance, comparisons between the volume negotiated in e-commerce and monthly sales of physical stores in the State of São Paulo, divided in the 16 regions defined by the Regional Tax Offices of the São Paulo State Treasury Office (Sefaz). This enabled knowledge of the e-commerce share in retail sales in each one of these regions, as well as the indicator behavior over time.
In addition, in the exclusive context of e-commerce, unprecedented monthly data start-ed to be provided on number of orders, average ticket, and the actual sales variation in this segment.
It is thus another important source of information for the monitoring of the situation of commerce in a segment of in-creasing importance in the economy, which can be a valuable instrument for executives to define their strategies and also a guidance element for public policies directed to safety and improvement of transactions performed in the world of e-commerce.
TABLE OF CONTENTSCHAPTER 3 | THE ECONOMIC AND POLITICAL CRISIS, according to FecomercioSP
38
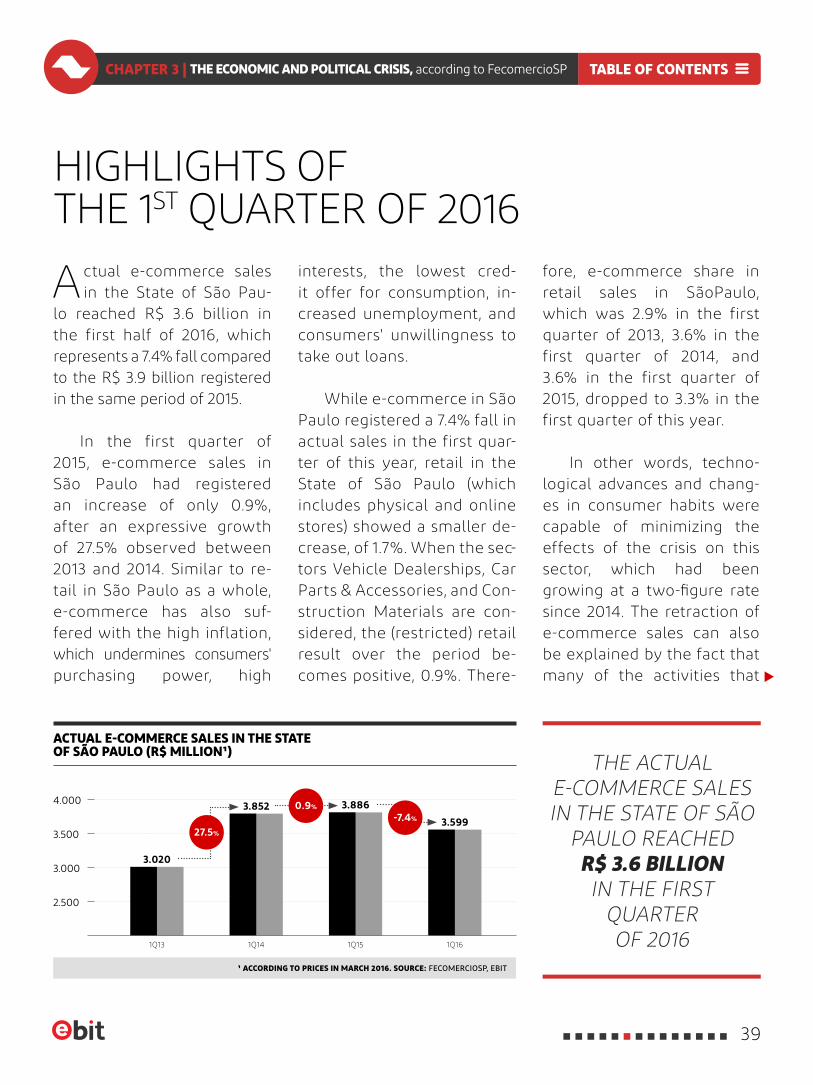
A ctual e-commerce sales in the State of São Pau-
lo reached R$ 3.6 billion in the first half of 2016, which represents a 7.4% fall compared to the R$ 3.9 billion registered in the same period of 2015.
In the first quarter of 2015, e-commerce sales in São Paulo had registered an increase of only 0.9%, after an expressive growth of 27.5% observed between 2013 and 2014. Similar to re-tail in São Paulo as a whole, e-commerce has also suf-fered with the high inflation, which undermines consumers' purchasing power, high
HIGHLIGHTS OF THE 1ST QUARTER OF 2016
fore, e-commerce share in retail sales in SãoPaulo, which was 2.9% in the first quarter of 2013, 3.6% in the first quarter of 2014, and 3.6% in the first quarter of 2015, dropped to 3.3% in the first quarter of this year.
In other words, techno-logical advances and chang-es in consumer habits were capable of minimizing the effects of the crisis on this sector, which had been growing at a two-figure rate since 2014. The retraction of e-commerce sales can also be explained by the fact that many of the activities that
interests, the lowest cred-it offer for consumption, in-creased unemployment, and consumers' unwillingness to take out loans.
While e-commerce in São Paulo registered a 7.4% fall in actual sales in the first quar-ter of this year, retail in the State of São Paulo (which includes physical and online stores) showed a smaller de-crease, of 1.7%. When the sec-tors Vehicle Dealerships, Car Parts & Accessories, and Con-struction Materials are con-sidered, the (restricted) retail result over the period be-comes positive, 0.9%. There-
THE ACTUAL E-COMMERCE SALES IN THE STATE OF SÃO
PAULO REACHEDR$ 3.6 BILLION IN THE FIRST
QUARTEROF 2016
ACTUAL E-COMMERCE SALES IN THE STATE OF SÃO PAULO (R$ MILLION¹)
¹ ACCORDING TO PRICES IN MARCH 2016. SOURCE: FECOMERCIOSP, EBIT
1Q13 1Q151Q14 1Q16
4.000
3.000
3.500
2.500
3.020
3.852 3.886
3.59927.5%
0.9%
-7.4%
TABLE OF CONTENTSCHAPTER 3 | THE ECONOMIC AND POLITICAL CRISIS, according to FecomercioSP
39
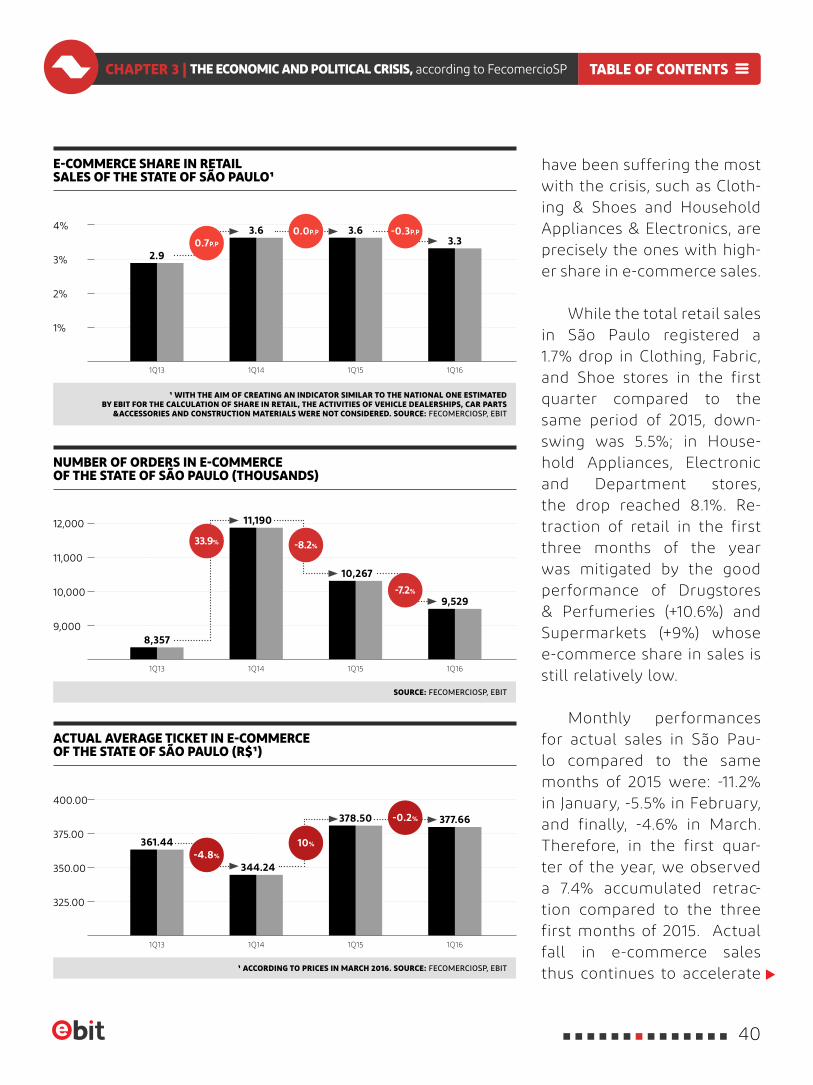
have been suffering the most with the crisis, such as Cloth-ing & Shoes and Household Appliances & Electronics, are precisely the ones with high-er share in e-commerce sales.
While the total retail sales in São Paulo registered a 1.7% drop in Clothing, Fabric, and Shoe stores in the first quarter compared to the same period of 2015, down-swing was 5.5%; in House-hold Appliances, Electronic and Department stores, the drop reached 8.1%. Re-traction of retail in the first three months of the year was mitigated by the good performance of Drugstores & Perfumeries (+10.6%) and Supermarkets (+9%) whose e-commerce share in sales is still relatively low.
Monthly performances for actual sales in São Pau-lo compared to the same months of 2015 were: -11.2% in January, -5.5% in February, and finally, -4.6% in March. Therefore, in the first quar-ter of the year, we observed a 7.4% accumulated retrac-tion compared to the three first months of 2015. Actual fall in e-commerce sales thus continues to accelerate
¹ WITH THE AIM OF CREATING AN INDICATOR SIMILAR TO THE NATIONAL ONE ESTIMATED BY EBIT FOR THE CALCULATION OF SHARE IN RETAIL, THE ACTIVITIES OF VEHICLE DEALERSHIPS, CAR PARTS
&ACCESSORIES AND CONSTRUCTION MATERIALS WERE NOT CONSIDERED. SOURCE: FECOMERCIOSP, EBIT
ACTUAL AVERAGE TICKET IN E-COMMERCE OF THE STATE OF SÃO PAULO (R$¹)
NUMBER OF ORDERS IN E-COMMERCE OF THE STATE OF SÃO PAULO (THOUSANDS)
E-COMMERCE SHARE IN RETAIL SALES OF THE STATE OF SÃO PAULO¹
¹ ACCORDING TO PRICES IN MARCH 2016. SOURCE: FECOMERCIOSP, EBIT
SOURCE: FECOMERCIOSP, EBIT
400.00
350.00
375.00
325.00
4%
2%
3%
1%
12,000
10,000
11,000
9,000
1Q13
1Q13
1Q13
1Q15
1Q15
1Q15
1Q14
1Q14
1Q14
1Q16
1Q16
1Q16
361.44
8,357
2.9
344.24
11,190
3.6
378.50
10,267
3.6
377.66
9,529
3.3
-4.8%
33.9%
0.7P.P
10%
-8.2%
0.0P.P
-0.2%
-7.2%
-0.3P.P
TABLE OF CONTENTSCHAPTER 3 | THE ECONOMIC AND POLITICAL CRISIS, according to FecomercioSP
40
THE NUMBER OF ORDERS
IN THE STATE WENT FROM 10,267 MILLION,
IN THE FIRSTQUARTER OF 2015,TO 9,529 MILLION
IN THE FIRST QUARTER OF 2016. THIS REPRESENTS
A 7.2% DROP
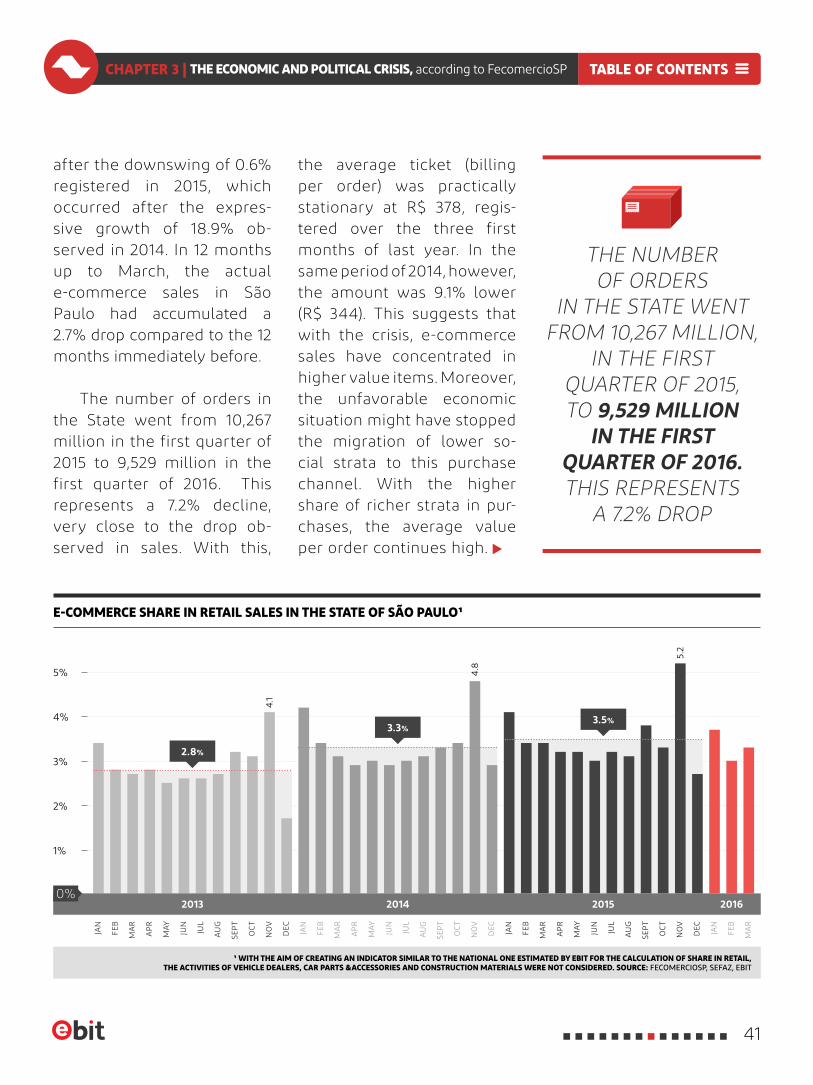
after the downswing of 0.6% registered in 2015, which occurred after the expres-sive growth of 18.9% ob-served in 2014. In 12 months up to March, the actual e-commerce sales in São Paulo had accumulated a 2.7% drop compared to the 12 months immediately before.
The number of orders in the State went from 10,267 million in the first quarter of 2015 to 9,529 million in the first quarter of 2016. This represents a 7.2% decline, very close to the drop ob-served in sales. With this,
the average ticket (billing per order) was practically stationary at R$ 378, regis- tered over the three first months of last year. In the same period of 2014, however, the amount was 9.1% lower (R$ 344). This suggests that with the crisis, e-commerce sales have concentrated in higher value items. Moreover, the unfavorable economic situation might have stopped the migration of lower so-cial strata to this purchase channel. With the higher share of richer strata in pur-chases, the average value per order continues high.
E-COMMERCE SHARE IN RETAIL SALES IN THE STATE OF SÃO PAULO¹
¹ WITH THE AIM OF CREATING AN INDICATOR SIMILAR TO THE NATIONAL ONE ESTIMATED BY EBIT FOR THE CALCULATION OF SHARE IN RETAIL, THE ACTIVITIES OF VEHICLE DEALERS, CAR PARTS &ACCESSORIES AND CONSTRUCTION MATERIALS WERE NOT CONSIDERED. SOURCE: FECOMERCIOSP, SEFAZ, EBIT
4.1
4.8
5.2
5%
4%
3%
2%
1%
FEB
MA
R
JAN
FEB
JUN
OC
T
AP
R
AU
G
DEC
MA
R
JUL
NO
V
MA
Y
SEP
T
JAN
FEB
MA
R
JAN
JUN
JUL
OC
T
AP
R
AU
G
DEC
NO
V
MA
Y
SEP
T
DEC
FEB
JUN
AP
R
AU
G
MA
R
JUL
NO
V
OC
T
MA
Y
SEP
T
JAN
2013 2014 20162015
2.8%
3.3%3.5%
0%
TABLE OF CONTENTSCHAPTER 3 | THE ECONOMIC AND POLITICAL CRISIS, according to FecomercioSP
41
APPRAISAL OF REGIONAL DATA FROM THE STATE OF SÃO PAULO
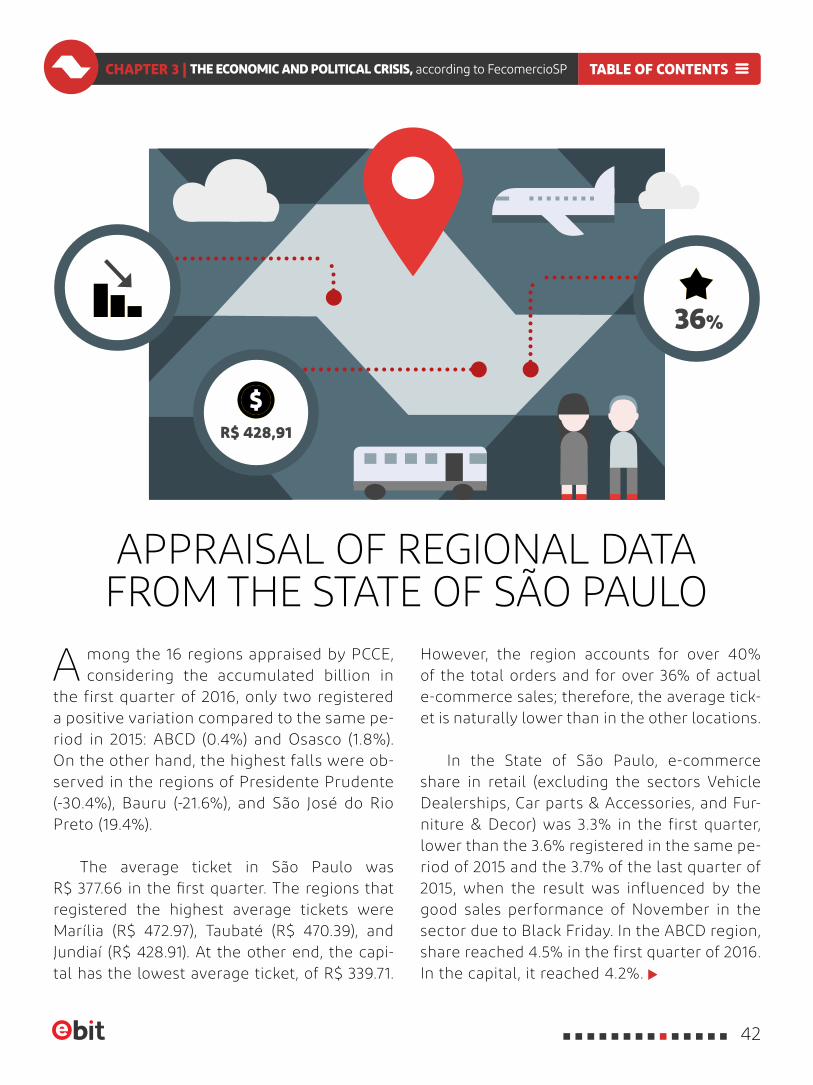
A mong the 16 regions appraised by PCCE, considering the accumulated billion in
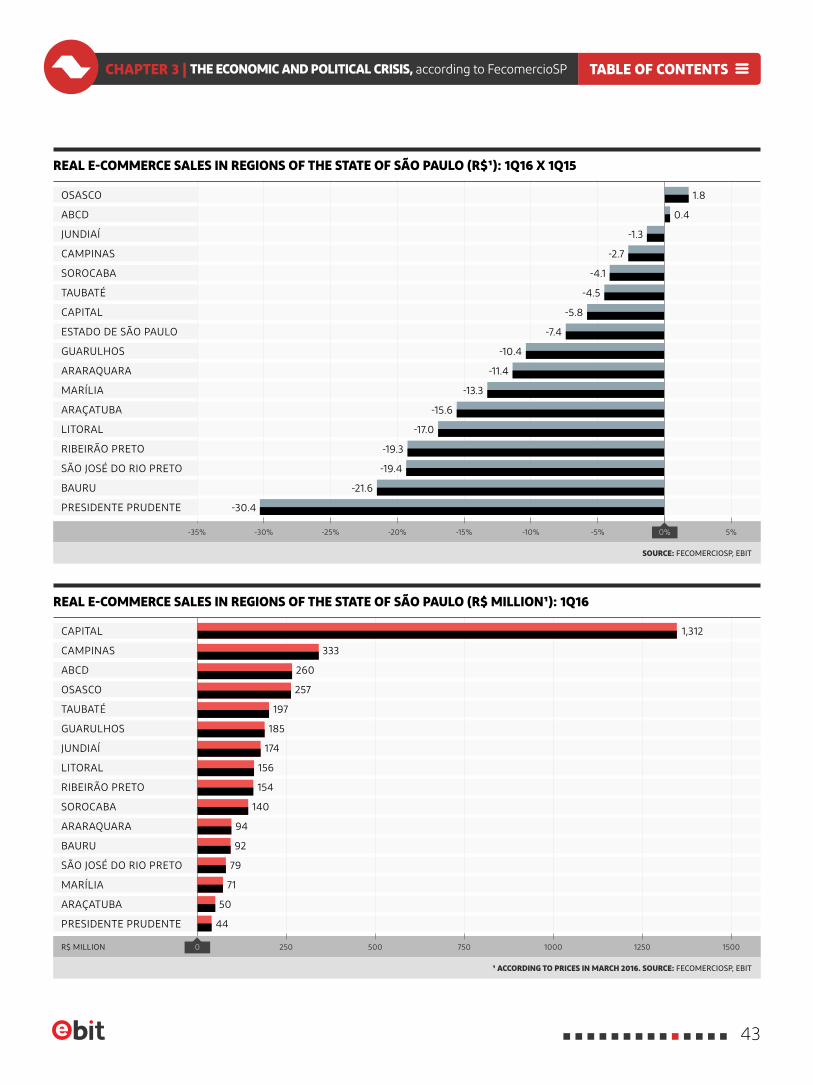
the first quarter of 2016, only two registered a positive variation compared to the same pe-riod in 2015: ABCD (0.4%) and Osasco (1.8%). On the other hand, the highest falls were ob-served in the regions of Presidente Prudente (-30.4%), Bauru (-21.6%), and São José do Rio Preto (19.4%).
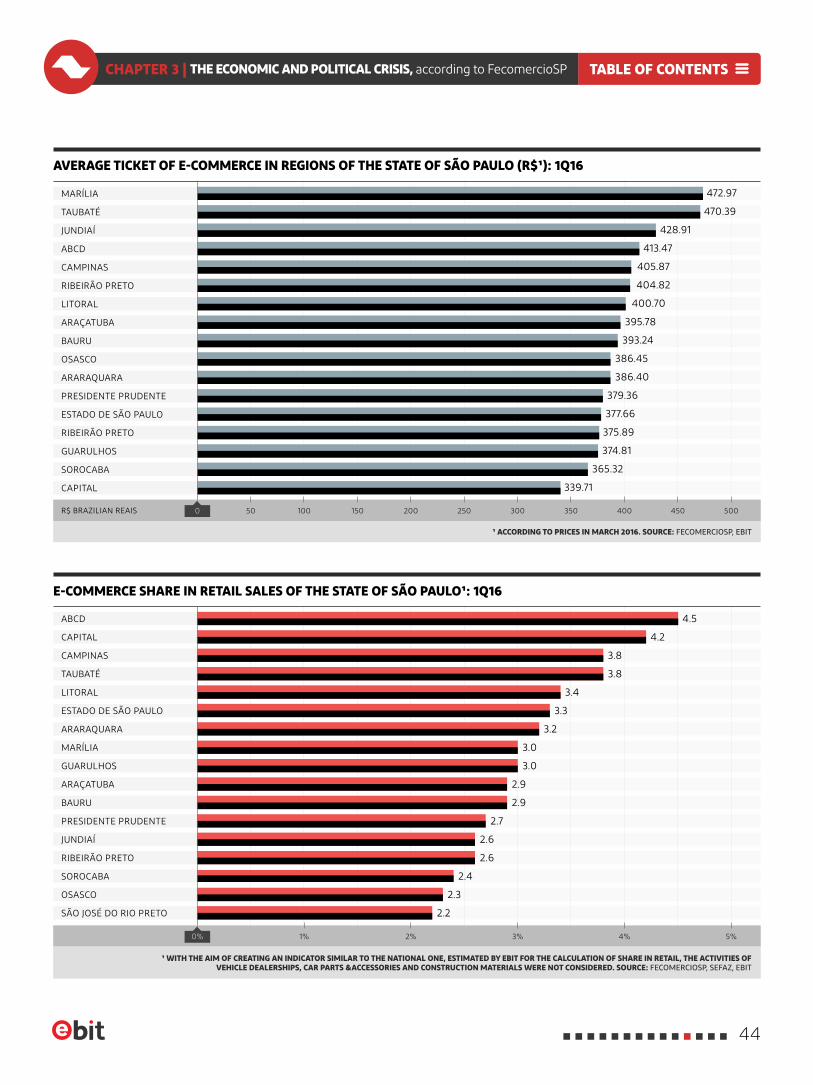
The average ticket in São Paulo was R$ 377.66 in the first quarter. The regions that registered the highest average tickets were Marília (R$ 472.97), Taubaté (R$ 470.39), and Jundiaí (R$ 428.91). At the other end, the capi-tal has the lowest average ticket, of R$ 339.71.
However, the region accounts for over 40% of the total orders and for over 36% of actual e-commerce sales; therefore, the average tick-et is naturally lower than in the other locations.
In the State of São Paulo, e-commerce share in retail (excluding the sectors Vehicle Dealerships, Car parts & Accessories, and Fur-niture & Decor) was 3.3% in the first quarter, lower than the 3.6% registered in the same pe-riod of 2015 and the 3.7% of the last quarter of 2015, when the result was influenced by the good sales performance of November in the sector due to Black Friday. In the ABCD region, share reached 4.5% in the first quarter of 2016. In the capital, it reached 4.2%.
TABLE OF CONTENTSCHAPTER 3 | THE ECONOMIC AND POLITICAL CRISIS, according to FecomercioSP
42
¹ ACCORDING TO PRICES IN MARCH 2016. SOURCE: FECOMERCIOSP, EBIT
SOURCE: FECOMERCIOSP, EBIT
REAL E-COMMERCE SALES IN REGIONS OF THE STATE OF SÃO PAULO (R$ MILLION¹): 1Q16
REAL E-COMMERCE SALES IN REGIONS OF THE STATE OF SÃO PAULO (R$¹): 1Q16 X 1Q15
BAURU
ARAÇATUBA
RIBEIRÃO PRETO
GUARULHOS
GUARULHOS
TAUBATÉ
ARAÇATUBA
BAURU
ARARAQUARA
MARÍLIA
LITORAL
ESTADO DE SÃO PAULO
TAUBATÉ
SOROCABA
CAMPINAS
ABCD
PRESIDENTE PRUDENTE
PRESIDENTE PRUDENTE
R$ MILLION
MARÍLIA
RIBEIRÃO PRETO
SÃO JOSÉ DO RIO PRETO
SÃO JOSÉ DO RIO PRETO
LITORAL
SOROCABA
ARARAQUARA
JUNDIAÍ
CAPITAL
OSASCO
CAMPINAS
CAPITAL
OSASCO
ABCD
JUNDIAÍ
250
-25%-30%-35%
750
-15%
1250
-5%
500
-20%
1000
-10%
1500
5%
0
0%
1,312
197
154
79
260
174
94
50
333
185
140
71
257
156
92
44
1.8
0.4
-4.1
-10.4
-17.0
-1.3
-5.8
-13.3
-19.4
-4.5
-11.4
-19.3
-2.7
-7.4
-15.6
-21.6
-30.4
TABLE OF CONTENTSCHAPTER 3 | THE ECONOMIC AND POLITICAL CRISIS, according to FecomercioSP
43
¹ WITH THE AIM OF CREATING AN INDICATOR SIMILAR TO THE NATIONAL ONE, ESTIMATED BY EBIT FOR THE CALCULATION OF SHARE IN RETAIL, THE ACTIVITIES OF VEHICLE DEALERSHIPS, CAR PARTS &ACCESSORIES AND CONSTRUCTION MATERIALS WERE NOT CONSIDERED. SOURCE: FECOMERCIOSP, SEFAZ, EBIT
¹ ACCORDING TO PRICES IN MARCH 2016. SOURCE: FECOMERCIOSP, EBIT
AVERAGE TICKET OF E-COMMERCE IN REGIONS OF THE STATE OF SÃO PAULO (R$¹): 1Q16
E-COMMERCE SHARE IN RETAIL SALES OF THE STATE OF SÃO PAULO¹: 1Q16
PRESIDENTE PRUDENTE
PRESIDENTE PRUDENTE
GUARULHOS
BAURU
ESTADO DE SÃO PAULO
RIBEIRÃO PRETO
SÃO JOSÉ DO RIO PRETO
CAPITAL
SOROCABA
GUARULHOS
BAURU
ARARAQUARA
MARÍLIA
ARAÇATUBA
LITORAL
CAMPINAS
CAPITAL
TAUBATÉ
OSASCO
SOROCABA
RIBEIRÃO PRETO
RIBEIRÃO PRETO
JUNDIAÍ
ESTADO DE SÃO PAULO
ARAÇATUBA
OSASCO
ARARAQUARA
LITORAL
TAUBATÉ
ABCD
CAMPINAS
JUNDIAÍ
R$ BRAZILIAN REAIS
MARÍLIA
ABCD
1%
10050
3%
200
5%
300 350 400 450
2%
150
4%
250 500
0%
0
472.97
405.87
393.24
377.66
428.91
400.70
386.40
374.81
470.39
404.82
386.45
375.89
413.47
395.78
379.36
365.32
339.71
4.5
3.4
3.0
2.6
3.8
3.2
2.9
2.4
4.2
3.3
2.9
2.6
3.8
3.0
2.7
2.3
2.2
TABLE OF CONTENTSCHAPTER 3 | THE ECONOMIC AND POLITICAL CRISIS, according to FecomercioSP
44
A fter the increase in May, the Consumer Confi-
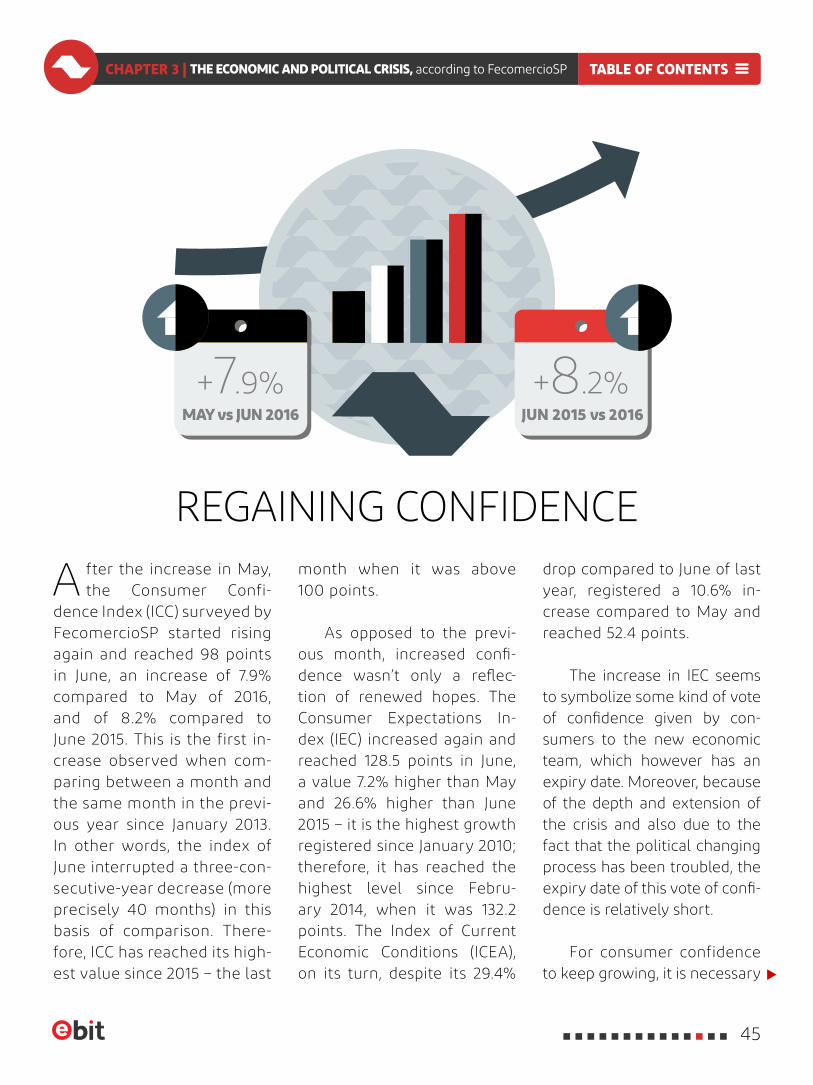
dence Index (ICC) surveyed by FecomercioSP started rising again and reached 98 points in June, an increase of 7.9% compared to May of 2016, and of 8.2% compared to June 2015. This is the first in-crease observed when com-paring between a month and the same month in the previ-ous year since January 2013. In other words, the index of June interrupted a three-con-secutive-year decrease (more precisely 40 months) in this basis of comparison. There-fore, ICC has reached its high-est value since 2015 – the last
month when it was above 100 points.
As opposed to the previ-ous month, increased confi-dence wasn’t only a reflec-tion of renewed hopes. The Consumer Expectations In-dex (IEC) increased again and reached 128.5 points in June, a value 7.2% higher than May and 26.6% higher than June 2015 – it is the highest growth registered since January 2010; therefore, it has reached the highest level since Febru-ary 2014, when it was 132.2 points. The Index of Current Economic Conditions (ICEA), on its turn, despite its 29.4%
REGAINING CONFIDENCEdrop compared to June of last year, registered a 10.6% in-crease compared to May and reached 52.4 points.
The increase in IEC seems to symbolize some kind of vote of confidence given by con-sumers to the new economic team, which however has an expiry date. Moreover, because of the depth and extension of the crisis and also due to the fact that the political changing process has been troubled, the expiry date of this vote of confi-dence is relatively short.
For consumer confidence to keep growing, it is necessary
MAY vs JUN 2016
+7.9%JUN 2015 vs 2016
+8.2%
TABLE OF CONTENTSCHAPTER 3 | THE ECONOMIC AND POLITICAL CRISIS, according to FecomercioSP
45
THE HOUSEHOLD CONSUMPTION INTENTION (ICF),
CALCULATED MONTHLY BY
FECOMERCIOSP, HAS RENOVATED THE MINIMUM
HISTORICAL VALUE AND REACHED
63 POINTS IN JUNE, A 0.9% FALL
COMPARED TO MAY
that some kind of economic policy is effectively delivered by the Government, such as structural reforms, adjust-ments public accounts with cut in costs – and not with increased taxes –, and the approval of an expenditure ceiling in the public sector and privatizations.
The measures an-
nounced so far and the speed
with which they have been announced seem to have encouraged consumers. However, if this initial momentum is not confirmed by changes and effective approvals, consumers might be discouraged again, thus undermining the expected resumption of consumption.
Improved confidence, however, hasn't influenced overall retail sales in the State of São Paulo, yet; they registered a fall on Mother's Day (May) and Valentine's Day (June) – the two major commerce dates in the first half of the year. In fact, despite the growth in the expectation indicator, consumers are still struggling with high inflation, high interests, and increased unemployment, which affect their financial situation, and consequently, their perception of current conditions. Therefore, the household consumption intention (ICF), monthly calculated by FecomercioSP, repeated the minimum historical value and reached 63 points in June, 0.9% lower than May and 22.9% lower than June 2015.
The assessment of the level of "current consumption", one of the seven items that
comprise ICF, remained at 35.2 points, the same value of May, the lowest level in the historical series. Compared to June 2015, this value is 37.4% lower. It also is the item with the lowest score among the seven items researched. The decrease in consumption level has directly reflected in retail sales, which have an accumulated fall of 6% over a year in the State of São Paulo. There are still no indications of a recovery of the sector in the short term: the intention to take on debts is still low – despite the slight increase in June – and the analysis of this moment for durable items, another component of ICF, repeated the historical minimum value in June by reaching 38.2 points, 4.2% lower than May and 32.1% lower than June 2015. It is the item with the second lowest score among the seven items researched.
Items "current revenue" and "credit access" also re-peated their minimum values in June. The former reached 69.6 points – a drop of 4.7% compared to May 2016 and of 28.7% compared to June 2015 – while the latter remained at 62.3 points – 3.5% lower than May 2016 and 28.7% lower than June 2015.
TABLE OF CONTENTSCHAPTER 3 | THE ECONOMIC AND POLITICAL CRISIS, according to FecomercioSP
46
THE END OF THE YEAR MIGHT BE BETTER
FOR RETAIL THAN ITS BEGINNING, WITH
BETTER SALES IN CHRISTMAS COMPARED
TO THIS DATE IN 2015
BETTER PERSPECTIVES
T he perception of consumers regarding current jobs has reached 87.6 points,
practically the same as May, when it was 87.4 points, but 17.4% lower than June 2015.
If the assessment of item "current jobs" was practically stable in the monthly comparison, the indicator of "professional perspective" increased 1.5% and reached 97.6 points. With improved "professional perspective", "consumption perspective" also improved: this item reached 50.4 points, 3.9% higher than May.
Data aren't as encouraging, yet, since they generally indicate dissatisfaction of households regarding consumption con-ditions. On the other hand, there was a visible improvement in perspectives, in line with ICC data. For expectations to turn into increased sales, however, consump-tion conditions must improve effectively, with price stability, labor market stability, and reduced interest rates, which will only come with an effective tax adjustment and the announcement of measures to stimulate private investments.
However, if the trend towards improving expectations is consolidated, the end of the year might be better for retail than its beginning, with better sales
in Christmas compared to this date in 2015. Still facing many uncertainties, consumers are conservative; however, they tend to gradually return to stores as a less pessimistic scenario unfolds. Consumers who only buy indispensable items today tend to resume their more ambitious plans for consumption when regaining confidence, in face of a less gloomy scenario. It is expected that from the second half of the year on, scenario will become clearer and measures for the rationalization of the public sector and the resumption of investments will reflate economy after the greatest economic crisis in the history of our country. Thence, the stakes on a Christmas that symbolizes this resumption of retail sales.
TABLE OF CONTENTSCHAPTER 3 | THE ECONOMIC AND POLITICAL CRISIS, according to FecomercioSP
47
FIPE/BUSCAPÉ INDEX
The FIPE/Buscape price index calculation is under the responsibility of the Economic
Researches Foundation Institute, represented by Prof. Sergio Crispim
CHAPTER 4
48
MONTHLY EVOLUTION OF THE FIPE/BUSCAPÉ INDEX
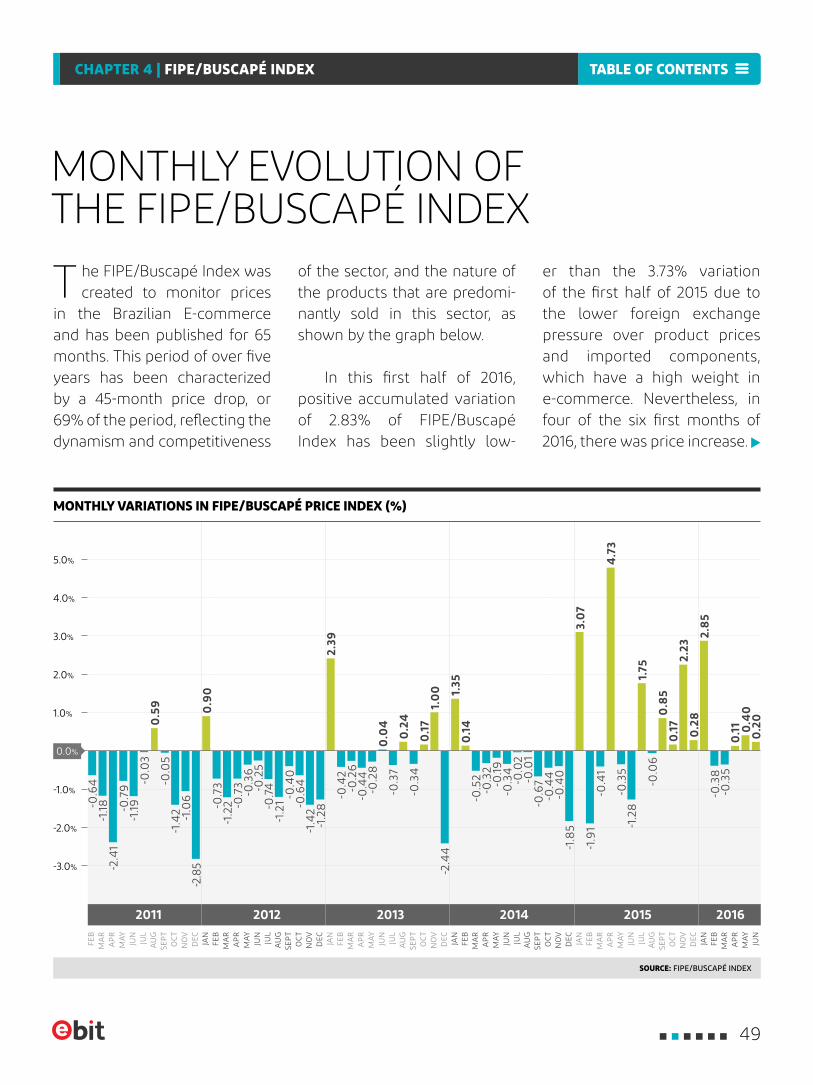
T he FIPE/Buscapé Index was created to monitor prices
in the Brazilian E-commerce and has been published for 65 months. This period of over five years has been characterized by a 45-month price drop, or 69% of the period, reflecting the dynamism and competitiveness
of the sector, and the nature of the products that are predomi- nantly sold in this sector, as shown by the graph below.
In this first half of 2016, positive accumulated variation of 2.83% of FIPE/Buscapé Index has been slightly low-
er than the 3.73% variation of the first half of 2015 due to the lower foreign exchange pressure over product prices and imported components, which have a high weight in e-commerce. Nevertheless, in four of the six first months of 2016, there was price increase.
MONTHLY VARIATIONS IN FIPE/BUSCAPÉ PRICE INDEX (%)
SOURCE: FIPE/BUSCAPÉ INDEX
-2.0%
-3.0%
0.0%
2.0%
5.0%
-1.0%
1.0%
4.0%
3.0%
DEC
FEB
JUN
AP
R
AU
G
MA
R
JUL
NO
VO
CT
MA
Y
SEP
T
JAN
FEB
MA
R
JAN
JUN
JUL
OC
T
AP
R
AU
G
DEC
NO
V
MA
Y
SEP
T
FEB
JUN
OC
T
AP
R
AU
G
DEC
MA
R
JUL
NO
V
MA
Y
SEP
T
JAN
FEB
JUN
AP
RM
AR
MA
Y
JAN
FEB
JUN
OC
T
AP
R
AU
G
DEC
MA
R
JUL
NO
V
MA
Y
SEP
T
JAN
FEB
JUN
OC
T
AP
R
AU
G
DEC
MA
R
JUL
NO
V
MA
Y
SEP
T
2011 2012 2013 2014 20162015
-0.6
4
-1.19
-0.3
6
-0.19
-0.2
8
-0.3
5
-2.4
1
-1.2
2 -0.5
2
-0.2
6
-0.4
1
-0.7
4 -0.0
2
-0.3
7
-1.18 -0
.73
-0.4
2
-1.9
1
-0.0
3
-0.2
5
-0.3
4
-1.2
8-0.7
9
-0.7
3 -0.3
2
-0.4
4-0.0
5
-1.2
1
-0.0
1
-0.0
6
-0.3
8-0
.35
-1.4
2
-0.4
0
-0.6
7
-0.3
4
-1.0
6 -0.6
4
-0.4
4
-2.8
5
-1.4
2
-0.4
0
-1.2
8
-1.8
5
-2.4
4
4.7
3
0.9
0 1.35
2.39
3.0
7
0.5
9
1.75
0.1
4
0.0
4
0.2
4 0.8
5
0.1
7
2.8
5
1.0
0
2.23
0.2
8
0.1
7
0.1
1 0.4
00
.20
TABLE OF CONTENTSCHAPTER 4 | FIPE/BUSCAPÉ INDEX
49
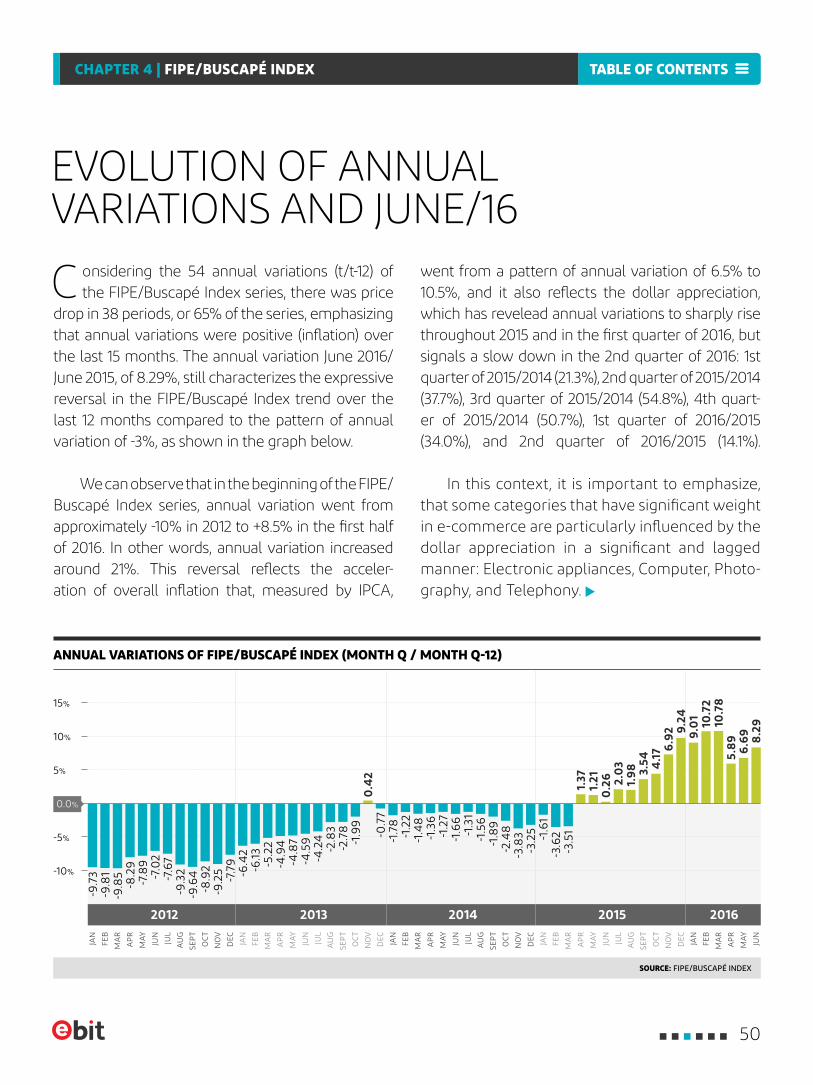
C onsidering the 54 annual variations (t/t-12) of the FIPE/Buscapé Index series, there was price
drop in 38 periods, or 65% of the series, emphasizing that annual variations were positive (inflation) over the last 15 months. The annual variation June 2016/June 2015, of 8.29%, still characterizes the expressive reversal in the FIPE/Buscapé Index trend over the last 12 months compared to the pattern of annual variation of -3%, as shown in the graph below.
We can observe that in the beginning of the FIPE/Buscapé Index series, annual variation went from approximately -10% in 2012 to +8.5% in the first half of 2016. In other words, annual variation increased around 21%. This reversal reflects the acceler- ation of overall inflation that, measured by IPCA,
went from a pattern of annual variation of 6.5% to 10.5%, and it also reflects the dollar appreciation, which has revelead annual variations to sharply rise throughout 2015 and in the first quarter of 2016, but signals a slow down in the 2nd quarter of 2016: 1st quarter of 2015/2014 (21.3%), 2nd quarter of 2015/2014 (37.7%), 3rd quarter of 2015/2014 (54.8%), 4th quart-er of 2015/2014 (50.7%), 1st quarter of 2016/2015 (34.0%), and 2nd quarter of 2016/2015 (14.1%).
In this context, it is important to emphasize, that some categories that have significant weight in e-commerce are particularly influenced by the dollar appreciation in a significant and lagged manner: Electronic appliances, Computer, Photo- graphy, and Telephony.
EVOLUTION OF ANNUAL VARIATIONS AND JUNE/16
ANNUAL VARIATIONS OF FIPE/BUSCAPÉ INDEX (MONTH Q / MONTH Q-12)
SOURCE: FIPE/BUSCAPÉ INDEX
-5%
-10%
10%
FEB
JUN
AP
R
MA
R
MA
Y
JAN
FEB
JUN
OC
T
AP
R
AU
G
DEC
MA
R
JUL
NO
V
MA
Y
SEP
T
JAN
FEB
JUN
OC
T
AP
R
AU
G
DEC
MA
R
JUL
NO
V
MA
Y
SEP
T
JAN
FEB
MA
R
JAN
JUN
JUL
OC
T
AP
R
AU
G
DEC
NO
V
MA
Y
SEP
T
DEC
FEB
JUN
AP
R
AU
G
MA
R
JUL
NO
V
OC
T
MA
Y
SEP
T
JAN
5%
0.0%
15%
2012 2013 2014 20162015
0.4
2
1.37 1.98
0.2
6
4.17
3.54
1.21 2.
03
6.92 9.
249.
01 10.7
210
.78
5.8
96.
69 8.29
-9.7
3 -6.4
2
-1.2
2
-7.6
7 -4.2
4 -1.5
6
-1.6
1
-9.8
5
-5.2
2
-1.3
6
-9.6
4
-2.7
8-1
.99
-2.4
8
-3.5
1
-7.8
9 -4.8
7 -1.6
6
-3.8
3
-9.2
5
-9.8
1 -6.13
-1.4
8
-9.3
2
-2.8
3
-1.8
9
-3.6
2
-8.2
9 -4.9
4
-1.2
7
-8.9
2
-7.0
2 -4.5
9
-1.3
1
-3.2
5
-7.7
9
-0.7
7-1
.78
TABLE OF CONTENTSCHAPTER 4 | FIPE/BUSCAPÉ INDEX
50
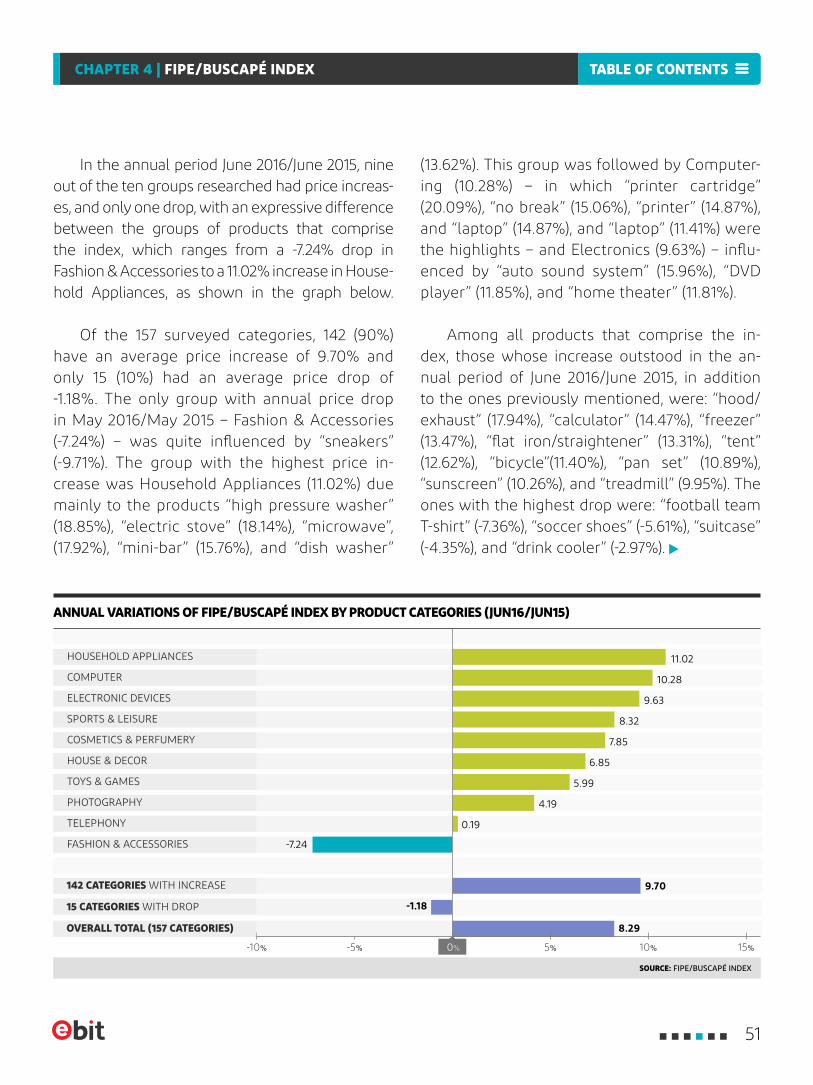
In the annual period June 2016/June 2015, nine out of the ten groups researched had price increas-es, and only one drop, with an expressive difference between the groups of products that comprise the index, which ranges from a -7.24% drop in Fashion & Accessories to a 11.02% increase in House-hold Appliances, as shown in the graph below.
Of the 157 surveyed categories, 142 (90%) have an average price increase of 9.70% and only 15 (10%) had an average price drop of -1.18%. The only group with annual price drop in May 2016/May 2015 – Fashion & Accessories (-7.24%) – was quite influenced by “sneakers” (-9.71%). The group with the highest price in-crease was Household Appliances (11.02%) due mainly to the products “high pressure washer” (18.85%), “electric stove” (18.14%), “microwave”, (17.92%), “mini-bar” (15.76%), and “dish washer”
(13.62%). This group was followed by Computer- ing (10.28%) – in which “printer cartridge” (20.09%), “no break” (15.06%), “printer” (14.87%), and “laptop” (14.87%), and “laptop” (11.41%) were the highlights – and Electronics (9.63%) – influ-enced by “auto sound system” (15.96%), “DVD player” (11.85%), and “home theater” (11.81%).
Among all products that comprise the in-dex, those whose increase outstood in the an-nual period of June 2016/June 2015, in addition to the ones previously mentioned, were: “hood/exhaust” (17.94%), “calculator” (14.47%), “freezer” (13.47%), “flat iron/straightener” (13.31%), “tent” (12.62%), “bicycle”(11.40%), “pan set” (10.89%), “sunscreen” (10.26%), and “treadmill” (9.95%). The ones with the highest drop were: “football team T-shirt” (-7.36%), “soccer shoes” (-5.61%), “suitcase” (-4.35%), and “drink cooler” (-2.97%).
ANNUAL VARIATIONS OF FIPE/BUSCAPÉ INDEX BY PRODUCT CATEGORIES (JUN16/JUN15)
SOURCE: FIPE/BUSCAPÉ INDEX
15 CATEGORIES WITH DROP
OVERALL TOTAL (157 CATEGORIES)
142 CATEGORIES WITH INCREASE
10%-10% 0%-5% 5% 15%
FASHION & ACCESSORIES
HOUSEHOLD APPLIANCES
TOYS & GAMES
ELECTRONIC DEVICES
COMPUTER
HOUSE & DECOR
TELEPHONY
COSMETICS & PERFUMERY
SPORTS & LEISURE
PHOTOGRAPHY
11.02
9.63
7.85
10.28
8.32
6.85
5.99
4.19
0.19
-7.24
-1.18
9.70
8.29
TABLE OF CONTENTSCHAPTER 4 | FIPE/BUSCAPÉ INDEX
51
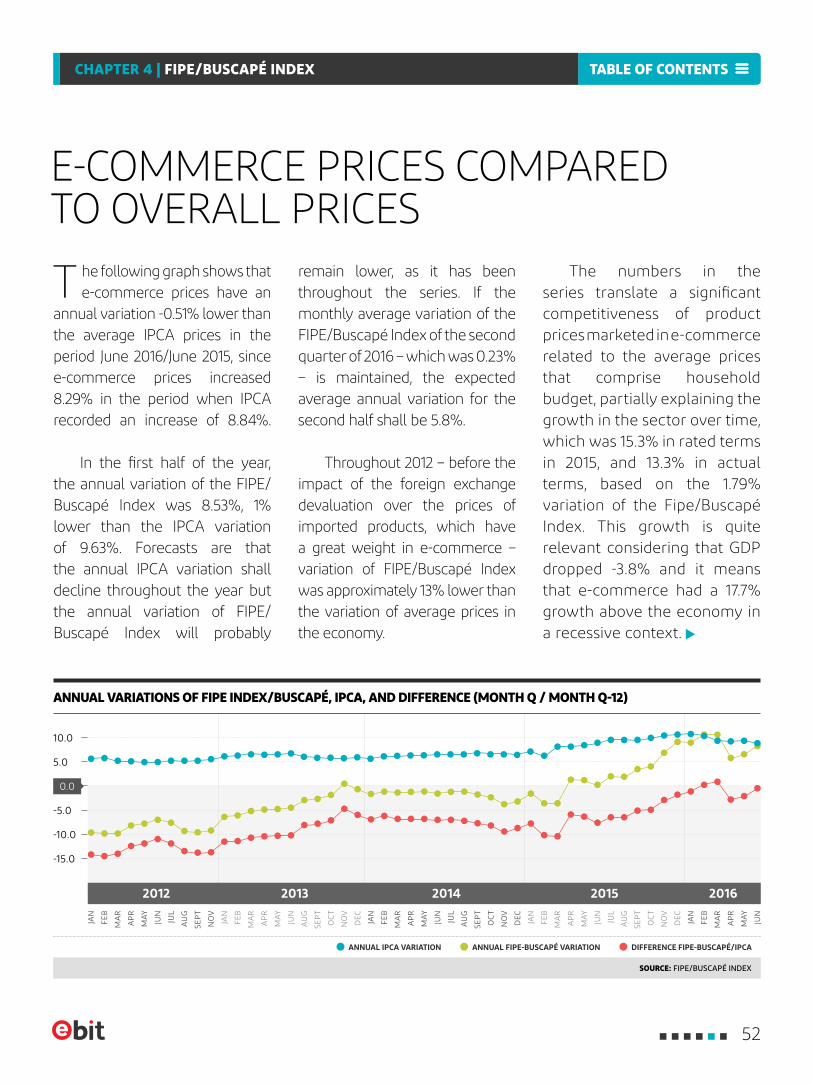
E-COMMERCE PRICES COMPARED TO OVERALL PRICES
T he following graph shows that e-commerce prices have an
annual variation -0.51% lower than the average IPCA prices in the period June 2016/June 2015, since e-commerce prices increased 8.29% in the period when IPCA recorded an increase of 8.84%.
In the first half of the year, the annual variation of the FIPE/Buscapé Index was 8.53%, 1% lower than the IPCA variation of 9.63%. Forecasts are that the annual IPCA variation shall decline throughout the year but the annual variation of FIPE/Buscapé Index will probably
The numbers in the series translate a significant competitiveness of product prices marketed in e-commerce related to the average prices that comprise household budget, partially explaining the growth in the sector over time, which was 15.3% in rated terms in 2015, and 13.3% in actual terms, based on the 1.79% variation of the Fipe/Buscapé Index. This growth is quite relevant considering that GDP dropped -3.8% and it means that e-commerce had a 17.7% growth above the economy in a recessive context.
remain lower, as it has been throughout the series. If the monthly average variation of the FIPE/Buscapé Index of the second quarter of 2016 – which was 0.23% – is maintained, the expected average annual variation for the second half shall be 5.8%.
Throughout 2012 – before the impact of the foreign exchange devaluation over the prices of imported products, which have a great weight in e-commerce – variation of FIPE/Buscapé Index was approximately 13% lower than the variation of average prices in the economy.
ANNUAL IPCA VARIATION ANNUAL FIPE-BUSCAPÉ VARIATION DIFFERENCE FIPE-BUSCAPÉ/IPCA
ANNUAL VARIATIONS OF FIPE INDEX/BUSCAPÉ, IPCA, AND DIFFERENCE (MONTH Q / MONTH Q-12)
SOURCE: FIPE/BUSCAPÉ INDEX
2012 2013 2014 20162015
FEB
JUN
AP
R
MA
R
MA
Y
JAN
DEC
FEB
JUN
OC
T
AP
R
AU
G
MA
R
JUL
NO
V
MA
Y
SEP
T
JAN
FEB
JUN
OC
T
AP
R
AU
G
DEC
MA
R
JUL
NO
V
MA
Y
SEP
T
JAN
FEB
MA
R
JAN
JUN
OC
T
AP
R
AU
G
DEC
NO
V
MA
Y
SEP
T
FEB
JUN
AP
R
AU
G
MA
R
JUL
NO
V
MA
Y
SEP
T
JAN
0.0
-10.0
-5.0
5.0
-15.0
10.0
TABLE OF CONTENTSCHAPTER 4 | FIPE/BUSCAPÉ INDEX
52
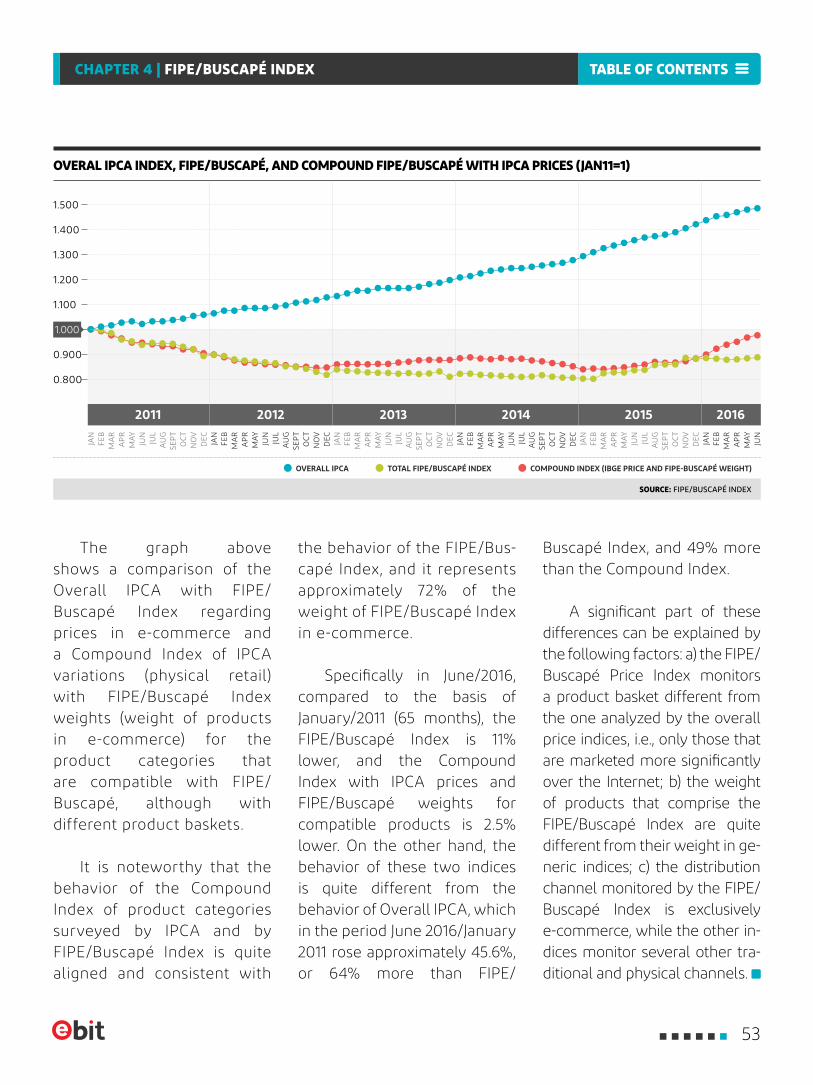
The graph above shows a comparison of the Overall IPCA with FIPE/Buscapé Index regarding prices in e-commerce and a Compound Index of IPCA variations (physical retail) with FIPE/Buscapé Index weights (weight of products in e-commerce) for the product categories that are compatible with FIPE/Buscapé, although with different product baskets.
It is noteworthy that the behavior of the Compound Index of product categories surveyed by IPCA and by FIPE/Buscapé Index is quite aligned and consistent with
Buscapé Index, and 49% more than the Compound Index.
A significant part of these differences can be explained by the following factors: a) the FIPE/Buscapé Price Index monitors a product basket different from the one analyzed by the overall price indices, i.e., only those that are marketed more significantly over the Internet; b) the weight of products that comprise the FIPE/Buscapé Index are quite different from their weight in ge-neric indices; c) the distribution channel monitored by the FIPE/Buscapé Index is exclusively e-commerce, while the other in-dices monitor several other tra-ditional and physical channels.
OVERALL IPCA TOTAL FIPE/BUSCAPÉ INDEX COMPOUND INDEX (IBGE PRICE AND FIPE-BUSCAPÉ WEIGHT)
the behavior of the FIPE/Bus-capé Index, and it represents approximately 72% of the weight of FIPE/Buscapé Index in e-commerce.
Specifically in June/2016, compared to the basis of January/2011 (65 months), the FIPE/Buscapé Index is 11% lower, and the Compound Index with IPCA prices and FIPE/Buscapé weights for compatible products is 2.5% lower. On the other hand, the behavior of these two indices is quite different from the behavior of Overall IPCA, which in the period June 2016/January 2011 rose approximately 45.6%, or 64% more than FIPE/
OVERAL IPCA INDEX, FIPE/BUSCAPÉ, AND COMPOUND FIPE/BUSCAPÉ WITH IPCA PRICES (JAN11=1)
SOURCE: FIPE/BUSCAPÉ INDEX
20122011 2013 2014 20162015
FEB
JUN
AP
RM
AR
MA
Y
JAN
FEB
JUN
OC
T
AP
R
AU
G
DEC
MA
R
JUL
NO
V
MA
Y
SEP
T
JAN
FEB
JUN
OC
T
AP
R
AU
G
DEC
MA
R
JUL
NO
V
MA
Y
SEP
T
JAN
FEB
MA
R
JAN
JUN
JUL
OC
T
AP
R
AU
G
DEC
NO
V
MA
Y
SEP
T
DEC
FEB
JUN
AP
R
AU
G
MA
R
JUL
NO
VO
CT
MA
Y
SEP
T
JAN
FEB
MA
R
JAN
JUN
JUL
OC
T
AP
R
AU
G
DEC
NO
V
MA
Y
SEP
T
0.800
0.900
1.500
1.200
1.100
1.300
1.400
1.000
TABLE OF CONTENTSCHAPTER 4 | FIPE/BUSCAPÉ INDEX
53
54
FINALCONSIDERATIONS
54
MAIN CLIENTS
55
TABLE OF CONTENTSFINAL CONSIDERATIONS | MAIN CLIENTS
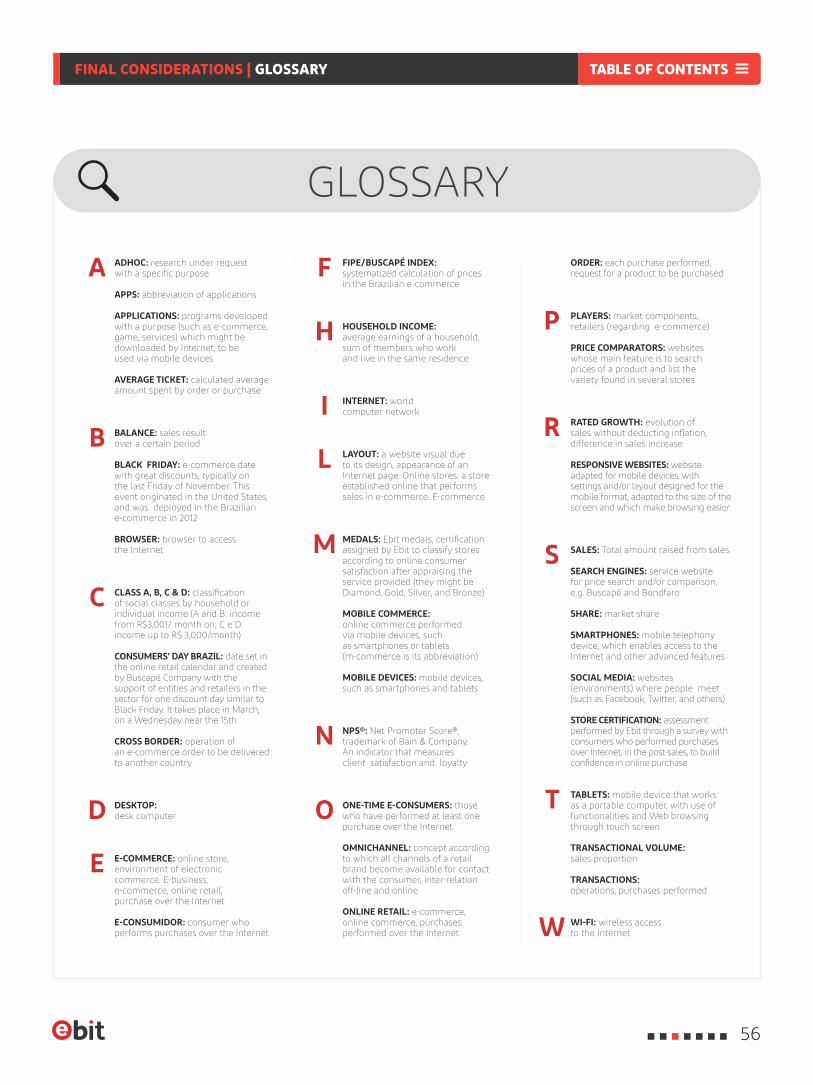
GLOSSARY
ADHOC: research under request with a specific purpose
APPS: abbreviation of applications
APPLICATIONS: programs developed with a purpose (such as e-commerce, game, services) which might be downloaded by Internet, to be used via mobile devices
AVERAGE TICKET: calculated average amount spent by order or purchase
BALANCE: sales result over a certain period
BLACK FRIDAY: e-commerce date with great discounts, typically on the last Friday of November. This event originated in the United States, and was deployed in the Brazilian e-commerce in 2012
BROWSER: browser to access the Internet
CLASS A, B, C & D: classification of social classes by household or individual income (A and B: income from R$3,001/ month on; C e D: income up to R$ 3,000/month)
CONSUMERS' DAY BRAZIL: date set in the online retail calendar and created by Buscapé Company with the support of entities and retailers in the sector for one discount day similar to Black Friday. It takes place in March, on a Wednesday near the 15th
CROSS BORDER: operation of an e-commerce order to be delivered to another country
DESKTOP: desk computer
E-COMMERCE: online store, environment of electronic commerce. E-business, e-commerce, online retail, purchase over the Internet
E-CONSUMIDOR: consumer who performs purchases over the Internet
FIPE/BUSCAPÉ INDEX: systematized calculation of prices in the Brazilian e-commerce
HOUSEHOLD INCOME: average earnings of a household, sum of members who work and live in the same residence
INTERNET: world computer network
LAYOUT: a website visual due to its design, appearance of an Internet page. Online stores: a store established online that performs sales in e-commerce. E-commerce
MEDALS: Ebit medals, certification assigned by Ebit to classify stores according to online consumer satisfaction after appraising the service provided (they might be Diamond, Gold, Silver, and Bronze)
MOBILE COMMERCE: online commerce performed via mobile devices, such as smartphones or tablets (m-commerce is its abbreviation)
MOBILE DEVICES: mobile devices, such as smartphones and tablets
NPS®: Net Promoter Score®, trademark of Bain & Company. An indicator that measures client satisfaction and loyalty
ONE-TIME E-CONSUMERS: those who have performed at least one purchase over the Internet
OMNICHANNEL: concept according to which all channels of a retail brand become available for contact with the consumer, inter-relation off-line and online
ONLINE RETAIL: e-commerce, online commerce, purchases performed over the Internet
A
D O
P
R
S
T
W
E
F
I
L
M
N
B
C
ORDER: each purchase performed, request for a product to be purchased
PLAYERS: market components, retailers (regarding e-commerce)
PRICE COMPARATORS: websites whose main feature is to search prices of a product and list the variety found in several stores
RATED GROWTH: evolution of sales without deducting inflation, difference in sales increase
RESPONSIVE WEBSITES: website adapted for mobile devices, with settings and/or layout designed for the mobile format, adapted to the size of the screen and which make browsing easier.
SALES: Total amount raised from sales
SEARCH ENGINES: service website for price search and/or comparison, e.g. Buscapé and Bondfaro
SHARE: market share
SMARTPHONES: mobile telephony device, which enables access to the Internet and other advanced features
SOCIAL MEDIA: websites (environments) where people meet (such as Facebook, Twitter, and others)
STORE CERTIFICATION: assessment performed by Ebit through a survey with consumers who performed purchases over Internet, in the post-sales, to build confidence in online purchase
TABLETS: mobile device that works as a portable computer, with use of functionalities and Web browsing through touch screen
TRANSACTIONAL VOLUME: sales proportion
TRANSACTIONS: operations, purchases performed
WI-FI: wireless access to the Internet
H
56
TABLE OF CONTENTSFINAL CONSIDERATIONS | GLOSSARY
The Federation of Commerce of Goods, Services, and Tourism of the State of São Paulo (FecomercioSP)
is the main union entity of São Paulo for the commerce and service sectors. Responsible for managing the Social
Service of Commerce (Sesc) and the National Service of Commercial Apprenticeship (Senac) in this State, it
represents an Economy segment that mobilizes over 1.8 million business activities of all sizes, and it gathers 154 employers' unions, which account for 11% of the GDP
in São Paulo – around 4% of the Brazilian GDP –, generating around five million jobs.
www.fecomercio.com.br
57
TABLE OF CONTENTS
MARKETING SUPPORT
PREMIUM PARTNER
FINAL CONSIDERATIONS | MARKETING SUPPORT
About the Brazilian Chamber of E-commerce: The mission of camara-e.net, main multi-sector entity in Latin America and Brazilian association with the highest representativeness in Online Economy, is to qualify people and organizations for the safe practice of online businesses. With 15 years since its foundation, its role has been essential to the formulationof public policies in line with modern society's aspirations, and especially to enhance sectorial regulatory milestones that provide legal support to the incentive measures required for the development of our country.
Since 1894, the Commercial Association of São Paulo has worked on behalf of entrepreneurs who have activities in the city of São Paulo. From family businesses to large industries, over 30 thousand entrepreneurs have the support of the Association to defend their interests before society and the Government and in providing exclusive services that make theentrepreneur's daily life easier.
E-Commerce Brasil is an e-commerce market fostering project in Brazil and it offers over 100 activities throughout the year, among which are: specialized content
www.acsp.com.br
www.ecommercebrasil.com.br
posted on the E-Commerce Brasil portal on a daily basis, print magazines, trainings for professionals in the sector, as well as promoting a series of events throughout the country, with emphasis on the E-Commerce Brasil Forum, major e-commerce event in the world and in Latin America, according to Forrester.
www.camara-e.net
OTHER PARTNERS
58
TABLE OF CONTENTSFINAL CONSIDERATIONS | MARKETING SUPPORT
The Instituto Brasileiro de Executivos de Varejo & Mercado de Consumo (Brazilian Institute of Retail Executives & Consumer Market) is a non-profitable institution. It was founded in December 2009, in São Paulo, by a group of professionals linked to the retailer sector, with the objective of establishing discussion groups, relationships, and knowledge regarding this market.
Founded in 1998 with the core mission of developing the interactive media market in Brazil. From 2006 on, the Interactive Media Association (AMI) became a part of the most important network of associations in the world – the Interactive Advertising Bureau –, changing its designation to IAB Brasil. Since then, this association has been part of an international network of associations, which has representations in over 43 countries, among which are the USA, Australia, Singapore, Spain, France, England, Italy, Chile, and Mexico. IAB Brasil has currently more than 230 associates, among websites, portals, technology companies, Web-developing agencies, which are leaders in their segment in the country.
MMA is the main non-profitable association of the mobile ecosystem worldwide, with over 800 partner companies in approximately 50 countries.
www.ibevar.org.br
iabbrasil.net
www.mmaglobal.com
Our partners come from all segments of Mobile Marketing, including brands, advertisers, agencies, technology platforms, media companies, operators, among others. MMA's mission is to speed up changes and innovation in marketing through mobile devices, promoting growth in the business with high involvement of consumers.
59
TABLE OF CONTENTSFINAL CONSIDERATIONS | MARKETING SUPPORT
ANDRÉ RICARDO DIASEbit COO
+55 11 3848-8700
PEDRO GUASTIEbit CEO
+55 11 3848-8700
TEAM/CONTACTS
PRESS OFFICEFIRSTCOM COMUNICAÇÃO
www.firstcom.com.br+55 11 3034-4662
LUIS CLAUDIO ALLAN [email protected]
CÍNTIA YAMASHIRO [email protected]
JANAINA CAVALHEIRI [email protected]
ART & LAYOUT RITA MAYUMI
www.ritamayumi.com
EBIT TEAMKEINE MONTEIROBusiness Intelligence
JÉSSICA OLIVEIRABusiness Intelligence
RENANN MENDESMarketing and Operations Coordinator
LETÍCIA AVELARMarketing Analyst
VITÓRIA JABURMarketing Analyst
MÁRIO FROESIT Manager
IMPLEMENTATION OF EBIT SURVEY
Contact
Know more aqui
REPORT AND SURVEY
ENGAGEMENTContact
CONSIDERAÇÕES FINAIS | INFORMAÇÕES PARA IMPRENSA / CONTATOS
Ebit requires to be referred to as a source of information in any academic study, press release,
opinion article, editorial, or news article stating data collected in its studies about the Brazilian e-commerce market,
especially the Webshoppers report. We reinforce that the data is Ebit´s propriety, and therefore, those who use it must always
inform the source, in order to enhance the credibility of the information and avoid that data disclosed by the company is attributed to other source.
PRESS INFORMATION
EBIT DATA DISCLOSURE
60
TABLE OF CONTENTSFINAL CONSIDERATIONS | PRESS INFORMATION / TEAM/CONTACTS

www.ebit.com.br
www.buscapecompany.com