Embed Size (px)
Citation preview
i
Perception of Consumers
Towards Kwality Wall’s
A
Business Research Methodology Project
Submitted to
Mr. Namita Kapoor
Amity Business School
Amity University
Project Team
Owais Ashraf Abhitanjay Chaudhary Jasleen Kaur
Surbhi Kapoor Rakesh Agarwal Astha Prasad

ii
Remarks by Faculty In-charge
iii
Acknowledgement
This report gives details of our research project undertaken during semester II of
our Masters of Business Administration program been undertaken at Amity
Business School.
We are very grateful to our faculty mentor Ms. Namita Kaoppr for her help,
guidance, and for sparing time from his busy schedule towards correcting our
and directing our project.
We want to thank our college “Amity Business School” for providing us an
opportunity to undergo and carry out this Research and Study Project along with
other related assignments/Projects.
Abhitanjay Chaudhary Owais Ashraf Jasleen Kaur
Surbhi Kapoor Astha Prasad
Rakesh Agarwal
iv
Certificate
We, Abhitanjay Chaudhary, Owais Ashraf, Jasleen Kaur, Surbhi Kapoor,
Astha Prasad and Rakesh Agarwal, students of first year MBA-M&S program
at Amity Business School, declare that this report contains only work completed
by six of us except for the information obtained in a legitimate way from
literature, company or university sources which is properly marked as reference
and annexed in appendices, in accordance with the norms of Amity University on
Plagiarism.
Abhitanjay Chaudhary Owais Ashraf Jasleen Kaur
Surbhi Kapoor Astha Prasad Rakesh Agarwal
v
Table of Contents
1. Introduction . 1
1.1. Background of Study.……………………………………………...…...1
1.2. Purpose of Study.………………………………………………………1
1.3. Significance of Study.……………………………………………...…..2
1.4. Objective of Study……………………………………….…………….2
1.5. Methodology Used………………………………………..……………2
1.6. Organization of Report……………………………………..………….3
2. Literature Review and Conceptual Framework 4
2.1. Review of Literature .…………………………………………………..4
2.2. Conceptual Framework……………………………………………..….5
3. Research Methodology
3.1. Research Design…………………………………………………….....7
3.2. Data Collection Technique…………………………………………….7
3.3. Sampling Plan………………………………………………………….7
3.4. Data Analysis Technique………………………………………………7
4. Data Analysis, Findings and Interpretation
4.1. SPSS Analysis Results…………………………………………...…….8
4.2. Interpretation of Results…………………………………………..…..22
4.3. Key Findings………………………………………………………….22
5. Conclusion, Suggestion and Limitations 23
6. Bibliography 24
7. Research Questionnaire 25
vi
List of Tables
o Table 4.1. – Descriptive Analysis of all Question 08
o Table 4.2. – Frequency Analysis of Question 1 09
o Table 4.3. – Frequency Analysis of Question 2 09
o Table 4.4. – Frequency Analysis of Question 3 10
o Table 4.5. – Frequency Analysis of Question 5(1) 11
o Table 4.6. – Frequency Analysis of Question 5(2) 11
o Table 4.7. – Frequency Analysis of Question 5(3) 12
o Table 4.8. – Frequency Analysis of Question 5(4) 12
o Table 4.9. – Frequency Analysis of Question 5(5) 13
o Table 4.10. – Frequency Analysis of Question 5(6) 13
o Table 4.11. – Frequency Analysis of Question 5(7) 14
o Table 4.12. – Frequency Analysis of Question 5(8) 14
o Table 4.13. – Frequency Analysis of Question 5(9) 15
o Table 4.14. – Frequency Analysis of Question 6 16
o Table 4.15. – Frequency Analysis of Question 7 16
o Table 4.16. – Descriptive Analysis of All Question 17
o Table 4.17. – one sample T-Test 18
o Table 4.18. – Coorelation and KMO Bartlett’s Test 19
o Table 4.19. – Tables for Factor Analysis Results 20
o Table 4.20. – Component Matrix after Factor Analysis 21
vii
Executive Summary
Through the analysis of Literature Review and study of secondary data we came to
the conclusion that Kwality Wall’s being a very promising Ice-Cream Company was
not doing as good as it should in Delhi-NCR. So through this research, we intend to
find out what it is that is not going well for the company and for our own learning
find some suitable way outs for the same. This is all found by collecting primary
data on consumer perception for the brand “Kwality Wall’s”.
Through this project we intend to identify how customers feel about the products
and services offered by Kwality Wall’s and how it is perceived by the customers in
comparison with other related brands. We collected information through primary
data collection instrument, a questionnaire to analyses customer satisfaction and
their perception about Kwality Wall’s.
The project helped us in understanding SWOT analysis on Kwality Wall’s wherein
we described the companies’ strengths over its competitors and its weaknesses in
achieving customer satisfaction. We also forwarded some of our ideas that benefit
the company in creating a better product and service delivery process so as to
achieve customer delight.
1
1. Introduction
1.1. Background of Study
Kwality Wall’s is one of the most trusted and favorite ice-cream brand in India
which is having a large fleet of tricycle vendors for distributing products in public
places and residential colonies, along with large number of authorized point of
sales (POS) and private distributors.
In a study, we found that the company has 42 company owned parlors across
Delhi-NCR which specially serve Kwality Wall’s conceptual ice-cream treats.
These parlors are named as SWIRLS. Apart from these, the company also has
approx. 10,000 tricycle vendors across NCR.
After the idea of these facts we also came across many complaints about the
company on online blogs, hence we conducted this survey to find consumer
perception towards Kwality Wall’s, through this research.
1.2. Purpose of Study
Through this study we intend to identify how customers feel about the products and
services offered by Kwality Wall’s and how it is perceived by the customers in
comparison with other related brands. We collect information through primary data
collection instruments, most probably a questionnaire to analyses customer
satisfaction and their perception about Kwality Wall’s.
The project will uncover, from a customer stand point, the quality of products and
services offered by Kwality Wall’s and on the other hand help us to understand
what it is that the company can do to improve its service delivery and achieve
customer delight.
2
The study will help us to conduct a S.W.O.T. analysis of the company to identify
its major strengths over its competitors, its weaknesses, opportunities and threats
that it faces in the open market.
1.3. Significance of Study
Delhi-NCR has a large residing population and majority of them are youngsters or
children who love to enjoy ice-cream. Kwality Wall’s being one of the old players
in the market has a very large customer base in this region.
Conducting this research to find the consumer perception towards Kwality Wall’s
will in turn help the company to better understand the needs of their customers and
fulfill any gaps if found in the study.
1.4. Objectives of Study
To identify customer perception towards Kwality Wall’s
Customer preference for Kwality Wall’s as compared to other such brands.
To identify the strengths and weaknesses of Kwality Wall’s customer
delivery process.
To identify ease of availability of Kwality Wall’s Products from customer
and distributors perspective.
1.5. Methodology Used
We collected information through primary data collection instrument, using a
questionnaire. This method covered a large number of respondents from all
over Delhi-NCR region. We analyzed all responses from 120 respondent
customer and their satisfaction level along with their perception about Kwality
Wall’s brand was recorded and studied.
3
1.6. Organization of Report
This report is divided into 5 main chapters.
Chapter-1 is the introductory part of this report that lists the background study,
purpose and significance of study along with study objectives and methodology
used.
Chapter-2 focuses on the literature review been undertaken before commencing of
this project. Conceptual framework is also included in this section.
Chapter-3 talks about the research methodology used to conduct this primary
study.
Chapter-4 houses all the project findings, data analysis and interpretation of
results obtained after SPSS analysis.
Chapter-5 gives us ths conclusion, limitations and suggestions from our side to the
company for improving on the weaker sections which are highlighted by our study.
*************************************
4
2. Literature Review and Conceptual Framework
2.1. Review of Literature
P.R.S. Moorthy, and R. Balachandran (1992) worked on Ice-cream Industry
and its future scope in India in1993 took stock of the production and scope for
expanding the supply. The various strategies that will help to increase the
market potential in view of the growing competition from other players. The
study also focuses on certain non-conventional stabilizers and their effect on
ice-cream mix.
Chand Subhash, Dixit, P. K., and Singh, R. V. (1999) bought out a case study
in1999 on Marketing Management of Ice-cream in Bangalore. The case study
focuses on the marketing and advertising strategies for sales promotion of ice-
cream. The pricing strategies and a distinct packaging and flavours which dairy
industries can adopt during the marketing of Ice-cream.
Vinay Kamath, (2002) traced out the reasons for profitability of HLL and now
known as Hindustan Liver Ltd. The strategy of promoting Kwality Walls as an
umbrella brand for its ice creams, rather than a product-driven promotion, has
worked to a nicety to the company.
Sindhu J. Bhattacharya, (2004) explored the reasons for MNCs to penetrate into
the ice cream market in India. The study has come up with ways and means of
achieving the success despite the hurdles.
Robert Marshall, T. Douglas Goff, Richard W. Hartel (2003) worked on Ice-
cream industry in 2003 US market which has been well developed after the
initial introduction of the product by Europe. The study has traced the history,
composition and properties, features of icecream industry which has been well
developed market. The study also analyses the production and consumption
pattern of ice-cream in the country.
5
Davis, C.G., Blayney, D.P., Yen, S.T., & Cooper, J. (2009) study deals with an
analysis of at-home demand for ice cream in the United States was to determine
the effect that changes in retail prices and consumer income have on at-home
ice cream consumption. The analysis was based on Nielsen 2005 home scan
retail data and used marital status, age, race, education, female employment
status, and location in the estimations of aggregate demand elasticities.
Chitra Unnithan, (2010) emphasized the need for a sustainable innovation in
tune with changing time and trends. The commercial success of business
depends upon the value creating- ways. The successful innovation in turn
hinges on state-of-art ice cream plants employed by the firms.
Thus, there are very few studies on the Ice-cream Market in India that really
analyses the trends in the market and challenges faced by the players in the highly
competitive environment. The study has taken up with the following objectives in
mind.
2.2. Conceptual Framework
There is no industry in India or in the world for that matter which is not undergoing
through cut throat competition and entry of more and more players who intensify
this competition by capturing market share and bringing in innovation.
“The ice cream industry in India is estimated to be around Rs 2,000 crores, out of
which almost 40% is under the control of the organized sector. Amul becomes the
leader by holding 36-38% market share (5% of its total revenues), followed by
Kwality Walls & Vadilal with about 12-14% share each. These players not only
have to fight the small local and cottage industry players, but also the fact that the
Indian cuisine itself offers a large variety of desserts which are still preferred by
most Indians. Due to this reason, the per capita consumption of ice creams in India
is about 300ml per annum, 1.4% of that in US, and 13% of the world average,
which can be seen as a huge opportunity in this sector in India attracting new
regional and national entrants.” - http://www.indiafoodbrief.com/
6
Our study aims at identifying customer perception towards Kwality wall’s products
against all the other brands of similar price range that is available in the market.
We have tried to throw light on what the customers feel about kwality wall’s
products and how they would rate Kwality wall’s on a certain parameters like
Reliability, easy availability, price suitability of the products, etc.
All this will help us to create a position chart of the company in comparison to the
other similar brands available in the market.
We would be collecting information through primary data collection techniques,
questionnaires to be specific.
The target area for our study is Delhi NCR where in the sample is chosen on
convenience and Judgment basis consisting of a total of 120-130 respondents
which we believe is a sufficient number to justify the study that we are conducting.
For tabulation and analysis of the gathered data we would be using SPSS and the
statistical techniques that we would use are; Mean, Mode, Frequency, Correlation,
and Cross tabs.
*************************************
7
3. Research Methodology
3.1. Research Design
We conducted this research as per descriptive standard of research design which is
cross sectional in nature. Along with Primary data collection, we also reviewed and
understood concepts from secondary sources which are relevant on our study and
are listed under chaptrr-2 of this report.
3.2. Data Collection Technique
The sources of data for the purpose of study were both primary and secondary.
Primary data was collected through questionnaire which was mainly close ended
and contained questions that cover all aspects of the objectives mentioned under
Chapter-1 of this report.
3.3. Sampling Plan
The sample for data collection was non-probable and was selected on the basis of
subject convenience because of limitation of time and funds to conduct the
research. The study was conducted in NCR at five different locations which are
Noida, Ghaziabad, Gurgaon, Faridabad and New Delhi area.
Sample size: 121 respondents
Data collection tool: Questionnaire
3.4. Data Analysis Technique
We used SPSS statistical tool to analyze and consolidate all the data collected from
primary sources through the questionnaire filled from different areas of Delhi-NCR
region.
8
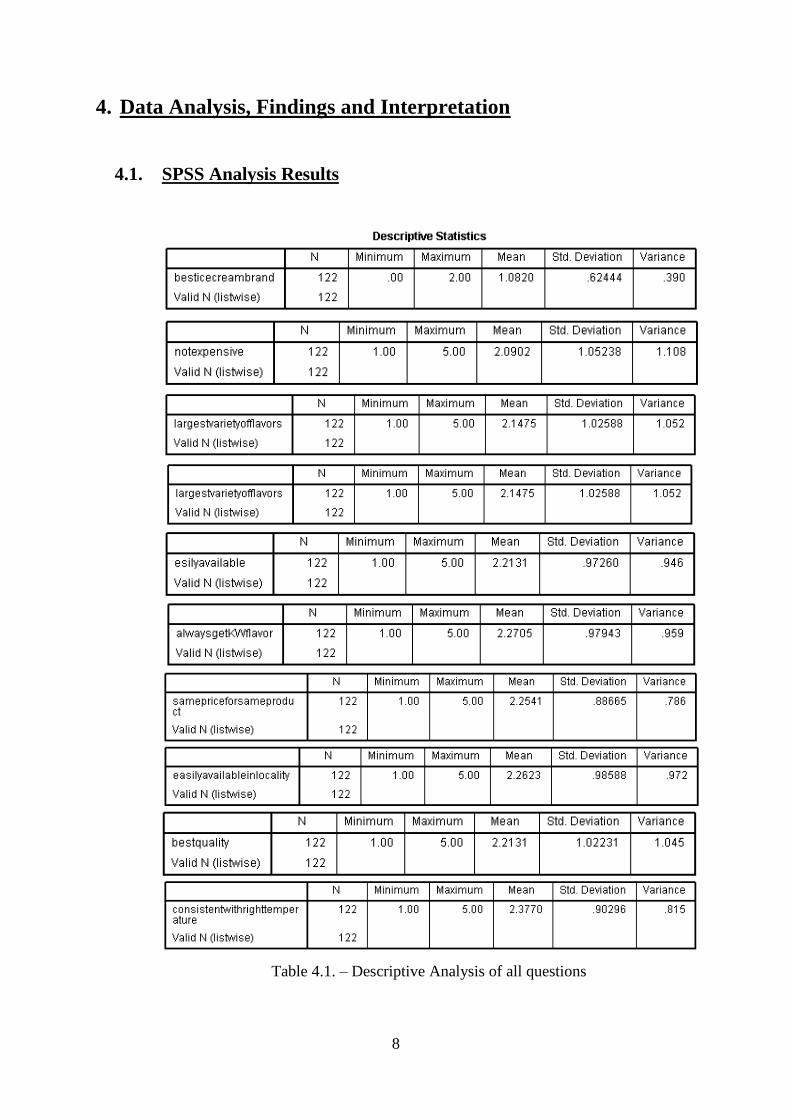
4. Data Analysis, Findings and Interpretation
4.1. SPSS Analysis Results
Table 4.1. – Descriptive Analysis of all questions
9
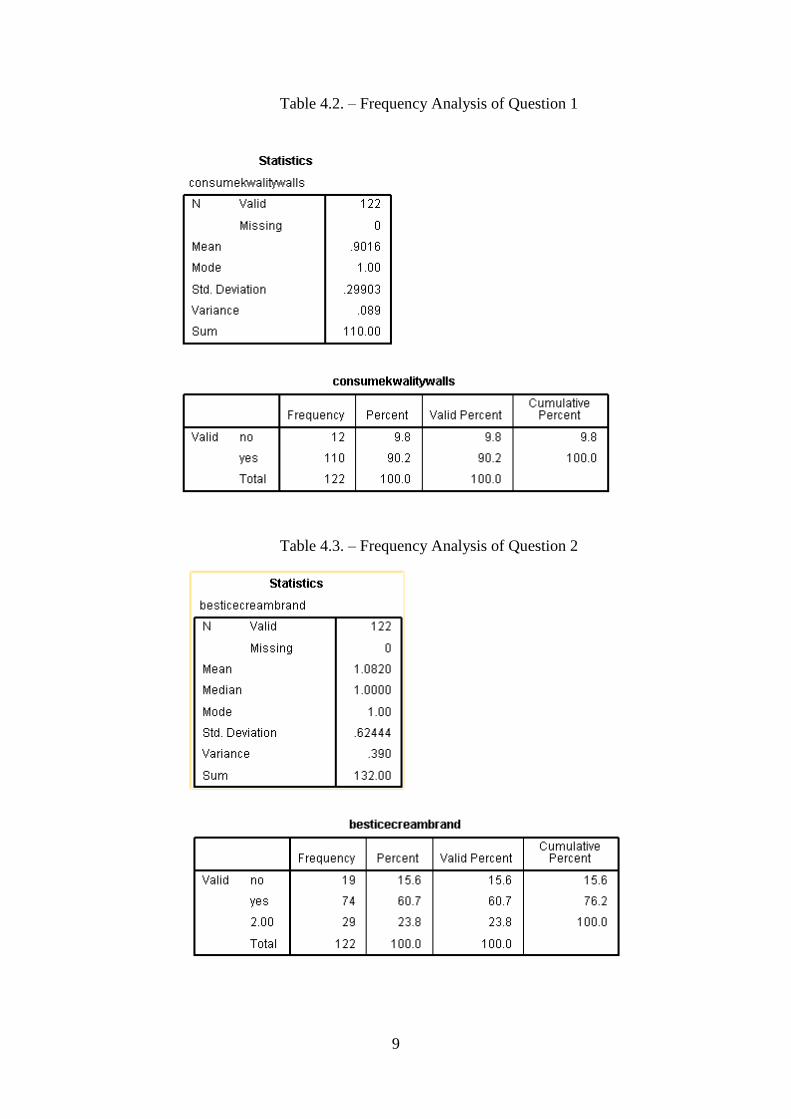
Table 4.2. – Frequency Analysis of Question 1
Table 4.3. – Frequency Analysis of Question 2
10
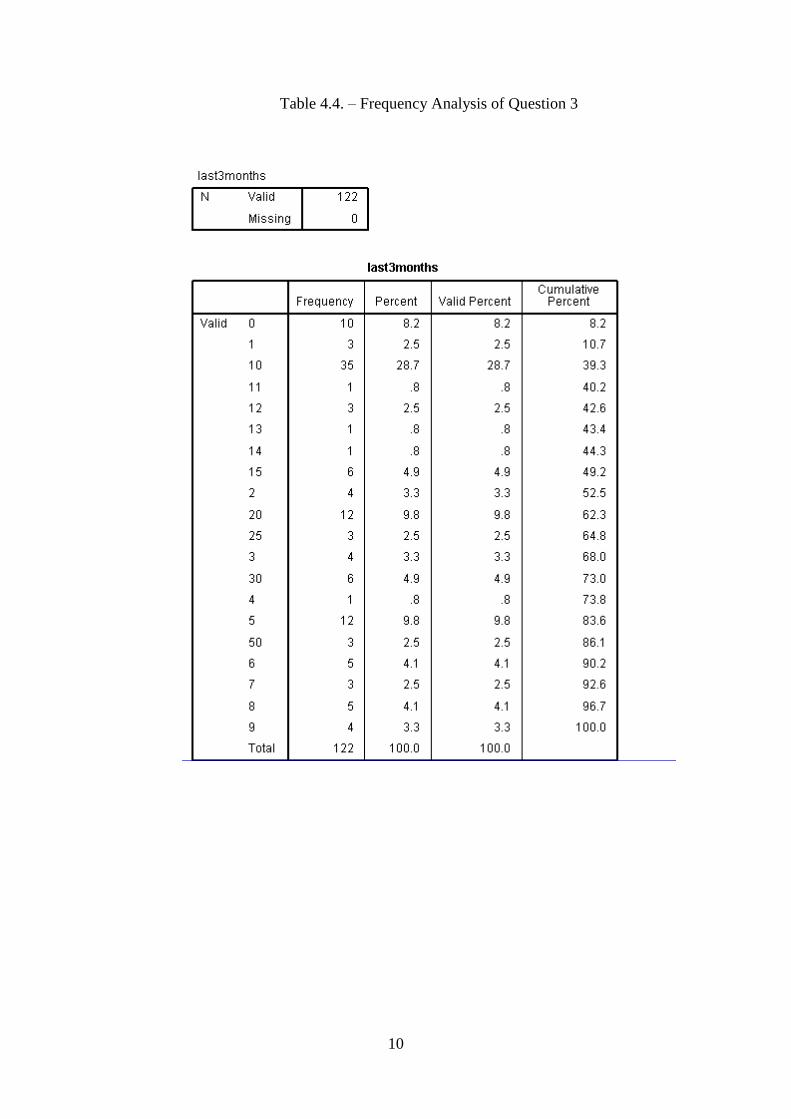
Table 4.4. – Frequency Analysis of Question 3
11
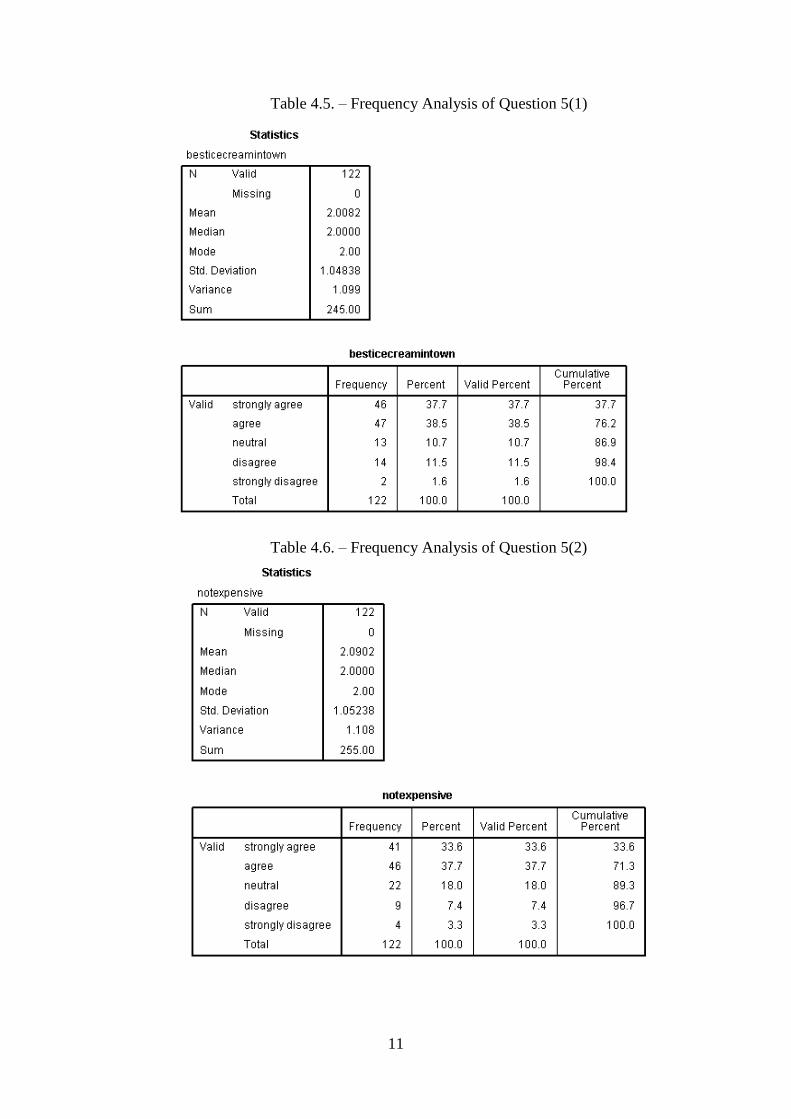
Table 4.5. – Frequency Analysis of Question 5(1)
Table 4.6. – Frequency Analysis of Question 5(2)
12
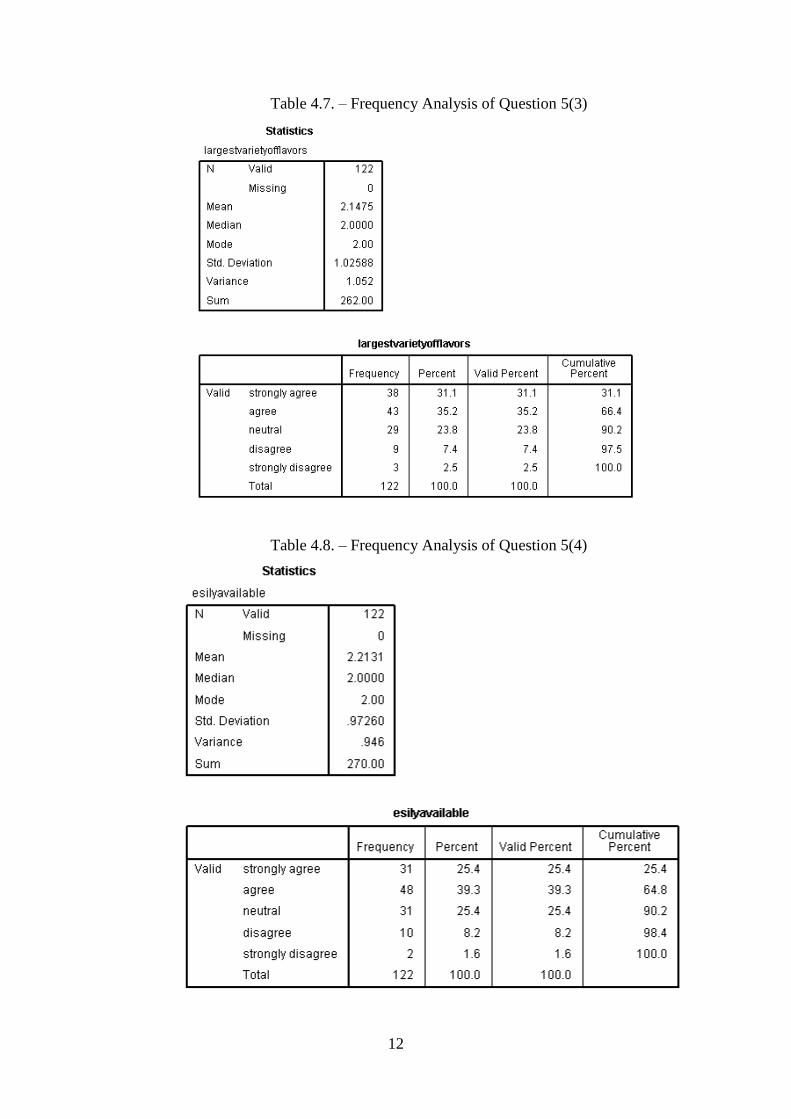
Table 4.7. – Frequency Analysis of Question 5(3)
Table 4.8. – Frequency Analysis of Question 5(4)
13
Table 4.9. – Frequency Analysis of Question 5(5)
Table 4.10. – Frequency Analysis of Question 5(6)
14
Table 4.11. – Frequency Analysis of Question 5(7)
Table 4.12. – Frequency Analysis of Question 5(8)
15
Table 4.13. – Frequency Analysis of Question 5(9)
16
Table 4.14. – Frequency Analysis of Question 6
Table 4.15. – Frequency Analysis of Question 7
17
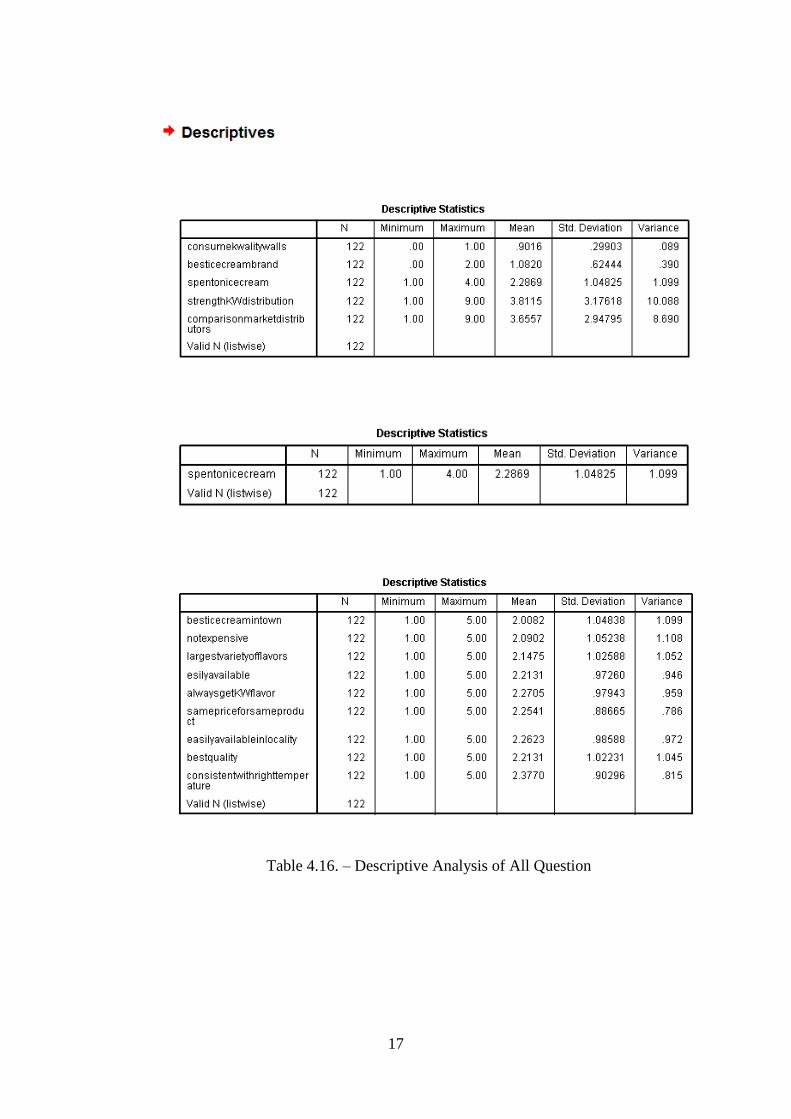
Table 4.16. – Descriptive Analysis of All Question
18
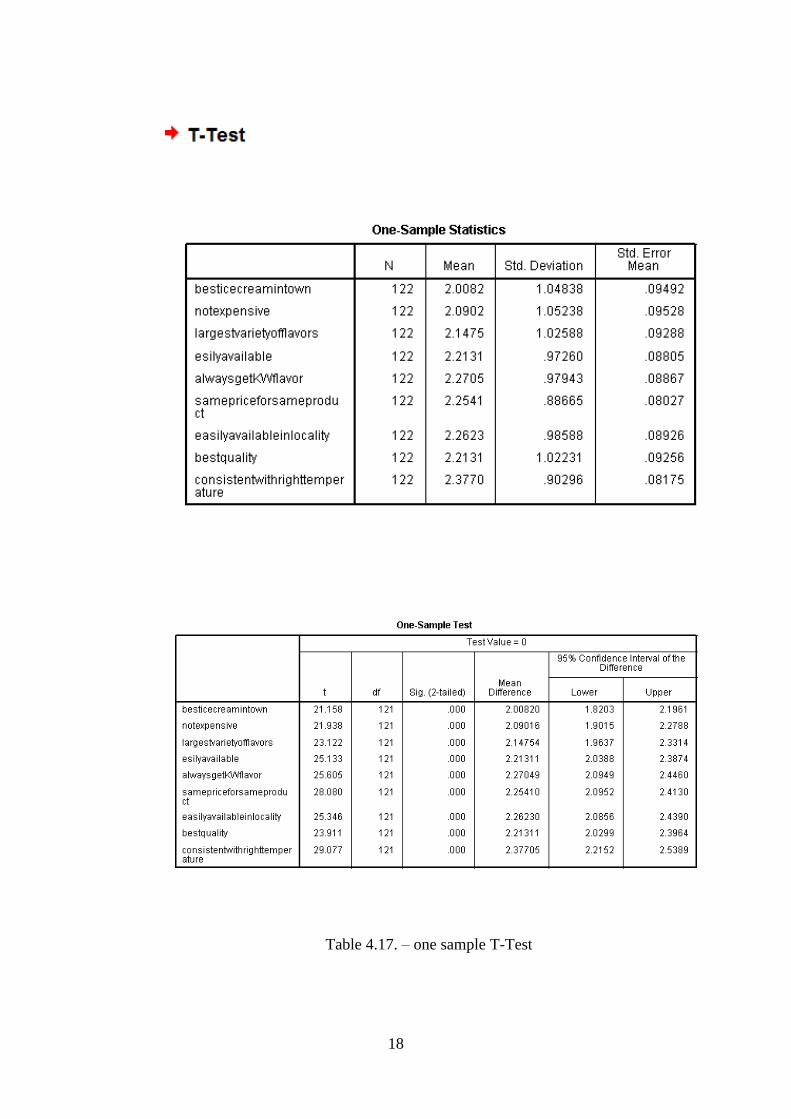
Table 4.17. – one sample T-Test
19
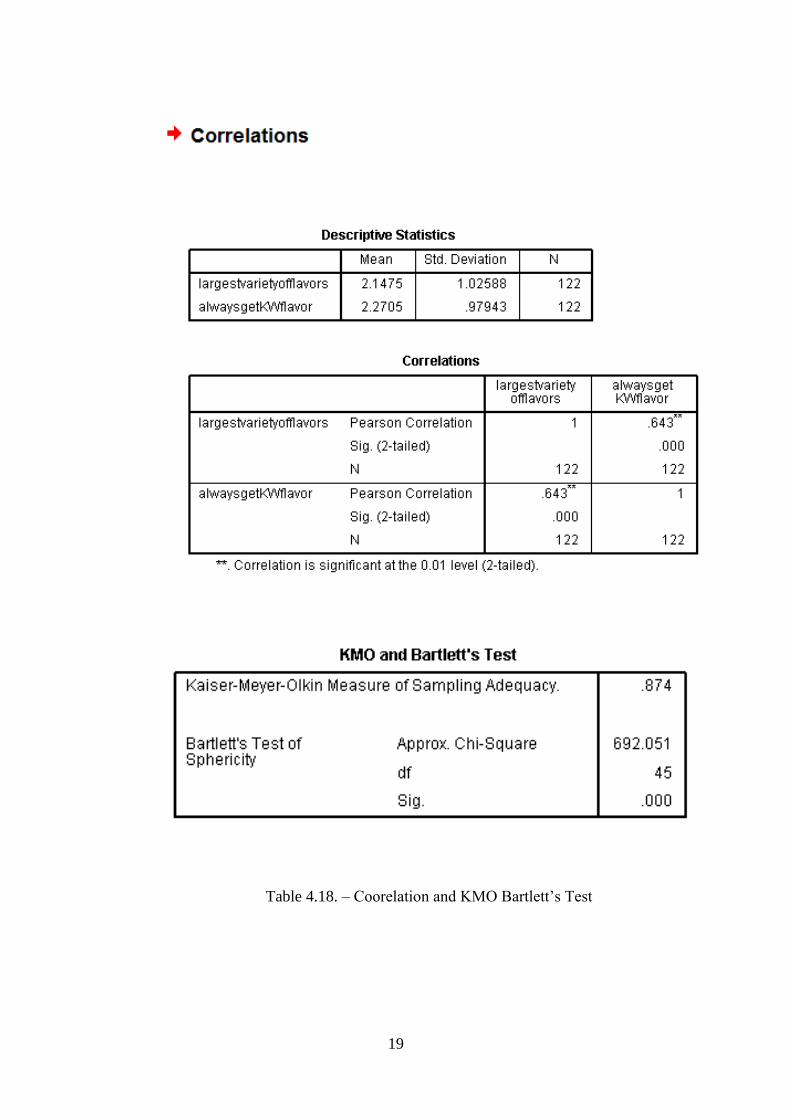
Table 4.18. – Coorelation and KMO Bartlett’s Test
20
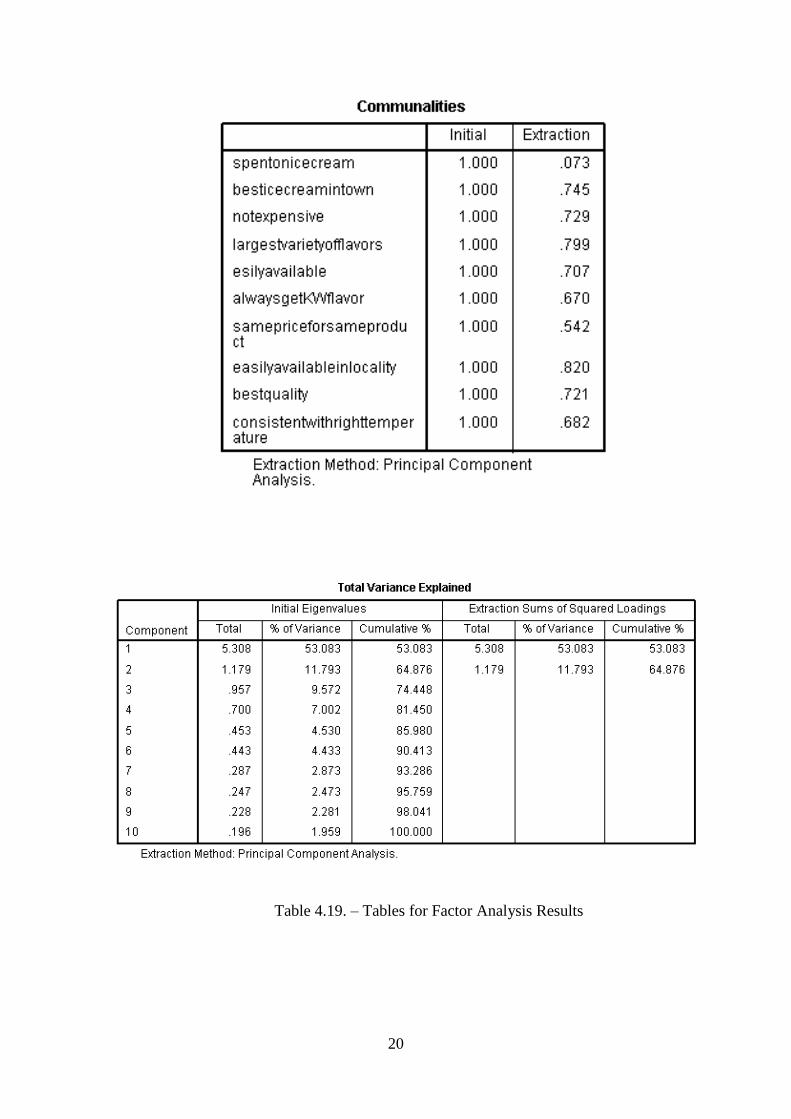
Table 4.19. – Tables for Factor Analysis Results
21
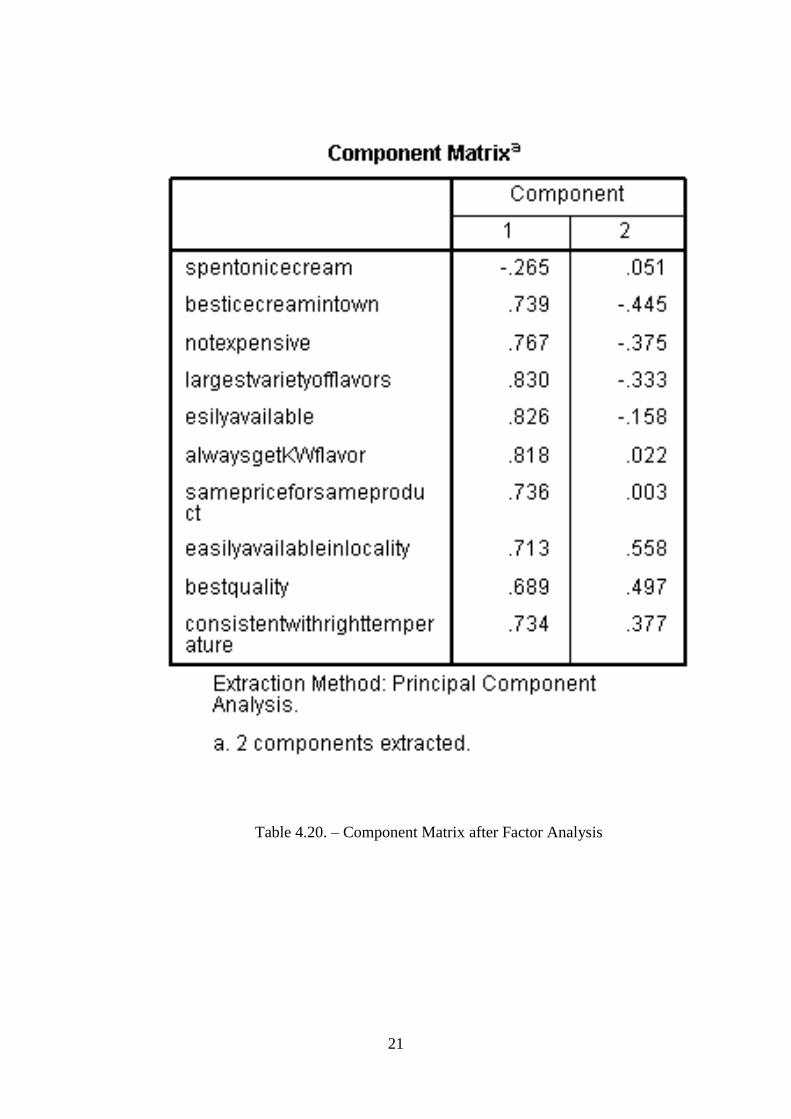
Table 4.20. – Component Matrix after Factor Analysis
22
4.2. Interpretation of results
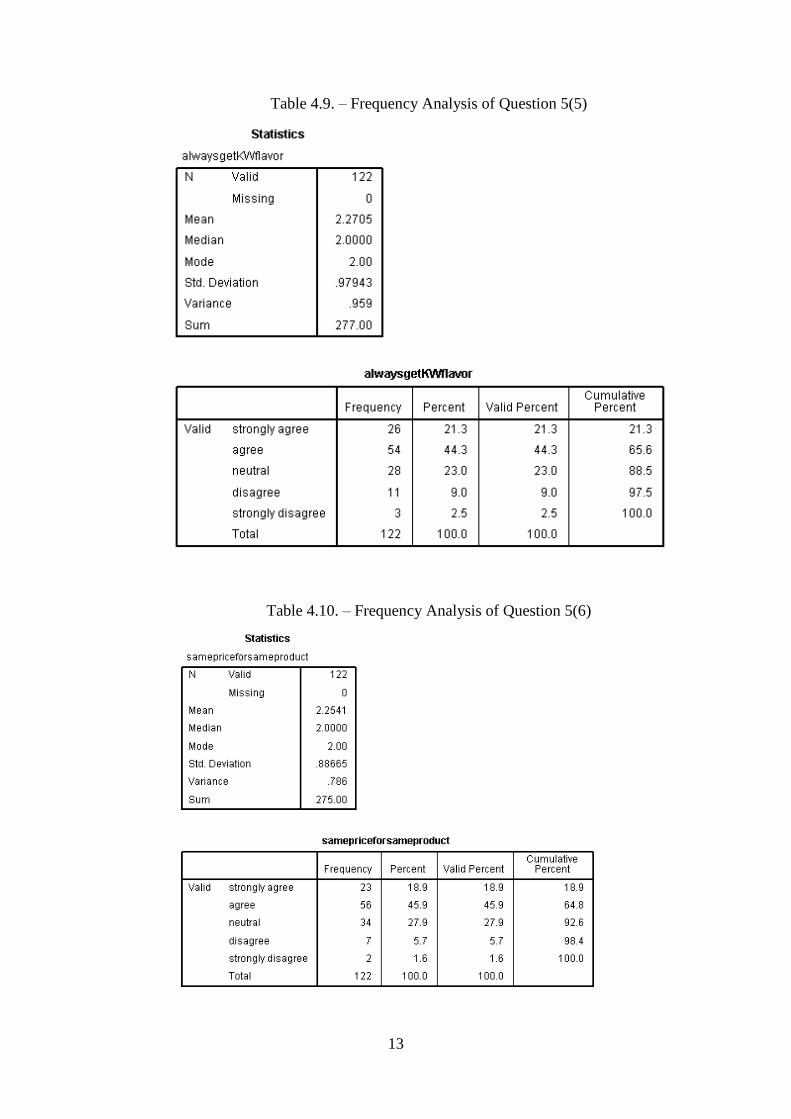
90.16 % respondents consume Kwality Wall’s ice cream.
60.7 % respondents feel Kwality Wall’s is best ice cream brand.
71 % respondents think that Kwality Wall’s is not expansive.
91 % respondents can easily obtain Kwality Wall’s ice cream.
89 % respondents get their favorite flavor at POS on first go.
94 % respondents think that they get the same price for the same product
from different POS of Kwality Wall’s.
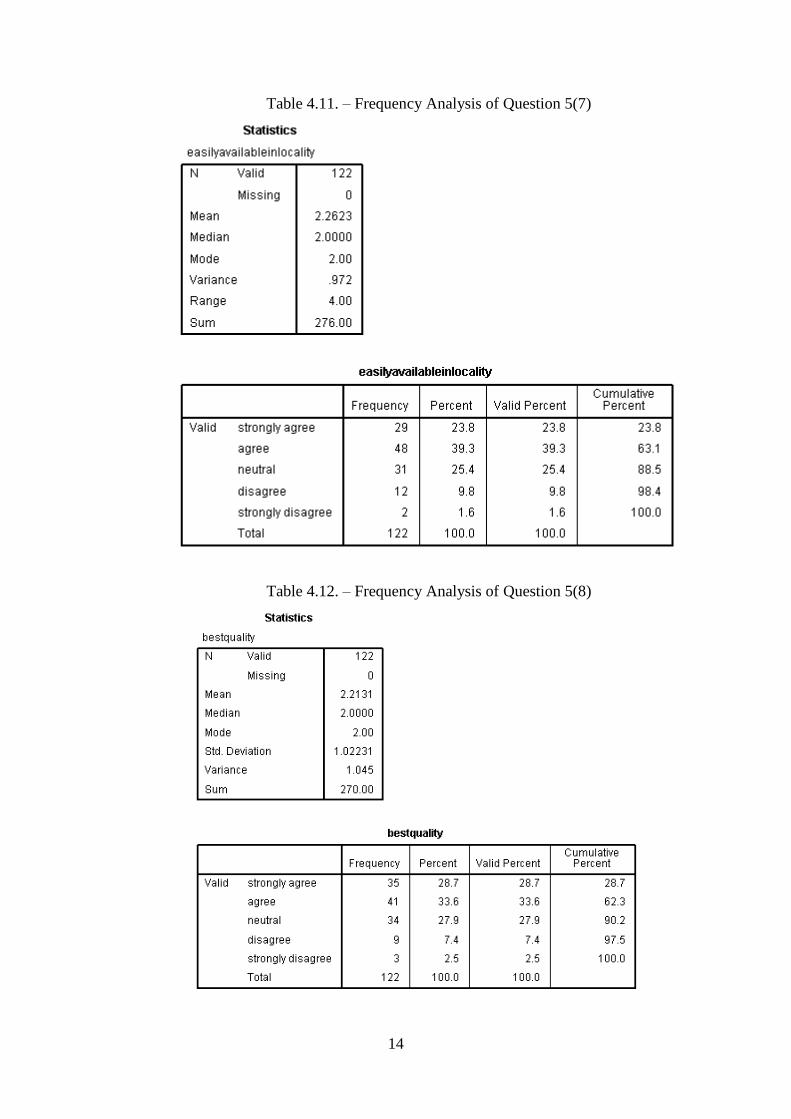
To an extent of 88 % respondents, Kwality Wall’s is available in their
locality.
90 % respondents think that Kwality Wall’s offers best quality ice cream.
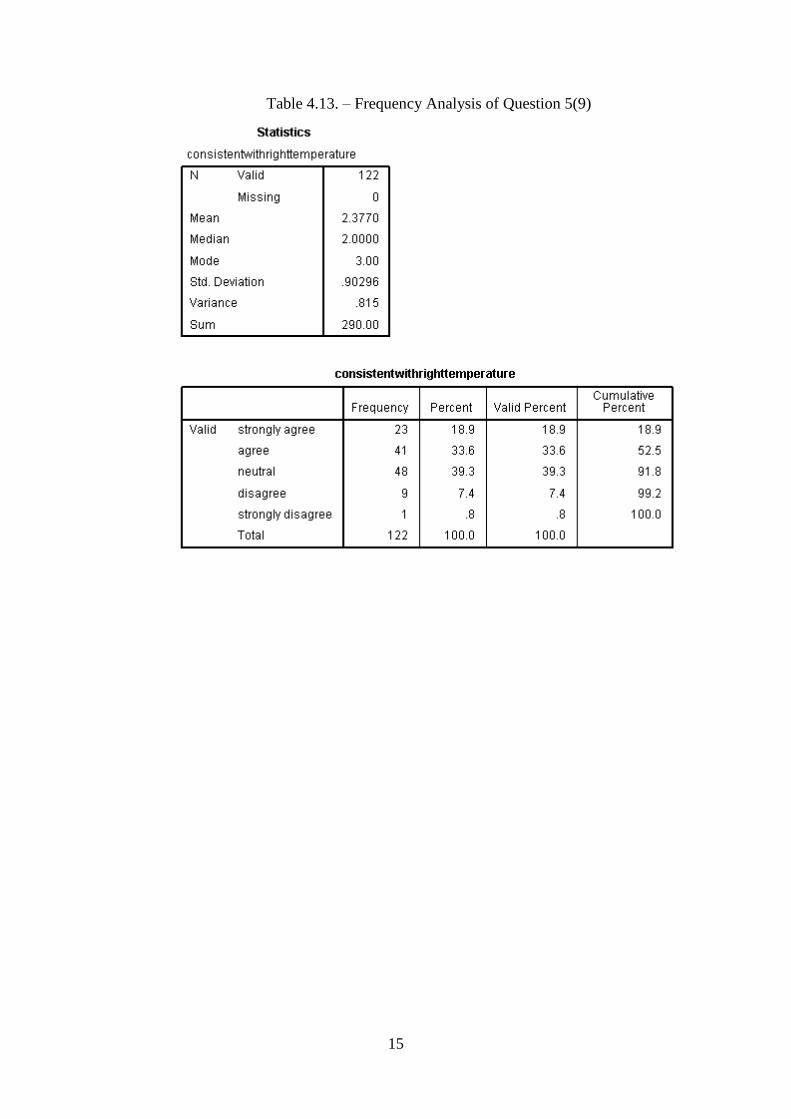
Almost 92 % respondents do not feel frost on their product after purchase.
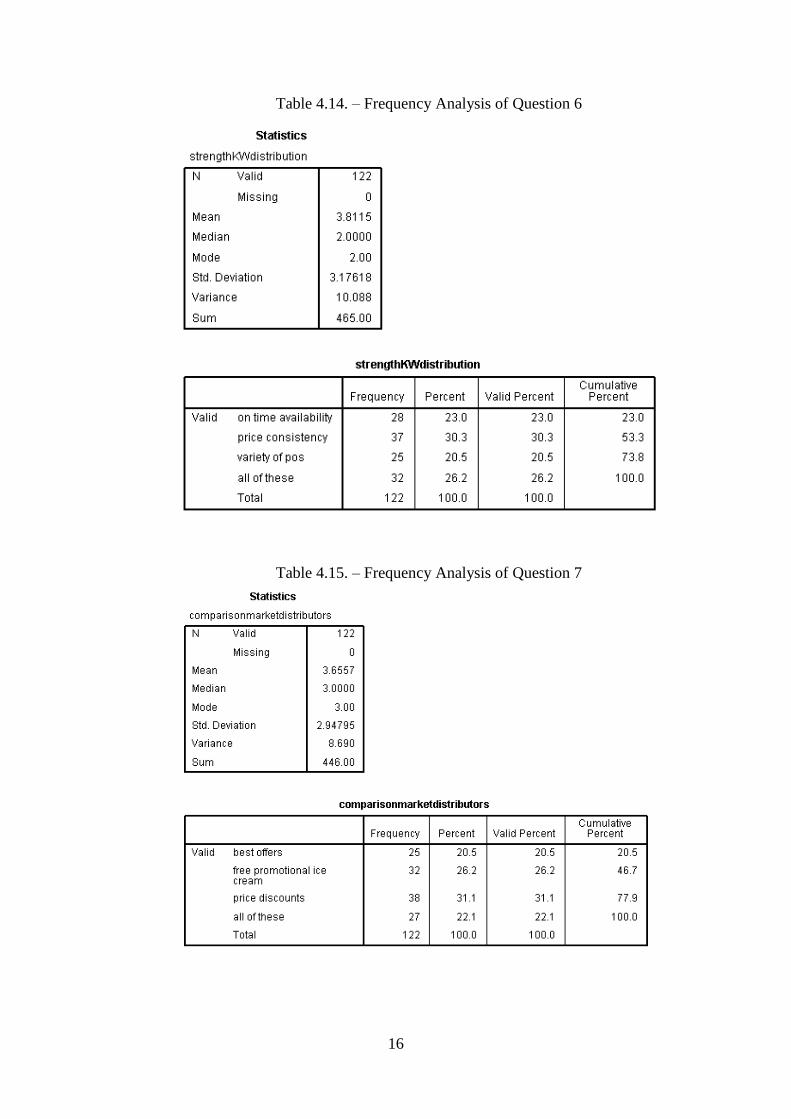
4.3. Key Findings
Following percentage of respondents feel that the following components is
the strength of Kwality Wall’s company.
23 % = on time availability of product.
30.3 % = Price consistency.
20.5 % = variety of POS / availability.
26.2 % = All of the above.
Following percentage of respondents feel that the following components is
the best offer offered by Kwality Wall’s in comparison to its competitors.
20.5 % = best offers.
26.2 % = Free promotional ice cream.
31.1 % = price discount.
22.1 % = All the above.
23
5. Conclusion and Suggestion
The ice cream consumption rates have been comparatively low in India in spite of the
Favorable weather and the population strength of the country. The marketers need to
attract customers by providing mouthwatering products at reasonable prices. India is a
price conscious nation so price and quality which is yet another important parameter
needs to be taken into consideration. To call a product as an Ice cream two conditions
need to be met;
It must be at least 10% milk, fat and use sugar as the sweetener. Though there is a
demand for fat free ice-creams in the market however food laws do not permit such
products to be launched in the market. During our study we identified a number of loop
holes in the Kwality wall’s distribution system. Almost 40% of the respondents did not
find their desired ice cream flavor at the Kwality wall’s ice cream parlors. The company
must make sure that products are readily available so as to delight and retain customers.
According to the figures that we came across, After AMUL, Kwality wall’s is the most
famous ice cream brand in India. Since the competition is tough, the company must try to
retain its customers by providing competitive products and services to its customers to
enhance customer satisfaction.
Limitation
The study was conducted in a short span of time with limited man power and funds. The
study was conducted for academic purpose by students and the sampling was on the basis
of convenience and judgment which would not be a best fit to acquire the most desired
results. The study was conducted in Delhi NCR and on the basis of which we are making
inferences for all of the country which might not be satisfactorily reliable because of
cultural, social and economic differences between different states. Only questionnaire
has been used as a medium of data collection which might not have gathered the
adequate information to support the conclusions.
24
6. Bibliography
Text and Books:
Zikmund, William,2003. Business Research Methods,7th edition,472
Gupta, S.L,2007. Marketing Management, 5th Edition, 263
Bajpai, Naval, 2010. Business Statistics, 10th Edition, 322
Website:
http://www.hul.co.in/brands-in-action/detail/Kwality-Wall-s/294251/
**************************
25
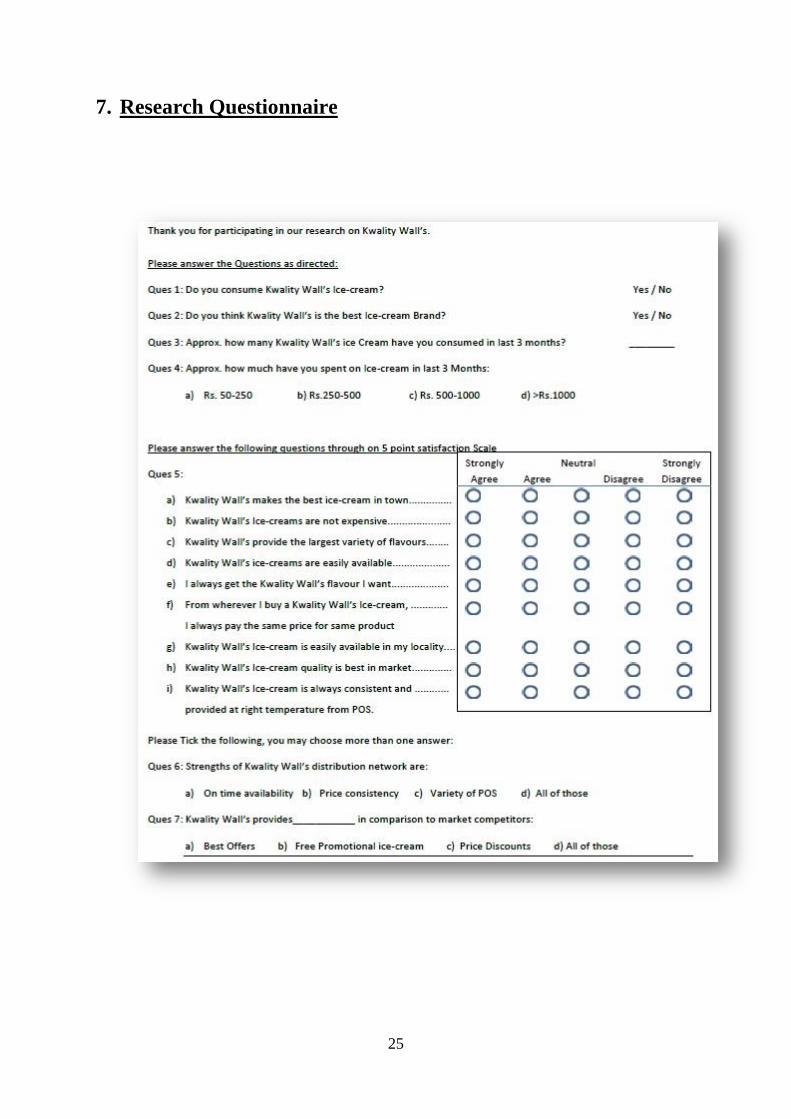
7. Research Questionnaire