Embed Size (px)
Citation preview

1
Getting ready for the festive season 2014
@JmGagnon | @BingAds
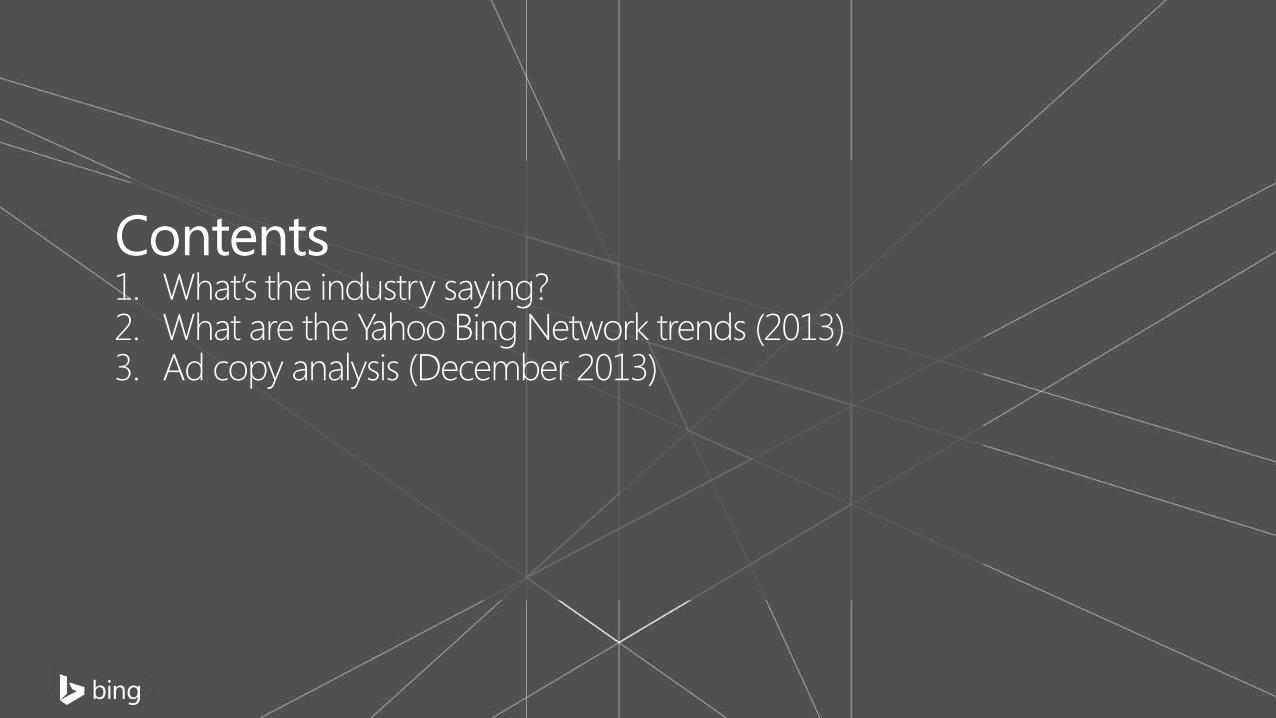
Contents 1. What’s the industry saying? 2. What are the Yahoo Bing Network trends (2013) 3. Ad copy analysis (December 2013)
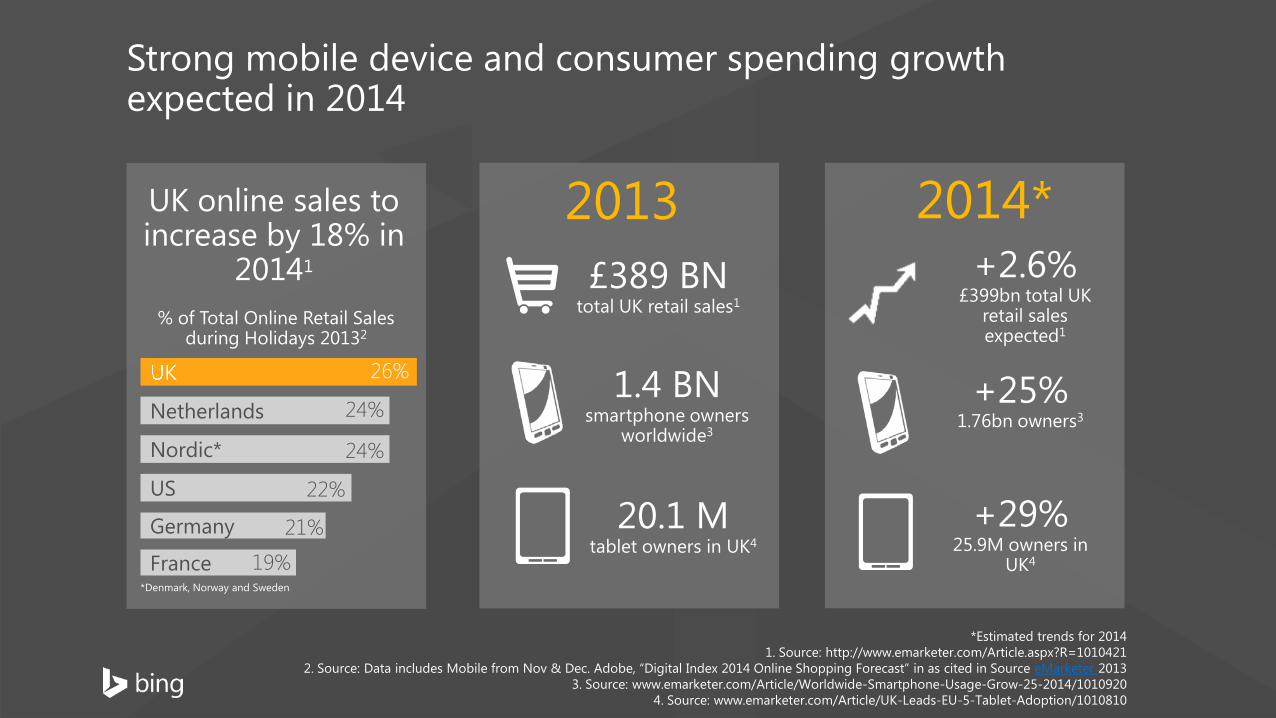
Strong mobile device and consumer spending growth expected in 2014
1.4 BN smartphone owners
worldwide3
2013
20.1 M tablet owners in UK4
£389 BN total UK retail sales1
2014*
+25% 1.76bn owners3
+29% 25.9M owners in
UK4
+2.6% £399bn total UK
retail sales expected1
% of Total Online Retail Sales during Holidays 20132
Netherlands
Nordic*
US
Germany
France
26%
24%
24%
22%
21%
19% *Denmark, Norway and Sweden
UK online sales to increase by 18% in
20141
*Estimated trends for 2014
1. Source: http://www.emarketer.com/Article.aspx?R=1010421 2. Source: Data includes Mobile from Nov & Dec. Adobe, “Digital Index 2014 Online Shopping Forecast” in as cited in Source eMarketer 2013
3. Source: www.emarketer.com/Article/Worldwide-Smartphone-Usage-Grow-25-2014/1010920 4. Source: www.emarketer.com/Article/UK-Leads-EU-5-Tablet-Adoption/1010810
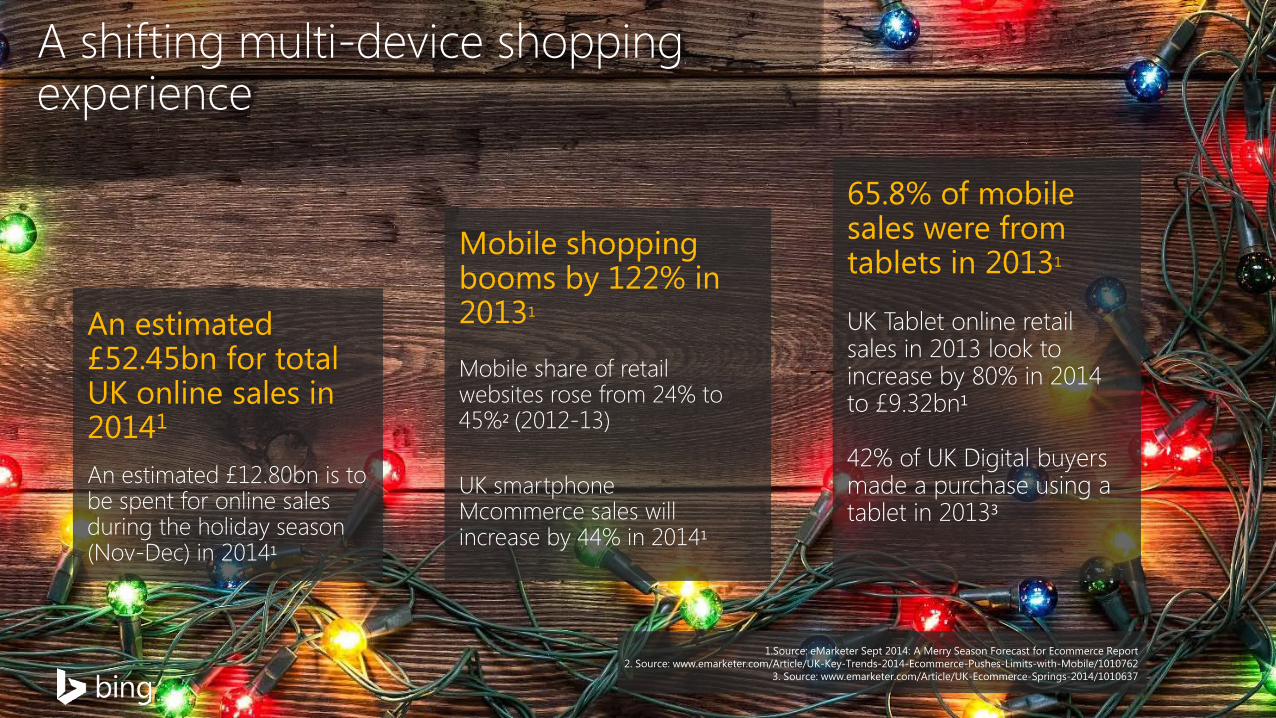
A shifting multi-device shopping experience
Mobile shopping booms by 122% in 20131
Mobile share of retail websites rose from 24% to 45%2 (2012-13)
UK smartphone Mcommerce sales will increase by 44% in 20141
65.8% of mobile sales were from tablets in 20131 UK Tablet online retail sales in 2013 look to increase by 80% in 2014 to £9.32bn1 42% of UK Digital buyers made a purchase using a tablet in 20133
An estimated £52.45bn for total UK online sales in 20141 An estimated £12.80bn is to be spent for online sales during the holiday season (Nov-Dec) in 20141
1.Source: eMarketer Sept 2014: A Merry Season Forecast for Ecommerce Report 2. Source: www.emarketer.com/Article/UK-Key-Trends-2014-Ecommerce-Pushes-Limits-with-Mobile/1010762
3. Source: www.emarketer.com/Article/UK-Ecommerce-Springs-2014/1010637
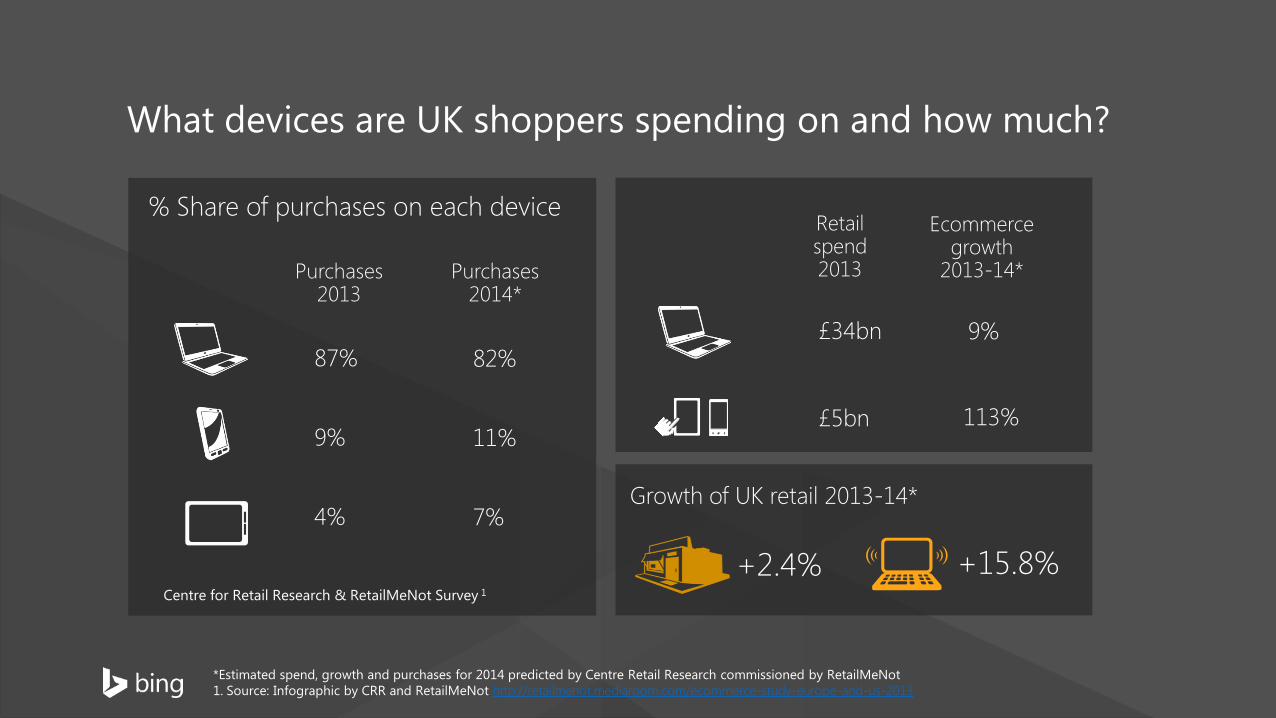
Purchases 2013
Purchases 2014*
87% 82%
9% 11%
4% 7%
What devices are UK shoppers spending on and how much?
*Estimated spend, growth and purchases for 2014 predicted by Centre Retail Research commissioned by RetailMeNot 1. Source: Infographic by CRR and RetailMeNot http://retailmenot.mediaroom.com/ecommerce-study-europe-and-us-2013
Retail spend 2013
£34bn
£5bn
Ecommerce growth
2013-14*
9%
113%
Growth of UK retail 2013-14*
+2.4% +15.8% Centre for Retail Research & RetailMeNot Survey 1
% Share of purchases on each device
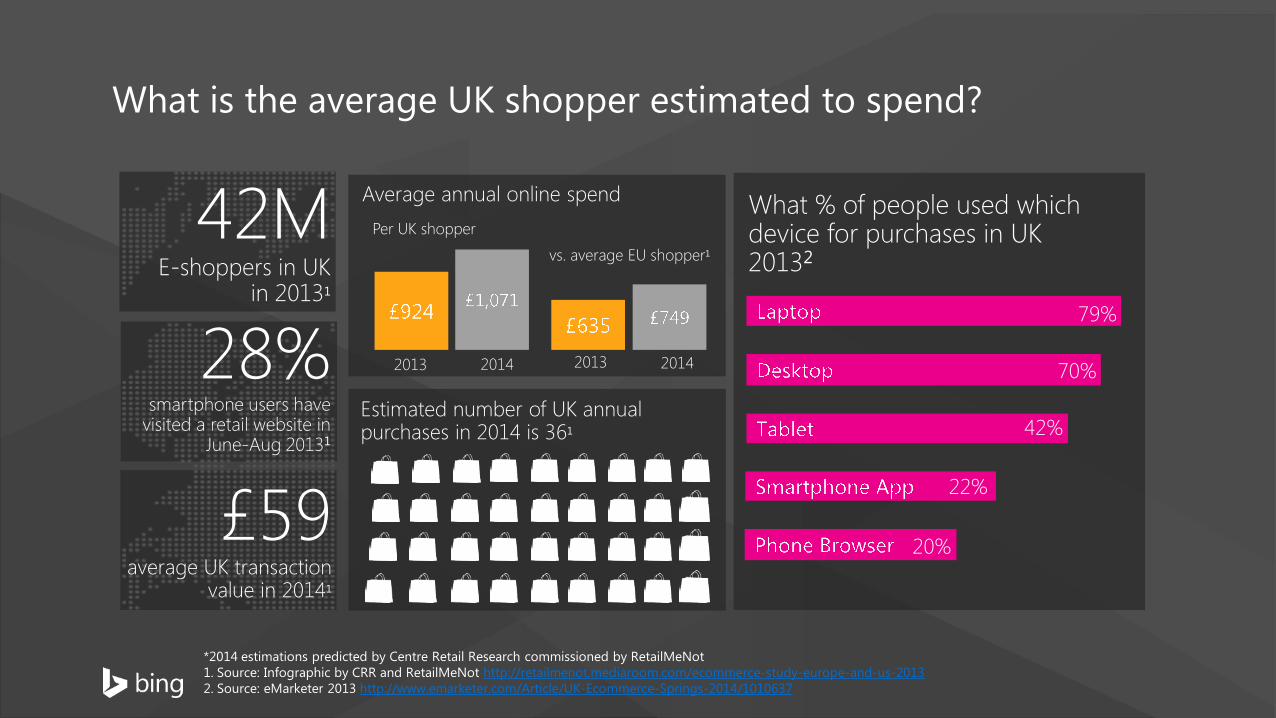
What % of people used which device for purchases in UK 20132
76%
70%
42%
What is the average UK shopper estimated to spend?
22%
20%
79%
28% smartphone users have
visited a retail website in June-Aug 20131
£59 average UK transaction
value in 20141
42M E-shoppers in UK
in 20131
Estimated number of UK annual purchases in 2014 is 361
Average annual online spend
2013 2014 2013 2014
vs. average EU shopper1
*2014 estimations predicted by Centre Retail Research commissioned by RetailMeNot 1. Source: Infographic by CRR and RetailMeNot http://retailmenot.mediaroom.com/ecommerce-study-europe-and-us-2013 2. Source: eMarketer 2013 http://www.emarketer.com/Article/UK-Ecommerce-Springs-2014/1010637
Per UK shopper
7
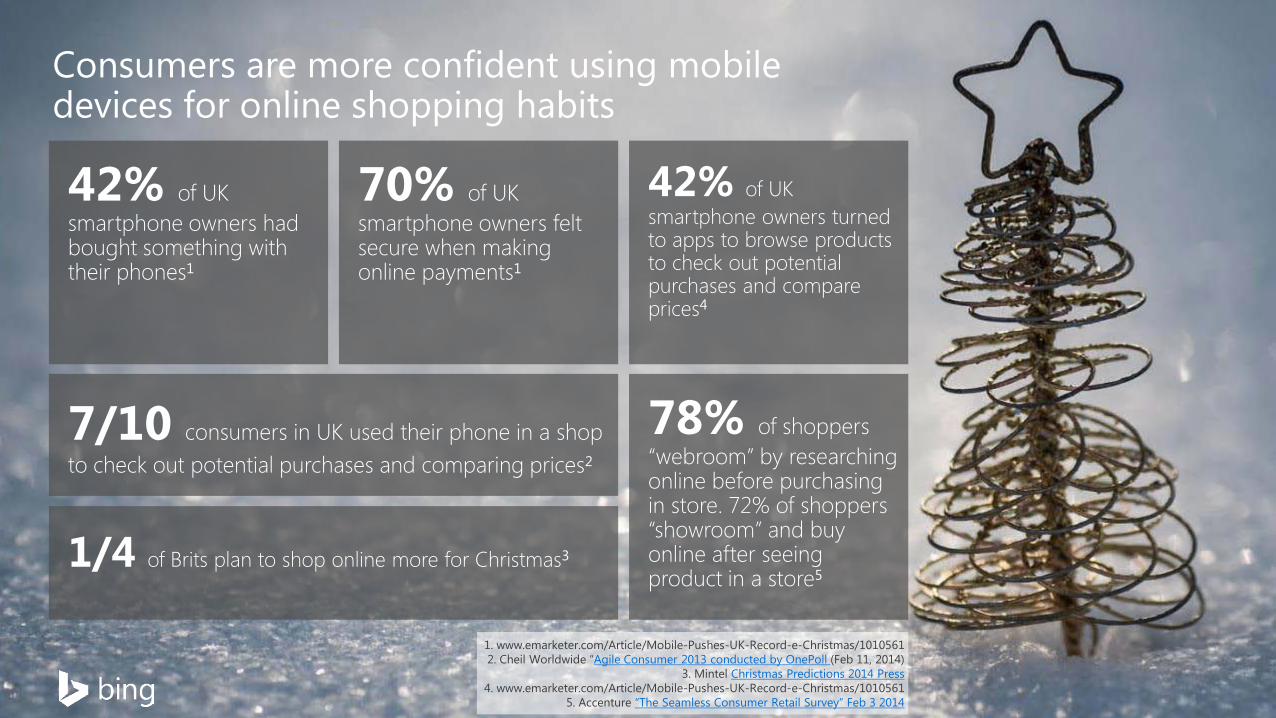
42% of UK smartphone owners had bought something with their phones1
7/10 consumers in UK used their phone in a shop to check out potential purchases and comparing prices2
70% of UK smartphone owners felt secure when making online payments1
42% of UK smartphone owners turned to apps to browse products to check out potential purchases and compare prices4
78% of shoppers “webroom” by researching online before purchasing in store. 72% of shoppers “showroom” and buy online after seeing product in a store5
1/4 of Brits plan to shop online more for Christmas3
Consumers are more confident using mobile devices for online shopping habits
1. www.emarketer.com/Article/Mobile-Pushes-UK-Record-e-Christmas/1010561 2. Cheil Worldwide “Agile Consumer 2013 conducted by OnePoll (Feb 11, 2014)
3. Mintel Christmas Predictions 2014 Press 4. www.emarketer.com/Article/Mobile-Pushes-UK-Record-e-Christmas/1010561
5. Accenture “The Seamless Consumer Retail Survey” Feb 3 2014
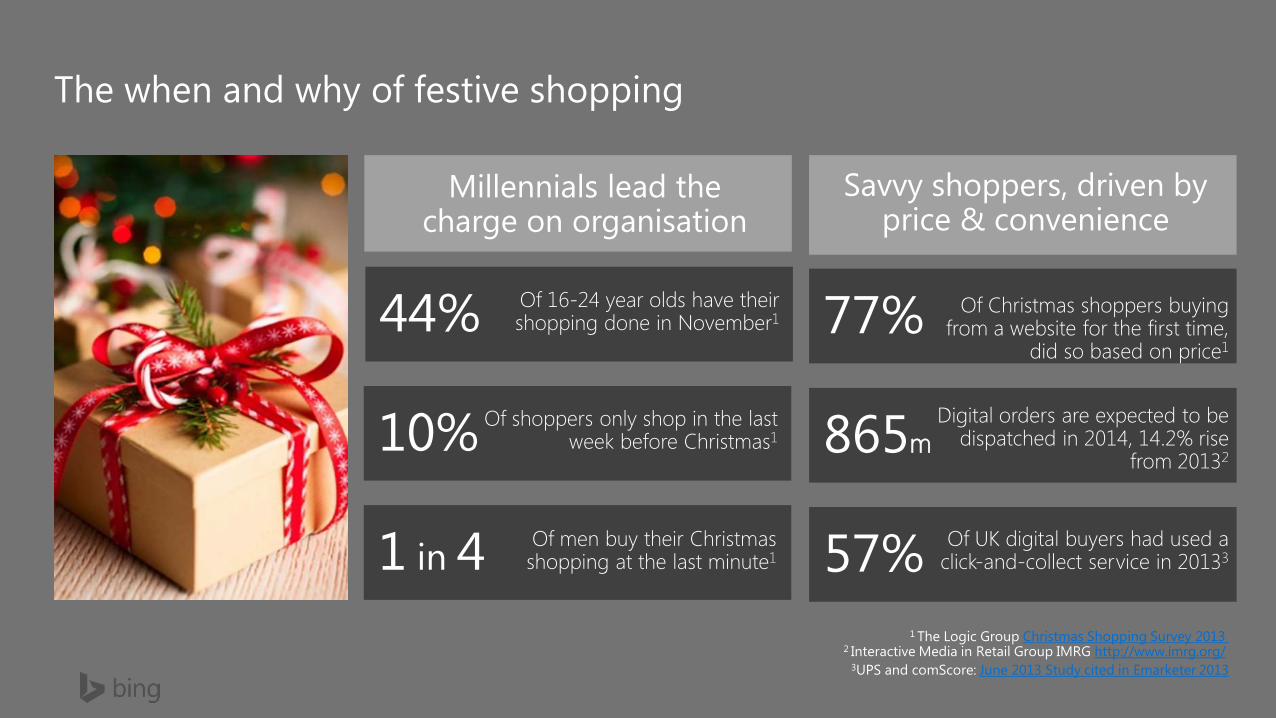
Millennials lead the charge on organisation
1 The Logic Group Christmas Shopping Survey 2013 2 Interactive Media in Retail Group IMRG http://www.imrg.org/
3UPS and comScore: June 2013 Study cited in Emarketer 2013
44%
The when and why of festive shopping
Of 16-24 year olds have their shopping done in November1
10% Of shoppers only shop in the last week before Christmas1
1 in 4 Of men buy their Christmas shopping at the last minute1
77%
865m 57%
Savvy shoppers, driven by price & convenience
Of Christmas shoppers buying from a website for the first time,
did so based on price1
Digital orders are expected to be dispatched in 2014, 14.2% rise
from 20132
Of UK digital buyers had used a click-and-collect service in 20133
9
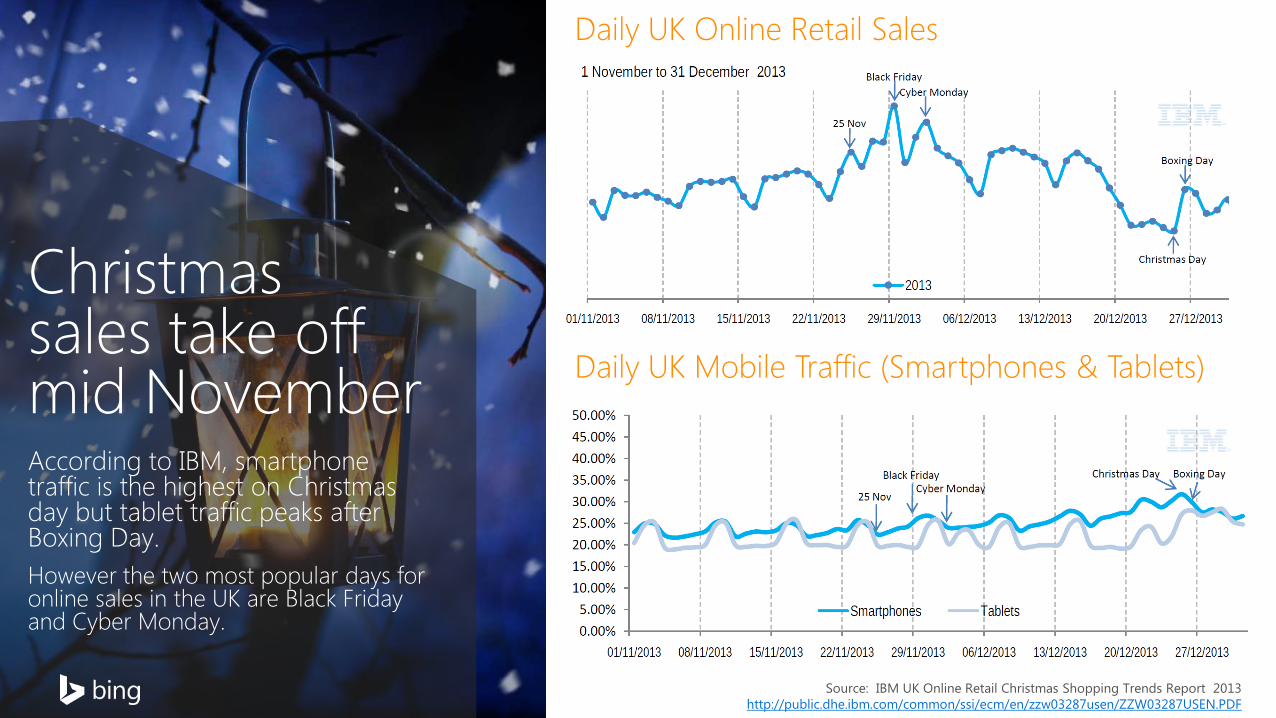
Christmas sales take off mid November According to IBM, smartphone traffic is the highest on Christmas day but tablet traffic peaks after Boxing Day. However the two most popular days for online sales in the UK are Black Friday and Cyber Monday.
Daily UK Mobile Traffic (Smartphones & Tablets)
Daily UK Online Retail Sales
Source: IBM UK Online Retail Christmas Shopping Trends Report 2013 http://public.dhe.ibm.com/common/ssi/ecm/en/zzw03287usen/ZZW03287USEN.PDF
What are the Yahoo Bing Network trends? Festive search patterns in 2013
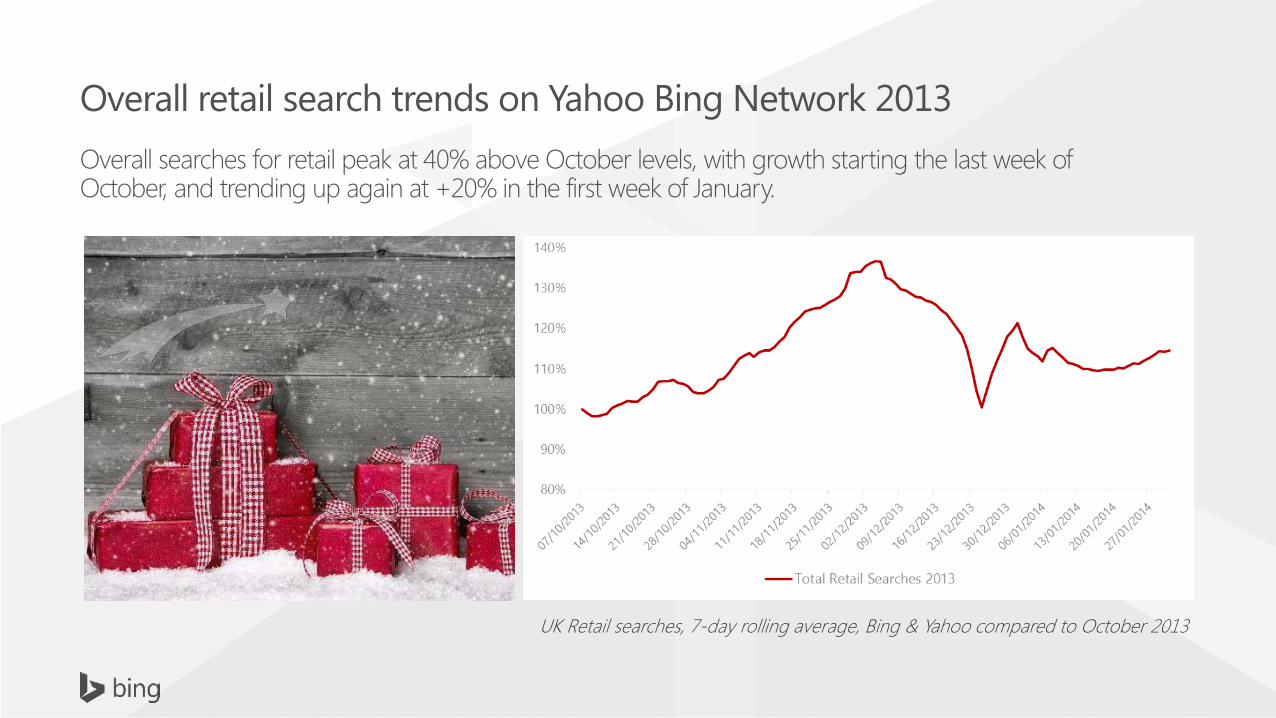
Overall retail search trends on Yahoo Bing Network 2013 Overall searches for retail peak at 40% above October levels, with growth starting the last week of October, and trending up again at +20% in the first week of January.
UK Retail searches, 7-day rolling average, Bing & Yahoo compared to October 2013
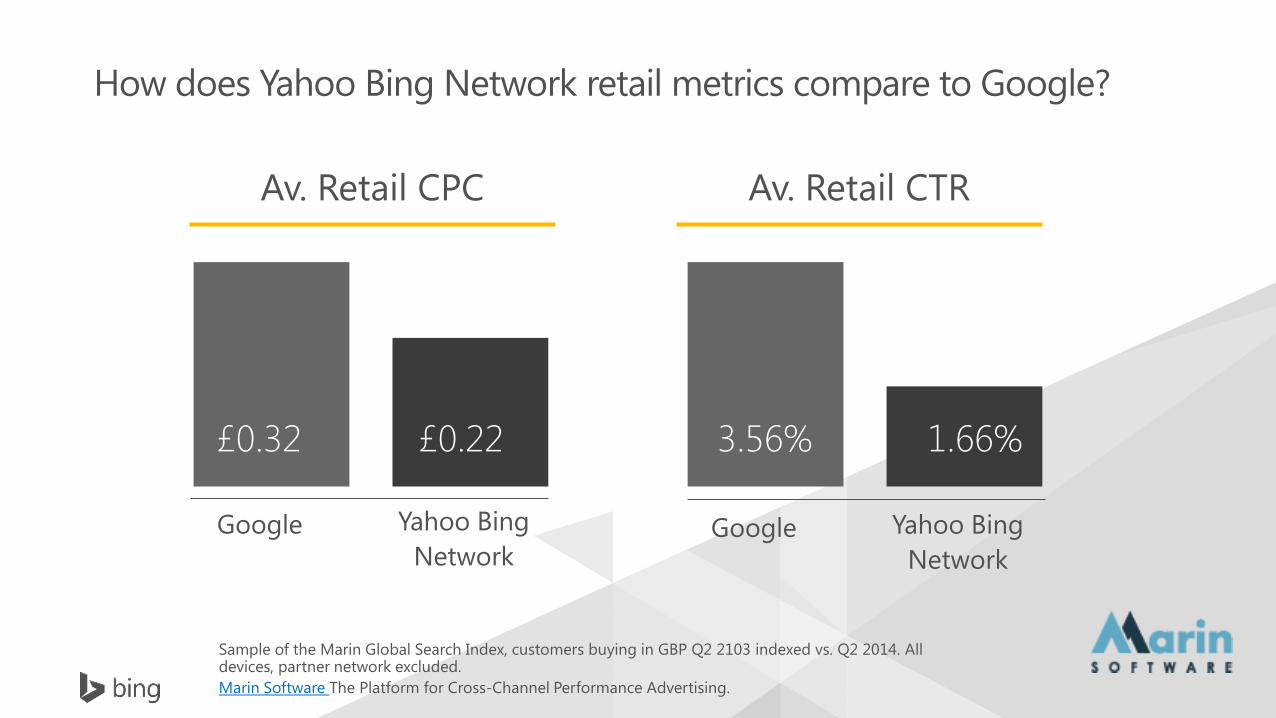
How does Yahoo Bing Network retail metrics compare to Google?
£0.32 £0.22 3.56% 1.66%
Av. Retail CPC Av. Retail CTR
Google Yahoo Bing Network
Google Yahoo Bing Network
Sample of the Marin Global Search Index, customers buying in GBP Q2 2103 indexed vs. Q2 2014. All devices, partner network excluded. Marin Software The Platform for Cross-Channel Performance Advertising.
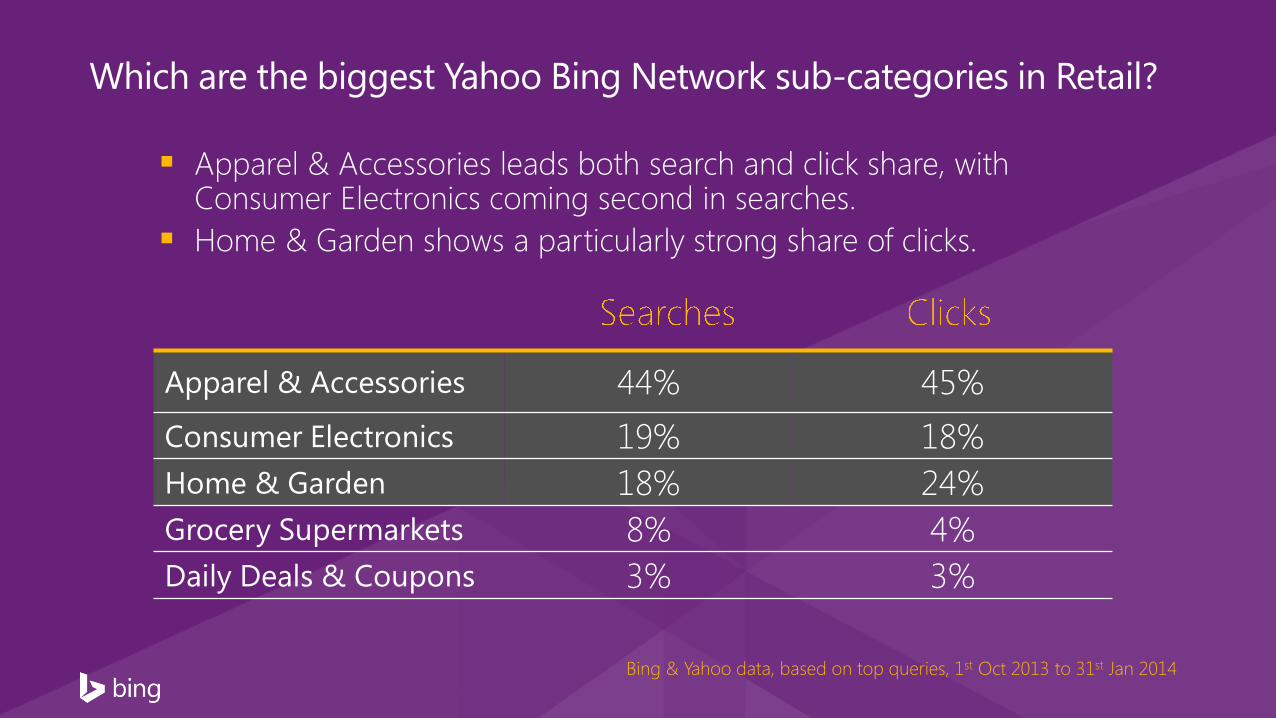
Which are the biggest Yahoo Bing Network sub-categories in Retail?
Apparel & Accessories 44% 45% Consumer Electronics 19% 18% Home & Garden 18% 24% Grocery Supermarkets 8% 4% Daily Deals & Coupons 3% 3%
Bing & Yahoo data, based on top queries, 1st Oct 2013 to 31st Jan 2014
Apparel & Accessories leads both search and click share, with Consumer Electronics coming second in searches.
Home & Garden shows a particularly strong share of clicks.
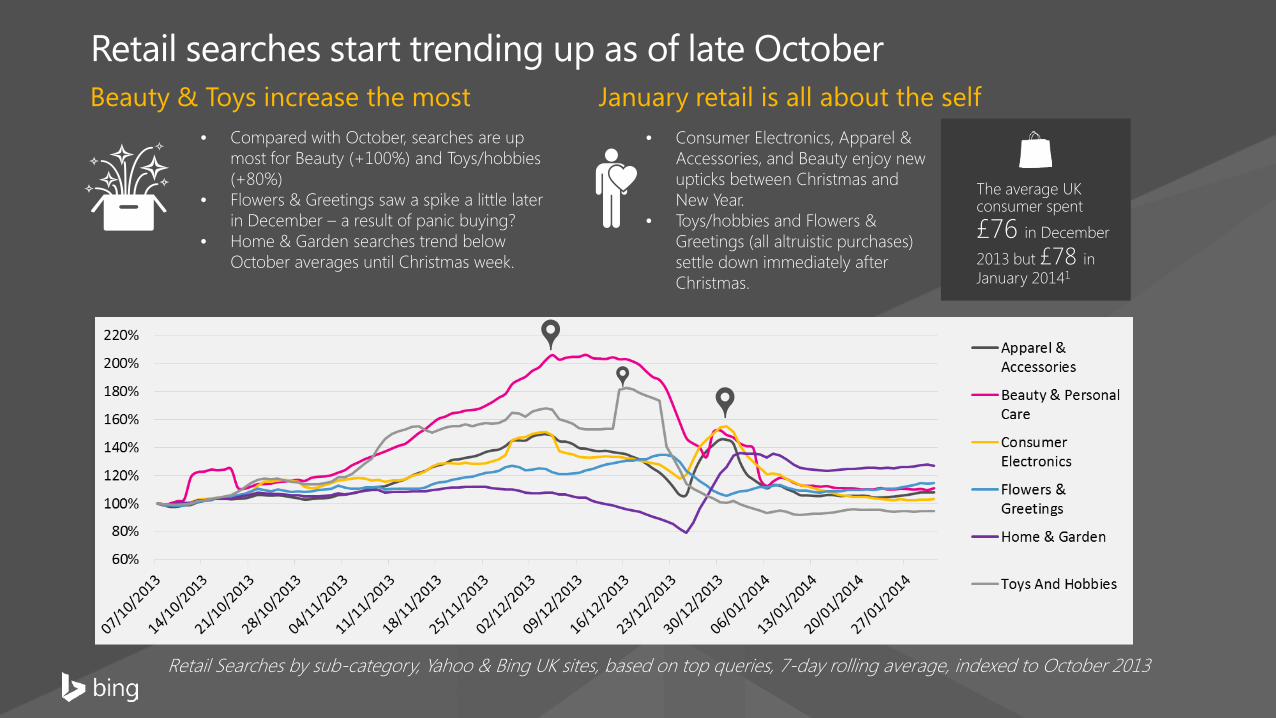
Retail searches start trending up as of late October Beauty & Toys increase the most
• Consumer Electronics, Apparel & Accessories, and Beauty enjoy new upticks between Christmas and New Year.
• Toys/hobbies and Flowers & Greetings (all altruistic purchases) settle down immediately after Christmas.
Retail Searches by sub-category, Yahoo & Bing UK sites, based on top queries, 7-day rolling average, indexed to October 2013
• Compared with October, searches are up most for Beauty (+100%) and Toys/hobbies (+80%)
• Flowers & Greetings saw a spike a little later in December – a result of panic buying?
• Home & Garden searches trend below October averages until Christmas week.
January retail is all about the self
The average UK consumer spent
£76 in December
2013 but £78 in January 20141
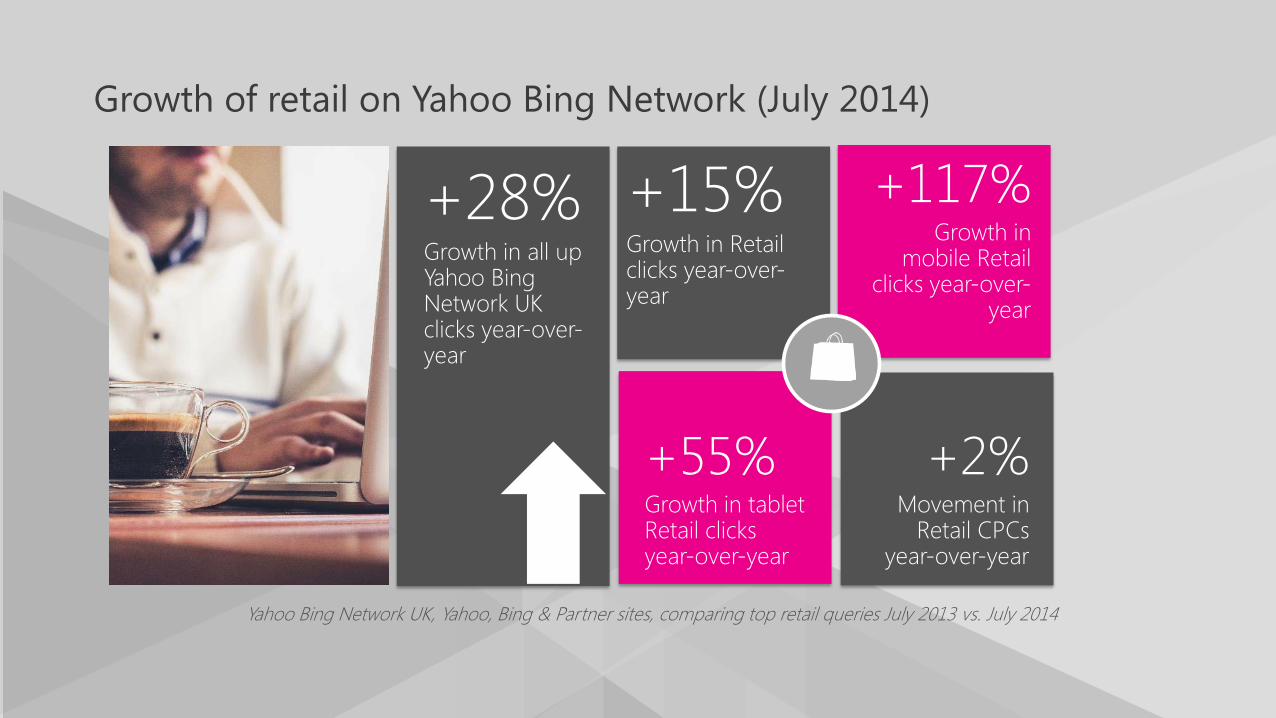
Growth of retail on Yahoo Bing Network (July 2014)
+28% Growth in all up Yahoo Bing Network UK clicks year-over-year
+2% Movement in
Retail CPCs year-over-year
+117% Growth in
mobile Retail clicks year-over-
year
+55% Growth in tablet Retail clicks year-over-year
+15% Growth in Retail clicks year-over-year
Yahoo Bing Network UK, Yahoo, Bing & Partner sites, comparing top retail queries July 2013 vs. July 2014
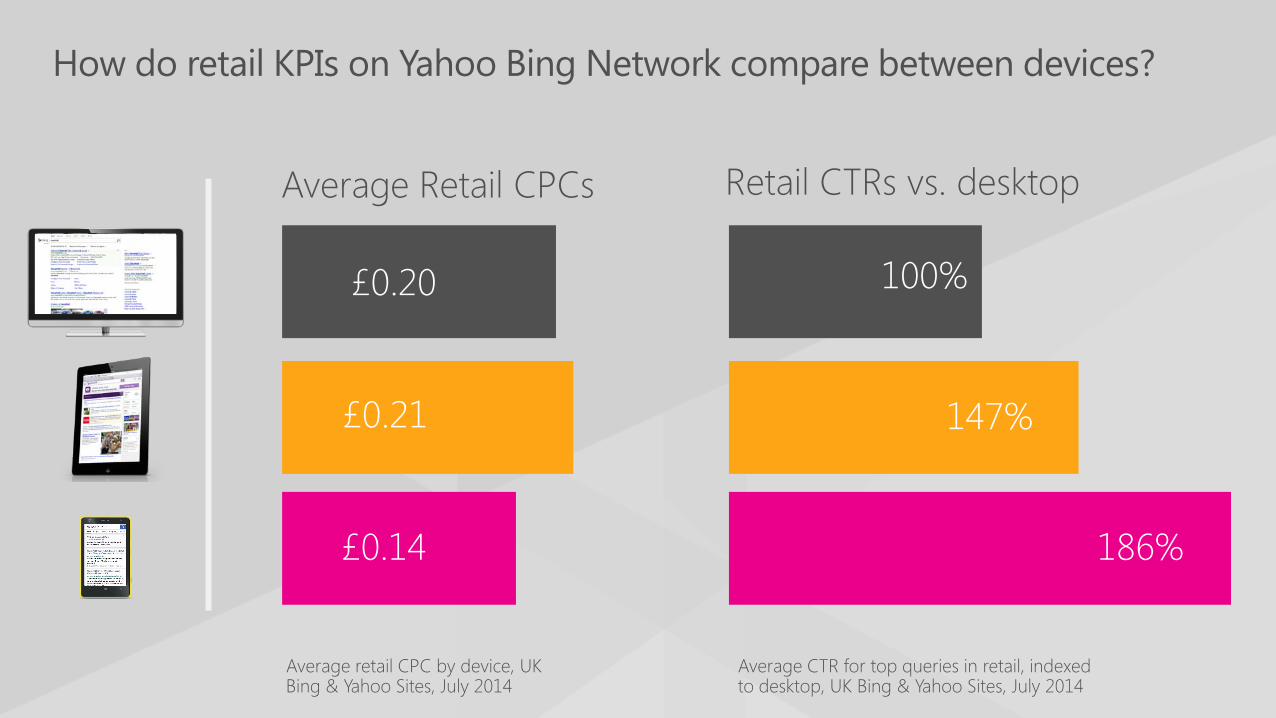
How do retail KPIs on Yahoo Bing Network compare between devices?
£0.20
£0.21
£0.14
100%
147%
186%
Average Retail CPCs
Average retail CPC by device, UK Bing & Yahoo Sites, July 2014
Retail CTRs vs. desktop
Average CTR for top queries in retail, indexed to desktop, UK Bing & Yahoo Sites, July 2014
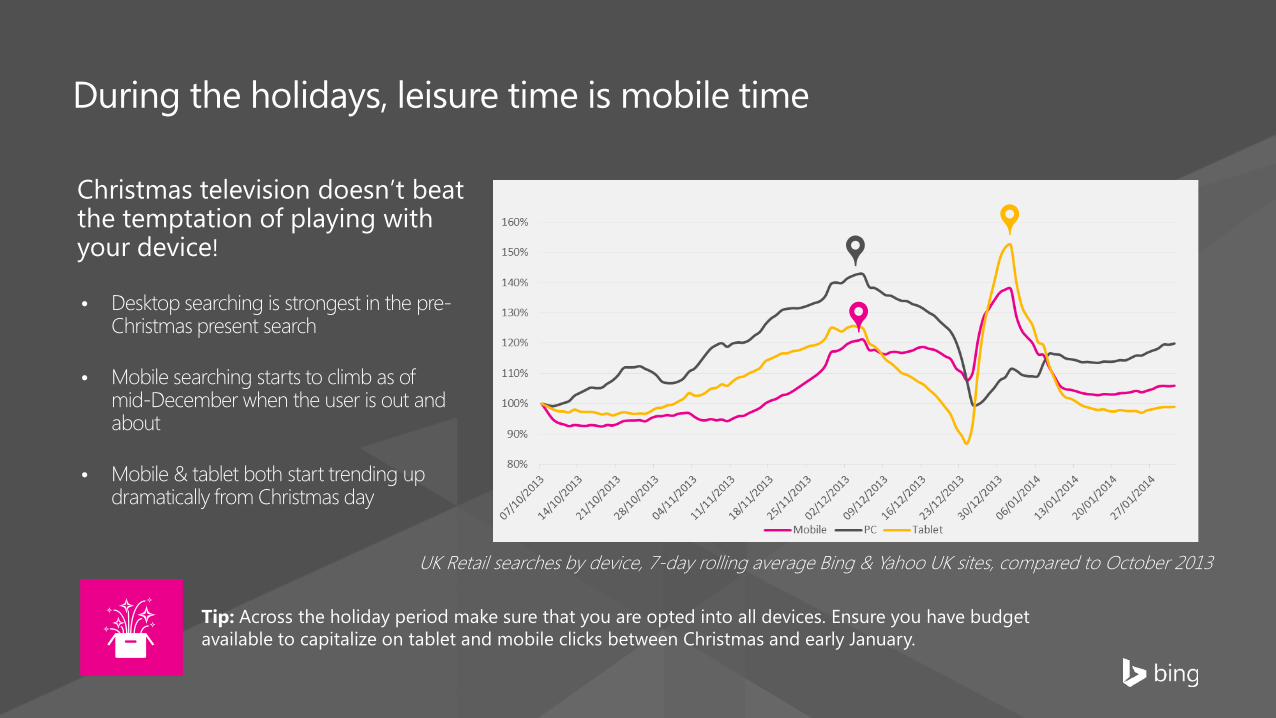
• Desktop searching is strongest in the pre-Christmas present search
• Mobile searching starts to climb as of mid-December when the user is out and about
• Mobile & tablet both start trending up dramatically from Christmas day
Tip: Across the holiday period make sure that you are opted into all devices. Ensure you have budget available to capitalize on tablet and mobile clicks between Christmas and early January.
Christmas television doesn’t beat the temptation of playing with your device!
UK Retail searches by device, 7-day rolling average Bing & Yahoo UK sites, compared to October 2013
During the holidays, leisure time is mobile time
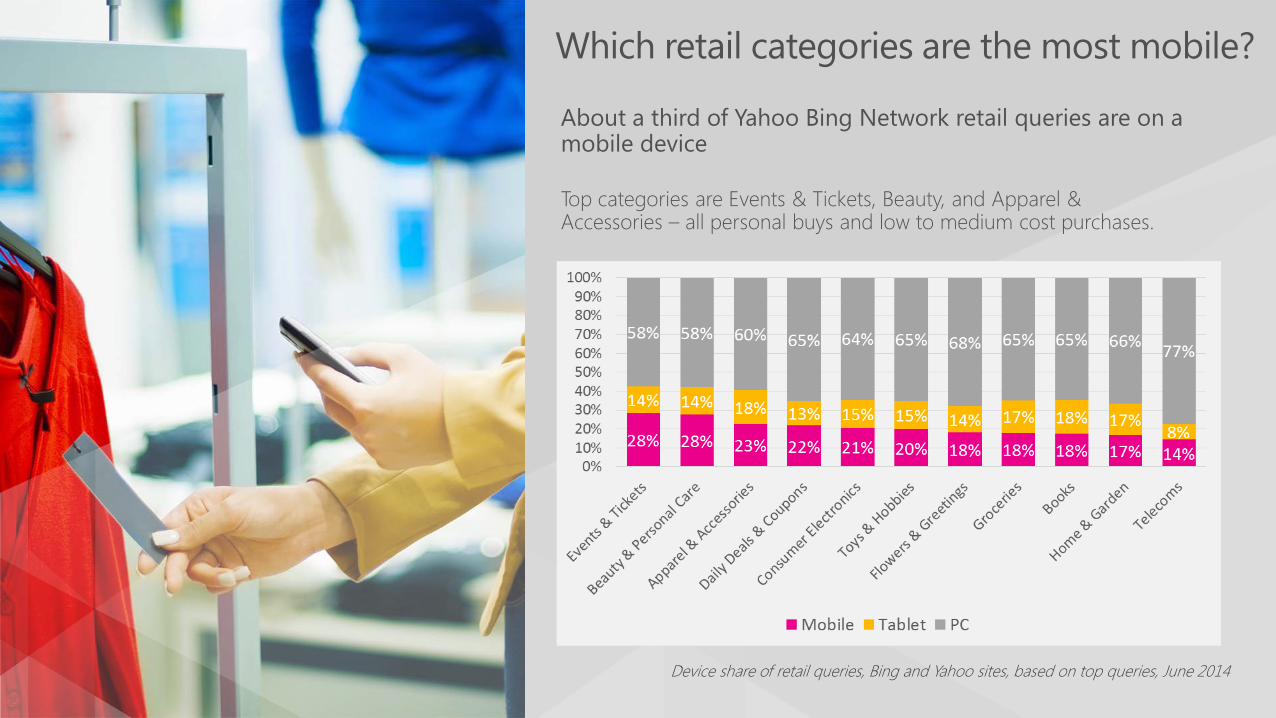
Which retail categories are the most mobile?
About a third of Yahoo Bing Network retail queries are on a mobile device Top categories are Events & Tickets, Beauty, and Apparel & Accessories – all personal buys and low to medium cost purchases.
Device share of retail queries, Bing and Yahoo sites, based on top queries, June 2014
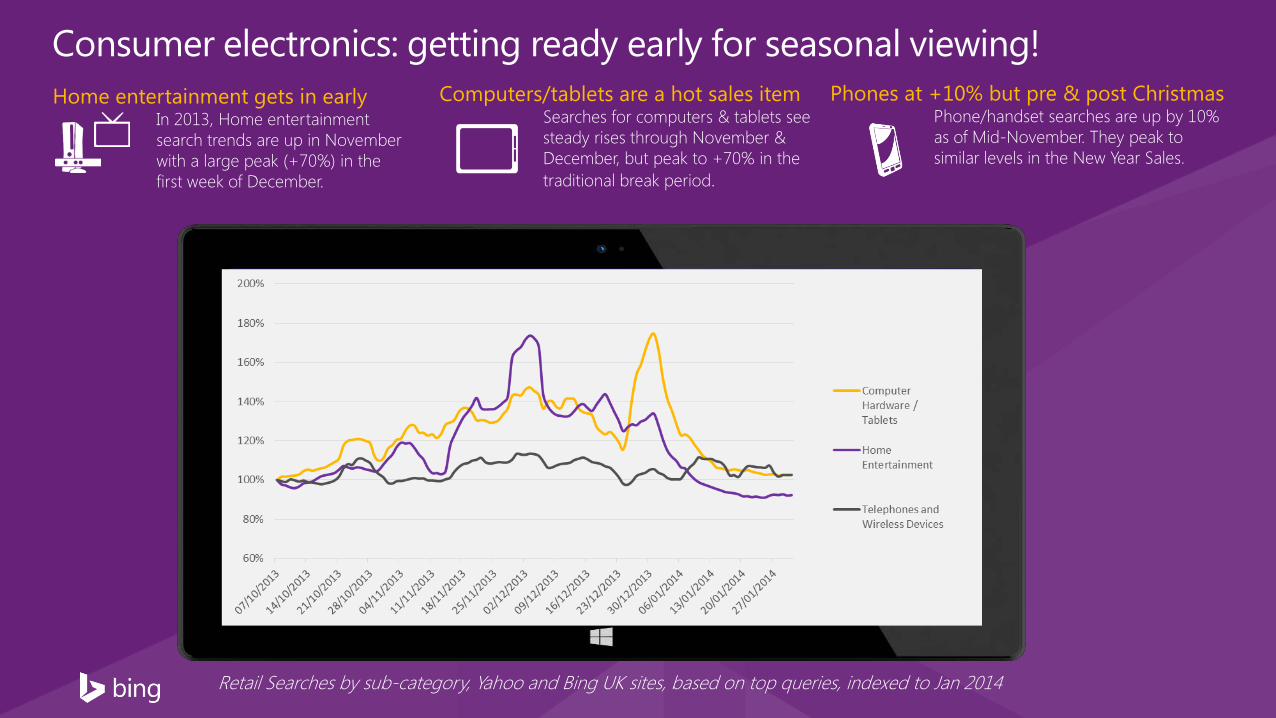
Consumer electronics: getting ready early for seasonal viewing! Phones at +10% but pre & post Christmas
Phone/handset searches are up by 10% as of Mid-November. They peak to similar levels in the New Year Sales.
Computers/tablets are a hot sales item Searches for computers & tablets see steady rises through November & December, but peak to +70% in the traditional break period.
Retail Searches by sub-category, Yahoo and Bing UK sites, based on top queries, indexed to Jan 2014
Home entertainment gets in early In 2013, Home entertainment search trends are up in November with a large peak (+70%) in the first week of December.
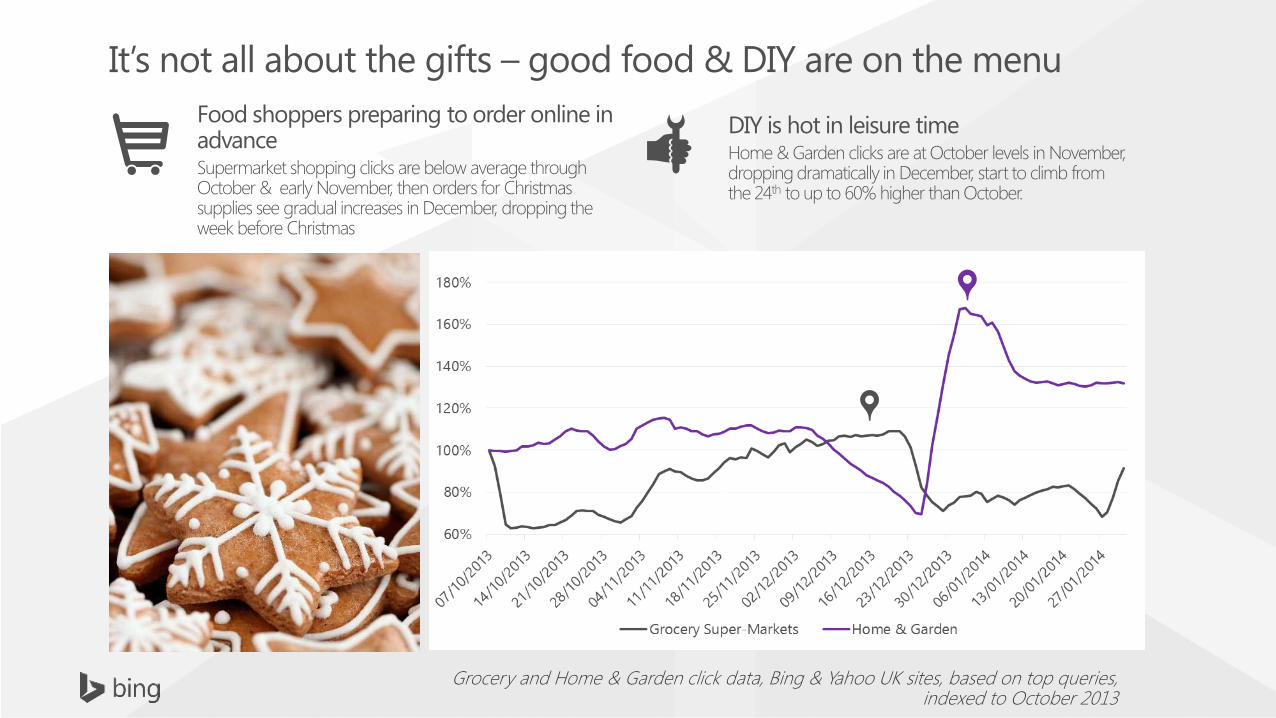
It’s not all about the gifts – good food & DIY are on the menu Food shoppers preparing to order online in advance Supermarket shopping clicks are below average through October & early November, then orders for Christmas supplies see gradual increases in December, dropping the week before Christmas
Grocery and Home & Garden click data, Bing & Yahoo UK sites, based on top queries, indexed to October 2013
DIY is hot in leisure time Home & Garden clicks are at October levels in November, dropping dramatically in December, start to climb from the 24th to up to 60% higher than October.
Microsoft Confidential
Hot presents Top searched beauty & electronics brands in 2013
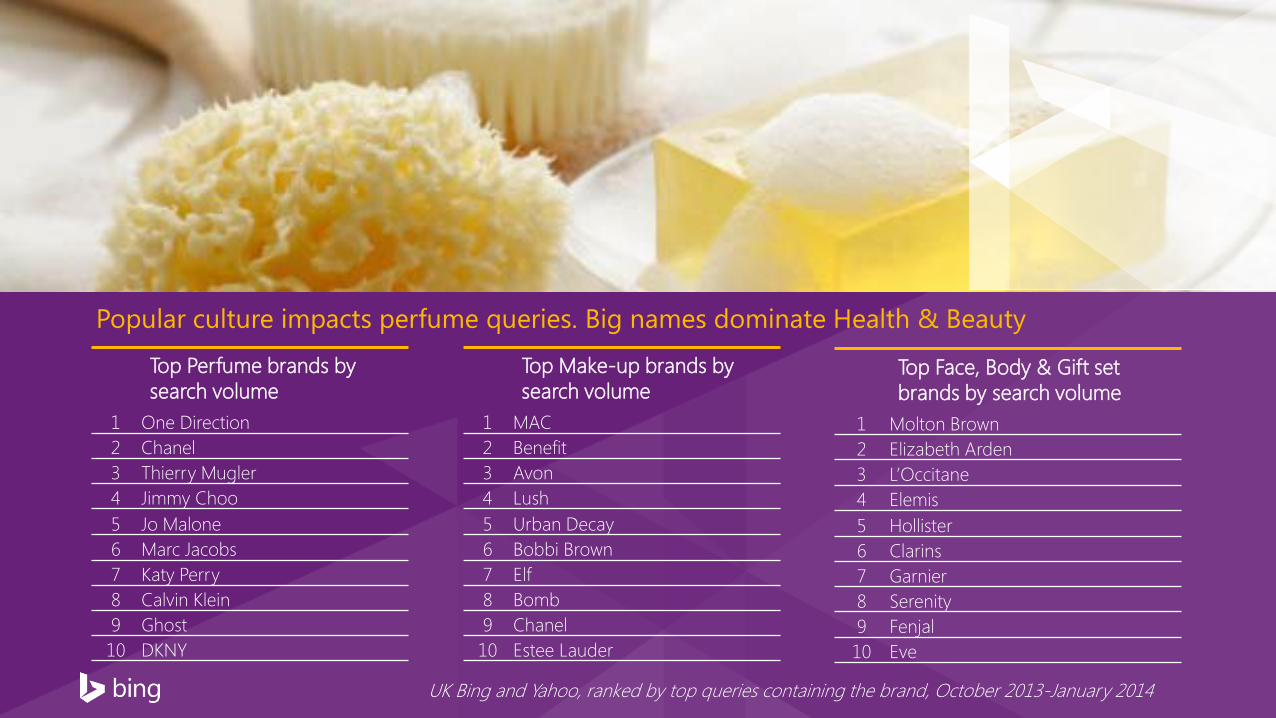
Top Perfume brands by search volume
1 One Direction 2 Chanel 3 Thierry Mugler 4 Jimmy Choo 5 Jo Malone 6 Marc Jacobs 7 Katy Perry 8 Calvin Klein 9 Ghost 10 DKNY
Top Make-up brands by search volume
1 MAC 2 Benefit 3 Avon 4 Lush 5 Urban Decay 6 Bobbi Brown 7 Elf 8 Bomb 9 Chanel 10 Estee Lauder
UK Bing and Yahoo, ranked by top queries containing the brand, October 2013-January 2014
Top Face, Body & Gift set brands by search volume
1 Molton Brown 2 Elizabeth Arden 3 L’Occitane 4 Elemis 5 Hollister 6 Clarins 7 Garnier 8 Serenity 9 Fenjal 10 Eve
Popular culture impacts perfume queries. Big names dominate Health & Beauty
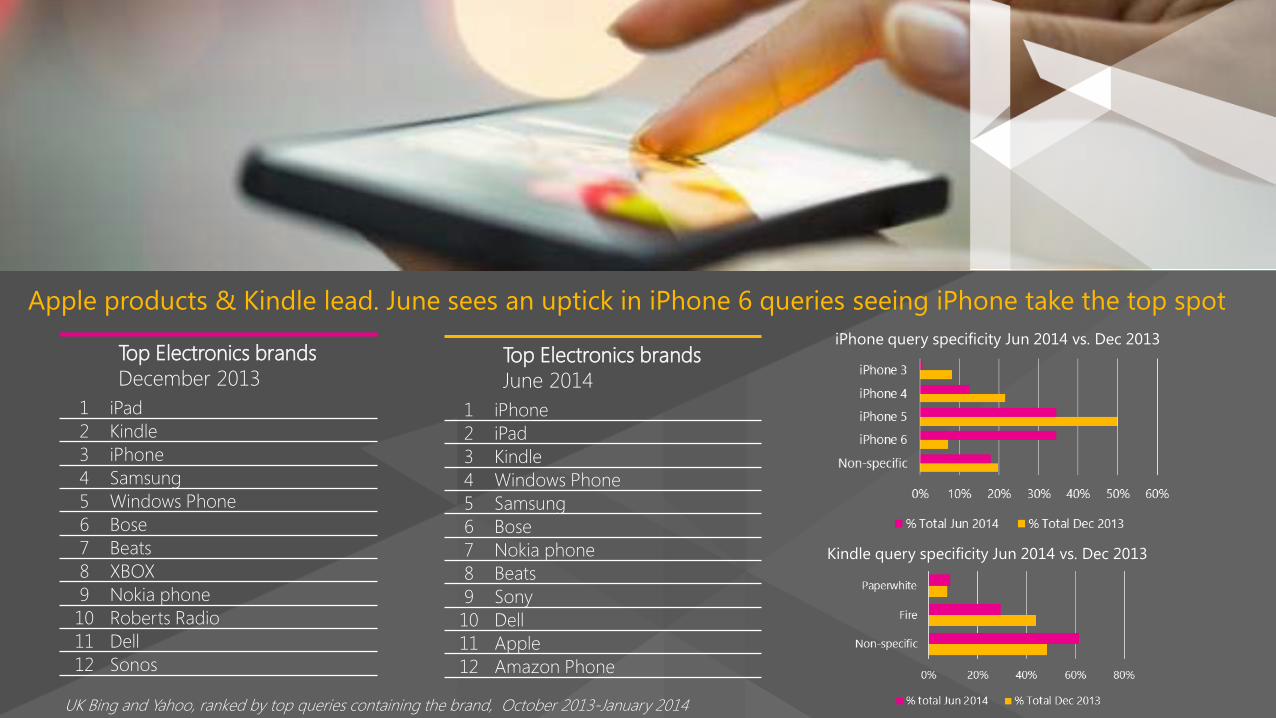
Top Electronics brands December 2013
1 iPad 2 Kindle 3 iPhone 4 Samsung 5 Windows Phone 6 Bose 7 Beats 8 XBOX 9 Nokia phone 10 Roberts Radio 11 Dell 12 Sonos
Top Electronics brands June 2014
1 iPhone 2 iPad 3 Kindle 4 Windows Phone 5 Samsung 6 Bose 7 Nokia phone 8 Beats 9 Sony 10 Dell 11 Apple 12 Amazon Phone
UK Bing and Yahoo, ranked by top queries containing the brand, October 2013-January 2014
iPhone query specificity Jun 2014 vs. Dec 2013
Kindle query specificity Jun 2014 vs. Dec 2013
Apple products & Kindle lead. June sees an uptick in iPhone 6 queries seeing iPhone take the top spot
@JmGagnon | @BingAds
How does people’s searching language change throughout the
season?
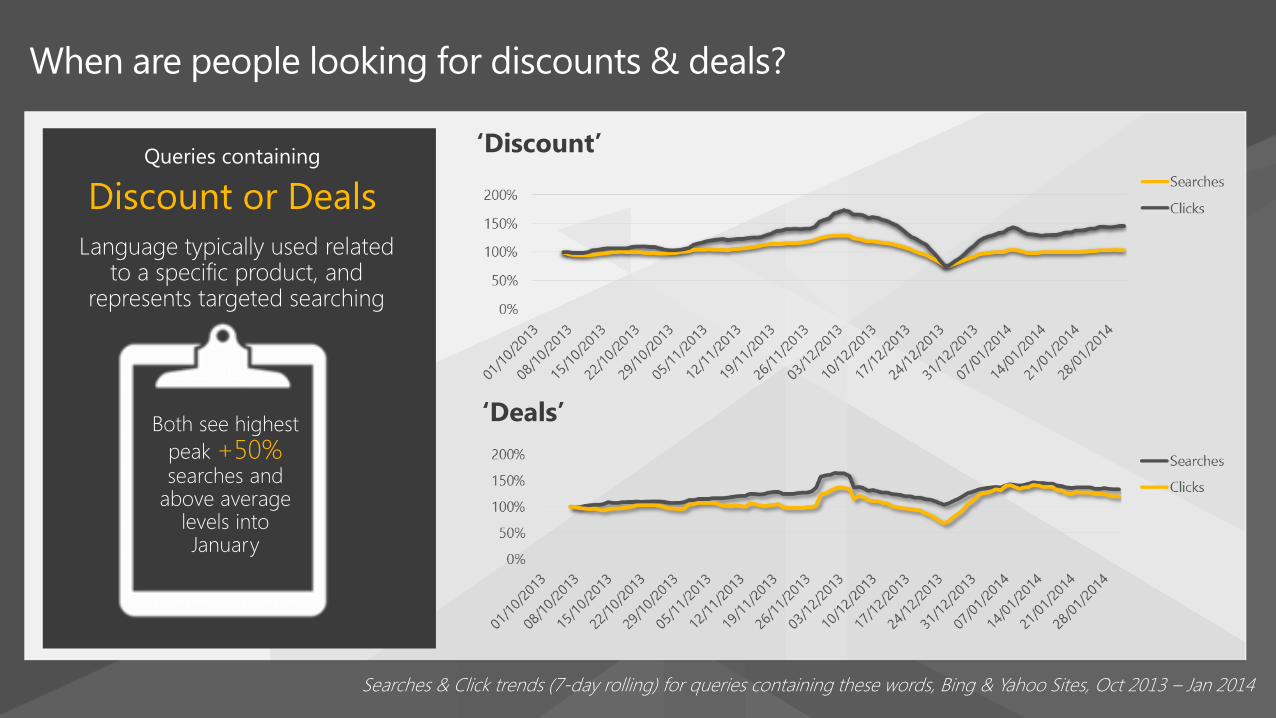
When are people looking for discounts & deals?
Queries containing
Discount or Deals Language typically used related
to a specific product, and represents targeted searching
Both see highest peak +50% searches and
above average levels into January
‘Discount’
‘Deals’
Searches & Click trends (7-day rolling) for queries containing these words, Bing & Yahoo Sites, Oct 2013 – Jan 2014
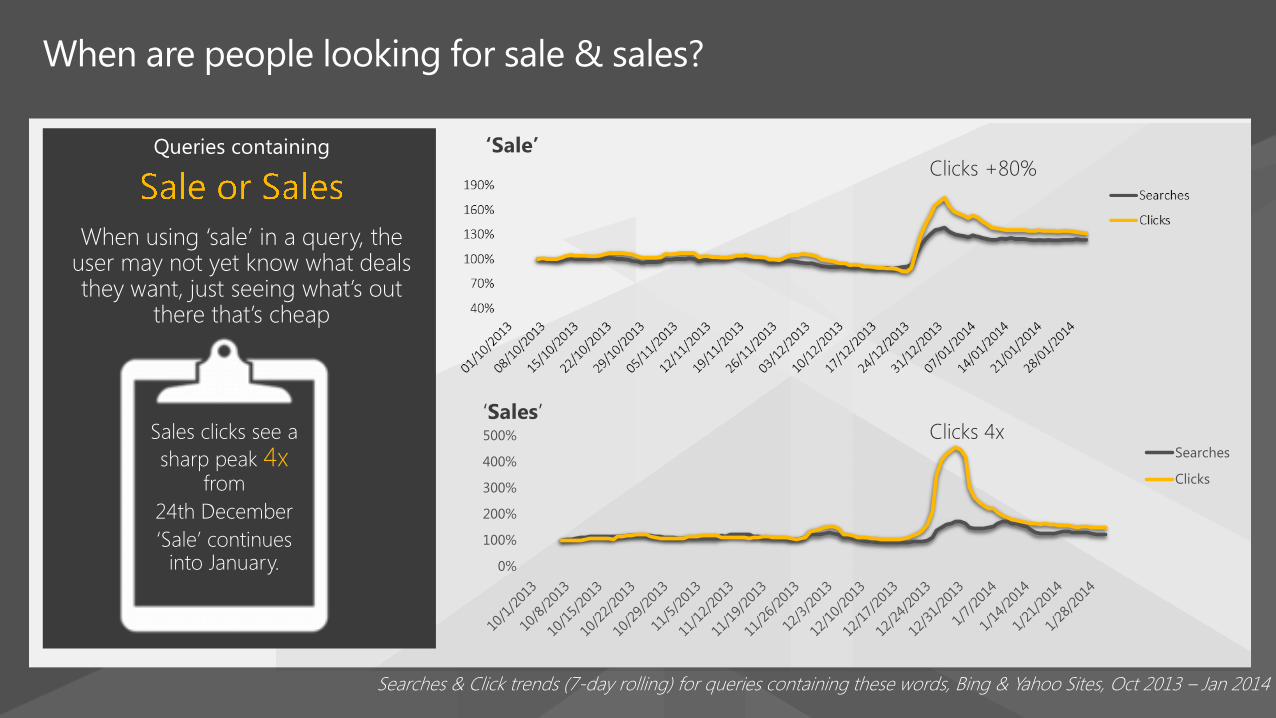
When are people looking for sale & sales?
Queries containing
When using ‘sale’ in a query, the user may not yet know what deals they want, just seeing what’s out
there that’s cheap
Sales clicks see a sharp peak 4x
from 24th December ‘Sale’ continues
into January.
‘Sale’
‘Sales’
0%
100%
200%
300%
400%
500% Searches
Clicks
Clicks +80%
Clicks 4x
Searches & Click trends (7-day rolling) for queries containing these words, Bing & Yahoo Sites, Oct 2013 – Jan 2014
@JmGagnon | @BingAds
How to make your ad stand out Ad copy learnings from 2013
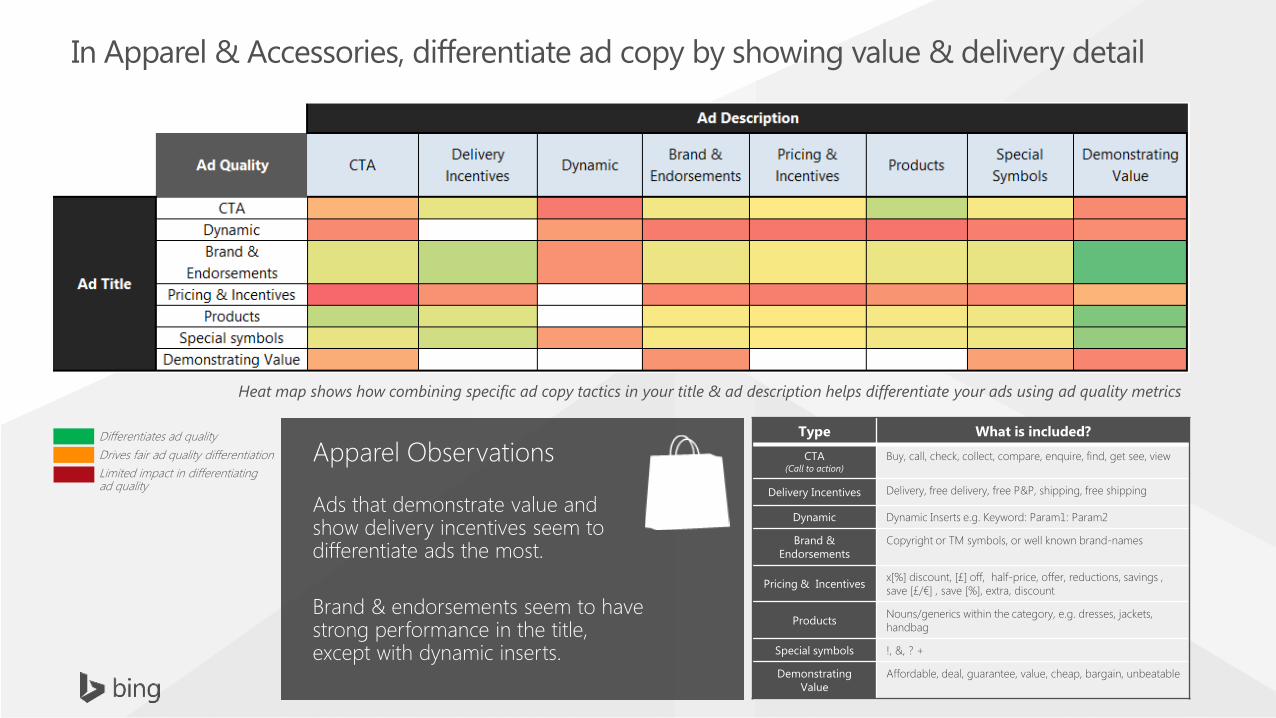
In Apparel & Accessories, differentiate ad copy by showing value & delivery detail
Differentiates ad quality Drives fair ad quality differentiation Limited impact in differentiating ad quality
Heat map shows how combining specific ad copy tactics in your title & ad description helps differentiate your ads using ad quality metrics
Type What is included?
CTA (Call to action)
Buy, call, check, collect, compare, enquire, find, get see, view
Delivery Incentives Delivery, free delivery, free P&P, shipping, free shipping
Dynamic Dynamic Inserts e.g. Keyword: Param1: Param2
Brand & Endorsements
Copyright or TM symbols, or well known brand-names
Pricing & Incentives x[%] discount, [£] off, half-price, offer, reductions, savings , save [£/€] , save [%], extra, discount
Products Nouns/generics within the category, e.g. dresses, jackets, handbag
Special symbols !, &, ? +
Demonstrating Value
Affordable, deal, guarantee, value, cheap, bargain, unbeatable
Apparel Observations
Ads that demonstrate value and show delivery incentives seem to differentiate ads the most.
Brand & endorsements seem to have strong performance in the title, except with dynamic inserts.
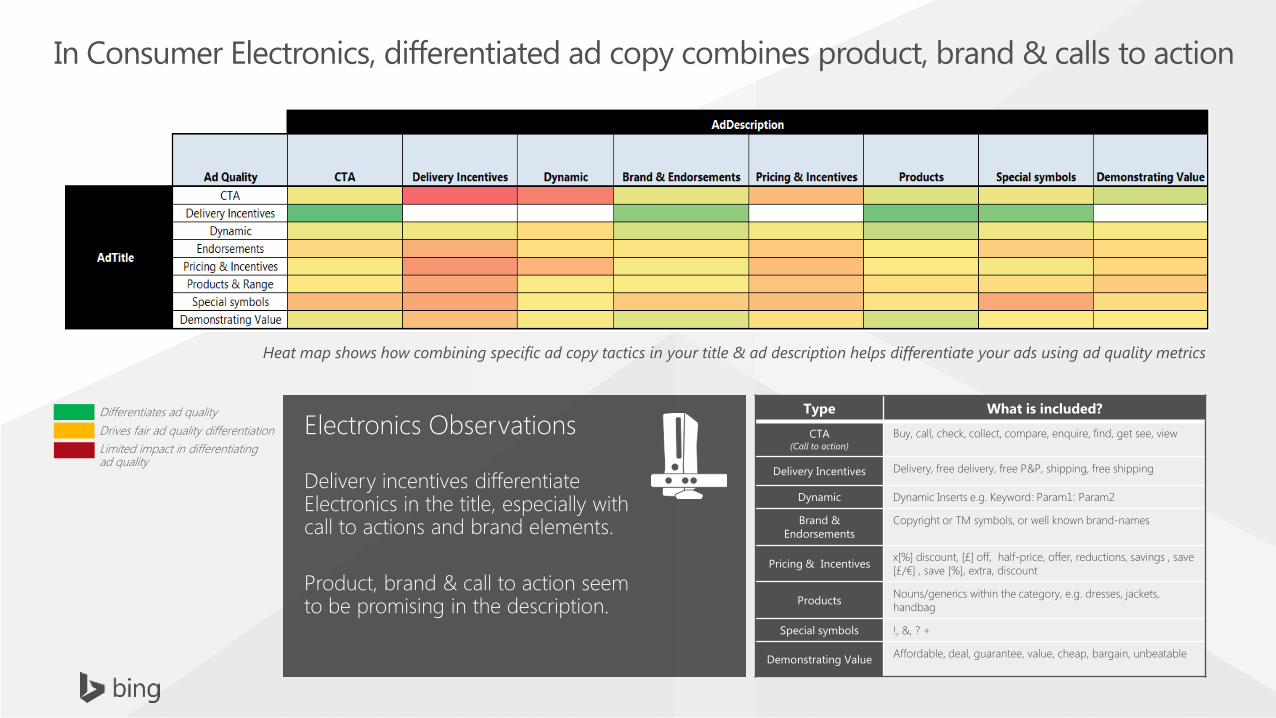
Electronics Observations Delivery incentives differentiate Electronics in the title, especially with call to actions and brand elements. Product, brand & call to action seem to be promising in the description.
In Consumer Electronics, differentiated ad copy combines product, brand & calls to action
Type What is included?
CTA (Call to action)
Buy, call, check, collect, compare, enquire, find, get see, view
Delivery Incentives Delivery, free delivery, free P&P, shipping, free shipping
Dynamic Dynamic Inserts e.g. Keyword: Param1: Param2
Brand & Endorsements
Copyright or TM symbols, or well known brand-names
Pricing & Incentives x[%] discount, [£] off, half-price, offer, reductions, savings , save [£/€] , save [%], extra, discount
Products Nouns/generics within the category, e.g. dresses, jackets, handbag
Special symbols !, &, ? +
Demonstrating Value Affordable, deal, guarantee, value, cheap, bargain, unbeatable
Differentiates ad quality Drives fair ad quality differentiation Limited impact in differentiating ad quality
Heat map shows how combining specific ad copy tactics in your title & ad description helps differentiate your ads using ad quality metrics
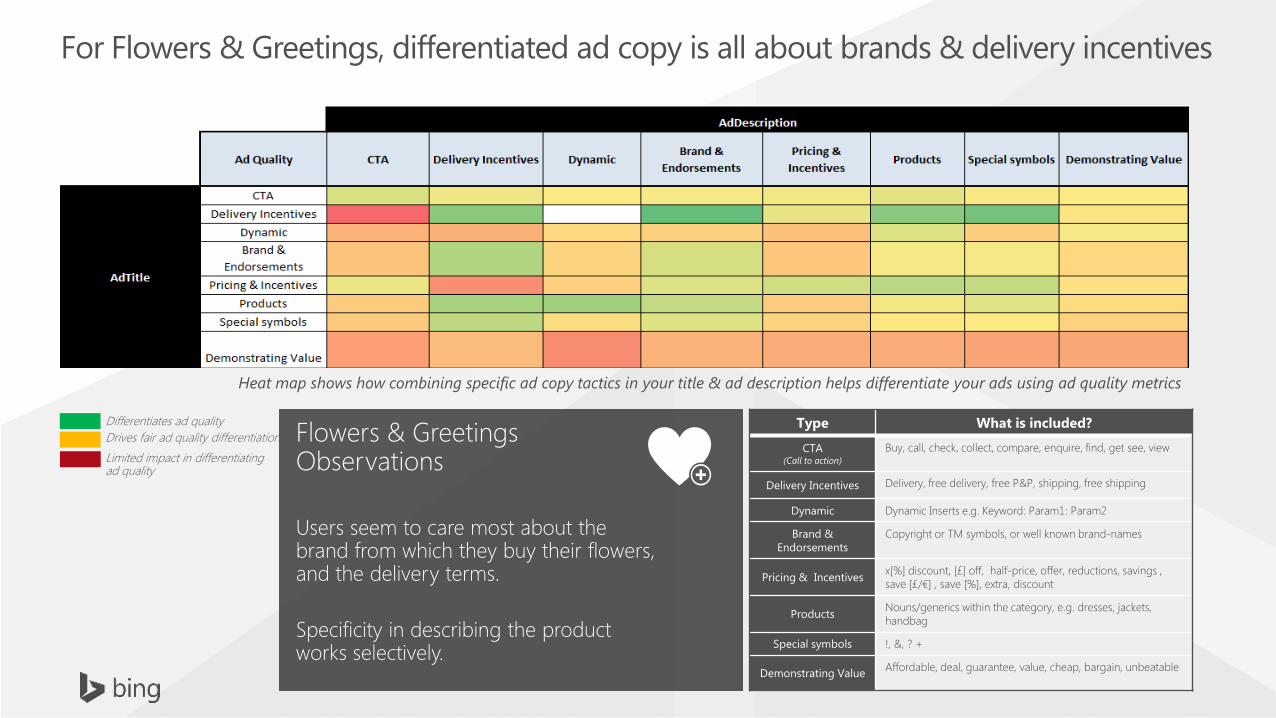
For Flowers & Greetings, differentiated ad copy is all about brands & delivery incentives
Flowers & Greetings Observations Users seem to care most about the brand from which they buy their flowers, and the delivery terms. Specificity in describing the product works selectively.
Type What is included?
CTA (Call to action)
Buy, call, check, collect, compare, enquire, find, get see, view
Delivery Incentives Delivery, free delivery, free P&P, shipping, free shipping
Dynamic Dynamic Inserts e.g. Keyword: Param1: Param2
Brand & Endorsements
Copyright or TM symbols, or well known brand-names
Pricing & Incentives x[%] discount, [£] off, half-price, offer, reductions, savings , save [£/€] , save [%], extra, discount
Products Nouns/generics within the category, e.g. dresses, jackets, handbag
Special symbols !, &, ? +
Demonstrating Value Affordable, deal, guarantee, value, cheap, bargain, unbeatable
Differentiates ad quality Drives fair ad quality differentiation Limited impact in differentiating ad quality
Heat map shows how combining specific ad copy tactics in your title & ad description helps differentiate your ads using ad quality metrics
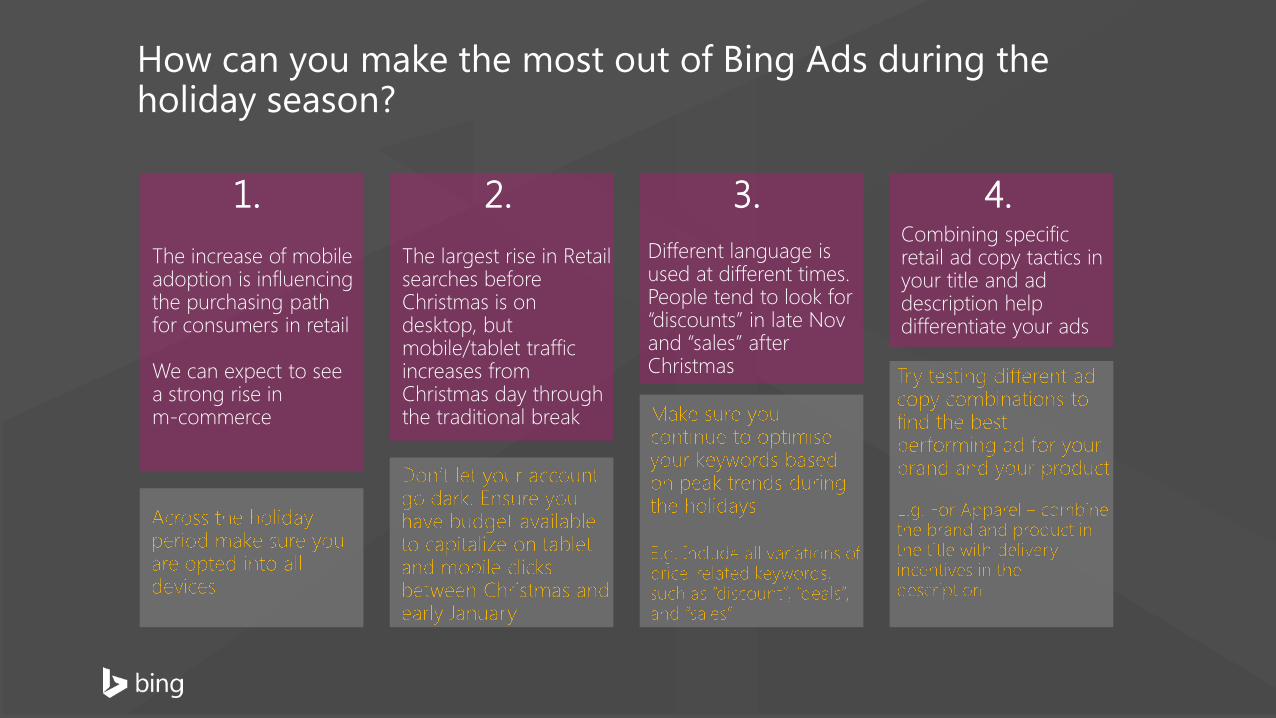
How can you make the most out of Bing Ads during the holiday season?
The largest rise in Retail searches before Christmas is on desktop, but mobile/tablet traffic increases from Christmas day through the traditional break
The increase of mobile adoption is influencing the purchasing path for consumers in retail We can expect to see a strong rise in m-commerce
Different language is used at different times. People tend to look for “discounts” in late Nov and “sales” after Christmas
Combining specific retail ad copy tactics in your title and ad description help differentiate your ads
1. 2. 3. 4.