Embed Size (px)
Citation preview
Beats vs. Bose Deep Dive Report
C R I M S O N H E X A G O N . C O M
C R I M S O N H E X A G O N . C O M
Lifestyle Brand Marketing
VS.
Product-Focused Marketing
3
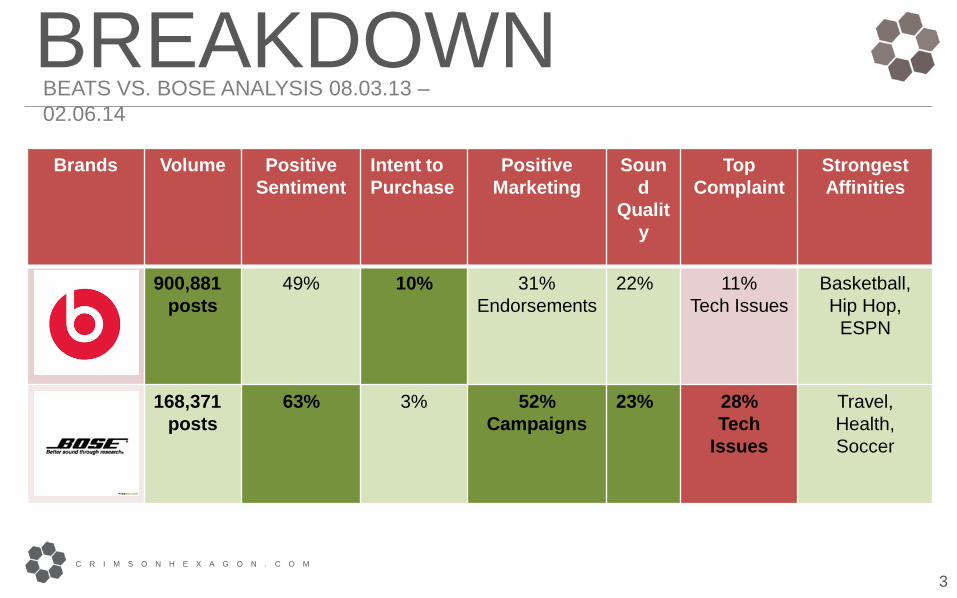
BREAKDOWN
C R I M S O N H E X A G O N . C O M
BEATS VS. BOSE ANALYSIS 08.03.13 – 02.06.14
Brands Volume Positive Sentiment
Intent to Purchase
Positive Marketing
Sound
Quality
Top Complaint
Strongest Affinities
900,881 posts
49% 10% 31% Endorsements
22% 11% Tech Issues
Basketball, Hip Hop,
ESPN
168,371 posts
63% 3% 52% Campaigns
23% 28% Tech
Issues
Travel, Health, Soccer
4
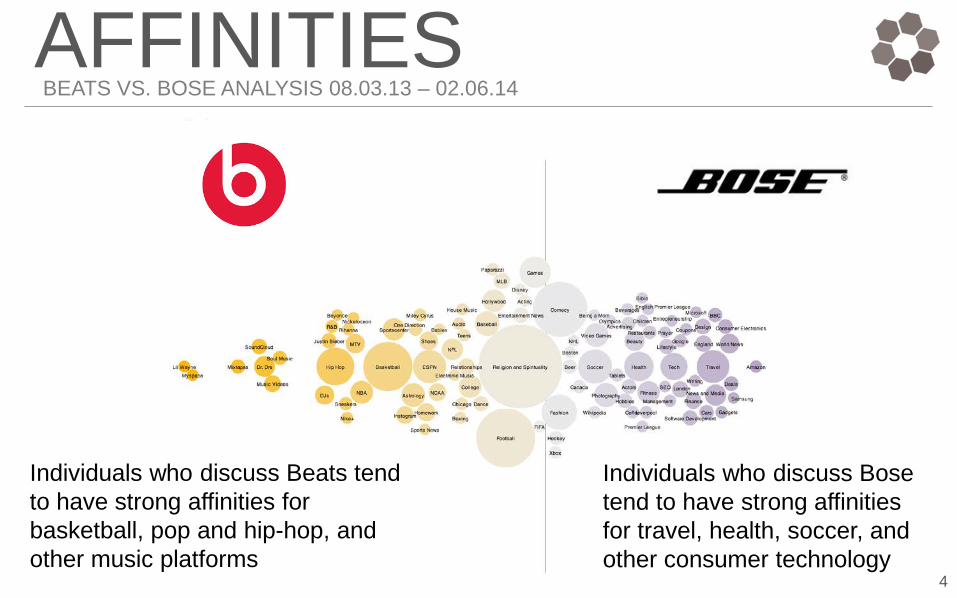
AFFINITIES
Individuals who discuss Beats tend to have strong affinities for basketball, pop and hip-hop, and other music platforms
Individuals who discuss Bose tend to have strong affinities for travel, health, soccer, and other consumer technology
BEATS VS. BOSE ANALYSIS 08.03.13 – 02.06.14
C R I M S O N H E X A G O N . C O M

Brand Beats
C R I M S O N H E X A G O N . C O M
7
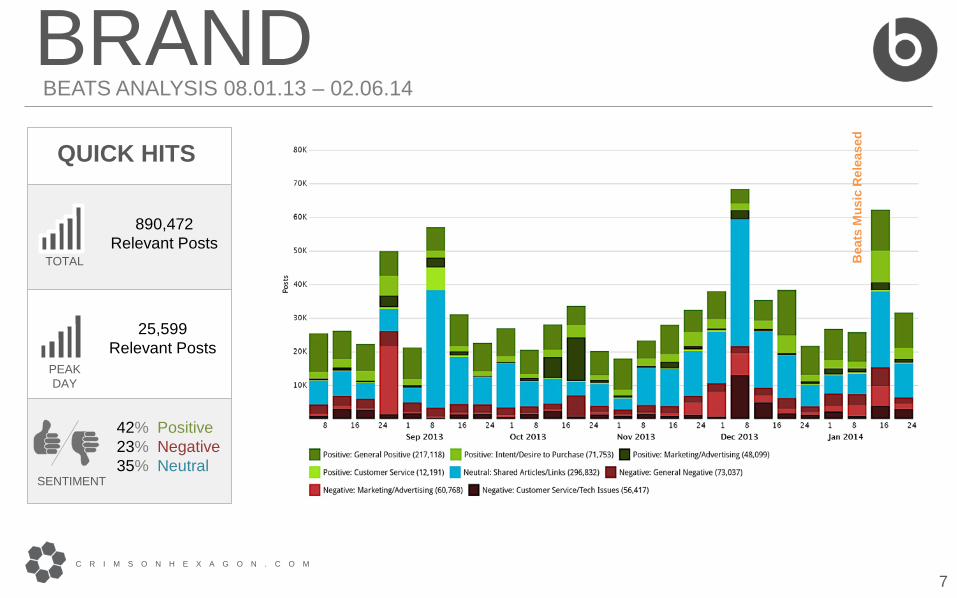
BRAND
C R I M S O N H E X A G O N . C O M
BEATS ANALYSIS 08.01.13 – 02.06.14
QUICK HITS
890,472 Relevant Posts
TOTAL
25,599 Relevant Posts
PEAK DAY
SENTIMENT
42% Positive 23% Negative 35% Neutral
Bea
ts M
usic
Rel
ease
d
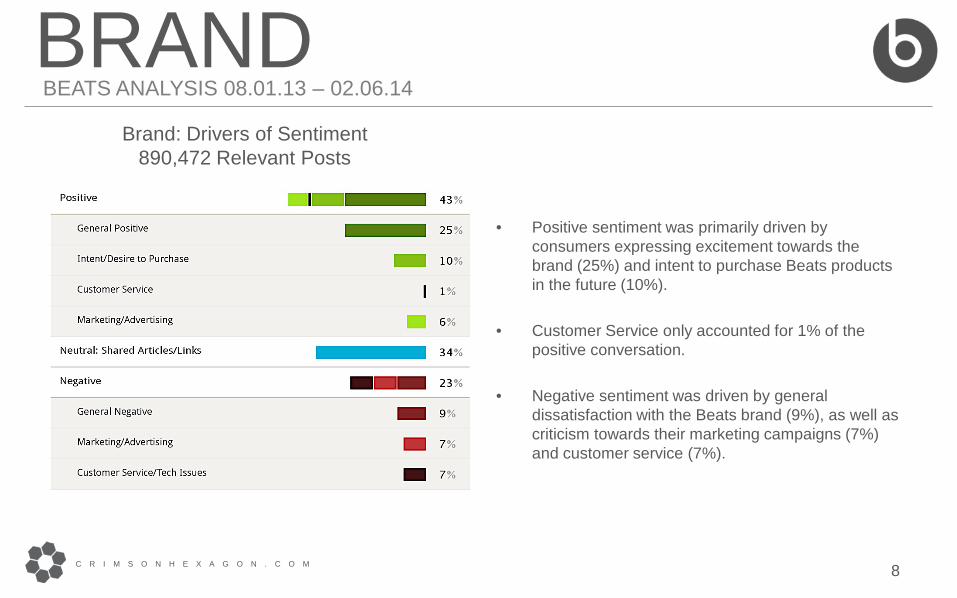
Brand: Drivers of Sentiment 890,472 Relevant Posts
• Positive sentiment was primarily driven by consumers expressing excitement towards the brand (25%) and intent to purchase Beats products in the future (10%).
• Customer Service only accounted for 1% of the positive conversation.
• Negative sentiment was driven by general dissatisfaction with the Beats brand (9%), as well as criticism towards their marketing campaigns (7%) and customer service (7%).
8
BRAND
C R I M S O N H E X A G O N . C O M
BEATS ANALYSIS 08.01.13 – 02.06.14
9
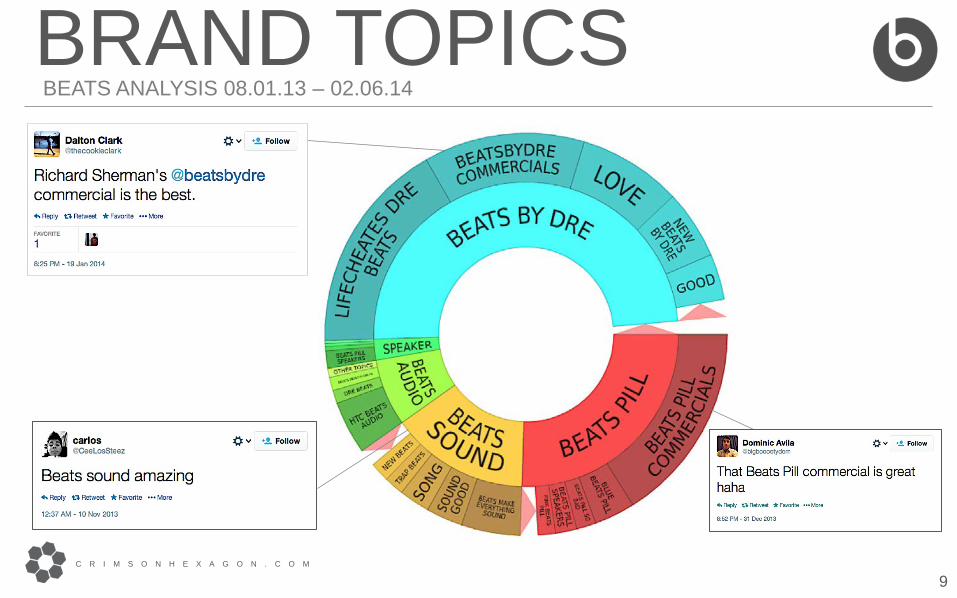
BRAND TOPICS
C R I M S O N H E X A G O N . C O M
BEATS ANALYSIS 08.01.13 – 02.06.14
Marketing Beats
C R I M S O N H E X A G O N . C O M
11
MARKETING
C R I M S O N H E X A G O N . C O M
BEATS ANALYSIS 08.01.13 – 02.06.14
QUICK HITS
41,467 Relevant Posts
TOTAL
3,151 Relevant Posts
PEAK DAY
SENTIMENT
49% Positive 32% Negative 19% Neutral
Kae
pern
ick
‘Hea
r Wha
t You
Wan
t’ C
ampa
ign
Sher
man
‘Hea
r Wha
t You
Wan
t’ C
ampa
ign
Em
inem
& B
eats
Pill
Com
mer
cial
s D
ebut
R K
elly
/ Gag
a C
omm
erci
al
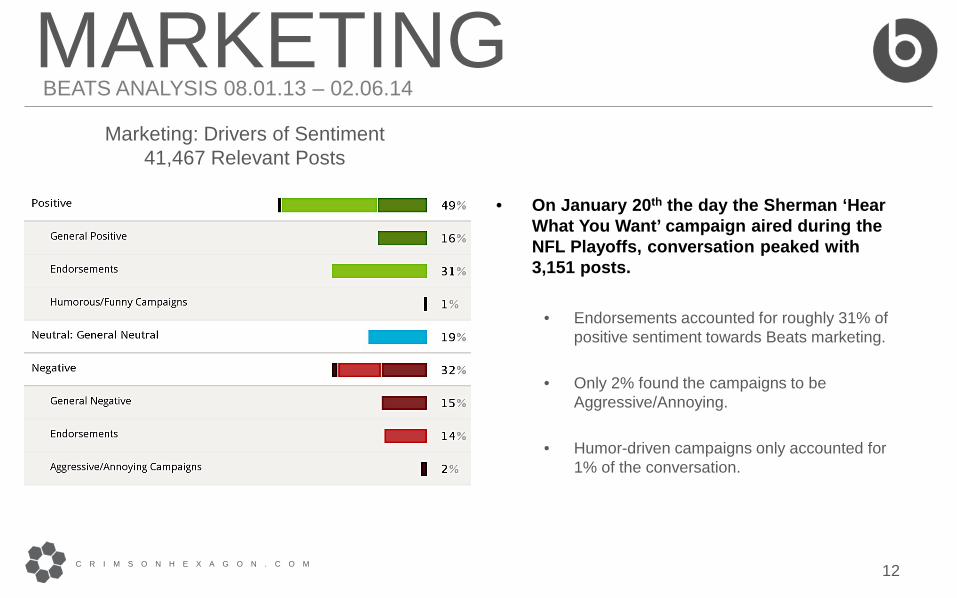
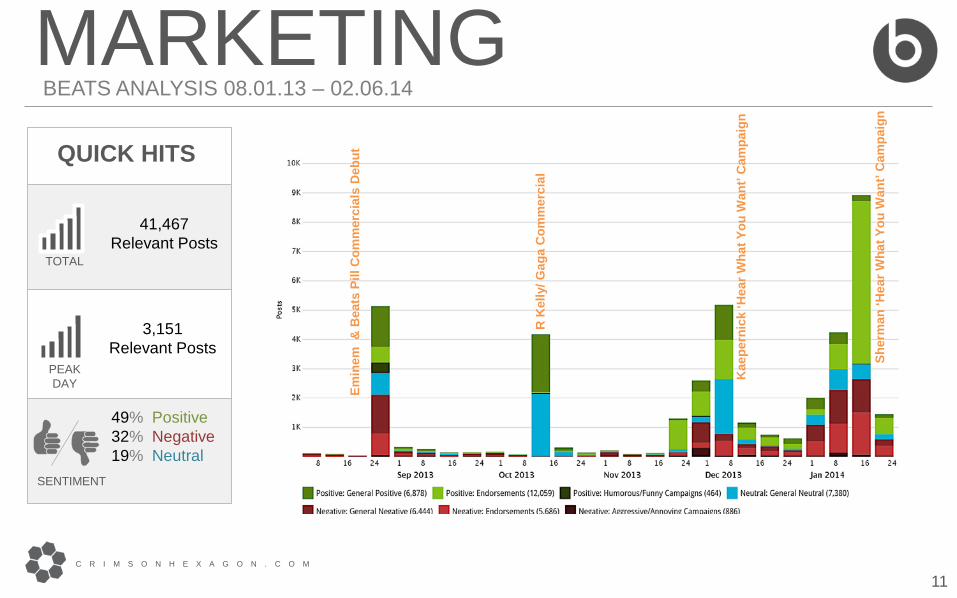
Marketing: Drivers of Sentiment 41,467 Relevant Posts
• On January 20th the day the Sherman ‘Hear
What You Want’ campaign aired during the NFL Playoffs, conversation peaked with 3,151 posts.
• Endorsements accounted for roughly 31% of positive sentiment towards Beats marketing.
• Only 2% found the campaigns to be
Aggressive/Annoying.
• Humor-driven campaigns only accounted for 1% of the conversation.
12
MARKETING
C R I M S O N H E X A G O N . C O M
BEATS ANALYSIS 08.01.13 – 02.06.14
13
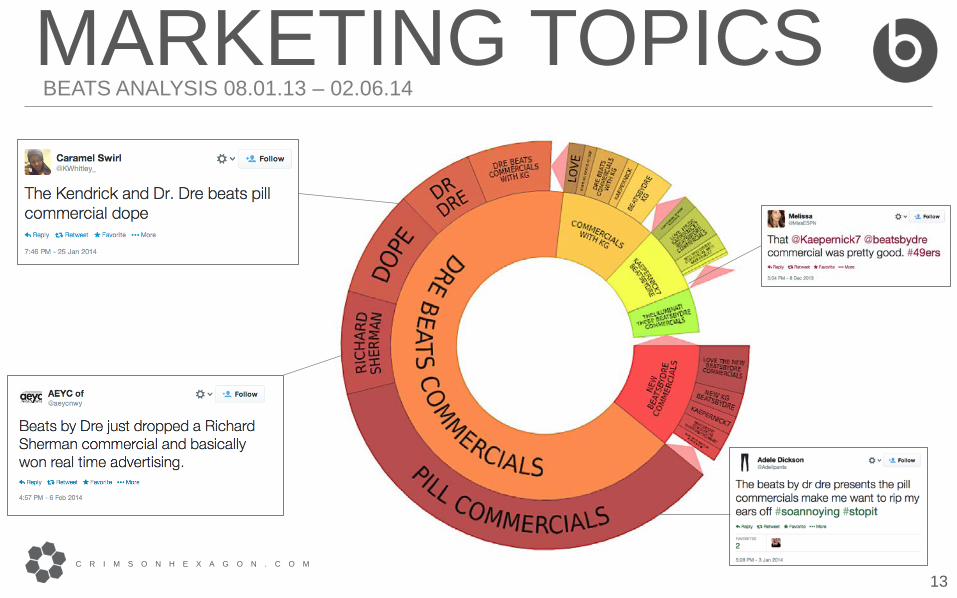
MARKETING TOPICS
C R I M S O N H E X A G O N . C O M
BEATS ANALYSIS 08.01.13 – 02.06.14
Products Beats
C R I M S O N H E X A G O N . C O M
15
PRODUCT
C R I M S O N H E X A G O N . C O M
BEATS ANALYSIS 08.01.13 – 02.06.14
QUICK HITS
178,589 Relevant
Posts TOTAL
16,822 Relevant
Posts PEAK DAY
SENTIMENT
37% Positive 15%
Negative 47% Neutral
Bea
ts P
ill C
omm
erci
al D
ebut
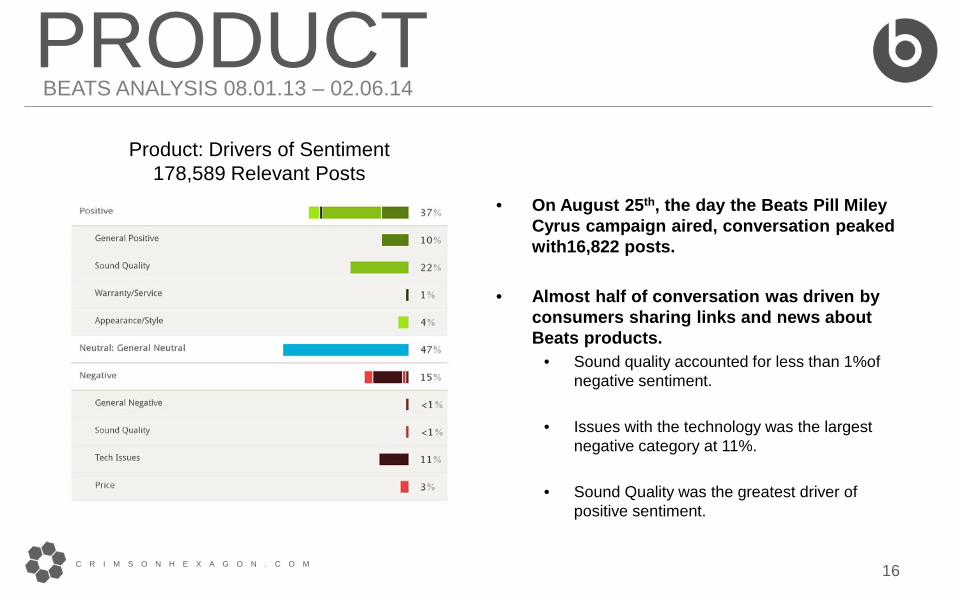
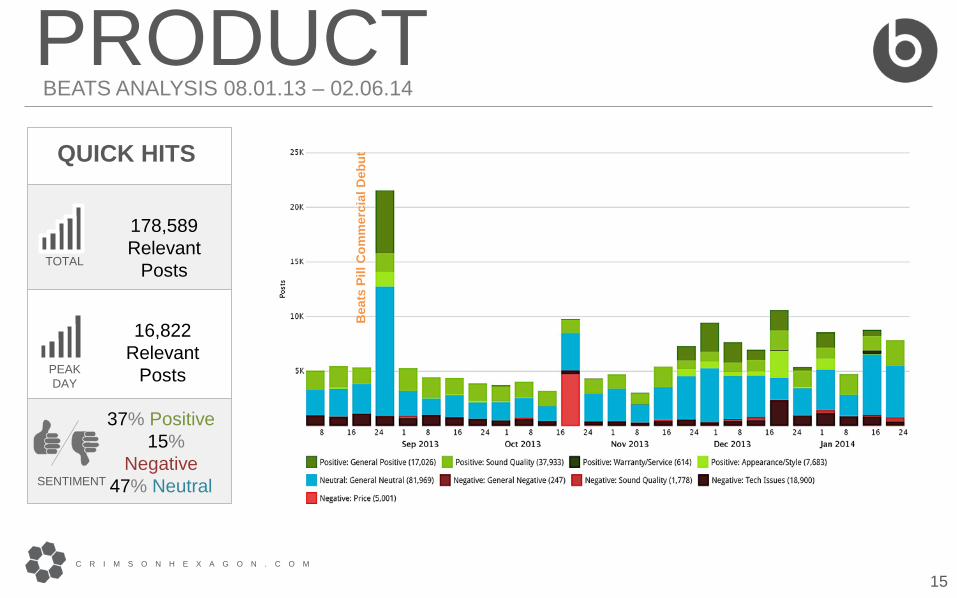
Product: Drivers of Sentiment 178,589 Relevant Posts
• On August 25th, the day the Beats Pill Miley Cyrus campaign aired, conversation peaked with16,822 posts.
• Almost half of conversation was driven by consumers sharing links and news about Beats products.
• Sound quality accounted for less than 1%of negative sentiment.
• Issues with the technology was the largest
negative category at 11%. • Sound Quality was the greatest driver of
positive sentiment.
16
PRODUCT
C R I M S O N H E X A G O N . C O M
BEATS ANALYSIS 08.01.13 – 02.06.14
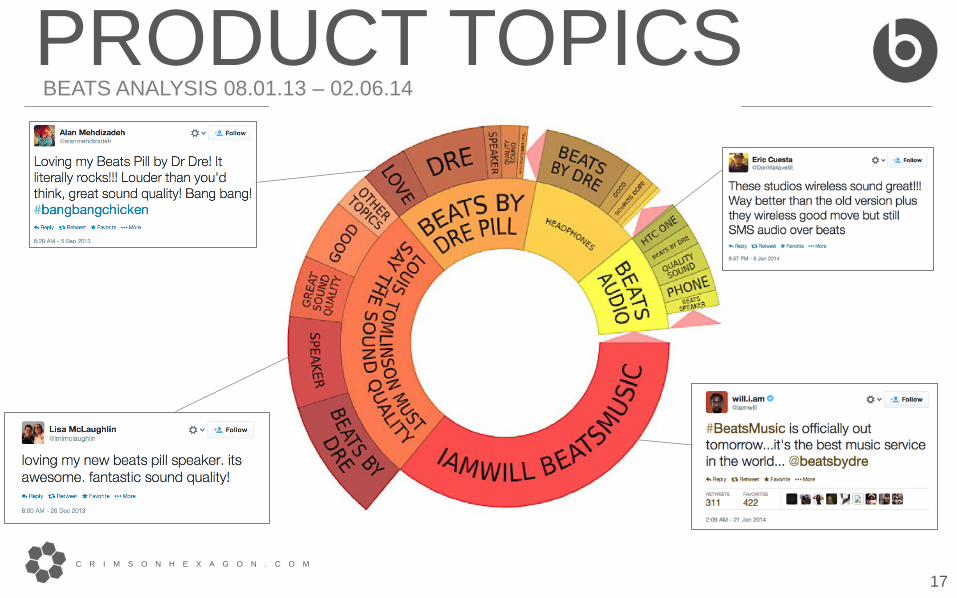
17
PRODUCT TOPICS
C R I M S O N H E X A G O N . C O M
BEATS ANALYSIS 08.01.13 – 02.06.14
C R I M S O N H E X A G O N . C O M
Brand Bose
C R I M S O N H E X A G O N . C O M
20
BRAND
C R I M S O N H E X A G O N . C O M
BOSE ANALYSIS 08.01.13 – 02.06.14
QUICK HITS
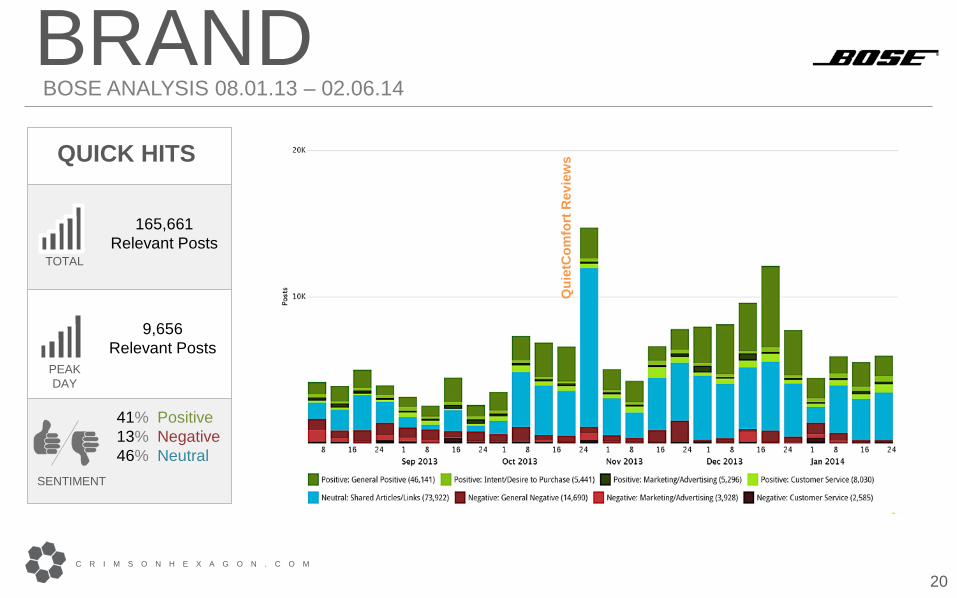
165,661 Relevant Posts
TOTAL
9,656 Relevant Posts
PEAK DAY
SENTIMENT
41% Positive 13% Negative 46% Neutral
Qui
etC
omfo
rt R
evie
ws
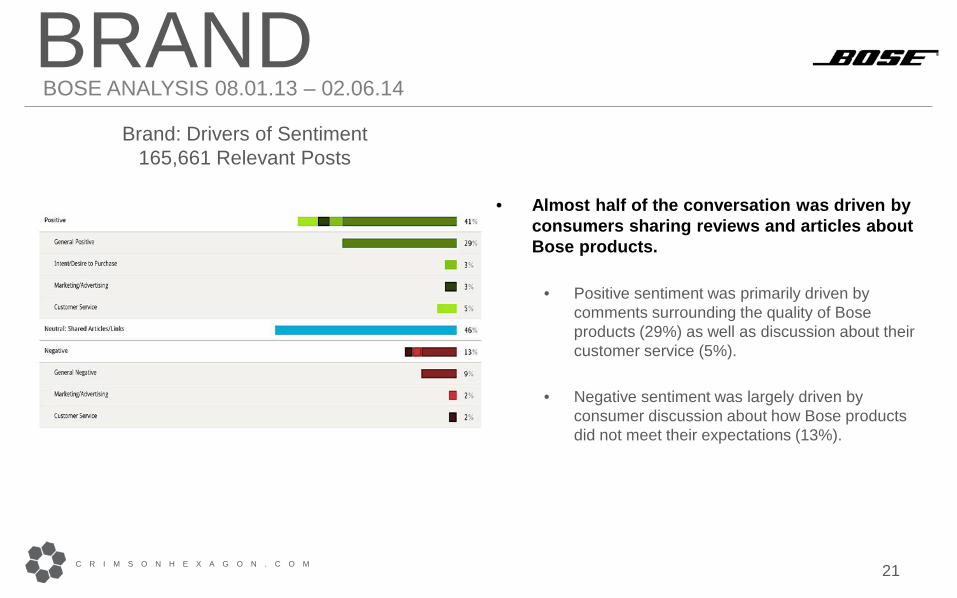
Brand: Drivers of Sentiment 165,661 Relevant Posts
• Almost half of the conversation was driven by
consumers sharing reviews and articles about Bose products.
• Positive sentiment was primarily driven by
comments surrounding the quality of Bose products (29%) as well as discussion about their customer service (5%).
• Negative sentiment was largely driven by
consumer discussion about how Bose products did not meet their expectations (13%).
21
BRAND
C R I M S O N H E X A G O N . C O M
BOSE ANALYSIS 08.01.13 – 02.06.14
22
BRAND TOPICS
C R I M S O N H E X A G O N . C O M
BOSE ANALYSIS 08.01.13 – 02.06.14

Marketing Bose
C R I M S O N H E X A G O N . C O M
24
MARKETING
C R I M S O N H E X A G O N . C O M
BOSE ANALYSIS 08.01.13 – 02.06.14
QUICK HITS
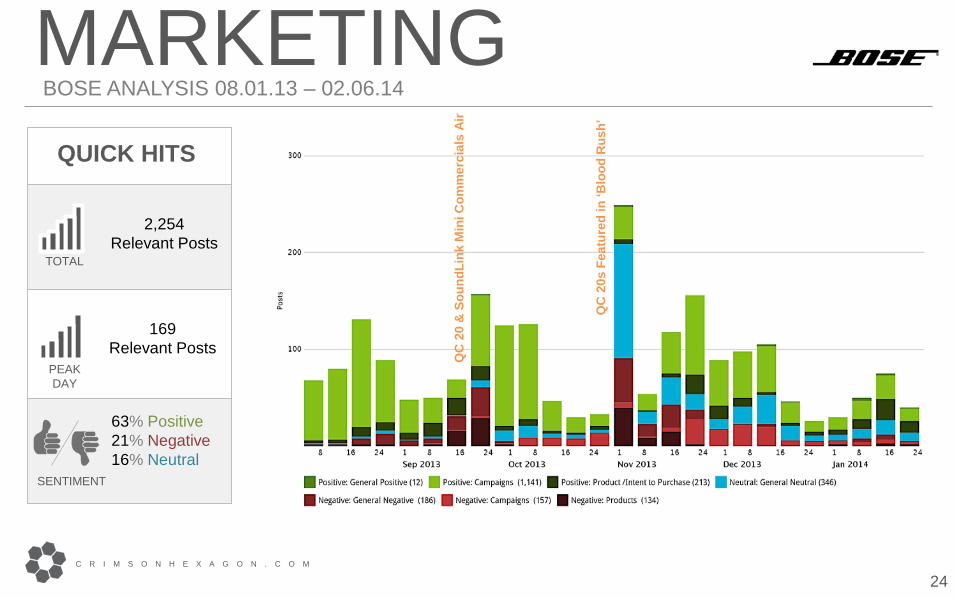
2,254 Relevant Posts
TOTAL
169 Relevant Posts
PEAK DAY
SENTIMENT
63% Positive 21% Negative 16% Neutral
QC
20s
Fea
ture
d in
‘Blo
od R
ush’
QC
20
& S
ound
Link
Min
i Com
mer
cial
s Ai
r
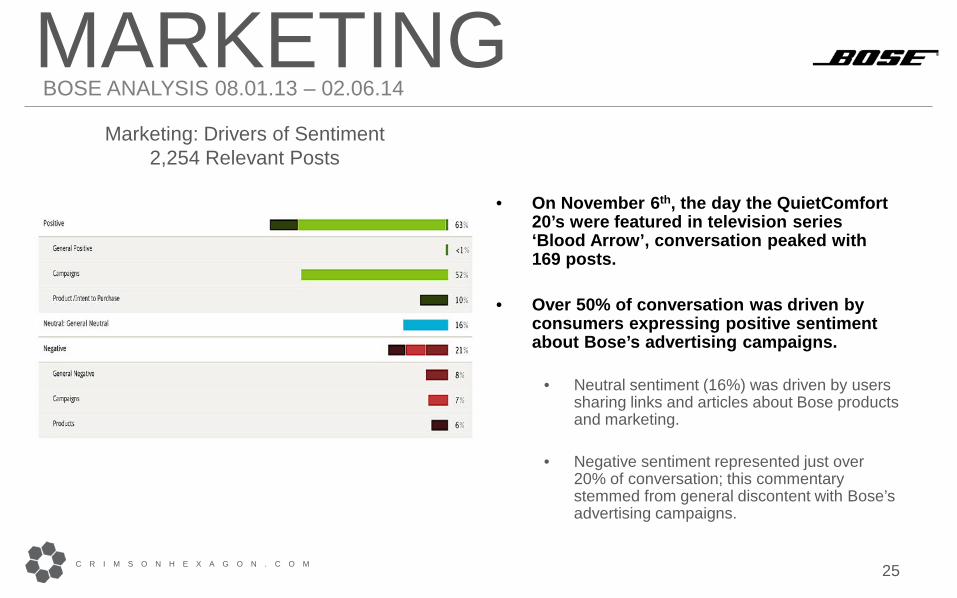
Marketing: Drivers of Sentiment 2,254 Relevant Posts
• On November 6th, the day the QuietComfort
20’s were featured in television series ‘Blood Arrow’, conversation peaked with 169 posts.
• Over 50% of conversation was driven by
consumers expressing positive sentiment about Bose’s advertising campaigns.
• Neutral sentiment (16%) was driven by users sharing links and articles about Bose products and marketing.
• Negative sentiment represented just over
20% of conversation; this commentary stemmed from general discontent with Bose’s advertising campaigns.
25
MARKETING
C R I M S O N H E X A G O N . C O M
BOSE ANALYSIS 08.01.13 – 02.06.14
26
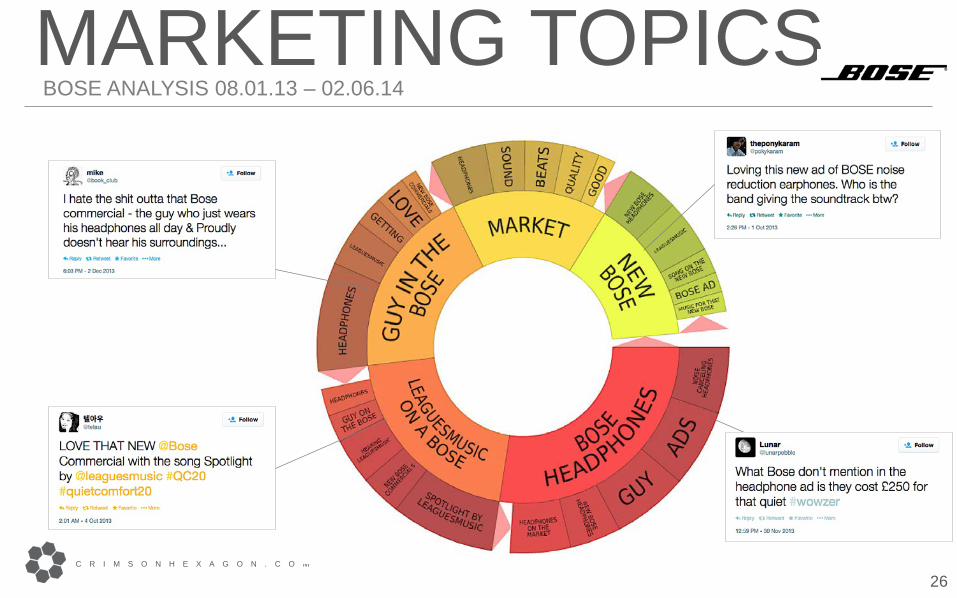
MARKETING TOPICS
C R I M S O N H E X A G O N . C O M
BOSE ANALYSIS 08.01.13 – 02.06.14

Products Bose
C R I M S O N H E X A G O N . C O M
28
PRODUCT
C R I M S O N H E X A G O N . C O M
BOSE ANALYSIS 08.01.13 – 02.06.14
QUICK HITS
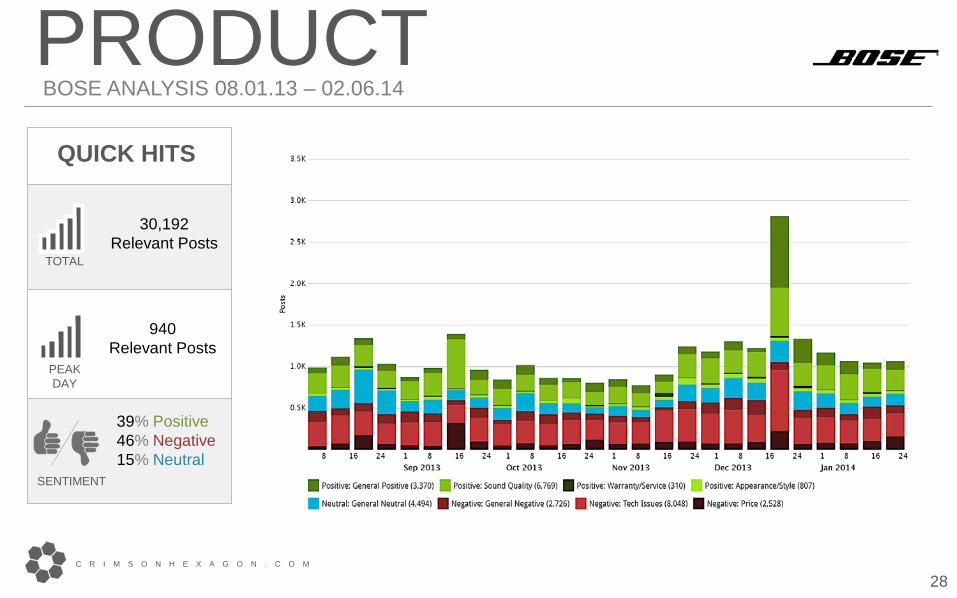
30,192 Relevant Posts
TOTAL
940 Relevant Posts
PEAK DAY
SENTIMENT
39% Positive 46% Negative 15% Neutral
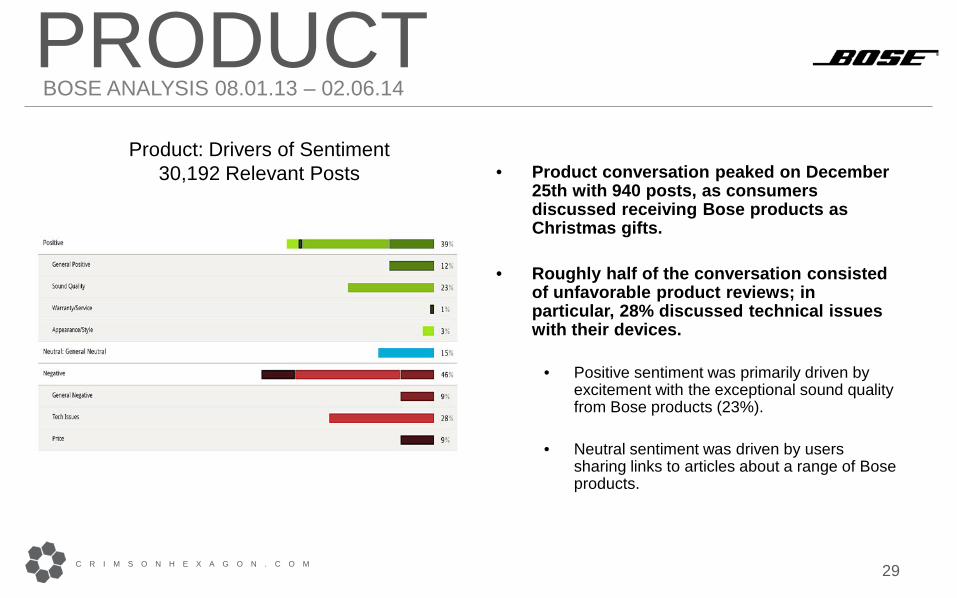
Product: Drivers of Sentiment 30,192 Relevant Posts • Product conversation peaked on December
25th with 940 posts, as consumers discussed receiving Bose products as Christmas gifts.
• Roughly half of the conversation consisted of unfavorable product reviews; in particular, 28% discussed technical issues with their devices.
• Positive sentiment was primarily driven by excitement with the exceptional sound quality from Bose products (23%).
• Neutral sentiment was driven by users sharing links to articles about a range of Bose products.
29
PRODUCT
C R I M S O N H E X A G O N . C O M
BOSE ANALYSIS 08.01.13 – 02.06.14
30
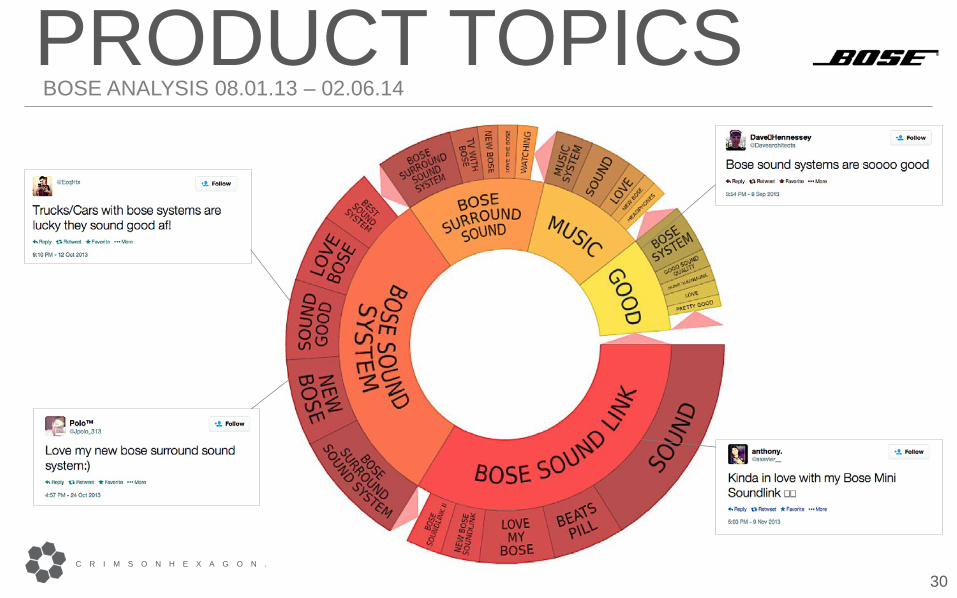
PRODUCT TOPICS
C R I M S O N H E X A G O N . C O M
BOSE ANALYSIS 08.01.13 – 02.06.14
31
KEY TAKEAWAYS
C R I M S O N H E X A G O N . C O M
BOSE VS. BEATS ANALYSIS 08.03.13 – 02.03.14
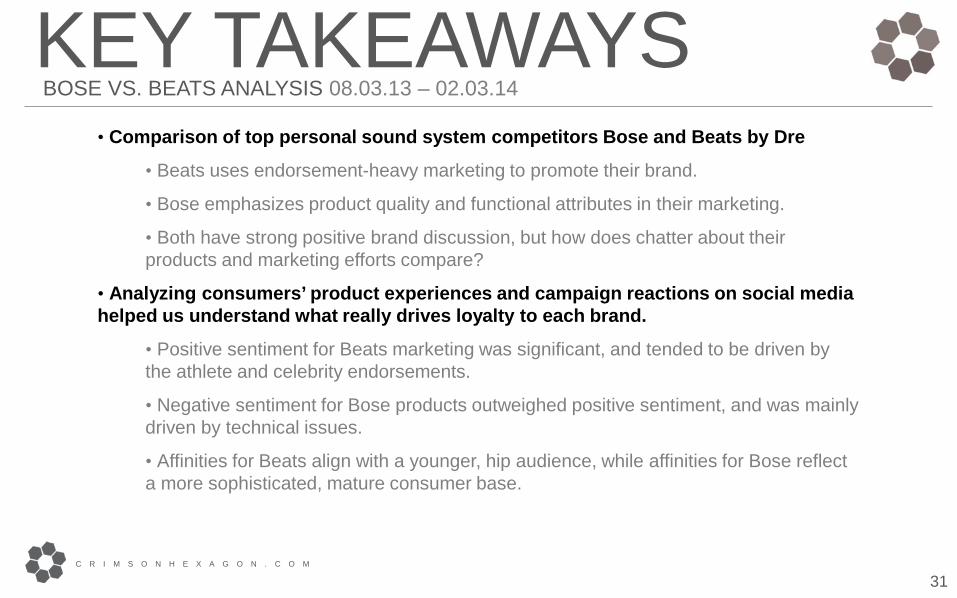
• Comparison of top personal sound system competitors Bose and Beats by Dre
• Beats uses endorsement-heavy marketing to promote their brand.
• Bose emphasizes product quality and functional attributes in their marketing.
• Both have strong positive brand discussion, but how does chatter about their products and marketing efforts compare?
• Analyzing consumers’ product experiences and campaign reactions on social media helped us understand what really drives loyalty to each brand.
• Positive sentiment for Beats marketing was significant, and tended to be driven by the athlete and celebrity endorsements.
• Negative sentiment for Bose products outweighed positive sentiment, and was mainly driven by technical issues.
• Affinities for Beats align with a younger, hip audience, while affinities for Bose reflect a more sophisticated, mature consumer base.
Appendix
C R I M S O N H E X A G O N . C O M
33 C R I M S O N H E X A G O N . C O M
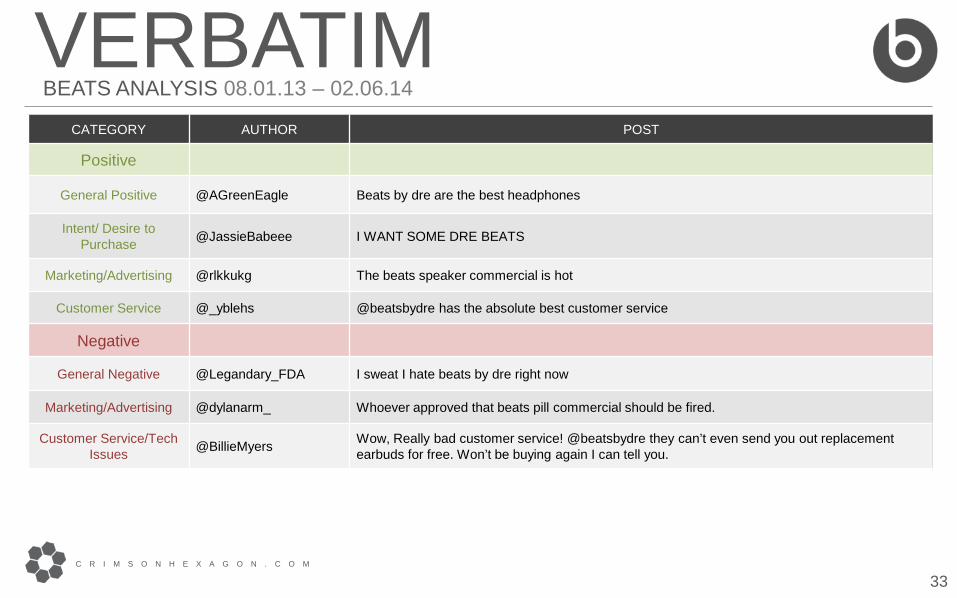
VERBATIM BEATS ANALYSIS 08.01.13 – 02.06.14
CATEGORY AUTHOR POST
Positive
General Positive @AGreenEagle Beats by dre are the best headphones
Intent/ Desire to Purchase @JassieBabeee I WANT SOME DRE BEATS
Marketing/Advertising @rlkkukg The beats speaker commercial is hot
Customer Service @_yblehs @beatsbydre has the absolute best customer service
Negative
General Negative @Legandary_FDA I sweat I hate beats by dre right now
Marketing/Advertising @dylanarm_ Whoever approved that beats pill commercial should be fired.
Customer Service/Tech Issues @BillieMyers Wow, Really bad customer service! @beatsbydre they can’t even send you out replacement
earbuds for free. Won’t be buying again I can tell you.
34 C R I M S O N H E X A G O N . C O M
VERBATIM BEATS ANALYSIS 08.01.13 – 02.06.14
CATEGORY AUTHOR POST
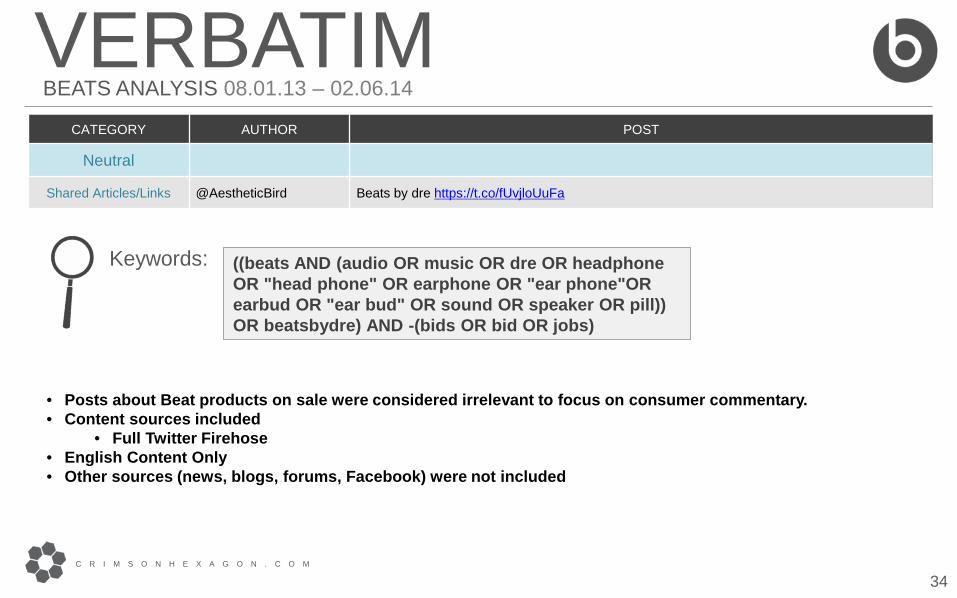
Neutral
Shared Articles/Links @AestheticBird Beats by dre https://t.co/fUvjloUuFa
Keywords: ((beats AND (audio OR music OR dre OR headphone OR "head phone" OR earphone OR "ear phone"OR earbud OR "ear bud" OR sound OR speaker OR pill)) OR beatsbydre) AND -(bids OR bid OR jobs)
• Posts about Beat products on sale were considered irrelevant to focus on consumer commentary. • Content sources included
• Full Twitter Firehose • English Content Only • Other sources (news, blogs, forums, Facebook) were not included
35 C R I M S O N H E X A G O N . C O M
VERBATIM BOSE ANALYSIS 08.01.13 – 02.06.14
CATEGORY AUTHOR POST
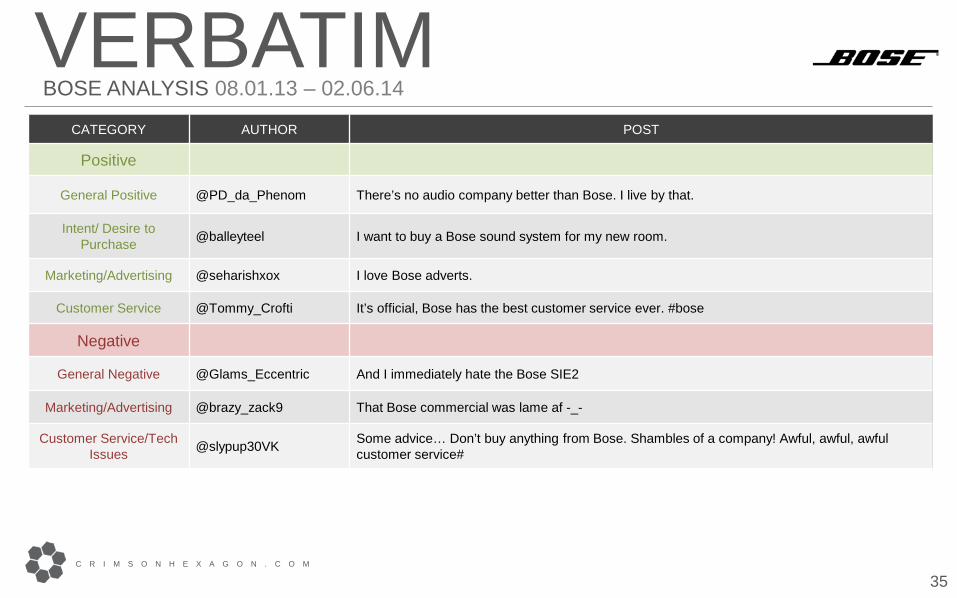
Positive
General Positive @PD_da_Phenom There’s no audio company better than Bose. I live by that.
Intent/ Desire to Purchase @balleyteel I want to buy a Bose sound system for my new room.
Marketing/Advertising @seharishxox I love Bose adverts.
Customer Service @Tommy_Crofti It’s official, Bose has the best customer service ever. #bose
Negative
General Negative @Glams_Eccentric And I immediately hate the Bose SIE2
Marketing/Advertising @brazy_zack9 That Bose commercial was lame af -_-
Customer Service/Tech Issues @slypup30VK Some advice… Don’t buy anything from Bose. Shambles of a company! Awful, awful, awful
customer service#
36 C R I M S O N H E X A G O N . C O M
VERBATIM BOSE ANALYSIS 08.01.13 – 02.06.14
CATEGORY AUTHOR POST
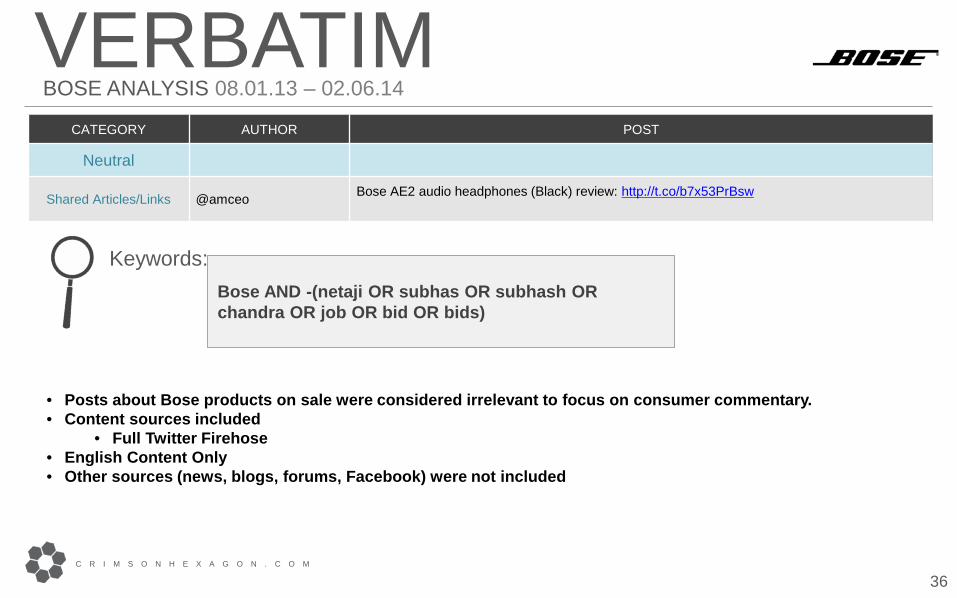
Neutral
Shared Articles/Links @amceo Bose AE2 audio headphones (Black) review: http://t.co/b7x53PrBsw
Keywords: Bose AND -(netaji OR subhas OR subhash OR chandra OR job OR bid OR bids)
• Posts about Bose products on sale were considered irrelevant to focus on consumer commentary. • Content sources included
• Full Twitter Firehose • English Content Only • Other sources (news, blogs, forums, Facebook) were not included
37
METHODOLOGY
C R I M S O N H E X A G O N . C O M
BEATS VS. BOSE ANALYSIS 08.01.13 – 02.06.14
WHERE DID THE DATA WITHIN THIS REPORT COME FROM? This report analyzes the size of and themes within the conversations around Beats and Bose audio products. The analysis was generated by Crimson Hexagon’s patented and proprietary analysis system. Crimson Hexagon was developed at Harvard University’s Center for Quantitative Social Science; its detailed methodology is publically available. WHAT SOCIAL MEDIA POSTS DO YOU ANALYZE? Crimson Hexagon actively collects content from across the social web; its proprietary content library holds almost 300 Billion posts. This index includes the Twitter Firehose — 100% of public Tweets—as well as a robust (though not complete) sample from Facebook, Sina Weibo, blogs, forums, comments, news sites, and more. The subset of the content analyzed for this report was determined by a set of keywords for each brand in each language. Details are listed in this presentation’s appendix. In addition, this report focuses on text-based content only; analytics for image-based social media will be provided at a later date by the marketing team. HOW WERE THE THEMES WITHIN THIS REPORT IDENTIFIED AND QUANTIFIED? Crimson Hexagon’s process begins with a human analyst, who identifies the most appropriate topics of conversation to quantify. The analyst then classifies a sample of Tweets that best represent those topics. After that, Crimson Hexagon’s algorithm determines what proportion of the conversation are part of the human-identified theme. WHO IS CRIMSON HEXAGON? Crimson Hexagon, founded in 2007, is the leading provider of analysis software that delivers business intelligence from social media data for global corporations. Fast Company named Crimson Hexagon one of the Top 10 Most Innovative Companies on the Web. Powered by patented technology developed at Harvard University’s Institute for Quantitative Social Science, the Crimson Hexagon ForSightTM platform delivers the industry’s most comprehensive Big Data analysis capabilities for a variety of large-scale data sources. Clients include leading global organizations such as: Microsoft, Paramount Pictures, Starbucks, Simon & Schuster, Twitter, The United Nations, and many more. For more information go to: http:// www.crimsonhexagon.com
38
Learn More
C R I M S O N H E X A G O N . C O M
About Crimson Hexagon’s BrightView™ Algorithm
Click Here for An Introduction To BrightView ™ Algorithm