Embed Size (px)
Citation preview

1Avalon Consulting Group, Inc.
All rights reserved, 2016 Cover Page
Avalon Consulting Group
www.avalonconsulting.net
Client Training DayDirect Marketing 101: Industry Outlook
September 7, 2017
©2017 Avalon Consulting Group.
All Rights Reserved.
2
State of the Industry
3
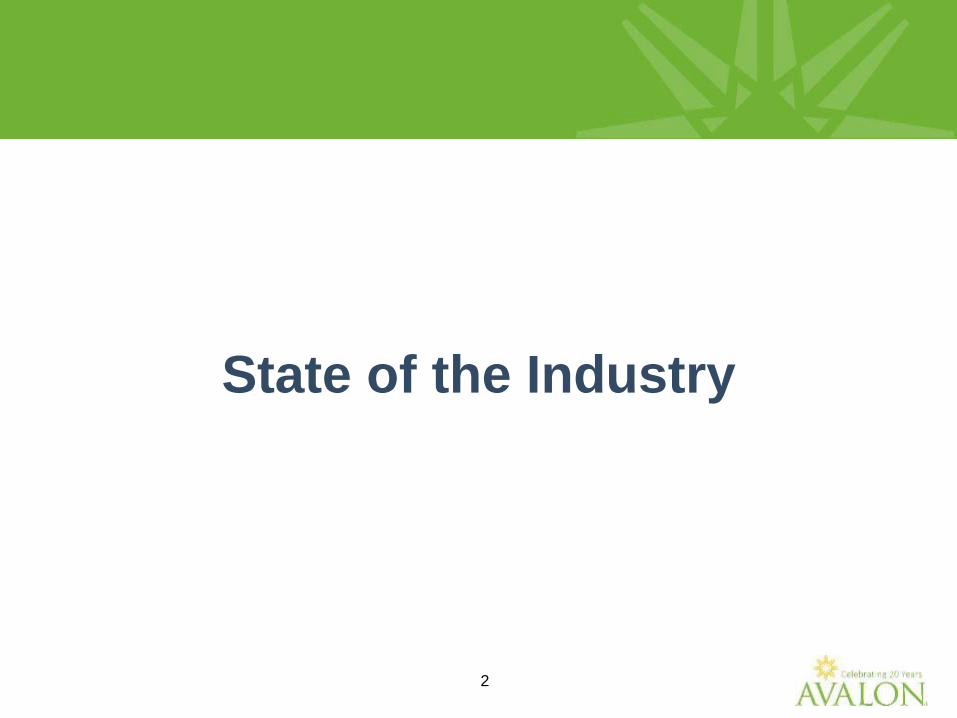
Industry Benchmarks
Using readily available benchmarking reports allows for
comparison to the industry and individual sectors.
Provides annual online
benchmarking tools.
Provides online and other
benchmarking information.
Provides industry-level
trends and insights.
Provides quarterly industry
updates and offers individual
organization benchmarking.
4
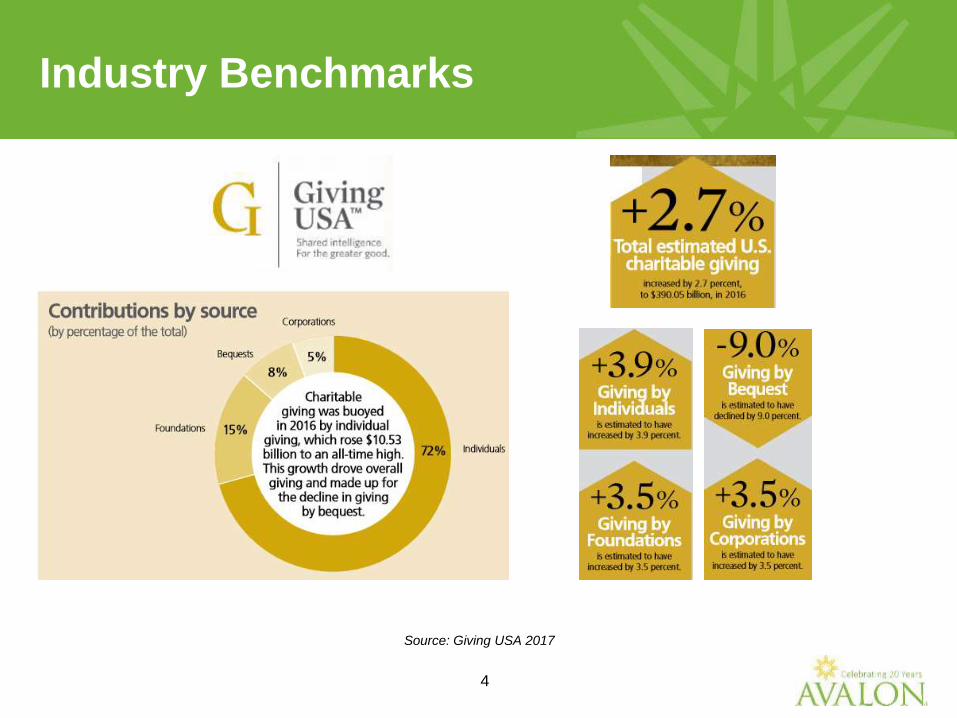
Source: Giving USA 2017
Industry Benchmarks
5
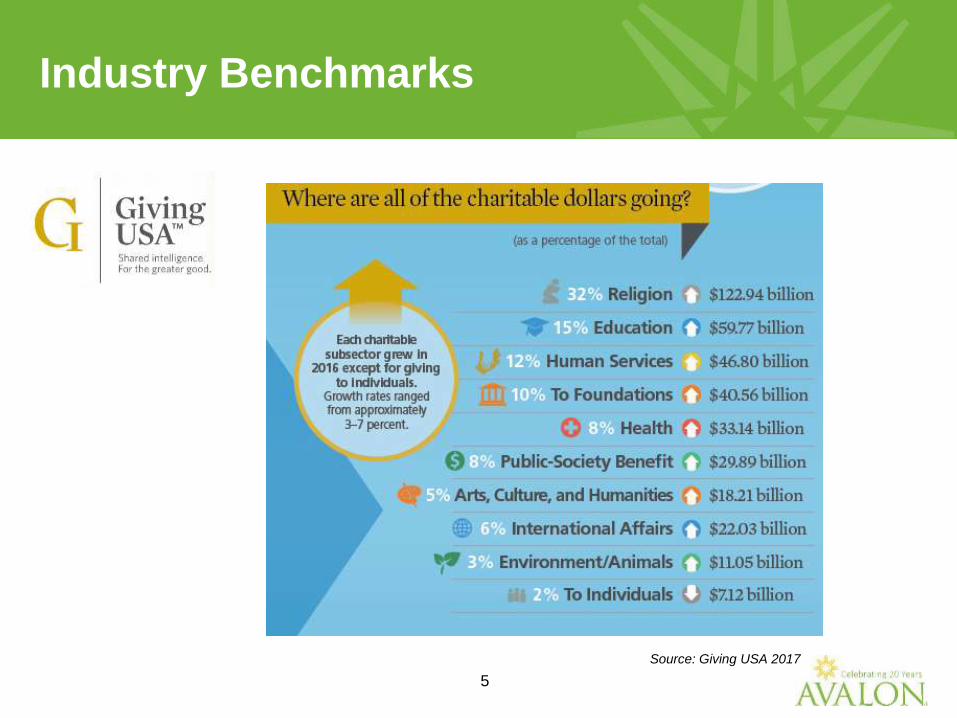
Industry Benchmarks
Source: Giving USA 2017
6
Overall Giving Trends
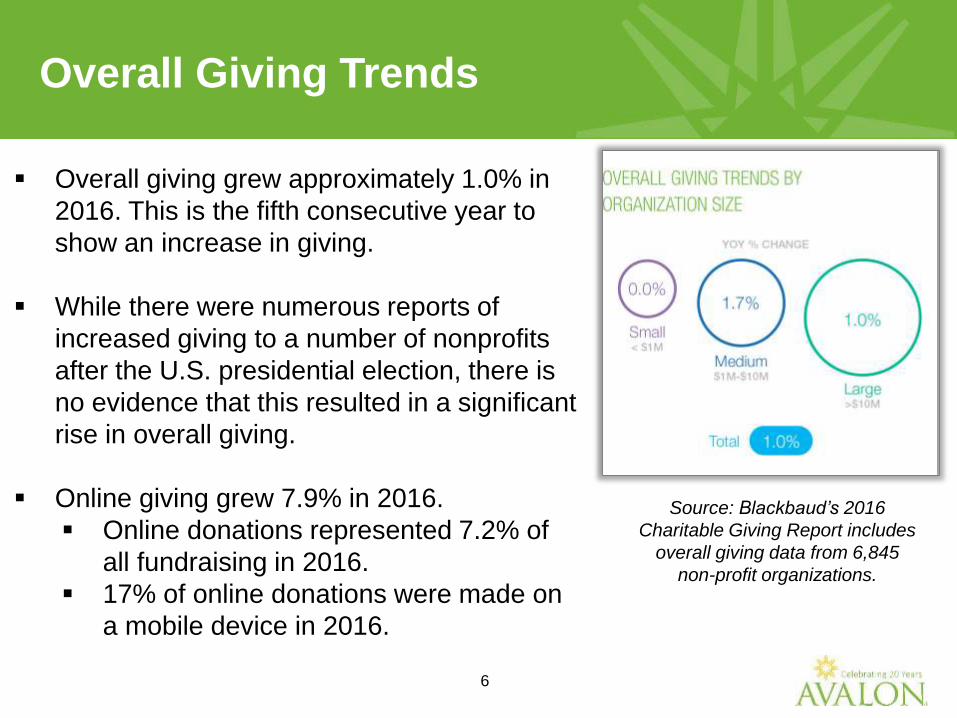
Overall giving grew approximately 1.0% in
2016. This is the fifth consecutive year to
show an increase in giving.
While there were numerous reports of
increased giving to a number of nonprofits
after the U.S. presidential election, there is
no evidence that this resulted in a significant
rise in overall giving.
Online giving grew 7.9% in 2016.
Online donations represented 7.2% of
all fundraising in 2016.
17% of online donations were made on
a mobile device in 2016.
Source: Blackbaud’s 2016
Charitable Giving Report includes
overall giving data from 6,845
non-profit organizations.
7
Overall Giving Trends - Giving by Generation
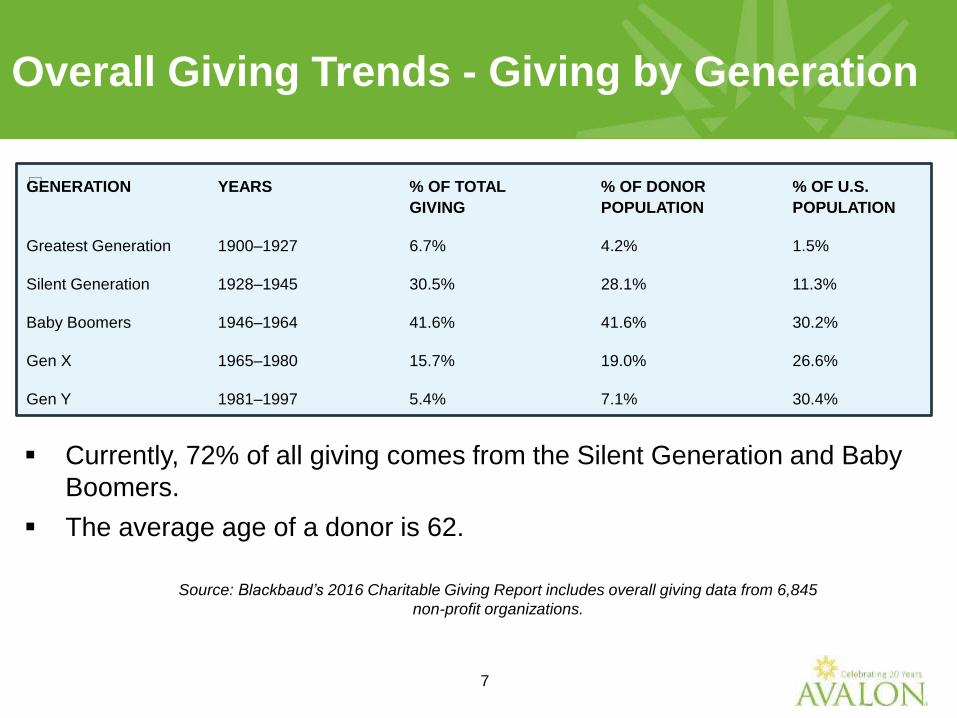
GENERATION YEARS % OF TOTAL % OF DONOR % OF U.S.
GIVING POPULATION POPULATION
Greatest Generation 1900–1927 6.7% 4.2% 1.5%
Silent Generation 1928–1945 30.5% 28.1% 11.3%
Baby Boomers 1946–1964 41.6% 41.6% 30.2%
Gen X 1965–1980 15.7% 19.0% 26.6%
Gen Y 1981–1997 5.4% 7.1% 30.4%
Currently, 72% of all giving comes from the Silent Generation and Baby
Boomers.
The average age of a donor is 62.
Source: Blackbaud’s 2016 Charitable Giving Report includes overall giving data from 6,845
non-profit organizations.
8
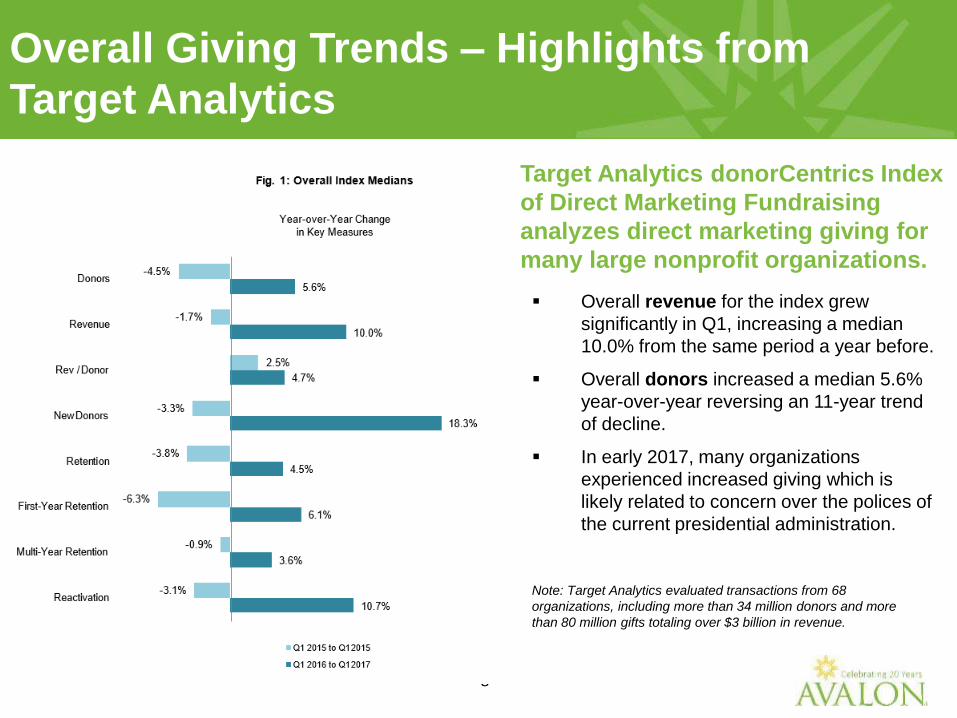
Overall Giving Trends – Highlights from
Target Analytics
Target Analytics donorCentrics Index
of Direct Marketing Fundraising
analyzes direct marketing giving for
many large nonprofit organizations.
Overall revenue for the index grew
significantly in Q1, increasing a median
10.0% from the same period a year before.
Overall donors increased a median 5.6%
year-over-year reversing an 11-year trend
of decline.
In early 2017, many organizations
experienced increased giving which is
likely related to concern over the polices of
the current presidential administration.
Note: Target Analytics evaluated transactions from 68
organizations, including more than 34 million donors and more
than 80 million gifts totaling over $3 billion in revenue.
9
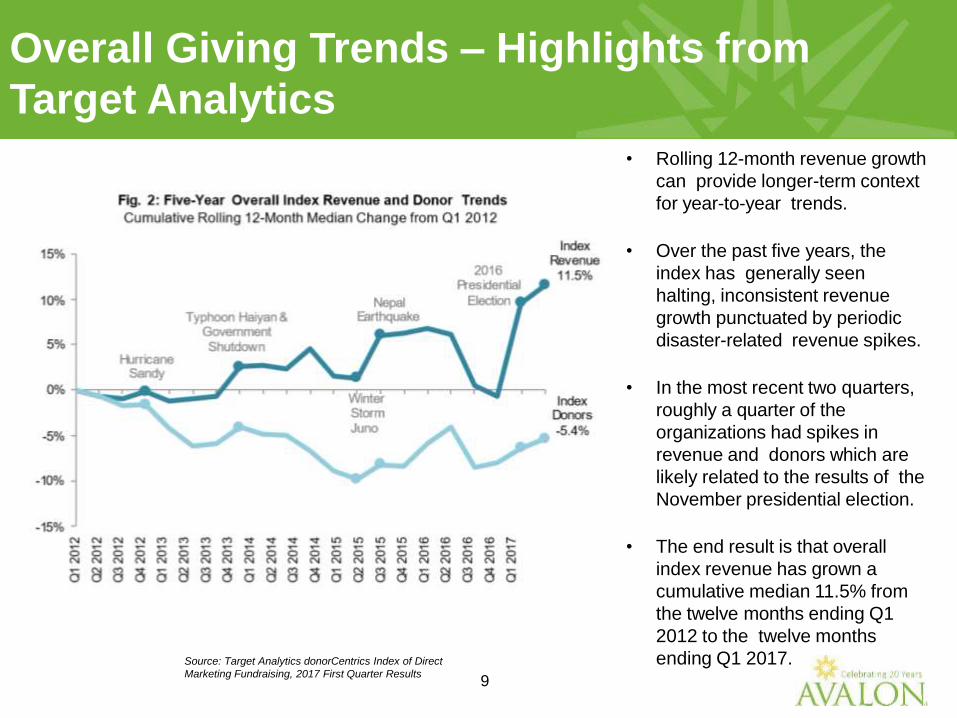
Source: Target Analytics donorCentrics Index of Direct
Marketing Fundraising, 2017 First Quarter Results
• Rolling 12-month revenue growth
can provide longer-term context
for year-to-year trends.
• Over the past five years, the
index has generally seen
halting, inconsistent revenue
growth punctuated by periodic
disaster-related revenue spikes.
• In the most recent two quarters,
roughly a quarter of the
organizations had spikes in
revenue and donors which are
likely related to the results of the
November presidential election.
• The end result is that overall
index revenue has grown a
cumulative median 11.5% from
the twelve months ending Q1
2012 to the twelve months
ending Q1 2017.
Overall Giving Trends – Highlights from
Target Analytics
10
Nonprofit website traffic grew by 4%.
Nonprofit email lists grew by 10%.
Nonprofits sent 10% more messages/subscriber.
On average, subscribers received 69 separate email messages
from a single nonprofit.
Nonprofit social media audiences also increased.
Facebook: 23%+
Twitter: 50%+
Instagram: 101%+
Nonprofits digital ad spending increased by 69%.
Overall Giving Trends – 2016 Online Trends:
More, more , more!
Source: 2017 M+R Benchmarks Study
11
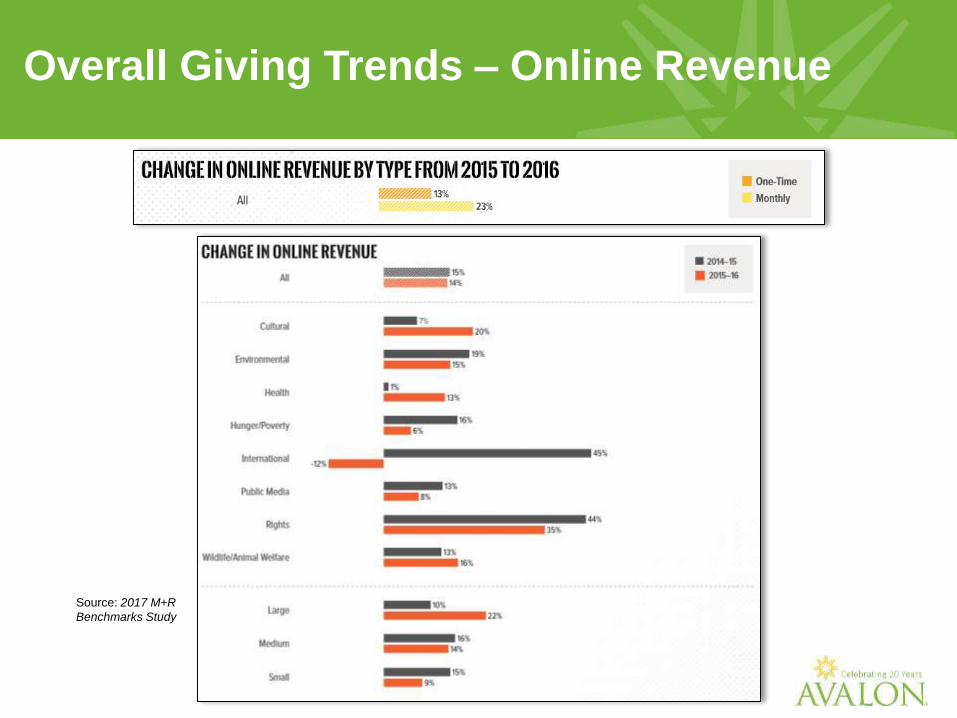
Overall Giving Trends – Online Revenue
Source: 2017 M+R
Benchmarks Study
12
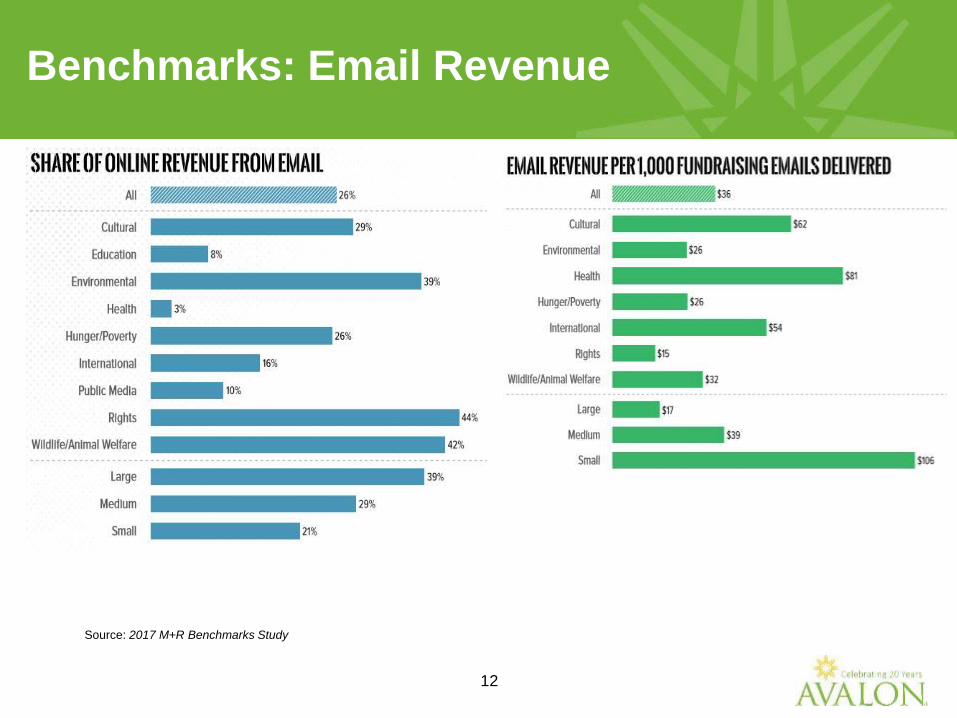
Benchmarks: Email Revenue
Source: 2017 M+R Benchmarks Study
13
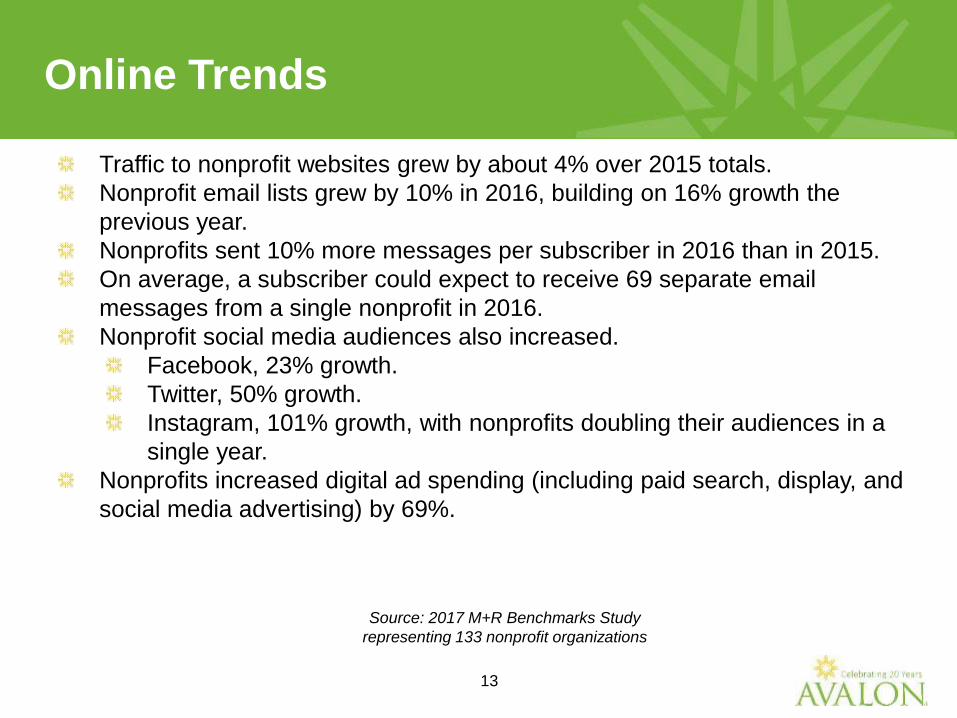
Traffic to nonprofit websites grew by about 4% over 2015 totals.
Nonprofit email lists grew by 10% in 2016, building on 16% growth the
previous year.
Nonprofits sent 10% more messages per subscriber in 2016 than in 2015.
On average, a subscriber could expect to receive 69 separate email
messages from a single nonprofit in 2016.
Nonprofit social media audiences also increased.
Facebook, 23% growth.
Twitter, 50% growth.
Instagram, 101% growth, with nonprofits doubling their audiences in a
single year.
Nonprofits increased digital ad spending (including paid search, display, and
social media advertising) by 69%.
Online Trends
Source: 2017 M+R Benchmarks Study
representing 133 nonprofit organizations
14
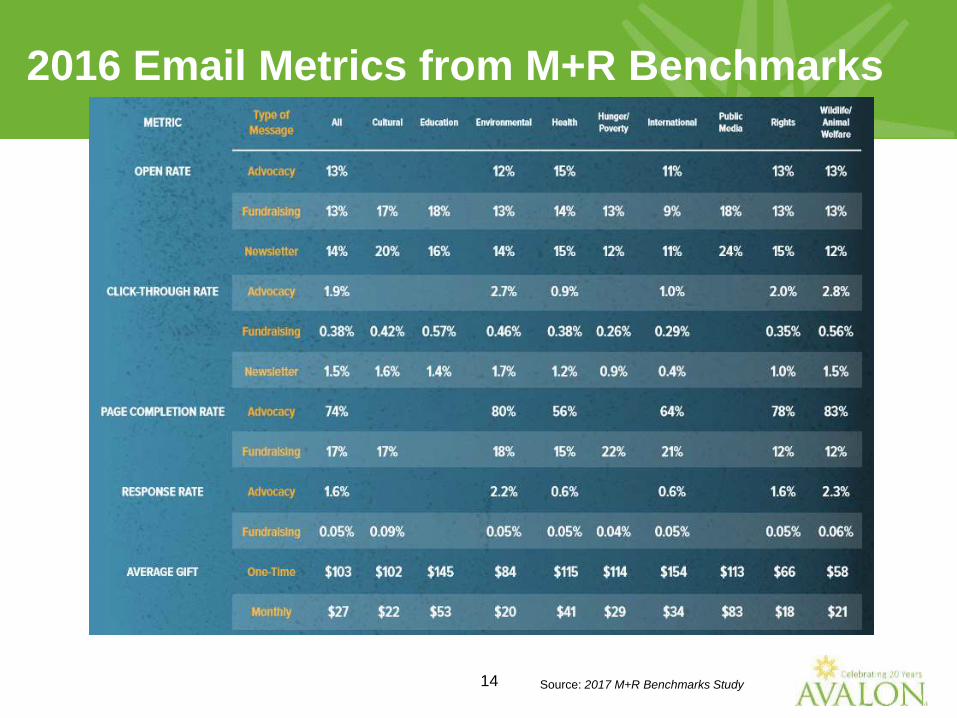
2016 Email Metrics from M+R Benchmarks
Source: 2017 M+R Benchmarks Study
15
Avalon Analytics®
Observations and Trends
16
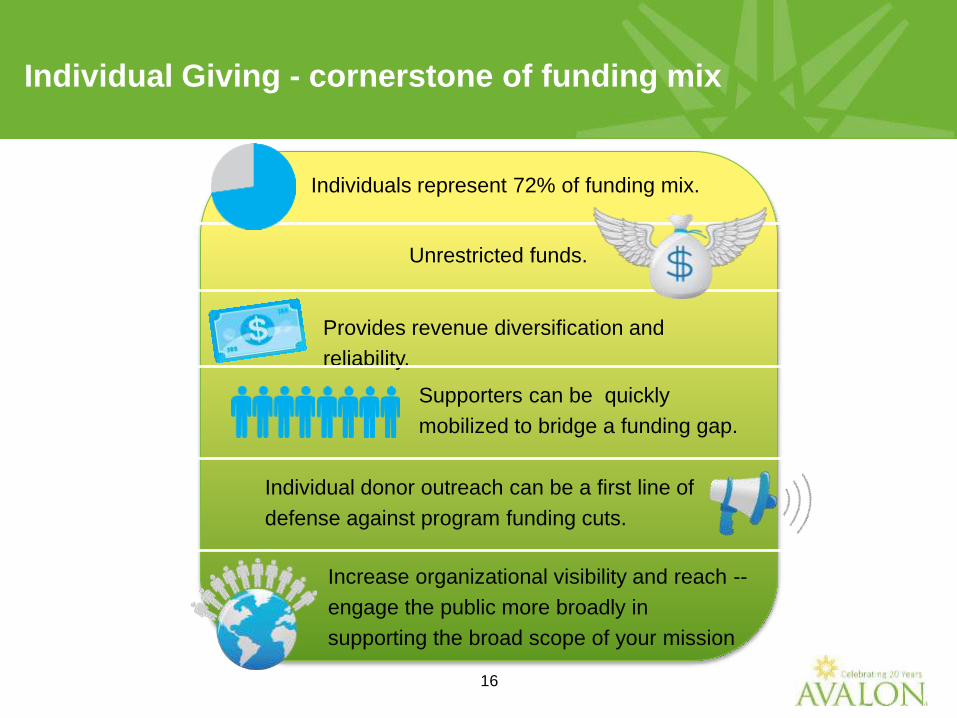
Individual Giving - cornerstone of funding mix
Individuals represent 72% of funding mix.
Provides revenue diversification and
reliability.
Unrestricted funds.
Supporters can be quickly
mobilized to bridge a funding gap.
Individual donor outreach can be a first line of
defense against program funding cuts.
Increase organizational visibility and reach --
engage the public more broadly in
supporting the broad scope of your mission
17
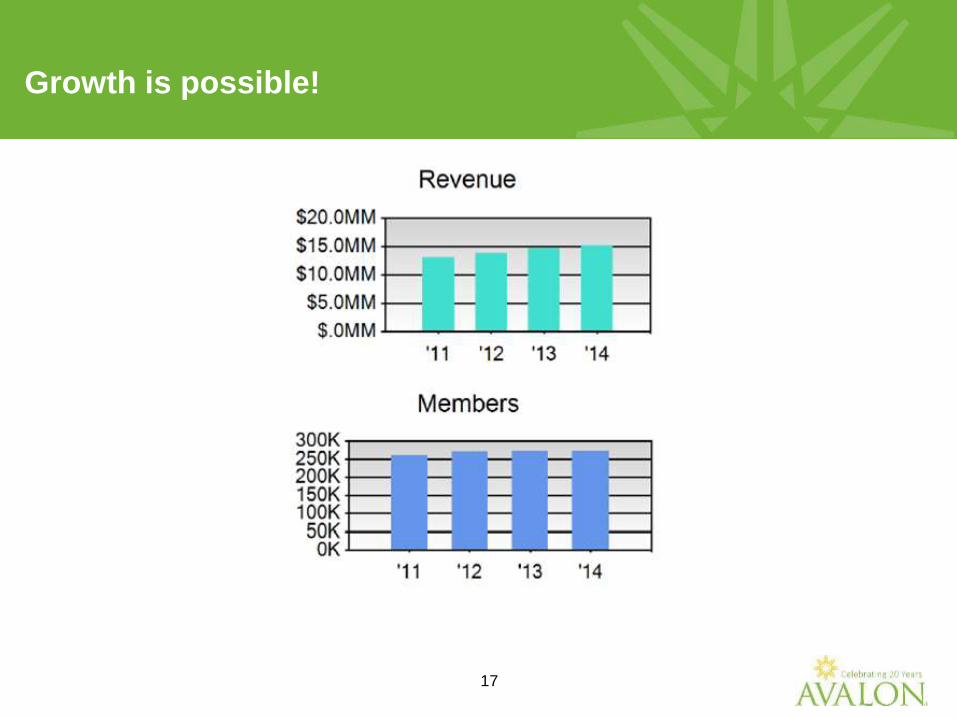
Growth is possible!
18
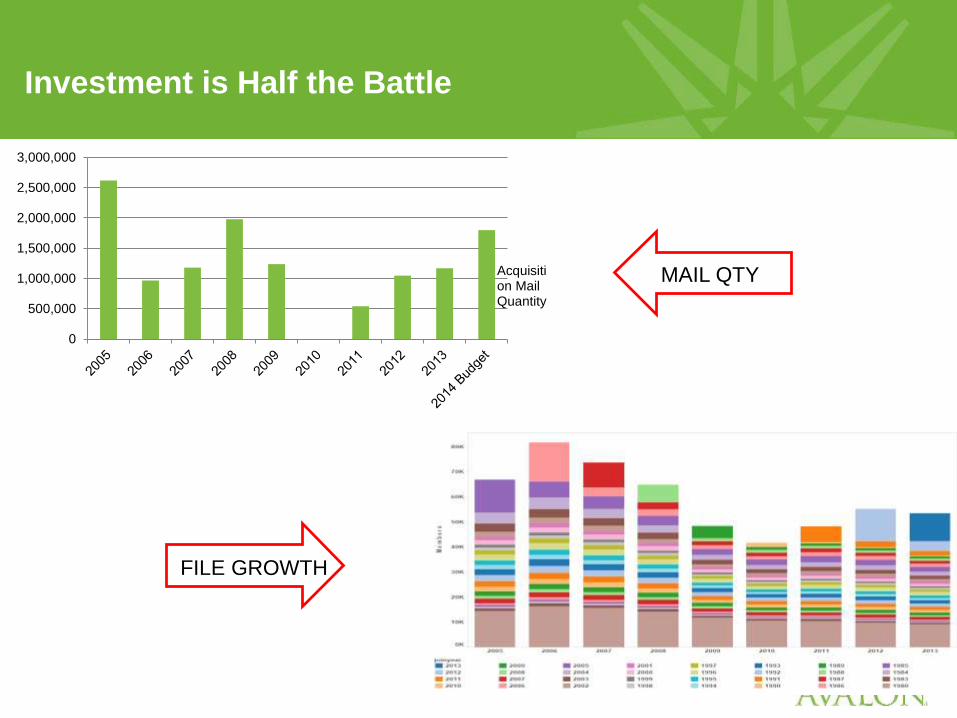
Investment is Half the Battle
0
500,000
1,000,000
1,500,000
2,000,000
2,500,000
3,000,000
Acquisition MailQuantity
MAIL QTY
FILE GROWTH
19
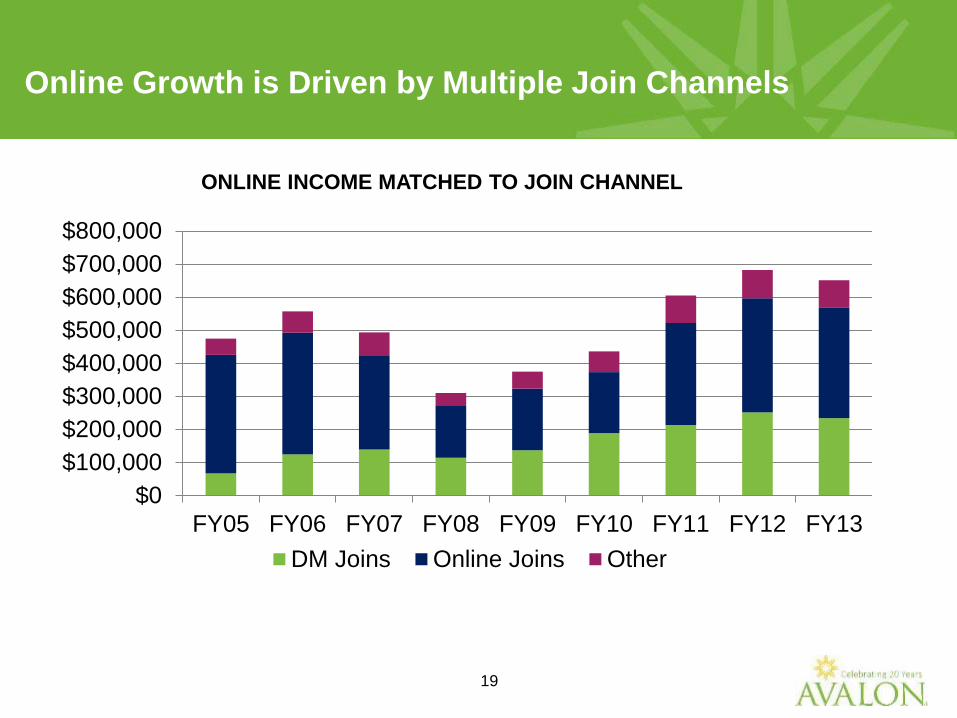
Online Growth is Driven by Multiple Join Channels
$0
$100,000
$200,000
$300,000
$400,000
$500,000
$600,000
$700,000
$800,000
FY05 FY06 FY07 FY08 FY09 FY10 FY11 FY12 FY13
DM Joins Online Joins Other
ONLINE INCOME MATCHED TO JOIN CHANNEL
20
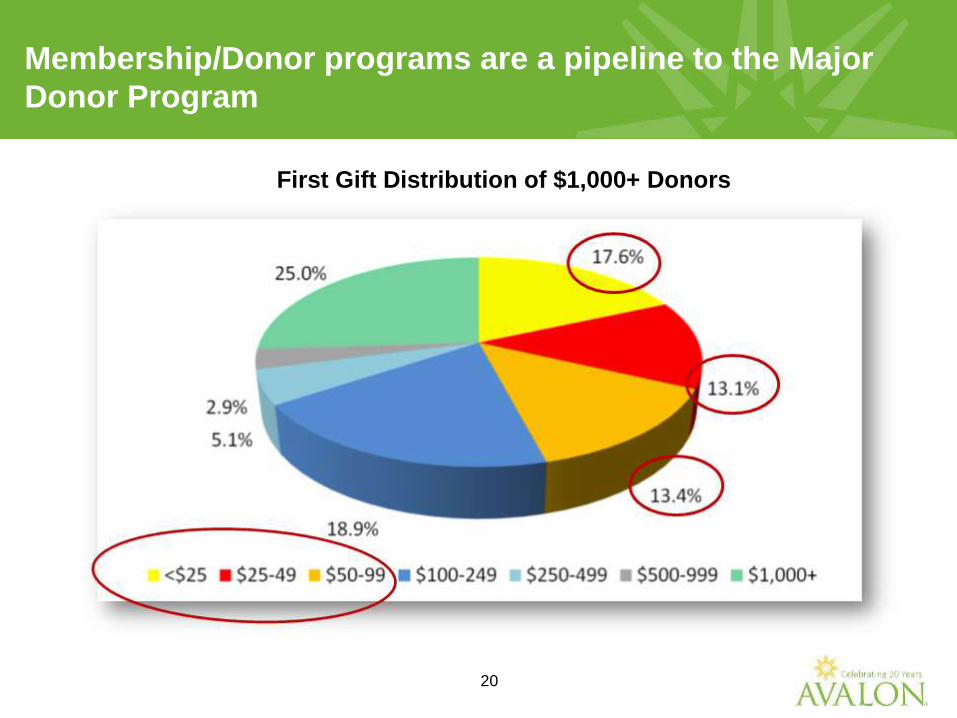
Membership/Donor programs are a pipeline to the Major
Donor Program
First Gift Distribution of $1,000+ Donors
21
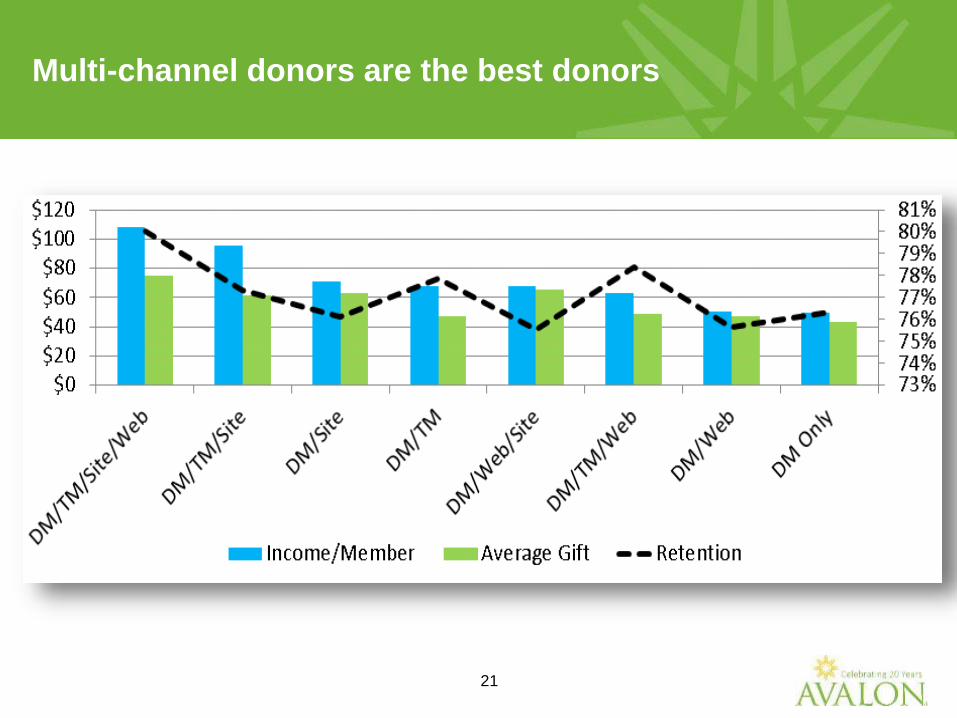
Multi-channel donors are the best donors
22
Thank you!Allison Porter
President
Avalon Consulting Group
805 15th Street NW, Suite 700
Washington, DC 20005
202-627-6502
Connect with Avalon Today!


![No Model VIN 1 (DM) SANTAFE [DM] KMHSU81BSCU000212 2 … Engine YF and D… · 37 (dm) santafe [dm] kmhst81bsdu023920 38 (dm) santafe [dm] kmhst81bsdu023926 39 (dm) santafe [dm] kmhst81bsdu023930](https://img.pdfslide.us/doc/110x75/6017564e29e54a6dde7ebe6b/no-model-vin-1-dm-santafe-dm-kmhsu81bscu000212-2-engine-yf-and-d-37-dm-santafe.jpg)