Embed Size (px)
Citation preview
June. 2012
Copyright © W&S Company Limited - 2012
SURVEY ON VIETNAMESE LIFE
ASPECTS
(Vietnam – June 2012)

Copyright © W&S Company Limited - 2012
Survey details
Survey on Vietnamese life aspects
Timing : 3rd – 10th May 2012
Sample size : 730
Gender : Male & Female
Age : Above 16 years old
Venue : All cities and provinces
Copyright © W&S Company Limited - 2012
Base on 4 main aspects „2012 vs.2011 life‟, „Work‟, „Spirit‟ and „CSR & Environment‟, this report
provides a comprehensive overview of Vietnamese lifestyle as well as their future worries.
Survey is conducted by W&S Online Market Research (100% Japanese investment) on Vinaresearch‟s
panellists.

Copyright © W&S Company Limited - 2012 Copyright © W&S Company Limited - 2012
Executive Summary (1)
1. Life in 2012 vs. 2011:
The life in 2012 is rather improved compared to 2011.
However, they are still not satisfied with their current lives in particular about current income and
property/ savings.
Compared to last year (2011), expenditure has been increasing which led to more difficult life.
2. Work
A job with high income, stability and preference is the most ideal for surveyed people.
The purpose of working are mainly for earning money and living independently. Hence, they prefer
to increase income more than spend their time for relaxing.
Health and personal income are two aspects which both male and female want to improve in their
current life.
Copyright © W&S Company Limited - 2012 Copyright © W&S Company Limited - 2012
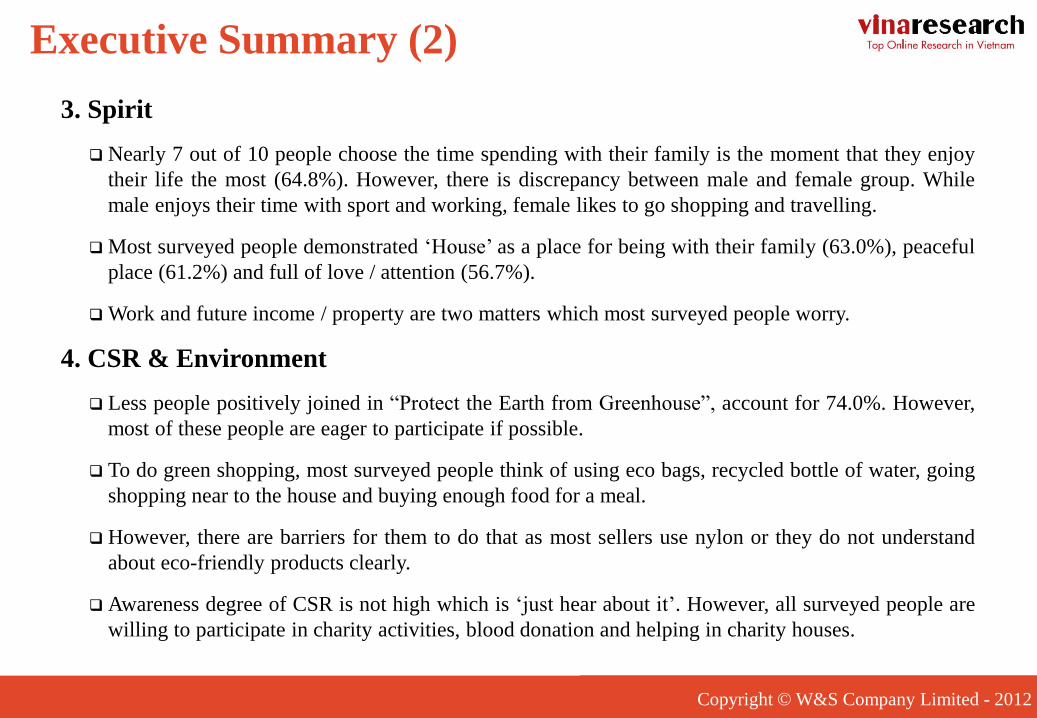
Executive Summary (2)
3. Spirit
Nearly 7 out of 10 people choose the time spending with their family is the moment that they enjoy
their life the most (64.8%). However, there is discrepancy between male and female group. While
male enjoys their time with sport and working, female likes to go shopping and travelling.
Most surveyed people demonstrated „House‟ as a place for being with their family (63.0%), peaceful
place (61.2%) and full of love / attention (56.7%).
Work and future income / property are two matters which most surveyed people worry.
4. CSR & Environment
Less people positively joined in “Protect the Earth from Greenhouse”, account for 74.0%. However,
most of these people are eager to participate if possible.
To do green shopping, most surveyed people think of using eco bags, recycled bottle of water, going
shopping near to the house and buying enough food for a meal.
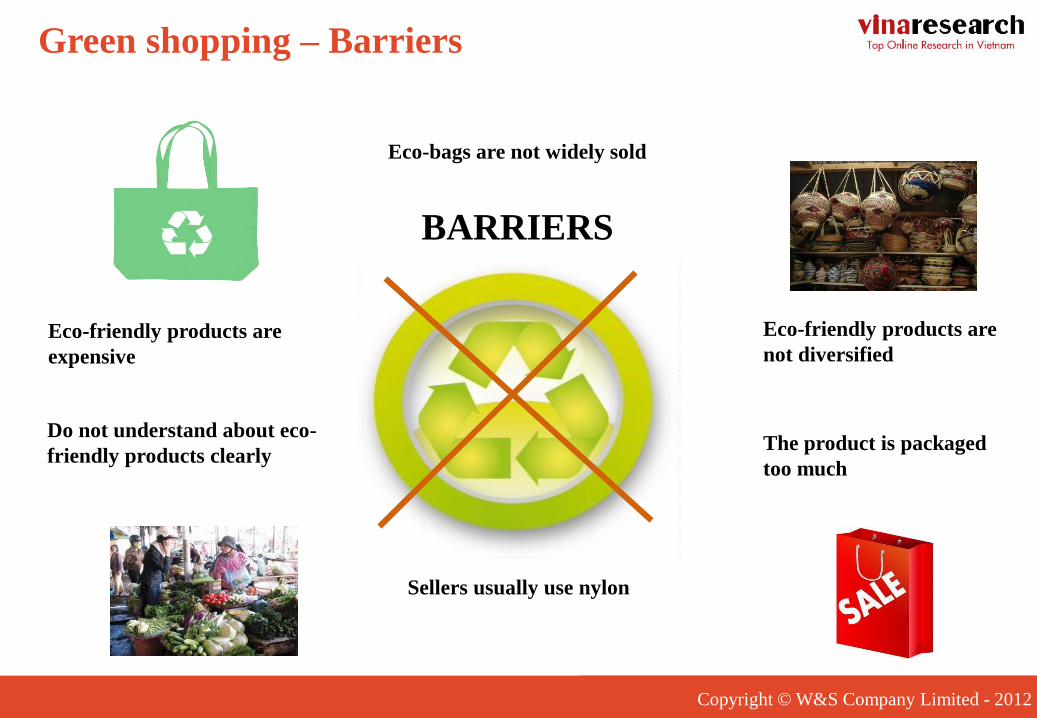
However, there are barriers for them to do that as most sellers use nylon or they do not understand
about eco-friendly products clearly.
Awareness degree of CSR is not high which is „just hear about it‟. However, all surveyed people are
willing to participate in charity activities, blood donation and helping in charity houses.
Copyright © W&S Company Limited - 2012 Copyright © W&S Company Limited - 2012
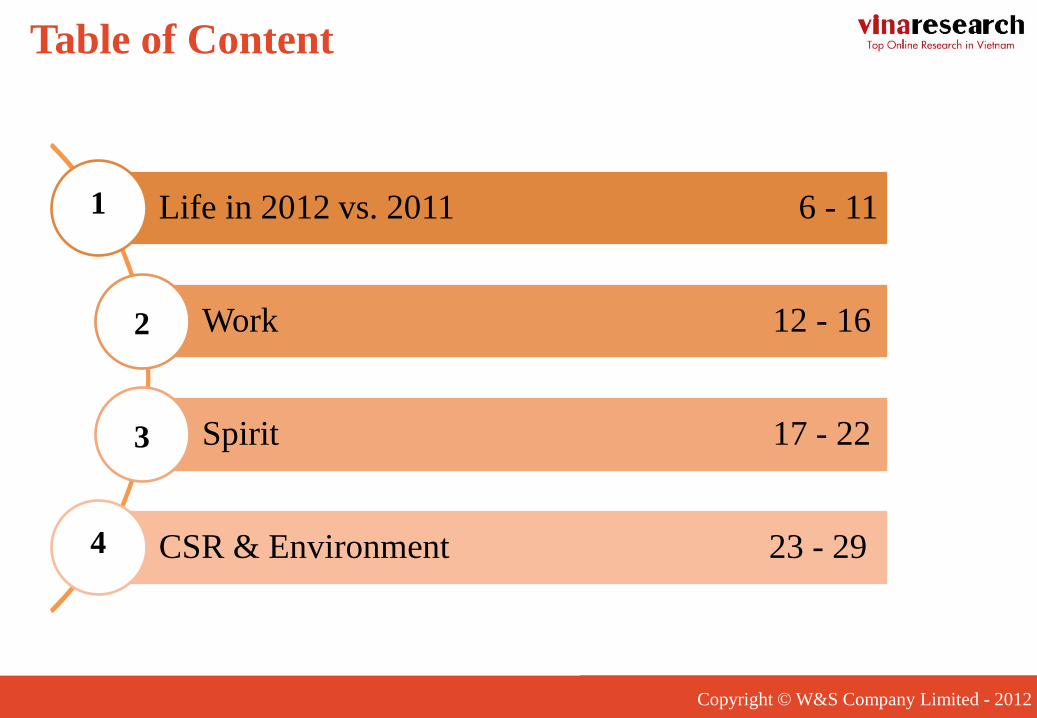
Life in 2012 vs. 2011 6 - 11
Work 12 - 16
Spirit 17 - 22
CSR & Environment 23 - 29
1
2
3
4
Table of Content
Copyright © W&S Company Limited - 2012
Part 1 - Life 2012 vs.2011
Copyright © W&S Company Limited - 2012
Copyright © W&S Company Limited - 2012 Copyright © W&S Company Limited - 2012
2.1%
6.0%
13.8%
20.3%
41.9%
15.9%
0.0% 25.0% 50.0%
Don't know clearly
Significantly decline
Rather decline
Nothing change
Rather improve
Significantly improve
N = 730
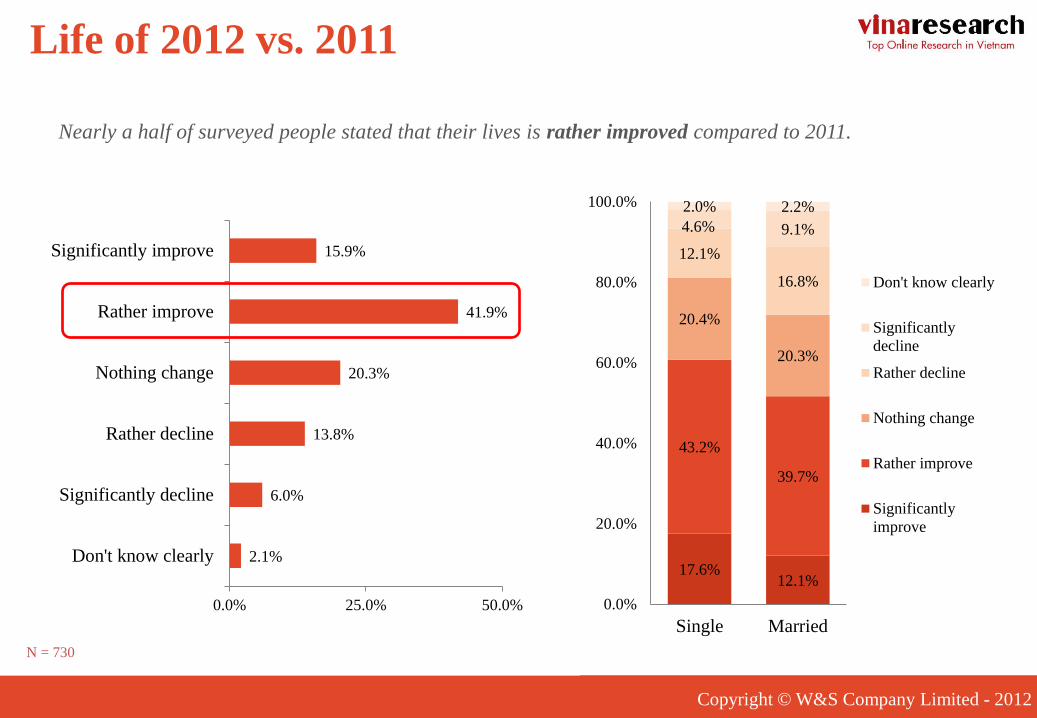
Nearly a half of surveyed people stated that their lives is rather improved compared to 2011.
Life of 2012 vs. 2011
17.6% 12.1%
43.2%
39.7%
20.4%
20.3%
12.1%
16.8%
4.6% 9.1%
2.0% 2.2%
0.0%
20.0%
40.0%
60.0%
80.0%
100.0%
Single Married
Don't know clearly
Significantly
decline
Rather decline
Nothing change
Rather improve
Significantly
improve
Copyright © W&S Company Limited - 2012
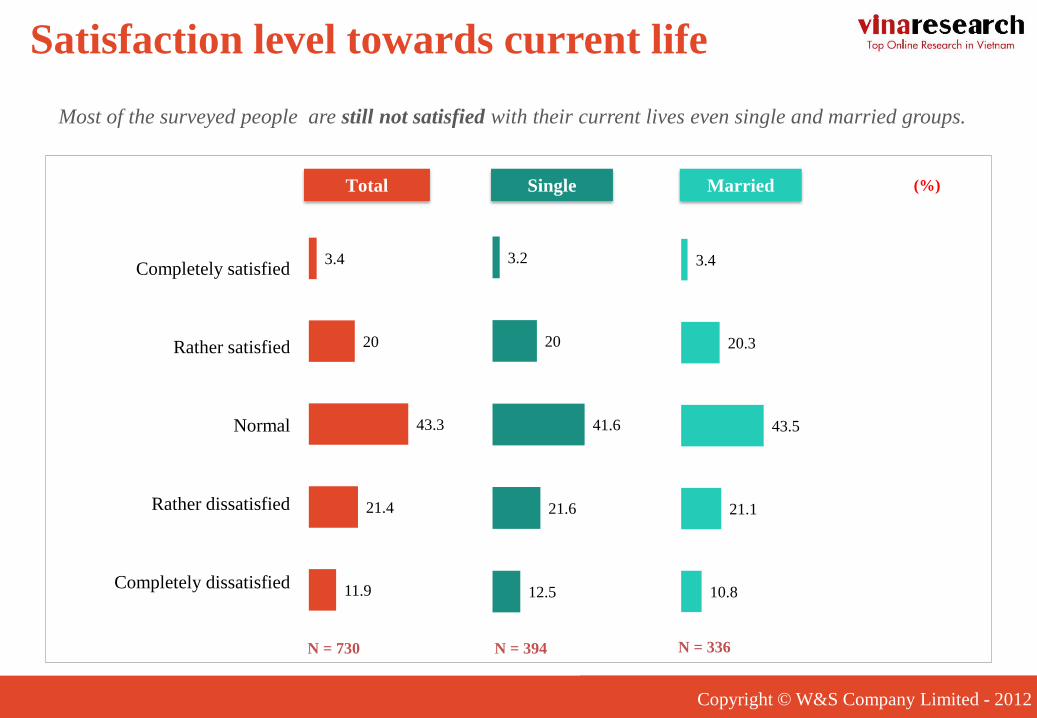
Total Married (%)
Completely satisfied
Rather satisfied
Normal
Rather dissatisfied
Completely dissatisfied
N = 730 N = 394 N = 336
3.4
20
43.3
21.4
11.9
3.2
20
41.6
21.6
12.5
3.4
20.3
43.5
21.1
10.8
Single
Satisfaction level towards current life
Most of the surveyed people are still not satisfied with their current lives even single and married groups.

Copyright © W&S Company Limited - 2012
0.0% 20.0% 40.0% 60.0% 80.0% 100.0%
Current health status
Current living place
Personal capacity
Current job
Household property such as motorbike, car,
household appliances, etc.
Property / Savings
Current income
6.6%
8.5%
8.8%
12.7%
17.9%
25.3%
25.5%
14.1%
15.3%
18.6%
20.4%
18.2%
28.2%
29.6%
43.4%
39.4%
41.7%
43.6%
44.1%
36.4%
34.1%
25.8%
23.6%
23.2%
17.8%
15.6%
7.8%
8.9%
10.1%
13.2%
7.7%
5.5%
4.2%
2.3%
1.9%
Completely dissatisfied Rather dissatisfied Normal Rather satisfied Completely satisfied
Copyright © W&S Company Limited - 2012
Satisfied vs. Dissatisfied
Most surveyed people do not feel satisfied about Current income and property / savings.
However, they feel satisfied with their health, personal capacity and current living place.
Copyright © W&S Company Limited - 2012
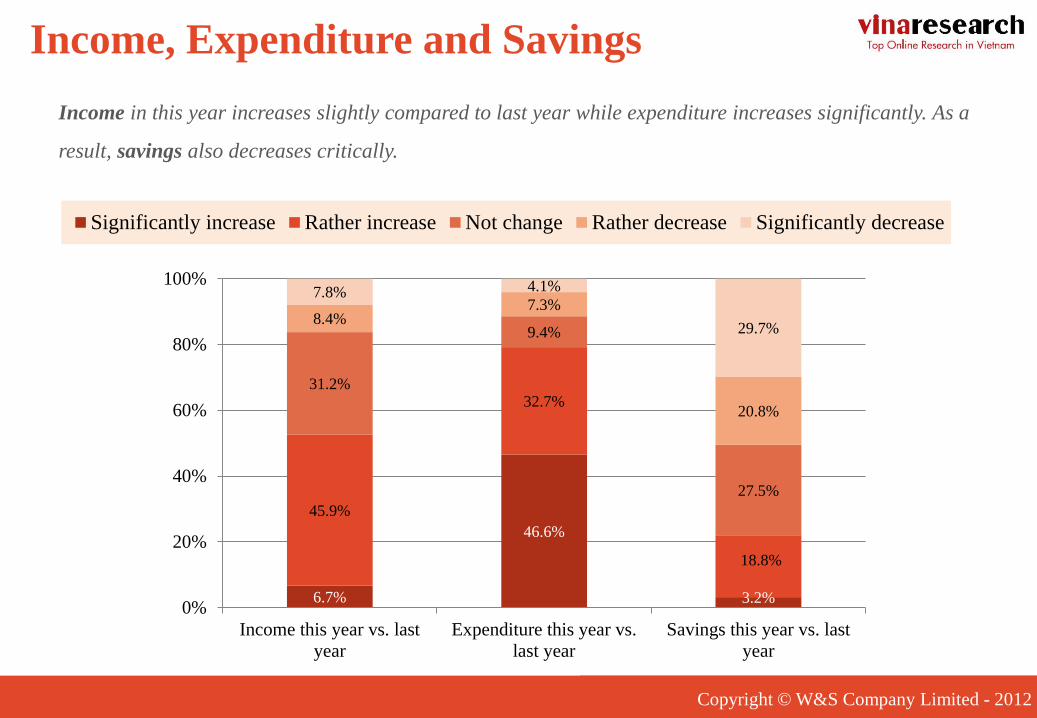
6.7%
46.6%
3.2%
45.9%
32.7%
18.8%
31.2%
9.4%
27.5%
8.4% 7.3%
20.8%
7.8% 4.1%
29.7%
0%
20%
40%
60%
80%
100%
Income this year vs. last
year
Expenditure this year vs.
last year
Savings this year vs. last
year
Significantly increase Rather increase Not change Rather decrease Significantly decrease
Income in this year increases slightly compared to last year while expenditure increases significantly. As a
result, savings also decreases critically.
Income, Expenditure and Savings
Copyright © W&S Company Limited - 2012
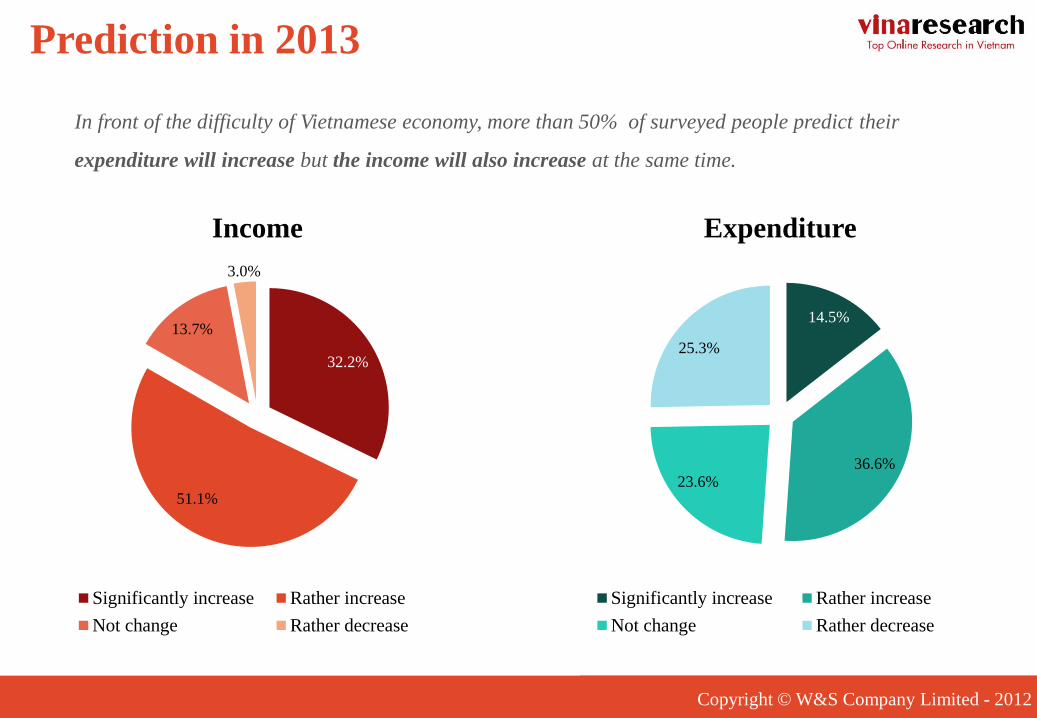
32.2%
51.1%
13.7%
3.0%
Income
Significantly increase Rather increase
Not change Rather decrease
14.5%
36.6% 23.6%
25.3%
Expenditure
Significantly increase Rather increase
Not change Rather decrease
In front of the difficulty of Vietnamese economy, more than 50% of surveyed people predict their
expenditure will increase but the income will also increase at the same time.
Prediction in 2013
Copyright © W&S Company Limited - 2012
Part 2 – Work
Copyright © W&S Company Limited - 2012

Copyright © W&S Company Limited - 2012
0.0% 25.0% 50.0% 75.0%
Admired by other people
Entertain other people
Useful for society
Flexible working time
Not harmful to my health
Independent and comfortable
Easy to achieve high promotion
Stable income
Suitable for my speciality
Stable job
My favorite job
High income
19.2%
31.5%
35.9%
39.0%
39.5%
42.3%
43.4%
48.4%
53.3%
54.2%
58.2%
65.8%
Ideal Job
High – income, favorite and stable job is mostly voted when mentioning an ideal job.

Copyright © W&S Company Limited - 2012
Purpose of working
0.0% 5.0% 10.0% 15.0% 20.0% 25.0% 30.0%
Don't know
No specific purpose
Other purposes
To have more free time
To take care of my parents
To challenge my capacity
To experience the life
To find out the purpose of life
To take care of children
Life is to work
To have wide relationship
Enhance my capacity
To live independently
To earn money
22.1%
22.7%
18.4%
16.4%
17.4%
17.7%
18.1%
18.6%
19.0%
19.0%
19.7%
19.9%
22.6%
27.0%
People work for various reasons but the top 2 main reasons are for money earning and living independently.

Copyright © W&S Company Limited - 2012
73.7%
20.8%
5.4% Increase income
Increase free time
for relaxing
Do not want
anything
Most surveyed people choose increase
income as a prior factor. However, they also
want to use their time for relaxing.
To balance between working and relaxing
time, they usually make a detail plan for
working as well as their relaxing time.
Income vs. Time
3.7%
15.9%
36.1%
32.1%
12.2% Never
Sometimes
Normal
Usually
Always

Copyright © W&S Company Limited - 2012
Total 100%
Eating & drinking 16.50%
Emotional life 57.30%
Develop my capacity 46.70%
Work 55.10%
Children 46.70%
Housing 48.90%
Transportation 33%
Health 59.20%
Personal property 40.80%
Household property 32.70%
Fashion 19.90%
Personal income 61.10%
Entertainment 24.60%
Others 3.40%
Total 100%
Eating & drinking 19.80%
Emotional life 49.10%
Develop my capacity 57.70%
Work 56.20%
Children 39.60%
Housing 53.30%
Transportation 37.90%
Health 59.70%
Personal property 42.50%
Household property 32.80%
Fashion 10.30%
Personal income 63.30%
Entertainment 21.30%
Others 5.60%
Male Female
Life aspects to invest
Both male and female want to invest in personal income and health in their life more than other aspects.

Copyright © W&S Company Limited - 2012
Part 3 – Spirit
Copyright © W&S Company Limited - 2012

Copyright © W&S Company Limited - 2012
13.8%
24.1%
24.2%
24.8%
27.4%
27.8%
29.9%
29.9%
34.1%
34.8%
35.5%
36.2%
43.0%
51.5%
51.9%
57.3%
64.8%
0.0% 25.0% 50.0% 75.0%
Playing game
Join in events and festivals
Browse websites
Watch movies
Study
Play sports
Enjoy meals
Sleep
Go shopping
Listen to music
Be attracted by work
Join in social activities
Be with boyfriend/girlfriend
Relax
Travel
Go out with friends / relatives
Be with family
„Be with
family‟ 64.8%
Enjoying life
64.8% choose the time spending with their family is the moment that they enjoy their life the most.
Copyright © W&S Company Limited - 2012
10.0%
11.8%
19.3%
24.6%
25.2%
25.5%
32.7%
32.7%
33.0%
34.0%
36.1%
40.8%
46.4%
54.2%
56.7%
60.7%
67.9%
16.9%
40.3%
28.1%
23.7%
29.1%
24.2%
27.6%
36.4%
37.4%
26.7%
36.2%
44.7%
24.4%
49.4%
48.2%
54.5%
62.3%
-100.0% -50.0% 0.0% 50.0% 100.0%
Male (n=409) Female (n=321)
Female
Go
shopping
Relax
Travel
Enjoy
meals
Male
Sport
Browse
web
Work
Play
game
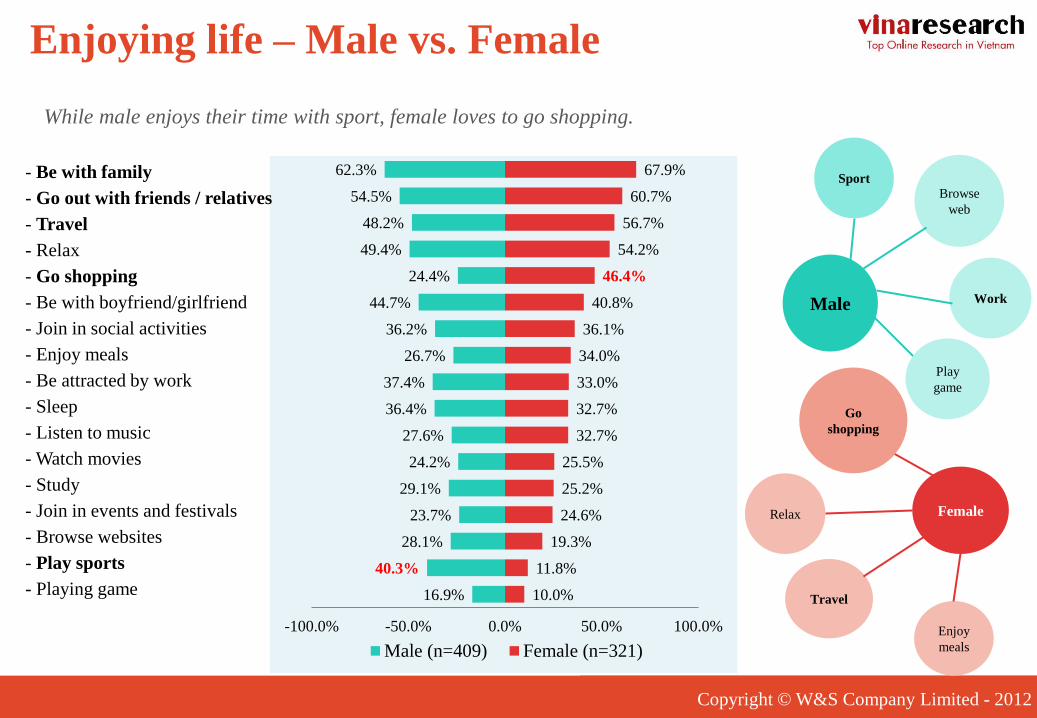
Enjoying life – Male vs. Female
- Be with family
- Go out with friends / relatives
- Travel
- Relax
- Go shopping
- Be with boyfriend/girlfriend
- Join in social activities
- Enjoy meals
- Be attracted by work
- Sleep
- Listen to music
- Watch movies
- Study
- Join in events and festivals
- Browse websites
- Play sports
- Playing game
While male enjoys their time with sport, female loves to go shopping.

Copyright © W&S Company Limited - 2012
Peaceful
64.2%
Full of love / attention
59.2%
Be with family
61.7%
Be with family
64.1%
Tighten family
relationship
56.5%
Peaceful
58.9%
Meaning of “House”
Peaceful
61.2%
Always welcome me
51.8%
Being protected
51.5%
Tighten family
relationship
55.5%
Be with family
63.0%
Full of love / attention
56.7%
“House” is a place to be with family, peaceful and full of love / attention.
Copyright © W&S Company Limited - 2012
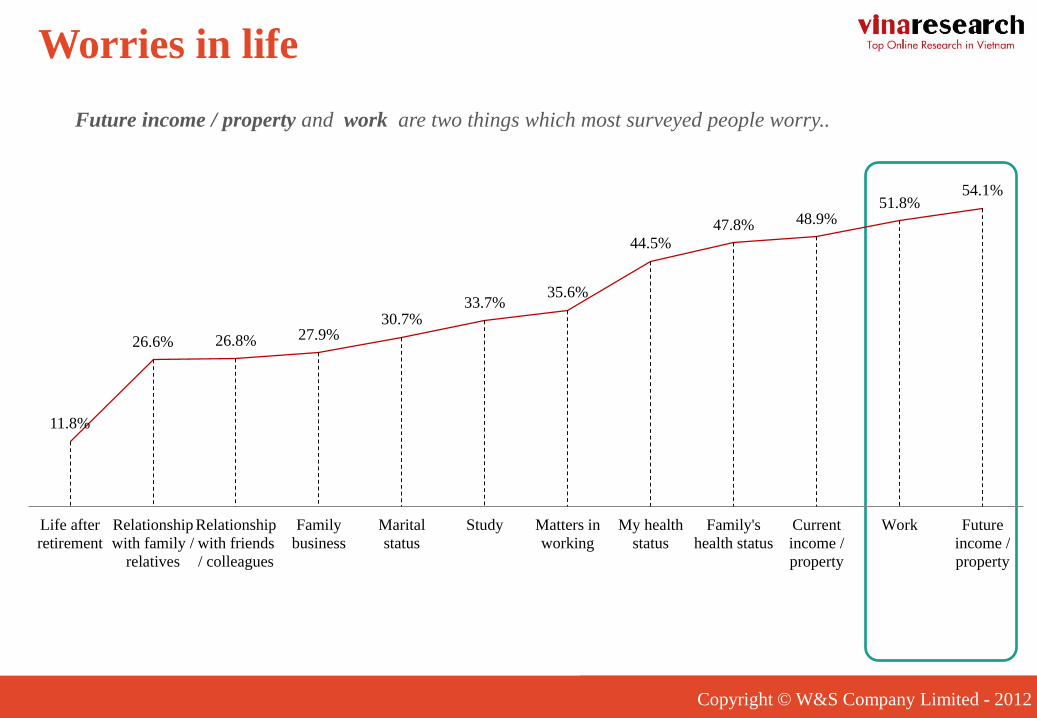
Worries in life
Future income / property and work are two things which most surveyed people worry..
11.8%
26.6% 26.8% 27.9% 30.7%
33.7% 35.6%
44.5%
47.8% 48.9% 51.8%
54.1%
Life after
retirement
Relationship
with family /
relatives
Relationship
with friends
/ colleagues
Family
business
Marital
status
Study Matters in
working
My health
status
Family's
health status
Current
income /
property
Work Future
income /
property
Copyright © W&S Company Limited - 2012
7.0%
4.4%
2.2%
2.7%
2.9%
6.6%
13.2%
26.0%
27.8%
30.4%
35.3%
39.5%
56.4%
0.0% 25.0% 50.0% 75.0%
Not discuss with others
Others
Senior consultant
Doctors / psychologists
Teachers / Lecturers
Grandparents
Colleagues
Husband / Wife
Relatives
Brothers / Sisters
Boyfriend / Girlfriend
Parents
FriendsMale Female
Friends 55.3% 57.9%
Parents 40.6% 38.0%
Boyfriend / Girlfriend 36.2% 34.3%
Brothers / Sisters 29.6% 31.5%
Relatives 29.3% 25.9%
Husband / Wife 24.2% 28.3%
Colleagues 12.5% 14.0%
Grandparents 7.8% 5.0%
Teachers / Lecturers 4.6% 0.6%
Doctors / psychologists 3.4% 1.9%
Senior consultant 2.7% 1.6%
Others 4.4% 4.4%
Not discuss with others 8.1% 5.6%
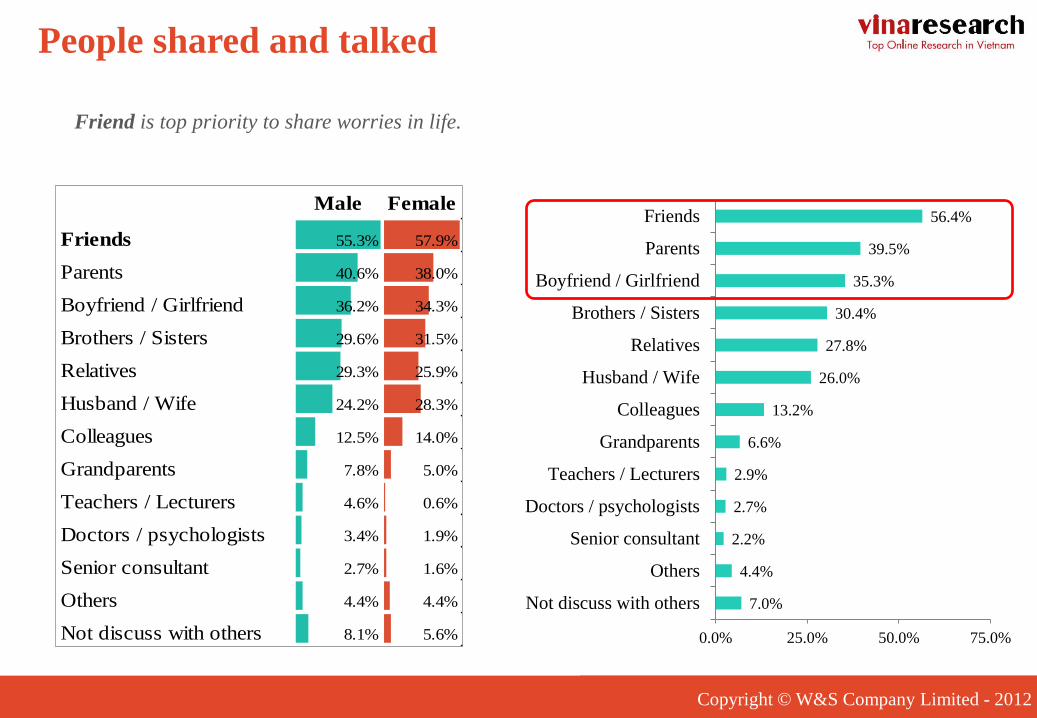
Friend is top priority to share worries in life.
People shared and talked
Copyright © W&S Company Limited - 2012
Part 3– CSR & Environment

Copyright © W&S Company Limited - 2012
62.5%
26.0%
10.4%
0.7% 0.4%
Will partly contribute if possible
Joined in activities positively
Never join in any particular activities
Do not think about it
Others
Protect the Earth from Greenhouse
The amount of people who have already joined in „Protect the Earth from Greenhouse‟ activities positively
are less than the people who have ever joined before.
Copyright © W&S Company Limited - 2012
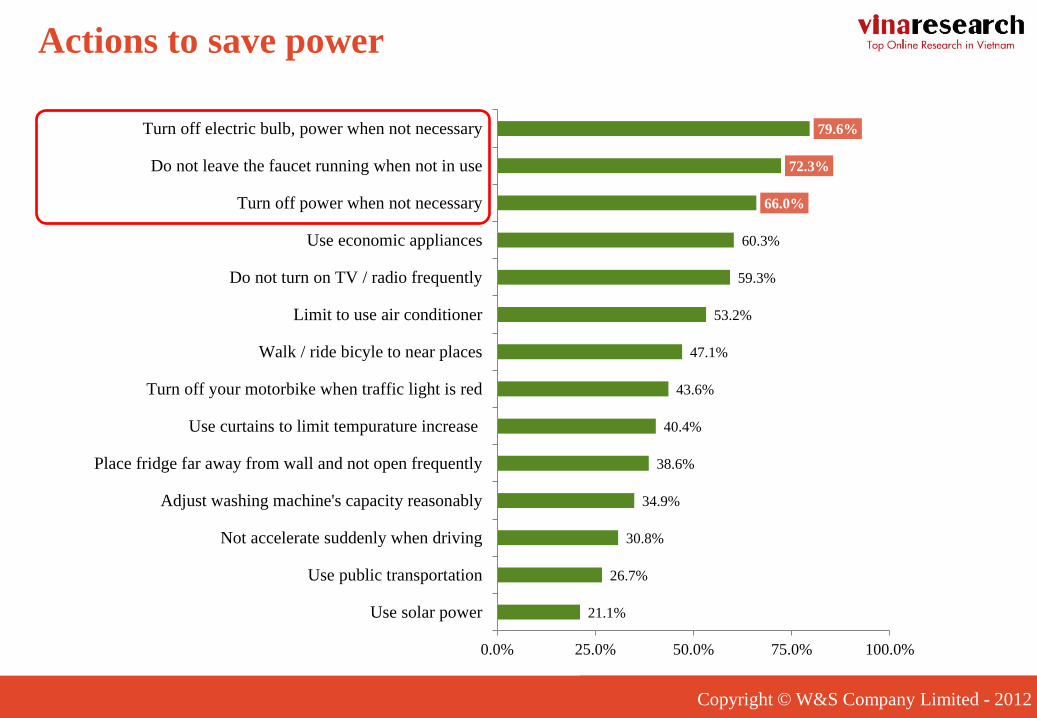
21.1%
26.7%
30.8%
34.9%
38.6%
40.4%
43.6%
47.1%
53.2%
59.3%
60.3%
66.0%
72.3%
79.6%
0.0% 25.0% 50.0% 75.0% 100.0%
Use solar power
Use public transportation
Not accelerate suddenly when driving
Adjust washing machine's capacity reasonably
Place fridge far away from wall and not open frequently
Use curtains to limit tempurature increase
Turn off your motorbike when traffic light is red
Walk / ride bicyle to near places
Limit to use air conditioner
Do not turn on TV / radio frequently
Use economic appliances
Turn off power when not necessary
Do not leave the faucet running when not in use
Turn off electric bulb, power when not necessary
Actions to save power

Copyright © W&S Company Limited - 2012
Green shopping
Products
with less
packaging
Products are
friendly with
environment
Use eco-bags
when shopping
Buy enough
food for using
Bottle of
water can be
recycled
Go
shopping
near your
house
ACTIONS
Copyright © W&S Company Limited - 2012
BARRIERS
Eco-friendly products are
not diversified
Sellers usually use nylon
The product is packaged
too much
Eco-bags are not widely sold
Eco-friendly products are
expensive
Do not understand about eco-
friendly products clearly
Green shopping – Barriers

Copyright © W&S Company Limited - 2012
13.4%
37.5%
17.0%
32.1% Heard and know its content clearly
Heard but do not know its content
clearly
Heard but do not know its content
at all
Never heard before
CRS
Level of awareness of surveyed people about CSR is not high and at “just hear about it”.

Copyright © W&S Company Limited - 2012
27.8%
31.5%
35.1%
35.1%
35.8%
36.8%
40.1%
43.2%
48.6%
61.8%
0.0% 20.0% 40.0% 60.0% 80.0%
Participate in international exchange activities
Participate in volunteer activities about sanitary and health
Sex education for adolescents
Be volunteers at schools or hospitals
Participate in sport activities
Participate in propagation activities about traffic safety
Be volunteers in preventing disasters
Be volunteers in charity houses
Blood donation
Participate in charity activities
Useful activities for society
The activities which most surveyed people are willing to participate is charity contributing and blood
donation.

W&S Online Market Research Co., Ltd.
Address: 31C Ly Tu Trong, Ben Nghe Ward, District 1, HCMC.
Phone: (08) 38 223 215 Fax: (08) 38 223 216
E-mail: [email protected]
CONTACT INFORMATION
The copyrights of this report belong to W&S Co,.Ltd. The results of this survey can be publicly used, but must be cited
and sourced from Vinaresearch. Under the circumstance of using the tables and graphs from results of this survey, the
data at the source must be clearly stated and based on survey results collected from Vinaresearch.