Embed Size (px)
Citation preview

Managing Energy Risk in Africa
Egmont OttermannCemEnergy Conference, Moscow, 3 December 2014

2
Company overview
• Established over 120 years ago
• Listed on the JSE for 104 years
• Largest cement manufacturerwith leading market positions inSA, Zimbabwe, Botswana andRwanda
• Leading burnt lime and dolomiteproducer in southern Africa
• Strong presence in theaggregates industry in Gautengand Botswana.
• Cement is also exported to otherAfrican countries
• For the 2013 financial year:
• Revenue R 8.3 bn
• EBITDA R 2.5 bn
• Operating profit R 1.9 bn

3
DRC
Population (m) 74.7
Urbanisation (%) 34%
GDP per capita ($) 241
Cement consumption/capita (kg) 26
Real GDP growth 13 - 18E 9.8%
Capacity (mtpa) 0.68
Cement price per tonne ($) 400
Botswana
Population (m) 2.1
Urbanisation (%) 24%
GDP per capita ($) 7,471
Cement consumption/capita (kg) 302
Real GDP growth 13 - 18E 4.9%
Capacity (mtpa) -
Cement price per tonne ($) 120-170
South Africa
Population (m) 51.1
Urbanisation (%) 62%
GDP per capita ($) 6,847
Cement consumption/capita (kg) 226
Real GDP growth 13 - 18E 3.7%
Capacity (mtpa) 16
Cement price per tonne ($) 110-150
Mozambique
Population (m) 22.5
Urbanisation (%) 31%
GDP per capita ($) 640
Cement consumption/capita (kg) 68
Real GDP growth 13 - 18E 9.7%
Capacity (mtpa) 1
Cement price per tonne ($) 130-240
Zimbabwe
Population (m) 13.0
Urbanisation (%) 29%
GDP per capita ($) 799
Cement consumption/capita (kg) 76
Real GDP growth 13 - 18E 4.9%
Capacity (mtpa) 1.5
Cement price per tonne ($) 180
Rwanda
Population (m) 10.4
Urbanisation (%) 17%
GDP per capita ($) 724
Cement consumption/capita (kg) 37
Real GDP growth 13 - 18E 8.6%
Capacity (mtpa) 0.2
Cement price per tonne ($) 250-350
Ethiopia
Population (m) 86.8
Urbanisation (%) 17%
GDP per capita ($) 533
Cement consumption/capita (kg) 74
Real GDP growth 13 - 18E 8.7%
Capacity (mtpa) 9
Cement price per tonne ($) 130
Source: Cemnet 2012, IMF data
Algeria
Population (m) 37.5
Urbanisation (%) 72%
GDP per capita ($) 5,668
Cement consumption/capita (kg) 549
Real GDP growth 13 - 18E 4.3%
Capacity (mtpa) 22
Cement price per tonne ($) 80-120
PPC’s expansion strategy

4
Richards Bay Coal Price Index

5
South African Coal Market

6
PPC Strategy
• Operational Efficiency• Reducing our energy usage though improved efficiency and
technology upgrades
• Alternative Energy
• Alternative Fuels
• Captive Electrical Energy
• Strategic Procurement• Improving the flexibility of plants for use of fuels
Operational Efficiency Alternative Energy Strategic Procurement

7
Volatility
8
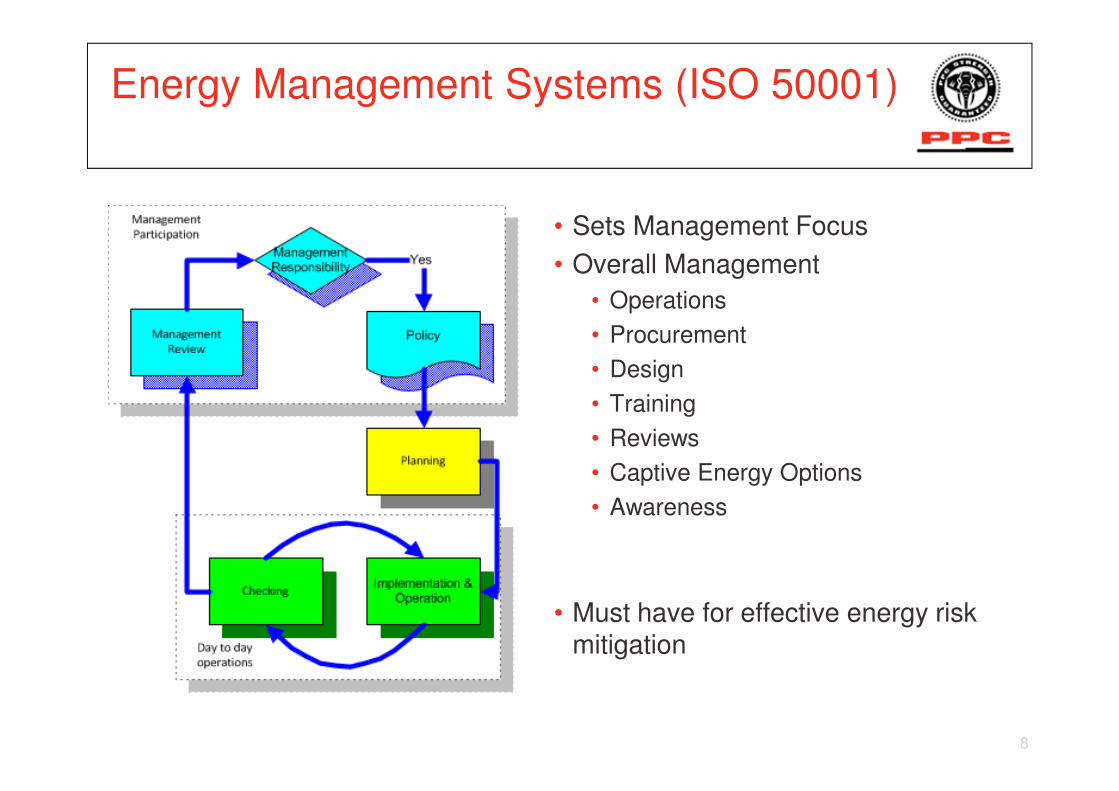
Energy Management Systems (ISO 50001)
• Sets Management Focus
• Overall Management
• Operations
• Procurement
• Design
• Training
• Reviews
• Captive Energy Options
• Awareness
• Must have for effective energy risk mitigation
9
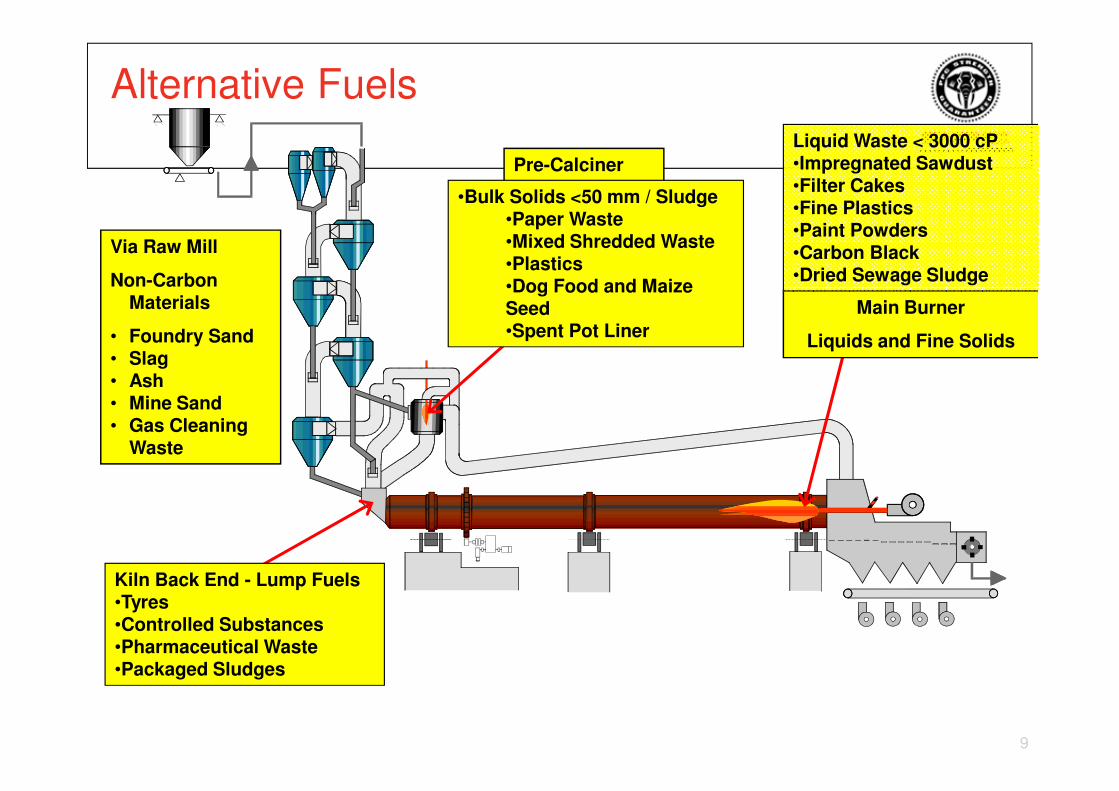
Pre-Calciner
Main Burner
Liquids and Fine Solids
Via Raw Mill
Non-Carbon Materials
• Foundry Sand• Slag• Ash• Mine Sand• Gas Cleaning
Waste
Liquid Waste < 3000 cP•Impregnated Sawdust•Filter Cakes•Fine Plastics•Paint Powders•Carbon Black•Dried Sewage Sludge
•Bulk Solids <50 mm / Sludge•Paper Waste•Mixed Shredded Waste•Plastics•Dog Food and Maize Seed•Spent Pot Liner
Kiln Back End - Lump Fuels•Tyres•Controlled Substances•Pharmaceutical Waste•Packaged Sludges
Alternative Fuels

10
South African Focus

11
Carbon Tax - SA
• Current and Proposed Instruments
• Carbon Tax Budget Discussion Paper
R 0
R 50
R 100
R 150
R 200
R 250
0%
10%
20%
30%
40%
50%
60%
70%
80%
90%
100%
20
13
20
14
20
15
20
16
20
17
20
18
20
19
20
20
20
21
20
22
20
23
20
24
20
25
Carb
on
Pri
ce
Basic
F
ree A
llo
cati
on
Basic Price
Tax Design
Basic Trade Process Off Set
Cement 60% <10% <10% <5%
Basic Allocation Adjustment
Ajd = Basic*(Eff/Bench)-Basic
1
10
100
1 000
10 000
100 000
Agric
Waste
Cem
ent
Lim
e
Oil
Energ
y
Ma
nfg
Min
ing
Benefic
Basic
F
ree A
llo
cati
on
(,
000 t
on
s)

12
Renewable Energy
• Wind
• Innowind, subsidiary of EDF EN (www.edf-energies-nouvelles.com)
• Two Linked Wind Projects (60 MW for RDF Round 2 and 21 MW for PPC)
• PPC purchases 50 000 MWh at positive NPV vs ESKOM over 20 years
• Achieves target of 10% Renewable Energy
• Solar PV
• Solar PV project prices have fallen to between R15 Mio and R20 Mio per MW
• Structured Rollout

13

14

15
Women sort coffee beans in Addis Ababa, Ethiopia

16
Chitungwisa Market, Harare, Zimbabwe

17
Skyline of Kinshasa, Democratic Republic of the Congo

18
PPC Zimbabwe
• Fifth consecutive year of rising cement demand
• Slower domestic volume growth due to on-going liquidity challenges and high external debt levels
• Good export volume growth and selling prices achieved
• Improving margins as costs well maintained
• Modernisation programme
• Bulawayo plant –commissioned country’s first cement bag palletiser and a new bulk loading facility
• Colleen Bawn plant – successful crusher and kiln upgrades led to improved reliability and output
• United Nations Development Programme estimates the need for investment of some $18 billion to rehabilitate and modernise infrastructure
• We are optimistic about growth in infrastructure investment

19
New CIMERWA plant in Rwanda to be commissioned in 2015
20
Summary
• Know and understand the power an fuel requirements of the plant.
• When developing solutions, starting from a blank sheet is critical.
• Understand the limits to the bankability of the project.

21
Energy and Climate ChangeA Tale of Winners and Losers
What will you be?
Lord AN Onymous looks back from 2050
Conclusion

22
Questions?