Embed Size (px)
Citation preview
1
DECENTRALIZED TAX SYSTEM AND PUBLIC EXPENDITURES IN
RWANDA
HABIMANA THEOGENE
2015

2
CHAPTER ONE: INTRODUCTION
1.0 Introduction
This chapter begins with the background of the study, the problem statement, research
objectives, and research questions, significance of the study, limitation and the scope of the
study as subtitles suggest and then organization of the study.
1.1 Background of the Study
All around the world in matters of governance, tax decentralization is the rage. Even apart
from the widely debated issues of subsidiarity and devolution in the European Union and
states’ rights in the United States, tax decentralization has been at the center stage of policy
experiments in the last two decades in a large number of developing and transition economies
in Latin America, Africa and Asia (Bardhan, 2002). Take also the examples of the two
largest countries of the world, China and India. Decentralization has been regarded as the
major institutional framework for the phenomenal industrial growth in the last two decades in
China. India ushered in a landmark constitutional reform in favor of tax decentralization
around the same time it launched a major program of economic reform in the early 1990s
(World Bank, 2000). On account of its many failures, the tax centralized state everywhere
has lost a great deal of legitimacy, and tax decentralization is widely believed to promise a
range of benefits.
Fiscal decentralization has become a major trend worldwide. Much of the recent movement
towards devolution has been driven by the belief that fiscal decentralization has a positive
effect on government efficiency and service delivery. It is generally assumed that the transfer
of powers and resources to lower tiers of government allows for a better matching of public
policies to local needs and thus promotes allocation of resources. All these are expected to
lead to an improvement in regional and overall economic performance, particularly if sub-
national authorities shift resources from current to capital expenditures in search of a better
response to local need (Akpan, 2011).
In 2001 fiscal decentralization was launched in Indonesia as a policy reform to support
regional development, boost economic growth and alleviate poverty. In Vietnam, because of
the decentralization scheme in 1998, 43% of total national expenditures shifted to the local
governments(Salim, 2009). Bolivian economy decentralized in 1994 where 20% of tax
revenue and 40% of expenditure responsibilities have been devolved to local and municipal
governments (Faguet, 2004). Brazil also embraced fiscal decentralization in 1988 through a
constitutional mandate and consequently augmented sub-national fiscal autonomy to 22.5%
of total revenue collection (Shah, 1990). Among other Latin American countries, Argentina
is believed to be the most decentralized economy in the region with about half of the total
public expending are carried out at the subnational government level (Inter-American
Development Bank, 1997)
Similarly, to improve the essential services delivery and generate employment opportunities
to uplift the poor in Colombia, a Law of local governments ‘functions was promulgated in
1993 to bring together the decentralization and poverty alleviation programmes (Iregui,
2005). India, though constitutionally a federal structure since the inception (1947) with clear
demarcation of financial resources between union and state governments, has initiated more
decentralization reforms in 1992 through the 73rd and 74th constitutional amendments and in
3
1994 through Panchayati Raj Act to revitalise the decades old local government system
(Chaudhry I , Malik S and Hassan A, 2009). Mexico implemented decentralization reforms
during 1995-1998 in which 20.5% of tax income (previously collected by the federal
government) are now being distributed amongst the states under the regulation of National
System of Fiscal Coordination. (Fausto & Brenda, 2008).
Fiscal decentralization as a system of political organization has a long history in Nigeria. It
predates political independence in 1960 and was used during the colonial era as a means of
coping with the cultural diversity that existed in the country in the early 1900s, Nigeria had
adopted a decentralized system of governance before independence; however, the component
units were further decentralized in 1967 as a check to the power wielded by the Eastern
Region in May 1967 (Adolphus & Deborah, 2014). The former four regions were broken into
a twelve state Federal Structure in 1967. Before 1967, the regions were less dependent on the
Federal government. The revenue allocation formula at that time allowed regions to collect
petroleum profit tax, airport and produce sale/purchase taxes, and custom and excise taxes
(Abuzeid, 2009).
Similarly, fiscal decentralization has initiated in Tanzania under the Local Government Act
of 1982, wherein sub-national governments ‘sources have been increased significantly that
eventually led to improve the efficiency and enhance the responsiveness of local
governments in services delivery (Slater, 1989). The wave of fiscal decentralization was not
confined to above mentioned countries, but ensued in many other countries across all
continents, for instances in Ghana in 1988 (Crawford, 2008), Uganda in 1997 (Azfar &
Jeffrey , 2002).
In Rwanda the National Tax Decentralization Policy was approved in 2001 as mechanism to
achieve good governance principles (through improved participation, promotion of
transparency and accountability, and setting up responsive decentralized structures), enhance
local economic development (through efficiency and effectiveness in implementation of
development programs) and bringing quality and accessible services closer to the citizens.
Since the first Fiscal and Financial Decentralization Policy were adopted, Rwanda has
implemented the National Tax Decentralization Policy in a forthright manner. The
administrative reform process lays out the responsibilities devolved to the Local
Governments and they have been accorded a greater role for service delivery across all
sectors. Sectors (and in the future cells) are mandated as the nodes of service delivery. Local
Governments co-ordinate and assist Sectors to deliver better services to the population by
determining, co-ordinating and implementing development plans and programmes. (Ministry
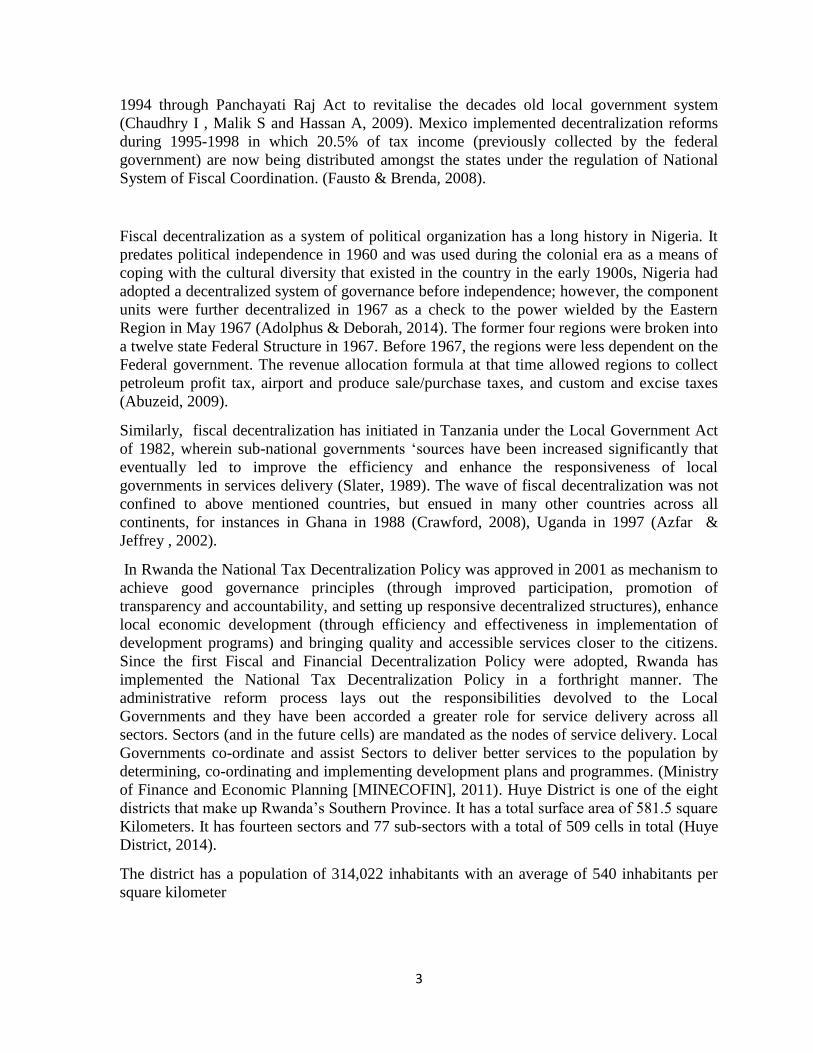
of Finance and Economic Planning [MINECOFIN], 2011). Huye District is one of the eight
districts that make up Rwanda’s Southern Province. It has a total surface area of 581.5 square
Kilometers. It has fourteen sectors and 77 sub-sectors with a total of 509 cells in total (Huye
District, 2014).
The district has a population of 314,022 inhabitants with an average of 540 inhabitants per
square kilometer
4
1.2 Problem Statement
Fiscal and tax decentralization is a mechanism for constraining the expansionary tendencies
of governments. Under this approach, all-over the world central governments do not
maximize social welfare and operate like monopolists in order to increase their control over
the economy’s resources (Crawford, 2008). Therefore, tax decentralization means fiscal
empowerment of the local governments. More specifically, it means devolution of taxing and
spending powers to lower levels of government. A key argument supporting fiscal
decentralization reform is that it can improve the public sector services and help reducing
poverty (Ahmed, 2013) Some authors like Crawford, 2008 and Ahmed, 2013 argued that the
benefits of tax decentralization are not as obvious as proponents of decentralization suggest,
and there could be serious shortcomings that policymakers should be aware of in designing
decentralization policies. Local Government accountability and resource allocation efficiency
may not be achieved with decentralization when the scarcity of public sector administrative,
financial and managerial capacity is more problematic at the lower levels of government
(Collier, 2008). Conflicts between central and local governments as to what should be done
are inevitable even if government tries faithfully to serve the interests of its (different)
constituents. A choice of perspective is thus essential in approaching issues of tax
decentralization. In addition, decentralization may impose constraints to the implementation
of national policies and the creation of coordination channels across regions. Therefore, from
the above problem, the researcher analyzed the contribution of decentralized tax system and
public expenditures.
1.3 Objectives of the Study
1.3.1 General Objective
The general objective of the study was to analyze the contribution of decentralized tax
system to the public expenditures in Rwanda.
1.3.2 Specific Objectives
i. To analyze the effect of decentralized fixed asset tax revenue to the current
expenditures ;
ii. To identify the main problems faced by taxpayers in relation to trading license tax in
Rwanda;
iii. To analyze the benefits brought by rental income tax decentralization in development
expenditures ;
iv. To establish the relationship between decentralized tax system and effectiveness of
public expenditures.
1.4 Research Questions
i. Is there any effect of decentralized fixed asset tax revenue to the current
expenditures?
ii. What are the main problems faced by taxpayers in relation to trading license tax in
Rwanda?
iii. What are the benefits brought by rental income tax decentralization in development
expenditures?

5
iv. To what extend decentralized tax system related to effectiveness of public
expenditures?
1.5 Significance of the Study
Based on the objective of this study, the researcher is of the strong opinion that, the study
should be significant to the community and taxpayers, to the tax authorities and to the district
authorities. For the taxpayers, it could provide information to them about their contribution in
supporting the district expenses consequently their awareness to respond to their obligation
increased. For the district authority, it should reveal concrete information about the role of
existing taxpayers, the weight of tax systems generated and how far self-reliance is possible.
For the researcher, it should give him an opportunity to know much about existing tax
systems types, the functioning of fiscal and financing decentralization. For the community, it
should provide them with education and sensitization and provide first-hand information
about the role of tax systems in contributing to the public services. For the academic purpose
it should serve as a reference tool for further research related to the tax to be carried out by
students.
1.6. Limitations of the Study
This study faced some limitations, secondary data required from the district level were not
available, hence the study relied on primary data only. Some authorities do not respond very
well to the appointment due to the heavy tasks assigned to them, for this researcher required
to manage the time, being precisely and concisely as much as possible during information
collection.
1.7. Scope of the Study
The researcher studied the contribution of decentralized tax systems to the effectiveness of
public expenditures in Rwanda. The study was carried out in southern province, in Huye
district which collect more taxes in that province. To analyze the amount of tax systems
collected and their trend along the years, the study considered the five years, 2010 till 2014.
1.8 Organization of the Study
The first chapter is composed by introduction to the study, background to the study, problem
statement, objectives of the study, research questions, significance of the study, limitations of
the study, scope of the study and then organization of the study. The second chapter is
composed by introduction to literature review, theoretical literature, empirical literature,
critical review and research gap identification, conceptual framework and then summary of
literature review. The third chapter is composed by introduction to the research methodology,
research design, target population, sample design, sample size, sampling techniques, data
collection methods, data analysis procedures and then ethical consideration. Chapter four
presents research findings and interpretations, initially discusses socio-demographic
characteristics, then based on objectives of the study results are presented. Chapter five offers
some of the critical reflections on the research findings and recommendations and general

6
conclusion that cover a summary of responses to the research questions and objectives of this
study.
7
CHAPTER TWO: REVIEW OF RELATED LITERATURE
2.0 Introduction
A literature review is a description of the literature relevant to a particular field or topic. Our
research study should fill in the gaps left by what has been done before, but before that
happens; we have to have a firm grasp of what has been done before. This means reading and
understanding other people’s research studies. It is in this regard that this chapter was
focused on the previous research made on the concept of taxation and expenditures of local
entities. The research has further looked at the empirical review, critical review, summary
and knowledge gap and conceptual framework.
2.1 Theoretical Literature
This part reviews the literature that brought forward by different authors. It attempts to define
and explain the issues related to the topic of research and relate it with findings for
interpretation later on. In this regards, the chapter focuses on the tax decentralized and
effectiveness of public expenditures.
2.1.1 Overview of Decentralized Tax and Tax Compliance
According to Richard (2015) issues of fiscal decentralization, broadly conceived, are thus in
the air everywhere and, indeed, are already on the ground in many different guises in
different parts of the world. Economic theorists are theorizing about fiscal decentralization,
applied economists are attempting to pin it down in numbers, and policy economists are
busily flying around the world dispensing advice about it. It has long been held that, in
theory, fiscal decentralization may be conducive to economic growth. If few public goods
entail nationwide externalities, sub-national governments are likely to be more efficient in
the production and delivery of public goods. It is also asserted that decision-making on
expenditures at lower levels of government is more responsive to diversified local
preferences and needs and, therefore, more conducive to allocate efficiency (Jing, & Heng,
2005).
According to Suwandi and Warokka (2013), regional autonomy without fiscal
decentralization results less support to the achievement of the governance and public
services’effectiveness. Therefore, autonomy requires financial decentralization policy. Fiscal
decentralization policy aimed at enabling local government budgetary in improving service
to the community, particularly in achieving minimum service standards.
According to Kaplow (1990) taxation refers to the act of a taxing authority actually levying
tax. Taxation as a term applies to all types of taxes, from income to gift to estate taxes. A
means by which governments finance their expenditure by imposing charges on citizens and
corporate entities, Governments use taxation to encourage or discourage certain economic
decisions. For example, reduction in taxable personal (or household) income by the amount
paid as interest on home mortgage loans results in greater construction activity, and generates
more jobs. See also taxation principles means by which governments finance their
expenditure by imposing charges on citizens and entities. Governments use taxation to
encourage or discourage certain economic decisions. For example, reduction in taxable
personal (or household) income by the amount paid as interest on home loans results in

8
greater construction activity, and generates more jobs. See also taxation principles (Slemrod,
1995).
Taxation can be defined as the government’s practice of collecting money from its citizens
and business concerns to support its functions. It applies to various types of taxes ranging
from income tax to gift tax, house tax to sales tax etc. In short taxation can be defined as the
one of the primary powers of the government over its citizens. Tax can also be defined as a
pecuniary burden imposed on individuals or property owners in order to support the
government. It is generally a payment exacted by legislative authority (Braithwaite, 2003).
All governments require payments of money taxes from people. Governments use tax
systems to pay soldiers and police, to build dams and roads, to operate schools and hospitals,
to provide food to the poor and medical care to the elderly, and for hundreds of other
purposes. Without taxes to fund its activities, government could not exist. An individual
income tax, also called a personal income tax, is a tax on a person’s income. Income includes
wages, salaries, and other earnings from one’s occupation; interest earned by savings
accounts and certain types of bonds; rents (earnings from rented properties); royalties earned
on sales of patented or copyrighted items, such as inventions and books; and dividends from
stock. Income also includes capital gains, which are profits from the sale of stock, real estate,
or other investments whose value has increased over time (Chang & Lai, 2004).
2.1.2 Overview of Taxation
A tax may be defined as any leakage from the circular flow of income into the public sector,
excepting loan transactions and direct payments for publicly produced goods and services up
to the cost of producing them. It is in effect a contribution designed to reduce private
expenditure in favor public expenditure to enable the government to obtain funds in order to
provide social and merit goods and services, redistribute income, clear market imperfections
and stabilize the economy (Nicholas, 2003).
Tax is generally referred to as a compulsory levy by the government upon assessment of
various categories. It is a compulsory levy payable by an economic unit to the government
without any corresponding entitlement to receive a definite and direct quid pro quo from the
government (Bhatia, 2009). A tax is a compulsory contribution imposed by a public
authority; irrespective of the extant to the service rendered to the taxpayer in return. The
author also defined tax as a compulsory levy imposed on the nationals and residents to meet
expenses which are incurred by a government for the common cause (Saleemi, 1981). A tax
is a compulsory contribution imposed by a public authority, irrespective of the exact amount
of service rendered to the taxpayer in return, and not imposed as penalty for any legal
offence."
Chris and Elizabeth (2001) also defined taxes as a forced proportional contribution from
persons and property levied by the state by virtue of its sovereignty for the support of
government and for all public needs. Therefore, according to the author, tax has three basic
features namely; a compulsory levy imposed by government, or local authority, for public
purpose and to encourage social justice.
9
A tax is not a voluntary payment but a compulsory pecuniary burden placed on taxpayers for
the benefit of the society. Adebayo (2004) defined taxation as the legal demand made by the
Federal Government or State government for its citizens to pay money on income, goods and
services. In a less complex society in which the government has few duties and
responsibilities, the financial need of the government are minimal. However, as society
becomes complex the need of the people becomes greater and the government assures greater
responsibility the financial needs of the government becomes great. Consequently, taxes
increase and their effect on the economy becomes more important (Adebayo, 2004). Tax is a
pecuniary burden laid upon individuals or property owns to support the government, a tax is
not voluntary payment or donation but an enforced contribution, exacted pursuant to
legislative authority and is any contribution imposed by government.
Several authors points out or encompasses three main characteristics of the tax and the
following deserves mention; Tax is not levied for a return for a specific service rendered by
government to taxpayers. An individual cannot ask for any special benefit from the
government in return for the tax paid. It is referred to as a non-quid-proquo payment. It is a
compulsory contribution imposed by the government on people or companies. Because of its
compulsory nature, those who do not pay it are reliable to being punished but it is to be paid
by those who come under its jurisdiction (Cooper, Krever and Vann's 2005). It is a payment
by taxpayers which is used to benefit all the citizens whereby the government uses the
collected revenues to establish infrastructures such as hospitals, schools as well as other
public utility services (Chinyere, 2000).
2.1.3 Problems Faced by Tax Collection
According to Ariwodola (2000) a large sum of money by way of revenue that supposed to
have been generated from group of tax payers (self-employed) by different governments
remain uncollected year in year out due to the following factors: Lack of Taxpayers
Data/Information: There is no detailed information on or database for the self-employed, thus
bringing them into the tax net is different. This is a very serious problem in personal taxation
as it often difficult most a times to determine the residence of individuals which is vital for
the purpose of identifying the relevant tax authority of a tax payer. A lot of time is often
spent in residence determination especially where there is dispute between two or more tax
authorities leading to loss of revenue that would have accrued (Azfar, & Jeffrey, 2002).
Inefficient utilization of tax revenue: There is a general apathy to voluntary compliance with
the provisions of the tax laws because of the level of decay in basic infrastructure such as
light, water and good roads. This problem has always called to question the need for
continued payment of tax. Lack of experienced and qualified personnel: Most tax officers
lack the requisite experience and knowledge of the tax laws required to appropriately assess
the self-employed to tax (Chinyere, 2000).
Inadequate penalties/absence of enforcement: the penalties for non-compliance with relevant
tax provisions are too lenient to compel the self-employed to pay tax. There is also a general

10
lack of enforcement of existing penalties. Most self-employed persons do not maintain
adequate records of their income and expenditure. In most cases, they mix their business
activities with their private affairs thus making it difficult to determine the income taxable
(Fausto & Brenda, 2008). Most of the self-employed tax payers do not know what tax to
pay, when to pay, who to pay to, where to pay and what relief and allowance they are entitled
to. Governments are faulted here because a good tax system should be certain and easy to
administer. It is the responsibility of government at all levels to educate the public on their
responsibility with respect to tax at all times (Collier, 2008). Some tax officials collude with
would be tax payers to defraud the government of her taxes. A large chunk of revenue that is
supposed to come into government coffers ended up in private pockets compounding
problems of government’s inability to provide the basic infrastructure needed for the orderly
development of the society (Akpan, 2011). This is directly linked to the problem highlighted
above. Several self-employed persons are struggling to survive due to the non-conducive
operating environment.
The society according to Ariwodola (2000) has been impoverished by the elite so much that
paying tax will further deepen the level of poverty among the low income earners. Revenue
authority should embark on aggressive public enlightenment and education of tax payers on
the various taxes payable by all self-employed individuals in the society (Wales, 2008). The
tax laws should be regularly up-dated and provision should be such that are reasonable and
easy to comply with.
2.1.4 Benefits of Decentralized Tax Related to Public Expenditures
Most of developing countries are facing severe dysfunctionality and decline in their
economies; therefore, many of them focused on increasing investment in public productive
expenditures. Such expenditures may invest in human capital and in physical infrastructure
which may, in turn, stimulate investment in the private sector and encourage foreign direct
investment (Sultan, & Mairna, 2011).
The development of different sections of the economy is not possible without the state help.
The government should develop irrigation, transport and communication, industrial and
agricultural systems of the country for the rapid increase in the rate of economic growth
(Tayebwa, 1991). Tax decentralization is necessary because it is not possible or desirable to
obtain all resources needed for the government programs from prices, licenses, and fees.
Certain services, such as national defense and general public administration, cannot easily be
sold to individuals. This is because if these services are provided, the benefits are generally
available to all individuals, irrespective of whether or not they pay, and one person's
enjoyment of them does not diminish the benefits available to others. Similarly, it would not
be socially acceptable to provide certain services, such as education and police protection
only to those who are able to pay full costs because, then, only the `rich' would be able to
enjoy these services (Nicholas, 2003).

11
Tax decentralization according to Nightingale (2000) under any jurisdiction is discriminatory
in the sense that it is assessed on persons or property based on profits/incomes or gain, the
benefit derived by citizens from tax payment is without reference to the contribution of
individual tax payers. In line with this, according to Ariwodola (2000) it is accurate to say
that the primary objective and purpose of taxation in most nations of the world is essentially
to generate revenue for government expenditure on social welfare such as provision of
defense, law and order, health services and education. Revenue from taxation can also be
spent on capital projects otherwise called consumer expenditure, creating social and
economic infrastructure which will improve the social life of the people. (Ariwodola, 2000)
Taxation can be extensively used in regulating the consumption pattern resulting in economic
stabilization. Anti-social behavior such as drinking of alcohol, smoking and pool betting can
be controlled by imposition of higher taxes on production of such goods. Firstly taxes are
imposed to maintain economic stability in the country (Akpan, 2011). When it is a period of
inflation, the state imposes more taxes so as to discourage the useless expenditures of the
individuals and the same applies to deflation where taxes are reduced to enable the citizens
spend more money. It is from here that indirect taxes may automatically stabilize the
economy as much as goods having high income elasticity of demand are taxed more heavily
(Braithwaite, 2003).
The main reason of imposing taxes is to raise revenue for financing public activities such as
building schools, roads, and hospitals, maintain security of nationals, and safeguard territorial
integrity thus playing a pivotal role in maintaining a political, social and economic
environmental stability. When the revenue collected is used into developmental affairs,
individuals get employed due to more employment opportunities created (Adebayo, 2004).
There is also another reason which is fair distribution of income (Reduction of income
inequality). Here the government imposes taxes to achieve equality in the distribution of
national income where by the rich are taxed highly that will improve the welfare of the poor
and taxing the poor less or giving subsides. This has already been done in the Rwanda
context such as is PAYE system.
The policy of the government must be protected by enhancing local industries through
imposing high taxes on imported commodities from other countries but of the same type
(Braithwaite, 2003). The government can also subsidize home industries so that the cost of
production is low. This will enable these industries to compete with other regional ones
especially now that regional integration may not allow imposition of taxes on goods from
neighboring countries. Protecting home industries also solves a social problem of
unemployment as local gain capacity they absorb unemployed skilled manpower (Bhatia,
2009).
Taxes may bring about a balanced national development. This means that out of revenues
collected, government may decide to allocate resources to areas or sectors where
development is highly needed so as to have balanced productive results. The government
imposes taxes for the element of social welfare by imposing high taxes on harmful goods to
human health and these include alcoholic drinks, cigarettes and other harmful chemicals.
Taxes are used to check on inflation by reducing the purchasing power of the people. This

12
can be done by increasing taxes on their incomes so that there is a reduction on disposable
income (Richard, 2010).
According to Tanzi & Pellechio, (1995) the main tasks of tax administration involve:
(1)information and instruction to taxpayers, (2) registration, organizing and processing tax
returns (input of data, processing declarations and payments), (3) coercive collection (closely
connected with registration, accounting and return processing), (4) control and supervision
(discovering lacking and insufficient tax returns and controls of books and papers in tax
administration offices or business activities and books of taxpayers, while routine check-ups
had already been done in the registration, accounting and return processing department), (5)
legal services and complaints (taking cases to court, defending tax administration in court,
explaining procedures which are or are not in accordance with the law).
2.2 Empirical Literature
Richard ( 2015) analyzed tax and Fiscal decentralization in Canada. The general objective of
the study was to discuss aspects of taxation subject that have turned out to be important in
policy work on the issue in Canada. First, they discussed briefly the meaning and rationale of
fiscal decentralization. Using documentary analysis, they found that there was much that has
to be disentangled before one can approach the issue in a particular policy setting, including
distinguishing between the problems of federal finance and fiscal federalism. Second, they
reviewed the issue of the choice of local revenue sources from the perspective of establishing
efficient local governments, including the roles of user charges, property taxes, and income
taxes. Finally, they sketched some considerations with respect to the design of
intergovernmental transfers from the same perspective, with particular emphasis on the
desirability in many settings of transfers that were both conditional and equalizing. The study
found that tax and fiscal decentralization contributed positively to the management and
utilization of resources in local Government.
Jing and Heng (2005) assessed the fiscal decentralization, revenue and expenditure
assignments and growth in China. The study found that, there was contradiction between the
theory and evidence in the China case is reconciled by taking into account the institutional
arrangements that prevailed during the two phases of fiscal decentralization, in particular the
inconsistency between the assumptions of the theory of fiscal decentralization and the
institutional reality of China.
Suwandi and Warokka (2013) analyzed Fiscal Decentralization and Special Local
Autonomym in Indonesia. The study aimed to examine the effects of fiscal decentralization
and specific local autonomy on economic growth, employment, poverty, and welfare in the
special province Papua (Indonesia). The study exploited the main data of the decentralization
fund by using a panel data of eight regencies and municipals, particularly the regional
autonomy fund, direct and indirect government expenditure, and economic growth. The
paper used the path analysis to explore the relationships of the observed variables. The
results revealed that the decentralization fund influenced significantly on government’s direct
expenditure and economic growth. The special local autonomy's fund has influenced
13
considerably on government’s indirect expenditure. Its effect has increased, through
economic growth as the intermediating variable, meaningfully on employment, poverty, and
welfare. The results are in line with the prior studies, which explore the consequences of
decentralization and specific autonomy to spur the economic growth in certain regions. It
found that the economic development strategies in Indonesia’s less-developed regions should
be started with a bigger autonomy transfer program to those regions and simultaneously
enhanced it by special budget allocation to trigger and support the development.
Gediminas, Kęstutis and Neringa ( 2013) analyzed development of local municipality taxes
and principles of fiscal policy in Lithuania. The analysis found, that non-tax income, which
can be mostly influenced by local governments and local taxes comprises but an insignificant
share of all local governments income and they significance were not great.
Okafor (2012) analyzed tax revenue generation and nigerian economic development. The
objective of this study was to explore the impact of income tax revenue on the economic
growth of Nigeria as peroxided by the Gross Domestic Product (GDP). The Ordinary Least
Square (OLS) regression analysis was adopted to explore the relationship between the GDP
(the dependent variable) and a set of federal government income tax revenue heads over the
period 1981-2007. A simple hypothesis was formulated in the null form which states that
there is no significant relationship between federally collected tax revenue and the GDP in
Nigeria. The regression result indicated a very positive and significant relationship. However
actual tax revenue generated in most years fell below the level expected. The anomaly was
attributed to dysfunctional ties in the income tax system, loopholes in tax laws and inefficient
tax administration.
Sanni (2012) analyzed multiplicity of taxes in Nigeria: issues, problems and solutions. The
objective of the study was to examine, among other things, the meaning of multiplicity of
taxes, its causes, impact on tax compliance and revenue yield. The study also discussed the
growing debate on the need to streamline the number of taxes in Nigeria in view of the low
yields of many of the taxes. The study considered the extent to which multiplicity of taxes
really exist in Nigeria, why the problems persist, it used documentary analysis and found that
Multiplicity of taxes infringes the cardinal principles of taxation. The study also found that
problem has lingered on also because all the tiers of government have failed to adequately
fund their department and agencies and this development has compelled them to embark on
aggressive revenue drive some of which verge on illegality in the name of increasing the
internally generated revenue.
Aigbepue and Ainabor (2011) analyzed issues and challenges of Nigerian fiscal federalism.
The objective of the study was to look at these issues within the purview of Nigerian federal
structure involving sharing of revenue from the federation account by the federating units,
fiscal decentralization and the allocation of expenditure and tax-raising power among the
federal, state and local government. The study found that there is a prospect of a stable
federation if anchored on arrangement rooted in equity, fairness and justice. That is the
evolution of an equitable revenue formula that would be in the best long-term interest of a
stable Nigerian federation.
Zhou and Chilunjika (2013) analyzed the challenges of Self-Financing in Local Authorities
in Zimbabwe. The objective of the study was to examine self-financing efforts in local

14
government authorities in Zimbabwe against the background of perceived declines in
transfers from central government. The study used documentary analysis and findings
indicated that while local authorities in Zimbabwe exercise varying taxing and expenditure
powers under the rubric of fiscal decentralization, creating a buoyant self-financing base was
compromised by interlocking factors that include continued central government grip, limited
revenue base, failure to devise long range revenue optimizing strategies, political
interference, and an institutionalized culture of rent seeking.
Mukabi, Barasa and Viola (2015) analyzed devolved governance in Kenya; is it a False Start
in Democratic Decentralization for Development? The purpose of the study was to measure
the extent to which these challenges have been addressed after the decentralized devolved
system of governance was introduced. The study adopted a diagnostic approach based on
desk research to investigate these Kenyan challenges, draws from expert opinion and does
comparative analysis based on lessons from other devolved political systems in Africa and
the world. The study explored and discussed these challenges with a view of informing other
world democracies that have or are on the verge of adopting this strategy of decentralization
for development to be conscious of these pitfalls and design appropriate structures and a roll
out framework for circumventing them. It also informs constitutional development of
devolved government structures. The study found that the County Governments in Kenya
have indeed made significant progress in involvement of stakeholders on development at
County level, a realization of devolvement of funds, creation of employment opportunities, a
more accountable political system and devolvement of certain key functions to the local
level.
Waswa, Sudi, George, Juma, and Kituyi (2013) made an analysis of fiscal decentralization as
a strategy for improving revenue performance in Ugandan local governments. This study was
conducted to examine the impact of fiscal decentralization on revenue performance in
Ugandan local governments. A cross-sectional survey research design involving both
quantitative qualitative research methods were used in the study. A questionnaire was
employed to collect and analyze quantitative data, while an interview guide was used to
collect qualitative data. The study population included council members and technical
members of staff in three local government districts of Mbale, Manafwa and Kampala. Both
random and purposive sampling techniques were used to select a total sample of 600
respondents. Results indicated that fiscal decentralization helps to reduce corruption, leads to
improved revenue performance, enables better planning for revenue collection, reduces on
tax evasion, enables the local unit to get more sources of revenue, makes it easy to handle
taxation disputes and also that Fiscal decentralization reduces on taxation bureaucracies
hence better revenue performance.
Frederick, Benjamin and Mukasharangabo (2013) assessed challenges faced by tax collectors
and tax payers in rural areas in Rwanda, Nyaruguru District. Their study aimed at assessing
the problems facing tax collectors and tax payers in Nyaruguru District. The research used
descriptive and comparative research design. The target population included taxpayers and
tax collectors of Nyaruguru District among whom questionnaires were administered to a
selected sample. The statistical treatment of data was done using the frequencies and
percentages through SPSS software. The research found rental tax, property tax, and trading
license tax being the types of tax collected in Nyaruguru District. The identified challenges
facing tax collectors of Nyaruguru District included mainly poor tax payers’ perception on

15
the relevance of tax payment, taxpayers’ delay in tax declaration, starting business activity
without trading license and traditional mode of tax collection. The major causes of tax
collection problems included lack of tax taxpayers’ education about tax relevance, and
insufficient District means to equip tax collectors with means of transport.
2.3 Critical Review and Research Gap Identification
Richard ( 2015) analyzed tax and Fiscal decentralization in Canada. The general objective of
the study was to discuss aspects of taxation subject that have turned out to be important in
policy work on the issue in Canada. Even if they discussed the meaning and rationale of
fiscal decentralization and found that there was much that has to be disentangled before one
can approach the issue in a particular policy setting, they focused on secondary data only.
Gediminas, Kęstutis and Neringa ( 2013) analyzed development of local municipality taxes
and principles of fiscal policy in Lithuania. Even if they analyzed the possibility of
developing fiscal decentralization and its main part and found, that non-tax income, which
can be mostly influenced by local governments and local taxes comprises but an insignificant
share of all local governments income and they significance were not great, they did not
analyzed report of tax collectors in the case under study using statistical approaches.
Jing and Heng (2005) assessed the fiscal decentralization, revenue and expenditure
assignments and growth in China. The objective of this study was to show divergence rather
than convergence, in revenue and expenditures. Even if they examined the relationship
between fiscal decentralization and economic growth over two phases of fiscal
decentralization in China and found that, there was contradiction between the theory and
evidence in the China, they did not analyze both primary and secondary data. Suwandi and
Warokka (2013) analyzed Fiscal Decentralization and Special Local Autonomym in
Indonesia. Although the study examined the effects of fiscal decentralization and specific
local autonomy on economic growth, employment, poverty, and welfare in the special
province Papua and found that the economic development strategies in Indonesia’s less-
developed regions should be started with a bigger autonomy transfer program to those
regions and simultaneously enhanced it by special budget allocation to trigger and support
the development, the study did not focus on both decentralized tax and public expenditures in
the country.
Okafor (2012) analyzed tax revenue generation and nigerian economic development. Even if
the objective of the study was to explore the impact of income tax revenue on the economic
growth of Nigeria as peroxided by the gross domestic product (GDP) and found that there is
no significant relationship between federally collected tax revenue and the GDP in Nigeria,
they did not show the level of relationship of variables under study. Waswa,Sudi,
George,Juma, and Kituyi (2013) made an analysis of fiscal decentralization as a strategy for
improving revenue performance in Ugandan local governments and found that fiscal
decentralization helps to reduce corruption, leads to improved revenue performance, enables
better planning for revenue collection, reduces on tax evasion, enables the local unit to get
more sources of revenue, makes it easy to handle taxation disputes and also that Fiscal
decentralization reduces on taxation bureaucracies hence better revenue performance, they

16
did not analyze the relationship between variables under study using Pearson correlation
coefficient to establish the level and direction of relationship.
Frederick, Benjamin and Mukasharangabo (2013) assessed challenges faced by tax collectors
and tax payers in rural areas and found rental tax, property tax, and trading license tax being
the types of tax collected in Nyaruguru District. The identified challenges facing tax
collectors of Nyaruguru District included mainly poor tax payers’ perception on the
relevance of tax payment, taxpayers’ delay in tax declaration, starting business activity
without trading license and traditional mode of tax collection, but they did not analyze the
contribution of decentralized tax to public expenditures. Therefore, the study found a gap,
whereby other studies did not analyzed the contribution of decentralized tax system on public
expenditures using, qualitative and quantitative approaches through statistical methods.
2.4 Theoretical Framework
This study guided by both wisdom in the fiscal federalism theory and canons of taxation
theory, the study chose these two theories because are related to taxation and public
expenditures.
2.4.1 Wisdom in the fiscal federalism theory
According to Bardhan (2002) the conventional wisdom in the fiscal federalism theory
developed by Oates in 1972, it is stated that decentralization is to be preferred when tastes
are heterogeneous and there are no spillovers across jurisdictions. With spillovers and no
heterogeneity, a central government providing a common level of public goods and services
for all localities is more efficient; with spillovers, decentralization leads to under-provision of
local public goods, as local decision makers do not take into account benefit going to other
districts.
2.4.2 Canons of Taxation Theory
According to Wales (2008) canons of taxation theory developed by Adam Smith in 1776,
what constitutes a “fair tax” has been the subject of debate since Adam Smith proposed his
four canons of taxation in The Wealth of Nations in 1776. Canons of Taxation are the main
basic principles set to build a 'Good Tax System'. They were first originally laid down by
economist Adam Smith in his famous book "The Wealth of Nations". In this book, Adam
smith regarded as the "Godfather" of economics only gave four canons of taxation. These
original four canons are now known as the "Original or Main Canons of Taxation". As the
time changed, governance expanded and became much more complex than what it was at the
Adam Smith's time. Soon a need was felt by modern economists to expand Smith's principles
of taxation and as a response they put forward some additional modern canons of taxation
(Richard, 2010).
The theory aims at providing economic and social justice to the people. According to this
principle, every person should pay to the government depending upon his ability to pay. The
rich class people should pay higher taxes to the government, because without the protection
of the government authorities (Police, Defense, etc.) they could not have earned and enjoyed
their income. Adam Smith argued that the taxes should be proportional to income, i.e.,
citizens should pay the taxes in proportion to the revenue which they respectively enjoy
under the protection of the state.

17
According to Adam Smith (1776), the tax which an individual has to pay should be certain,
not arbitrary. The tax payer should know in advance how much tax he has to pay, at what
time he has to pay the tax, and in what form the tax is to be paid to the government. In other
words, every tax should satisfy the canon of certainty. At the same time a good tax system
also ensures that the government is also certain about the amount that will be collected by
way of tax. The mode and timing of tax payment should be as far as possible, convenient to
the tax payers. For example, land revenue is collected at time of harvest; income tax is
deducted at source. Convenient tax system will encourage people to pay tax and will increase
tax revenue. This principle states that there should be economy in tax administration. The
cost of tax collection should be lower than the amount of tax collected. It may not serve any
purpose, if the taxes imposed are widespread but are difficult to administer. Therefore, it
would make no sense to impose certain taxes, if it is difficult to administer.

18
2.5 Conceptual Framework
This study considers a conceptual framework as a theoretical structure of assumptions,
principles, and rules that holds together the ideas comprising a broad concept of the research.
Figure 2.1: Conceptual Framework
Independent Variable Dependent Variable
Source: Researcher developed
Figure 2.1 indicates relationship between the variables under study; decentralized tax revenue
where the determinants under study were fixed asset tax, trading license tax and rental
income tax; the study also conceptualized transparency, responsiveness to clients’ needs and
budget financing.
2.6 Summary
The literature review as presented in this chapter provides an understanding of theory
concerning taxation its benefits in raising revenue and contributing to government expenses
implicating economic growth which can lead so far to self-financing. Many studies did
studies on the contribution of tax systems in financing local government, most of them
stressed on the decentralized tax revenues. This leaves a gap to know how much tax
decentralization could contribute to effectiveness of public expenditures in Rwanda. The
researcher needs to focus the study in local government taking Huye district as a case study.
Decentralized Tax
System
Fixed asset tax
Trading license tax
Rental income tax
Public Expenditures
Transparency
Responsiveness to clients’ needs
Budget financing
Intervening Variables
Tax policies
Canons of Taxation
19
CHAPTER THREE: RESEARCH METHODOLOGY
3.0. Introduction
This chapter presents the methodology to be used to collect data from the field. It explains in
detail the methodological aspects that will be used to complete this analytical research work
in Huye District. It describes such elements as the research design, target population, sample
design, data collection methods, data analysis procedure and ethical consideration.
3.1. Research Design
A research design can be technically defined as a pre-arranged program for collecting and
analyzing the information needed. Satisfy study objectives at the lowest cost (Kothari, 1985).
This study will use descriptive research design as it will involve use of written questionnaires
administered to respondents. Kothari (1985) recommends descriptive and analytical design as
it allows the researcher to describe, record, analyze and report conditions. The study adopted
both quantitative and qualitative approaches. As regards quantitative data, it includes
statistical expressions, percentages and frequencies. Quantitative approach was used to
establish the relationship between variables. Therefore, the research design was descriptive-
analytical design.
3.2 Target Population
According to Lim and Ting (2009), a population is any complete group that shares a common
set of characteristics. In this research, the total population comprised two strata, such as 18
District staff (four District planning staffs, 14 sector accountant officers) 11,114 taxpayers in
Huye District (832 in Tumba, 281 in Huye, 4914 in Ngoma, 482 in Ruhashya, 120 in Simbi,
402 in Maraba, 444 In Gishamvu, 731 in Mukura, 59 in Rwaniro, 834 in Rusatira, 297 in
Karama, 483 in Kigoma, 615 in Mbazi and 620 in Kinazi) (Huye District, 2014). Hence, the
total target population will be 11,132 people.
20
3.3 Sample Design
According to Ross (2005) sampling in research is generally conducted in order to permit the
detailed study of part, rather than the whole, of a population. The information derived from
the resulting sample is customarily employed to develop useful generalizations about the
population. These generalizations may be in the form of estimates of one or more
characteristics associated with the population, or they may be concerned with estimates of the
strength of relationships between characteristics within the population.
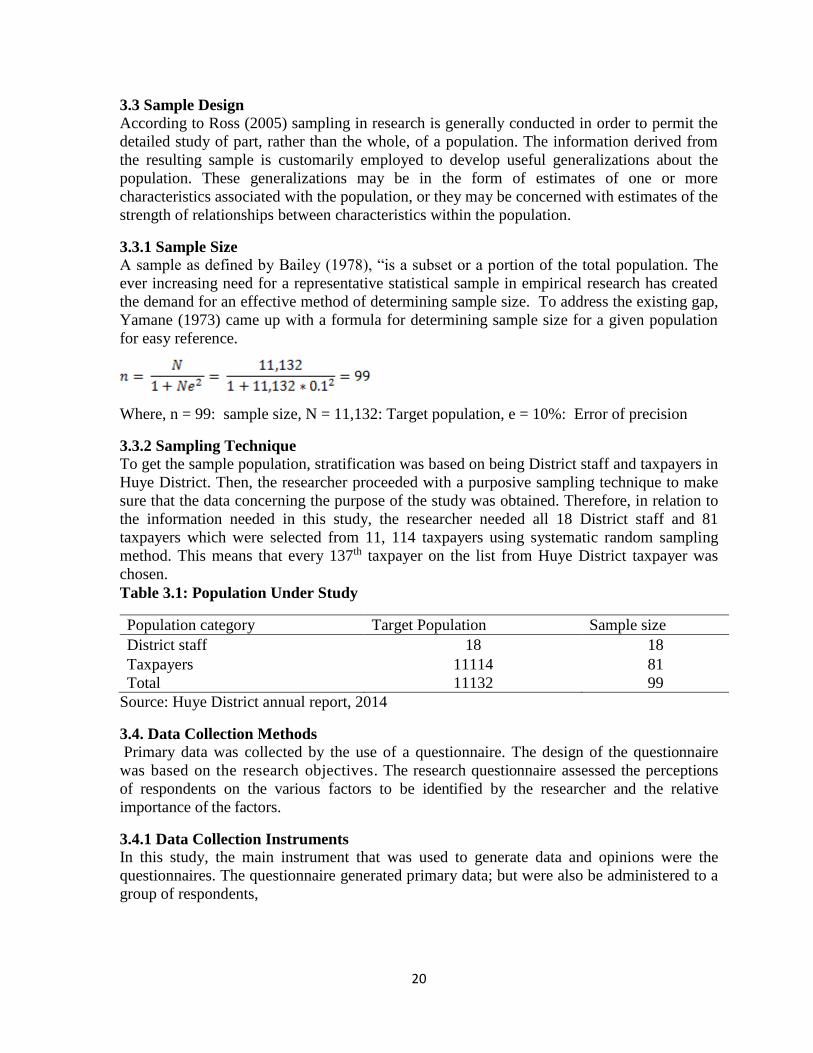
3.3.1 Sample Size
A sample as defined by Bailey (1978), “is a subset or a portion of the total population. The
ever increasing need for a representative statistical sample in empirical research has created
the demand for an effective method of determining sample size. To address the existing gap,
Yamane (1973) came up with a formula for determining sample size for a given population
for easy reference.
Where, n = 99: sample size, N = 11,132: Target population, e = 10%: Error of precision
3.3.2 Sampling Technique
To get the sample population, stratification was based on being District staff and taxpayers in
Huye District. Then, the researcher proceeded with a purposive sampling technique to make
sure that the data concerning the purpose of the study was obtained. Therefore, in relation to
the information needed in this study, the researcher needed all 18 District staff and 81
taxpayers which were selected from 11, 114 taxpayers using systematic random sampling
method. This means that every 137th taxpayer on the list from Huye District taxpayer was
chosen.
Table 3.1: Population Under Study
Population category Target Population Sample size
District staff 18 18
Taxpayers 11114 81
Total 11132 99
Source: Huye District annual report, 2014
3.4. Data Collection Methods
Primary data was collected by the use of a questionnaire. The design of the questionnaire
was based on the research objectives. The research questionnaire assessed the perceptions
of respondents on the various factors to be identified by the researcher and the relative
importance of the factors.
3.4.1 Data Collection Instruments
In this study, the main instrument that was used to generate data and opinions were the
questionnaires. The questionnaire generated primary data; but were also be administered to a
group of respondents,
21
3.4.2 Administration of Data Collection Instruments
Questionnaire is an effective method to seek a large sample size for quantitative data
analysis. The questionnaire tried to achieve several keys features of research objectives.
Again, the questionnaire was distributed exclusively to the respondents with reading and
writing abilities. The questionnaires were distributed to 18 District staff and 81 taxpayers
and returned after five days.
3.4.3 Reliability and Validity
The reliability and validity are very important because it may affect the findings and
recommendations of the study. During the research process, the researcher was conscious
about these two features and these were given special attention. While setting the
questionnaire, researcher was highly concentrated on the issue that the questionnaire would
be simple and easily understandable by the respondents so that it provides relevant
information.
Validity refers to the degree to which a study is based on truth or reason; validity is therefore
concerned with the study success at measuring what the researcher set out to measure
(Campbell, Shadish& Cook, 2002). In the present study, the validity was ensured by
submitting the research instruments to the supervisor and other lecturers to check them
before being administered. Then their contributions and adjustments were of utmost
importance to ensure that questionnaires are consistent, concise, intelligible, and clear so that
the instruments can really measure adequately what they intend to measure in accordance
with the objectives and the questions of the study.
According to George & Miller (2003), reliability is concerned with the accuracy of the actual
measuring instrument or procedure. Thus, to ensure the reliability, the researcher pretested
the research instruments before they are used. Therefore the study was conducted in two
phases. In the first phase the researcher surveyed a small number of people (10) with the
same characteristics. In the second phase, the researcher considered necessary adjustments,
before administering the instruments to the intended study respondents. After, this the study
tested Croanbach Alpha which and was 89.9% for taxpayers questionaire and 90.1% for
staff questionnaire.
3.5 Data Analysis Procedures
The data were collected and coded into Statistical Package for Social Sciences (SPSS). This
computer software was used to analyse the data to produce the results for interpretation. The
analysis was done in a way that it reflects the objectives as developed in the study and
verified how findings meet each of them. To analyze the data, descriptive statistics and
inferential statistics were generated in percentages and frequencies, and used in the
interpretation of the findings of the objectives.
3.6 Ethical Consideration
Kvale (1996) contends that ethical concerns are very important in research as they protect
participant’s privacy and anonymity with regard to their personal information. This is further
supported by this study why researcher should behave ethically. In this study, the purpose of
the study was clearly explained to the respondents that it was purely academic so as not to
ignite false expectations. Respondents were informed that they are free to withdraw in the
22
course of the study if they wished to. On the other hand, anonymity or confidentiality refers
to the protection of respondents’ privacy by changing their names and identifying features or
simply publishing personal data behind a shield anonymity. However the problem with
confidentiality is that insiders still recognize the disguised locations or persons. In such
situations, publication of information should be done only when the research subject has
agreed to that and that it should be explicitly stated on the consequences this may have
(Kvale, 1996). In this study, the Huye District staff were guaranteed that their data will be
treated confidentially and permission was given by the informants to publish the results once
the findings is ready. In this way, this study took ethical consideration into account and this
made it professional and at the same time protecting the rights to privacy of the institutions
studied as well as the research subjects involved in the study. To meet ethical guidelines,
respondents were asked to authorize the use of their information for the sake of this study.
23
CHAPTER FOUR: RESEARCH FINDINGS AND DISCUSSION
4.0 Introduction
This chapter presented, analyzed and interpreted the findings of the study in relation to the
objectives. The researcher presented the collected data using tables and figures from which
percentages and frequencies were ascertained to provide a basis for analysis and
interpretations.
4.1 Demographic Characteristics of Respondents
In this section, the researcher presents the findings of the research extracted from the data
collection instruments that included questionnaires. The researcher presents the respondents’
profile in relation to age, gender, education and experience. This was done in order to form a
basis of making conclusions on the views that respondents gave on the decentralized tax
system and effectiveness of public expenditures in Rwanda.
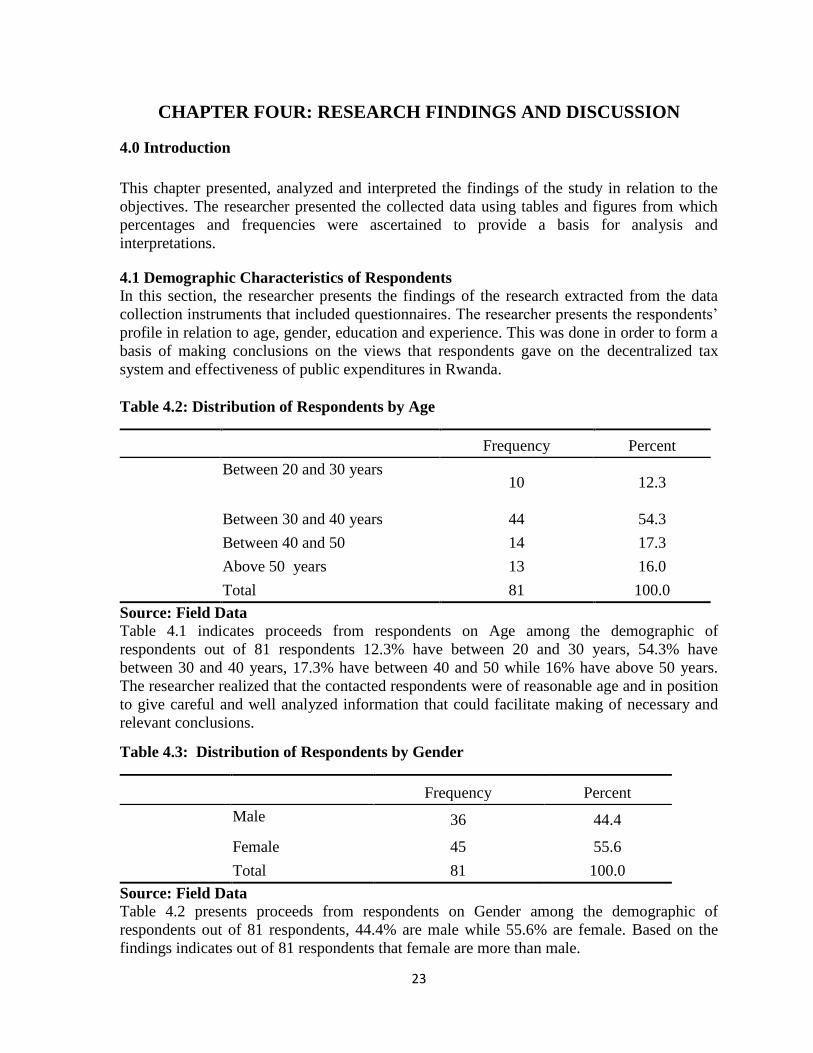
Table 4.2: Distribution of Respondents by Age
Frequency Percent
Between 20 and 30 years 10 12.3
Between 30 and 40 years 44 54.3
Between 40 and 50 14 17.3
Above 50 years 13 16.0
Total 81 100.0
Source: Field Data
Table 4.1 indicates proceeds from respondents on Age among the demographic of
respondents out of 81 respondents 12.3% have between 20 and 30 years, 54.3% have
between 30 and 40 years, 17.3% have between 40 and 50 while 16% have above 50 years.
The researcher realized that the contacted respondents were of reasonable age and in position
to give careful and well analyzed information that could facilitate making of necessary and
relevant conclusions.
Table 4.3: Distribution of Respondents by Gender
Frequency Percent
Male 36 44.4
Female 45 55.6
Total 81 100.0
Source: Field Data
Table 4.2 presents proceeds from respondents on Gender among the demographic of
respondents out of 81 respondents, 44.4% are male while 55.6% are female. Based on the
findings indicates out of 81 respondents that female are more than male.
24
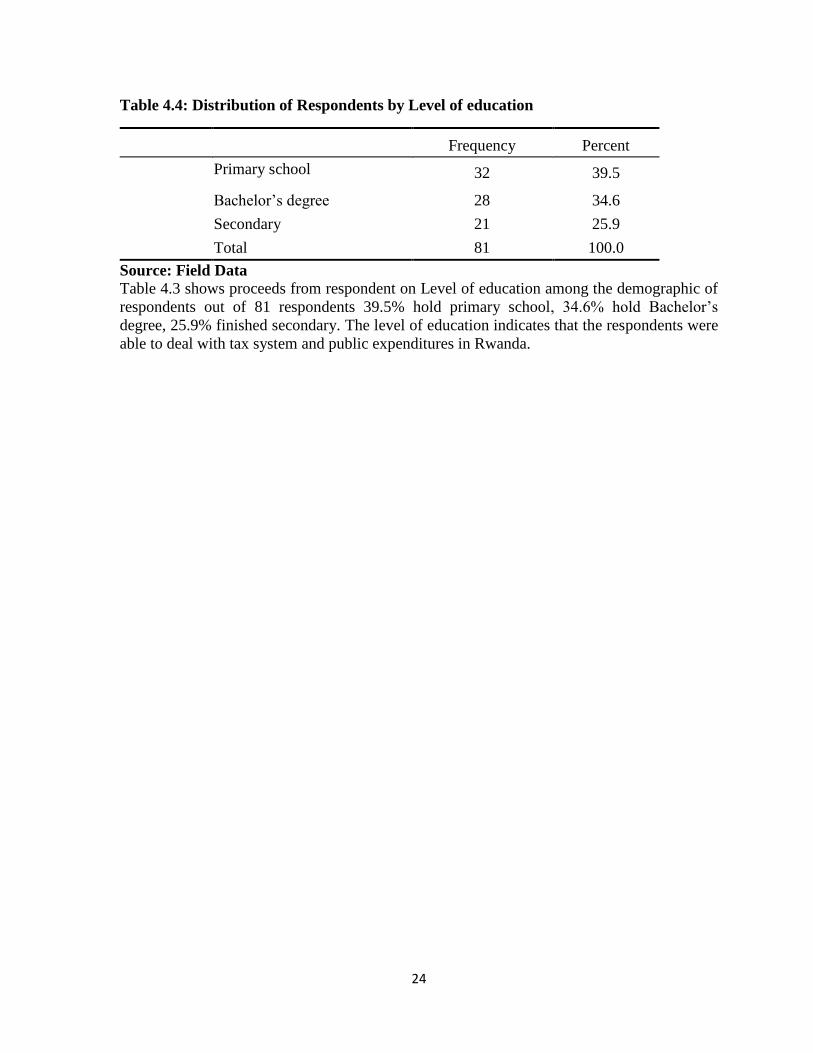
Table 4.4: Distribution of Respondents by Level of education
Frequency Percent
Primary school 32 39.5
Bachelor’s degree 28 34.6
Secondary 21 25.9
Total 81 100.0
Source: Field Data
Table 4.3 shows proceeds from respondent on Level of education among the demographic of
respondents out of 81 respondents 39.5% hold primary school, 34.6% hold Bachelor’s
degree, 25.9% finished secondary. The level of education indicates that the respondents were
able to deal with tax system and public expenditures in Rwanda.
25
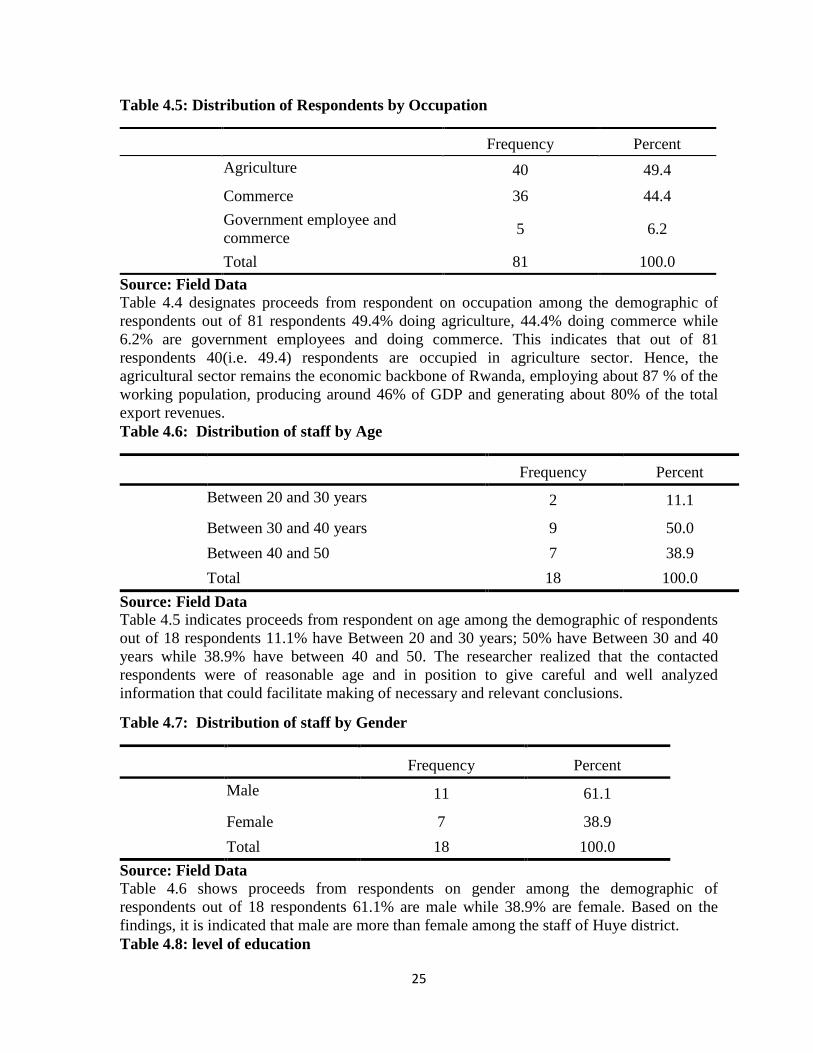
Table 4.5: Distribution of Respondents by Occupation
Frequency Percent
Agriculture 40 49.4
Commerce 36 44.4
Government employee and
commerce 5 6.2
Total 81 100.0
Source: Field Data
Table 4.4 designates proceeds from respondent on occupation among the demographic of
respondents out of 81 respondents 49.4% doing agriculture, 44.4% doing commerce while
6.2% are government employees and doing commerce. This indicates that out of 81
respondents 40(i.e. 49.4) respondents are occupied in agriculture sector. Hence, the
agricultural sector remains the economic backbone of Rwanda, employing about 87 % of the
working population, producing around 46% of GDP and generating about 80% of the total
export revenues.
Table 4.6: Distribution of staff by Age
Frequency Percent
Between 20 and 30 years 2 11.1
Between 30 and 40 years 9 50.0
Between 40 and 50 7 38.9
Total 18 100.0
Source: Field Data
Table 4.5 indicates proceeds from respondent on age among the demographic of respondents
out of 18 respondents 11.1% have Between 20 and 30 years; 50% have Between 30 and 40
years while 38.9% have between 40 and 50. The researcher realized that the contacted
respondents were of reasonable age and in position to give careful and well analyzed
information that could facilitate making of necessary and relevant conclusions.
Table 4.7: Distribution of staff by Gender
Frequency Percent
Male 11 61.1
Female 7 38.9
Total 18 100.0
Source: Field Data
Table 4.6 shows proceeds from respondents on gender among the demographic of
respondents out of 18 respondents 61.1% are male while 38.9% are female. Based on the
findings, it is indicated that male are more than female among the staff of Huye district.
Table 4.8: level of education

26
Frequency Percent
Master’s degree 7 38.9
Bachelor’s degree 11 61.1
Total 18 100.0
Source: Field Data
Table 4.7 designate proceeds from respondents on level of education among the demographic
of respondents out of 18 respondents 61.1% hold Bachelor’s degree while 38.9% hold
Master’s degree.
The level of education indicates that the respondents were able to deal with decentralized tax
revenue and effective public expenditures, whereby they gave accurate information regarding
research questions and objectives.
Table 4. 9: Distribution of staff by Occupation
Frequency Percent
District planning staffs 4 22.2
Sector accountant officers 14 77.8
Total 18 100.0
Source: Field Data
Table 4.8 shows proceeds from respondents on occupation out of 18 respondents, 22.6%
were District planning staffs while 77.8% are sector accountants. The researcher focused on
the above staff because they make linkage between Tax system and Public expenditures.
Thus, they are enough informed about decentralized tax revenue and effective public
expenditure from this background, it implies that the researcher got accurate information
concerning the tax decentralization revenue and public expenditures.
4.2 Research Findings
This section presents the results in terms of both analysis and interpretation in relation to
research objectives, such as the effect of decentralized fixed asset tax systems to the
effectiveness of current expenditures; the main problems faced by taxpayers in relation to
trading license tax in Rwanda; the benefits brought by rental income tax decentralization in
development expenditures; the relationship between decentralized tax system and
effectiveness of public expenditures.

27
4.2.1 The effect of Decentralized Fixed Asset Tax system to the Effectiveness of Current
Expenditures
Table 4. 10: Tax capacity
Frequency Percent
strongly agree 4 22.2
Agree 5 27.8
Disagree 9 50.0
Total 18 100.0
Source: Field Data
Table 4.9 presents proceeds from respondents on tax capacity out of 18 respondents, 4(i.e.
22.2%) respondents chose strongly agree, 5(i.e. 27.8%) respondents chose agree while 9( i.e
50%) respondents chose disagree. Hence, tax capacity refers to the predicted tax-to-gross
domestic product ratio that can be estimated empirically, taking into account a country's
specific macroeconomic, demographic, and institutional features, which all change through
time.
Table 4. 11: Tax regulations
Frequency Percent
strongly agree 6 33.3
Agree 7 38.9
Disagree 5 27.8
Total 18 100.0
Source: Field Data
Table 4.10 indicates proceeds from respondents on tax regulation out of 33.3% select
strongly agree, 38.9% select agree while 27.8% select disagree. Hence, tax regulation play
important role to RRA to control everything concerning tax and this can play important role
to avoid errors and fraud and also helps taxpayer to pay tax based on the low.
Table 4.12: Improved fairness
Frequency Percent
strongly agree 9 50.0
Agree 4 22.2
Undecided 5 27.8
Total 18 100.0
Source: Field Data
Table 4.11 shows proceeds from respondents on improved fairness 50% tick strongly agree,
22.2% tick agree while 27.8% tick undecided. Hence, the vast majority of Rwandan do the
right thing, and our systems are built on trust and voluntary compliance, Around 95 per cent
of our tax revenue comes from taxpayers who pay voluntarily. Our high level of willing

28
participation is the result of many factors such as support in paying taxes, trust in the fairness
of our system, strength of our laws and effectiveness of the RRA.
Table 4.13: Level of tax burden
Frequency Percent
strongly agree 9 50.0
Agree 5 27.8
Disagree 4 22.2
Total 18 100.0
Source: Field Data
Table 4.12 indicate proceeds from respondents on level of tax burden out of 18 respondents
50% chose strongly agree, 27.8% chose agree while 22.2% disagreed. In most advanced
economies the fiscal responsibility assigned to sub-national government levels has recently
been increased with the aim of improving the efficiency in the allocation of public resources
and possibly boosting economic growth so, tax burden is one of the determinants that affect
decentralized fixed asset tax revenue to the effectiveness of current expenditures as analysis
of the effect of a particular tax on the distribution of economic welfare.
Table 4.14: Types of tax paid
Frequency Percent
strongly agree 6 33.3
Agree 10 55.6
Disagree 2 11.1
Total 18 100.0
Source: Field Data
Table 4.13 shows proceeds from respondents on types of tax paid 33.3% tick strongly agree,
55.6% tick agree while 11.1% tick undecided. The majority of respondents perceived that
types of tax paid affect effectiveness of current expenditures in Huye District, this implies
that effectiveness of current expenditures strongly depend on the most type of tax paid in the
District.
Table 4.15: Monitoring and evaluation
Frequency Percent
strongly agree 7 38.9
Agree 6 33.3
Disagree 5 27.8
Total 18 100.0
Source: Field Data
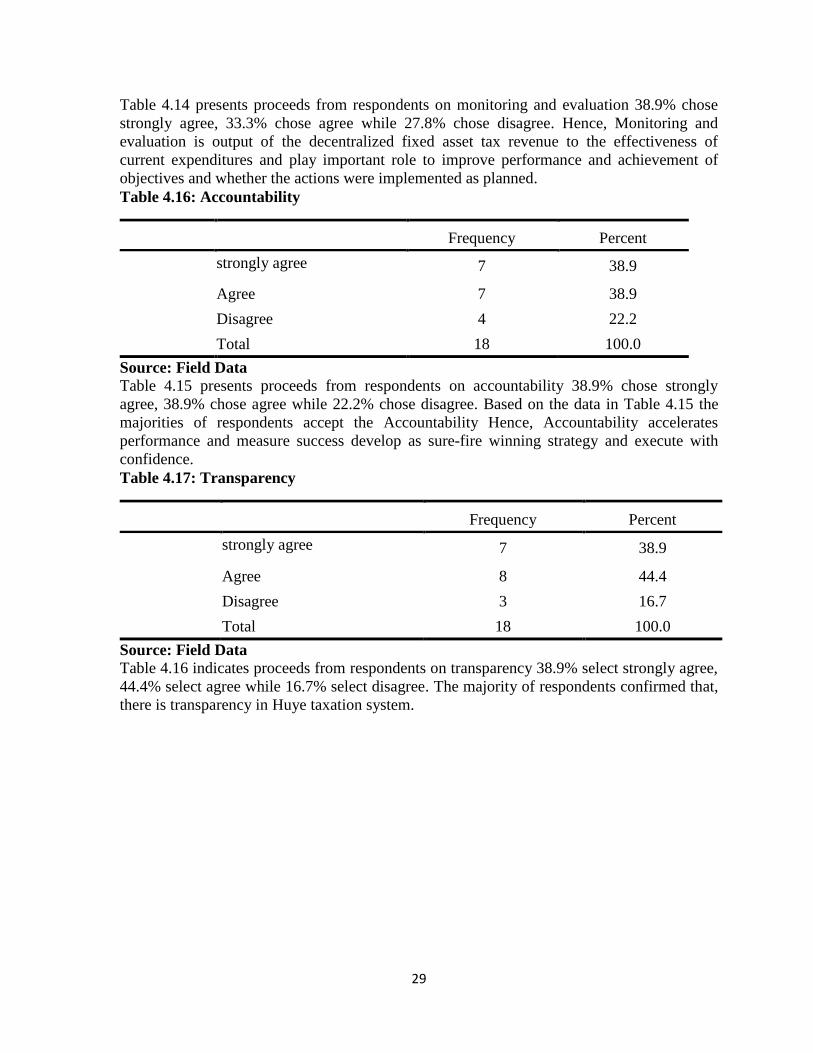
29
Table 4.14 presents proceeds from respondents on monitoring and evaluation 38.9% chose
strongly agree, 33.3% chose agree while 27.8% chose disagree. Hence, Monitoring and
evaluation is output of the decentralized fixed asset tax revenue to the effectiveness of
current expenditures and play important role to improve performance and achievement of
objectives and whether the actions were implemented as planned.
Table 4.16: Accountability
Frequency Percent
strongly agree 7 38.9
Agree 7 38.9
Disagree 4 22.2
Total 18 100.0
Source: Field Data
Table 4.15 presents proceeds from respondents on accountability 38.9% chose strongly
agree, 38.9% chose agree while 22.2% chose disagree. Based on the data in Table 4.15 the
majorities of respondents accept the Accountability Hence, Accountability accelerates
performance and measure success develop as sure-fire winning strategy and execute with
confidence.
Table 4.17: Transparency
Frequency Percent
strongly agree 7 38.9
Agree 8 44.4
Disagree 3 16.7
Total 18 100.0
Source: Field Data
Table 4.16 indicates proceeds from respondents on transparency 38.9% select strongly agree,
44.4% select agree while 16.7% select disagree. The majority of respondents confirmed that,
there is transparency in Huye taxation system.

30
Table 4.18: Responsiveness to clients’ needs
Frequency Percent
strongly agree 4 22.2
Agree 9 50.0
Disagree 5 27.8
Total 18 100.0
Source: Field Data
Table 4.17 shows proceeds from respondents on responsiveness to clients ‘needs 22.2%
tick strongly agree, 50% tick agree while 27.8% tick disagree. Hence, the objective of
developing a tax plan in the District is to organize tasks and allocate the resources
accordingly, so that the District could achieve its specified goals related to tax within desired
time frame.
Table 4.19: Budget financing
Frequency Percent
Strongly Agree 4 22.2
Agree 8 44.4
Disagree 6 33.3
Total 18 100.0
Source: Field Data
Table 4.18 indicates proceeds from respondents on Budget financing 22.2% select strongly
agree, 44.4% select agree while 33.3% select disagree. Hence, budget financing is prediction
of future cash receipts and expenditures for a particular time period. It usually covers a
period in the short-term future. The cash flow budget helps the Huye district determine when
tax collected will be sufficient to cover expenses.
Table 4.20: Target achievement
Frequency Percent
strongly agree 4 22.2
Agree 6 33.3
Disagree 8 44.4
Total 18 100.0
Source: Field Data
Table 4.19 presents proceeds from respondents on target achievement 22.2% chose strongly
agree, 33.3% chose agree while 44.4% chose disagree. Hence, target achievement for Huye
district is done after developing a plan through to the organize of tasks and allocate resources
accordingly so that Huye District can achieve its specified goals within it desired time frame.

31
Table 4.21: Citizen’s welfare
Frequency Percent
strongly agree 7 38.9
Agree 6 33.3
Disagree 5 27.8
Total 18 100.0
Source: Field Data
Table 4.20 indicates proceeds from respondents on citizen’s welfare 38.9% chose strongly
agree, 33.3% tick agree while 27.8% tick disagree. Hence, Good governance is the best way
to improve the welfare of senior citizens so funds intended for them will not be stolen and If
our taxes were collected equitably and spent wisely, we’d have more government hospitals
and social services. Let’s pray that our officials see the light and there are other benefits that
the government can extend to the elderly to make their remaining lives blissful. We all know
that most of these senior citizens are retirees and their only source of income is their monthly
pension. More often than not, their pensions are based on their salaries from years and years
ago. The amount has been eroded by inflation and most of them cannot cope with the present
prices of medicines and other basic necessities.
Table 4.22: Infrastructures
Frequency Percent
strongly agree 10 55.6
Agree 8 44.4
Total 18 100.0
Source: Field Data
Table 4.21 indicates proceeds from respondents on infrastructure 55.6% chose strongly agree
while 44.4% chose agree. From this finding, the study revealed that decentralized fixed asset
tax system affected the availability of infrastructure in Huye District, through the
effectiveness of current expenditures in the District.
4.2.2 The Main Problems Faced by Taxpayers in Relation to Trading License Tax in
Rwanda
This section focuses on the main problems faced by taxpayers in relation to trading license
tax in Rwanda, such as lack of information, lack of training, failure to file penalty, making
errors on their tax return, tax audit, data processing errors and unclear written communication
32
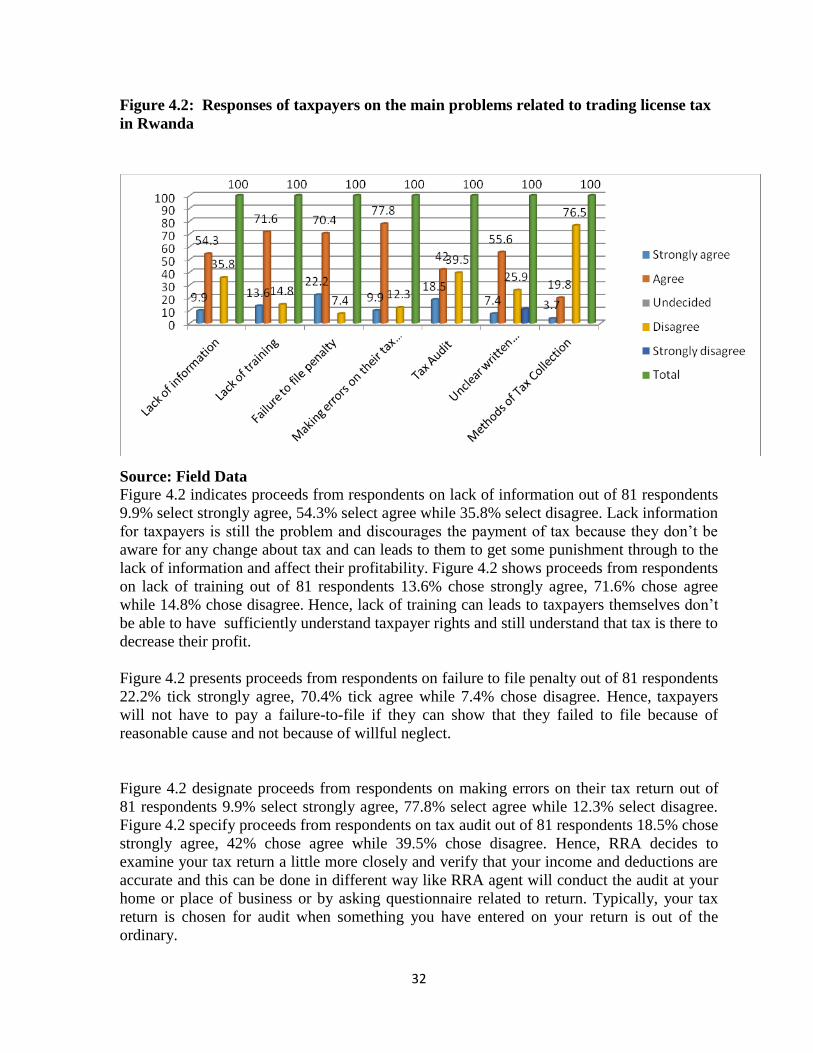
Figure 4.2: Responses of taxpayers on the main problems related to trading license tax
in Rwanda
Source: Field Data
Figure 4.2 indicates proceeds from respondents on lack of information out of 81 respondents
9.9% select strongly agree, 54.3% select agree while 35.8% select disagree. Lack information
for taxpayers is still the problem and discourages the payment of tax because they don’t be
aware for any change about tax and can leads to them to get some punishment through to the
lack of information and affect their profitability. Figure 4.2 shows proceeds from respondents
on lack of training out of 81 respondents 13.6% chose strongly agree, 71.6% chose agree
while 14.8% chose disagree. Hence, lack of training can leads to taxpayers themselves don’t
be able to have sufficiently understand taxpayer rights and still understand that tax is there to
decrease their profit.
Figure 4.2 presents proceeds from respondents on failure to file penalty out of 81 respondents
22.2% tick strongly agree, 70.4% tick agree while 7.4% chose disagree. Hence, taxpayers
will not have to pay a failure-to-file if they can show that they failed to file because of
reasonable cause and not because of willful neglect.
Figure 4.2 designate proceeds from respondents on making errors on their tax return out of
81 respondents 9.9% select strongly agree, 77.8% select agree while 12.3% select disagree.
Figure 4.2 specify proceeds from respondents on tax audit out of 81 respondents 18.5% chose
strongly agree, 42% chose agree while 39.5% chose disagree. Hence, RRA decides to
examine your tax return a little more closely and verify that your income and deductions are
accurate and this can be done in different way like RRA agent will conduct the audit at your
home or place of business or by asking questionnaire related to return. Typically, your tax
return is chosen for audit when something you have entered on your return is out of the
ordinary.

33
Figure 4.2 indicates proceeds from respondents on communication out of 81 respondents
7.4% specify strongly agree, 55.6% specify agree while 25.9% specify disagree.
Communication is playing important role to improve collaboration between RRA and
taxpayers because taxpayers can communicate their ideas and their challenges while RRA
communicate to taxpayer about any change happen about tax and this can improve the
understanding of taxpayers about tax.
Figure 4.2 designate proceeds from respondents on methods of tax collection out of 81
respondents 3.7% chose strongly agree, 19.8% chose agree while 76.5% chose disagree.
Based on the data in Figure 4.2, it is found that methods of tax collection is good and this
can increase the tax collection and reduce fraud because taxpayer understand the role of tax
in the District development.
Table 4.23: The way of tax Payment
Frequency Percent
Yes 81 100.0
Source: Field Data
Table 4.22 indicate proceeds from respondents on payment of tax out of 81 respondents
100% all of them they met problem related to tax payment. This shows that 81(i.e. 100%) of
respondents have the problem related to payment of tax. Hence, the challenges facing tax
payers which included lack of taxpayers’ education on tax payment and procedures, failure to
understand the relevance of paying taxes and higher tax rate imposed compared with
taxpayer’s business capacity and leads to the lack of tax morality and low tax payment
capacity.
Table 4.24: Availability of some information about local government finances
Frequency Percent
Any time 10 12.3
Some times 63 77.8
Many times 8 9.9
Total 81 100.0
Source: Field Data
Table 4.23 shows proceeds from respondents on availability of some information about local
government finances out of 81 respondents 12.3% chose any time, 77.8% chose some times
while 9.9% chose many times. Based on the data in table 4.23 indicates that information
about local government finances are available sometimes. Hence, tax-payers are responsible
to know information about local government finances about local government income and
expenditure, covering revenue and capital spending, council tax and non-domestic rates this
play important role to help tax payer to understand their contribution in development of
country.
Table 4.25: Ways to get information about tax

34
Frequency Percent
Radio 40 49.4
Television 9 11.1
Newspaper/Magazine 8 9.9
From district website 8 9.9
From district officials 7 8.6
From Rwanda Revenue Authority
officials 9 11.1
Total 81 100.0
Source: Field Data
Table 4.24 presents proceeds from respondents on ways to get information about Tax out of
81 respondents 49.1% select Radio, 11.1% select Television, 9.9% select
Newspaper/Magazine, 9.9% select From district website, 8.6% select From district officials
while 11.1% select Authority officials. Since above of 75% of population Rwanda listening
radio, Radio can the best way for taxpayer to get information and according to the data in
Table 4.24 indicates that most taxpayer get information through to the radio.
Table 4.26: Information about the amount of tax collected annually
Frequency Percent
Yes 12 14.8
No 69 85.2
Total 81 100.0
Source: Field Data
Table 4.25 indicates proceeds from respondents if they have information about the amount of
tax collected annually in their district or their sector out of 81 respondents 14.8% tick Yes
while 85.2% tick No. According to the findings, it is indicated that most of tax payers they
didn’t get information about the amount of tax collected annually in their district or their
sector this can discourage the tax payers because they didn’t recognize their contribution for
development of their district through to the lack of information.
Table 4.27: Information about the activities carried out and covered by the amount of
tax collected
Frequency Percent
Yes 6 7.4
Some 48 59.3
No 27 33.3
Total 81 100.0
Source: Field Data
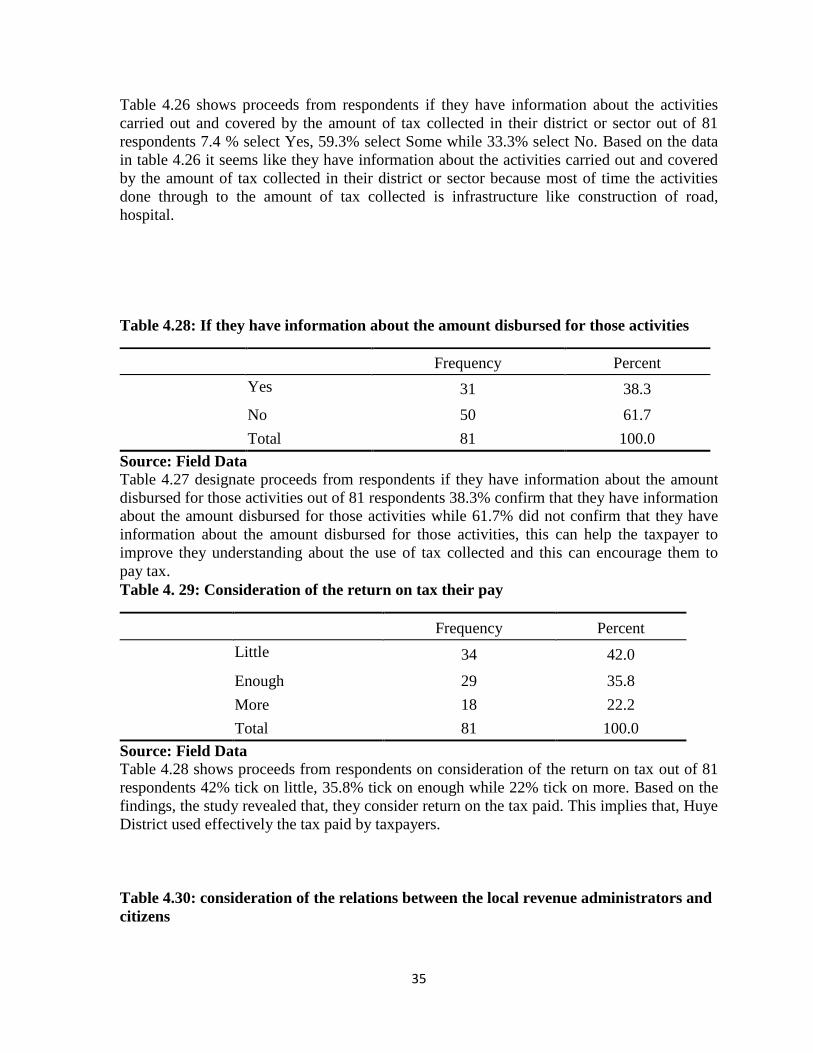
35
Table 4.26 shows proceeds from respondents if they have information about the activities
carried out and covered by the amount of tax collected in their district or sector out of 81
respondents 7.4 % select Yes, 59.3% select Some while 33.3% select No. Based on the data
in table 4.26 it seems like they have information about the activities carried out and covered
by the amount of tax collected in their district or sector because most of time the activities
done through to the amount of tax collected is infrastructure like construction of road,
hospital.
Table 4.28: If they have information about the amount disbursed for those activities
Frequency Percent
Yes 31 38.3
No 50 61.7
Total 81 100.0
Source: Field Data
Table 4.27 designate proceeds from respondents if they have information about the amount
disbursed for those activities out of 81 respondents 38.3% confirm that they have information
about the amount disbursed for those activities while 61.7% did not confirm that they have
information about the amount disbursed for those activities, this can help the taxpayer to
improve they understanding about the use of tax collected and this can encourage them to
pay tax.
Table 4. 29: Consideration of the return on tax their pay
Frequency Percent
Little 34 42.0
Enough 29 35.8
More 18 22.2
Total 81 100.0
Source: Field Data
Table 4.28 shows proceeds from respondents on consideration of the return on tax out of 81
respondents 42% tick on little, 35.8% tick on enough while 22% tick on more. Based on the
findings, the study revealed that, they consider return on the tax paid. This implies that, Huye
District used effectively the tax paid by taxpayers.
Table 4.30: consideration of the relations between the local revenue administrators and
citizens
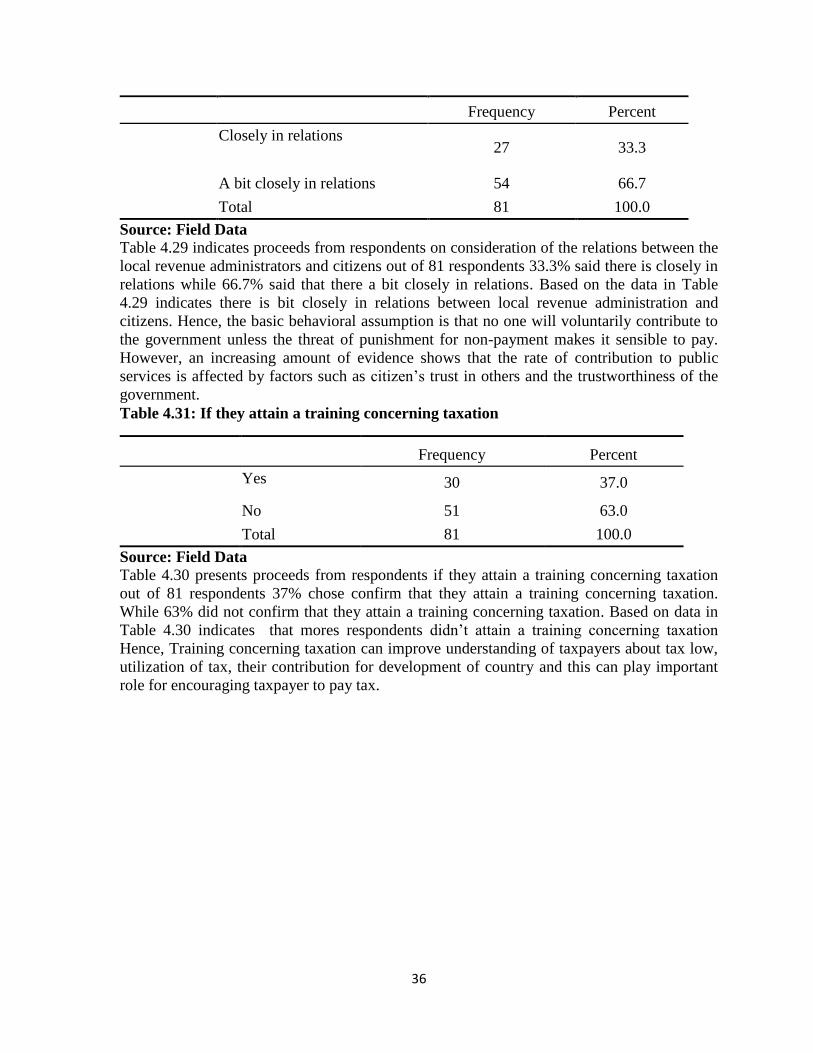
36
Frequency Percent
Closely in relations 27 33.3
A bit closely in relations 54 66.7
Total 81 100.0
Source: Field Data
Table 4.29 indicates proceeds from respondents on consideration of the relations between the
local revenue administrators and citizens out of 81 respondents 33.3% said there is closely in
relations while 66.7% said that there a bit closely in relations. Based on the data in Table
4.29 indicates there is bit closely in relations between local revenue administration and
citizens. Hence, the basic behavioral assumption is that no one will voluntarily contribute to
the government unless the threat of punishment for non-payment makes it sensible to pay.
However, an increasing amount of evidence shows that the rate of contribution to public
services is affected by factors such as citizen’s trust in others and the trustworthiness of the
government.
Table 4.31: If they attain a training concerning taxation
Frequency Percent
Yes 30 37.0
No 51 63.0
Total 81 100.0
Source: Field Data
Table 4.30 presents proceeds from respondents if they attain a training concerning taxation
out of 81 respondents 37% chose confirm that they attain a training concerning taxation.
While 63% did not confirm that they attain a training concerning taxation. Based on data in
Table 4.30 indicates that mores respondents didn’t attain a training concerning taxation
Hence, Training concerning taxation can improve understanding of taxpayers about tax low,
utilization of tax, their contribution for development of country and this can play important
role for encouraging taxpayer to pay tax.

37
Table 4. 32: satisfaction with the method used in collecting taxes
Frequency Percent
Transparent 72 88.9
Non transparent 9 11.1
Total 81 100.0
Source: Field Data
Table 4.31 presents perception of respondents if they satisfied with the method used in
collecting taxes out of 81 respondents 72(i.e. 88.9%) respondents select transparent while
9(i.e. 11.1%) respondents select non transparent. Hence, Taxes are the life-blood of
Government, and their prompt and certain availability an imperious need Tax collection is
necessary to ensure revenues are collected to fund governmental services, so the method used
collecting tax must be Claire where the taxpayer understand that payment of tax is not
punishment .
Table 4. 33: Problems they realize in tax administration and Collection
Frequency Percent
taxes collected are not all spent
on public services 41 50.6
too high taxes/fees 32 39.5
dishonest collectors 8 9.9
Total 81 100.0
Source: Field Data
Table 4.32 shows proceeds from respondents on problems they realize in tax administration
and collection out of 81 respondents said that problems they realize in tax administration and
collection is that taxes collected are not all spent on public services while 39.5% said that
problems they realize in tax administration and collection is too high taxes/fees while 9.9%
said that problems they realize in tax administration and collection is dishonest collectors.
Hence, most people think that they are paying too much tax at some time or other! At the
same time, we all want to know that roads are going to be built and maintained and that we
have sufficient police to keep us safe so the taxes you pay are used to pay for: transport,
education, health, law and order, housing, culture, media and sport, trade and industry,
environment, food and rural affairs, overseas development and defense. However When the
Government increases taxes it is because it needs more money to finance the services we
have said we want. Sometimes tax needs to be increased to help deal with economic
problems, for example, if the Government has borrowed too much.
Figure 4.3: Responses of staff on the main problems related to trading license tax in
Rwanda
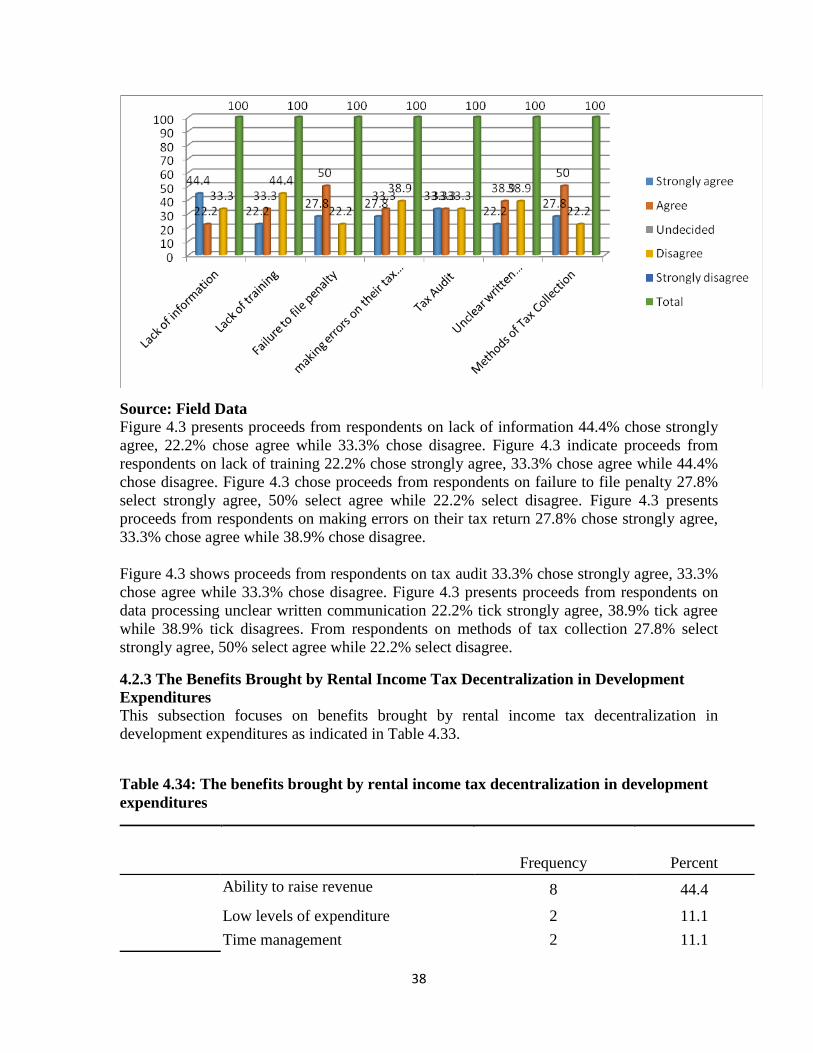
38
Source: Field Data
Figure 4.3 presents proceeds from respondents on lack of information 44.4% chose strongly
agree, 22.2% chose agree while 33.3% chose disagree. Figure 4.3 indicate proceeds from
respondents on lack of training 22.2% chose strongly agree, 33.3% chose agree while 44.4%
chose disagree. Figure 4.3 chose proceeds from respondents on failure to file penalty 27.8%
select strongly agree, 50% select agree while 22.2% select disagree. Figure 4.3 presents
proceeds from respondents on making errors on their tax return 27.8% chose strongly agree,
33.3% chose agree while 38.9% chose disagree.
Figure 4.3 shows proceeds from respondents on tax audit 33.3% chose strongly agree, 33.3%
chose agree while 33.3% chose disagree. Figure 4.3 presents proceeds from respondents on
data processing unclear written communication 22.2% tick strongly agree, 38.9% tick agree
while 38.9% tick disagrees. From respondents on methods of tax collection 27.8% select
strongly agree, 50% select agree while 22.2% select disagree.
4.2.3 The Benefits Brought by Rental Income Tax Decentralization in Development
Expenditures
This subsection focuses on benefits brought by rental income tax decentralization in
development expenditures as indicated in Table 4.33.
Table 4.34: The benefits brought by rental income tax decentralization in development
expenditures
Frequency Percent
Ability to raise revenue 8 44.4
Low levels of expenditure 2 11.1
Time management 2 11.1
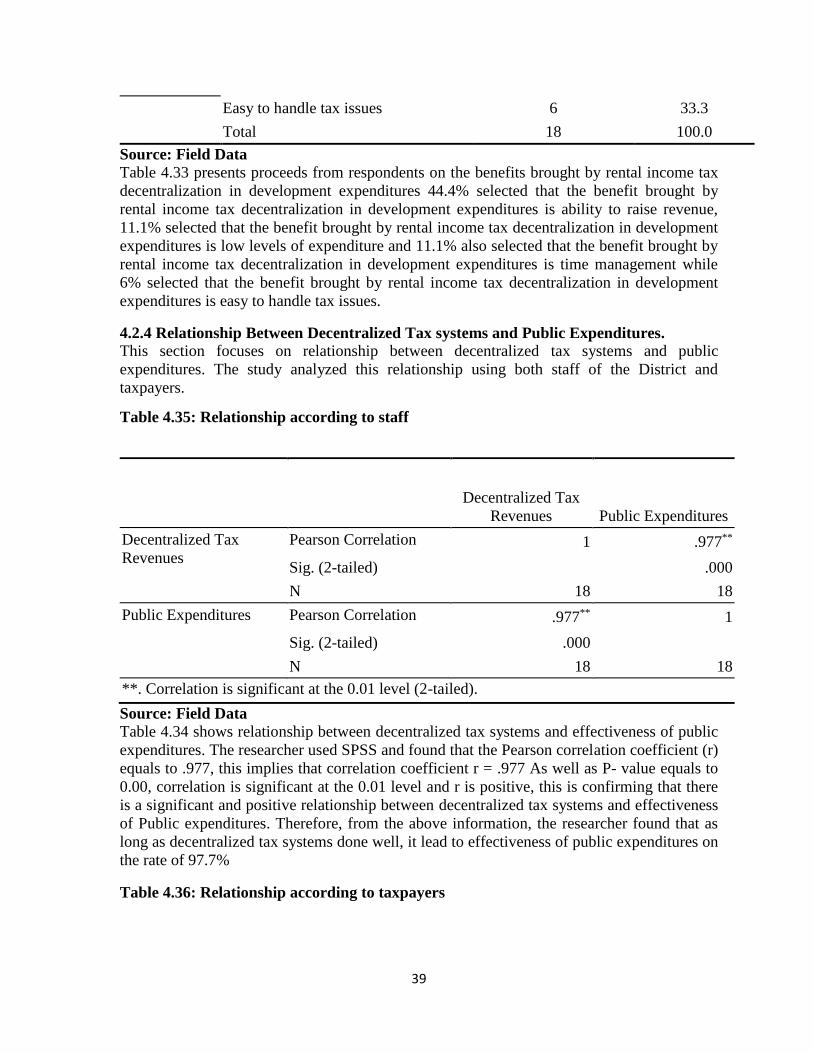
39
Easy to handle tax issues 6 33.3
Total 18 100.0
Source: Field Data
Table 4.33 presents proceeds from respondents on the benefits brought by rental income tax
decentralization in development expenditures 44.4% selected that the benefit brought by
rental income tax decentralization in development expenditures is ability to raise revenue,
11.1% selected that the benefit brought by rental income tax decentralization in development
expenditures is low levels of expenditure and 11.1% also selected that the benefit brought by
rental income tax decentralization in development expenditures is time management while
6% selected that the benefit brought by rental income tax decentralization in development
expenditures is easy to handle tax issues.
4.2.4 Relationship Between Decentralized Tax systems and Public Expenditures.
This section focuses on relationship between decentralized tax systems and public
expenditures. The study analyzed this relationship using both staff of the District and
taxpayers.
Table 4.35: Relationship according to staff
Decentralized Tax
Revenues Public Expenditures
Decentralized Tax
Revenues
Pearson Correlation 1 .977**
Sig. (2-tailed) .000
N 18 18
Public Expenditures Pearson Correlation .977** 1
Sig. (2-tailed) .000
N 18 18
**. Correlation is significant at the 0.01 level (2-tailed).
Source: Field Data
Table 4.34 shows relationship between decentralized tax systems and effectiveness of public
expenditures. The researcher used SPSS and found that the Pearson correlation coefficient (r)
equals to .977, this implies that correlation coefficient r = .977 As well as P- value equals to
0.00, correlation is significant at the 0.01 level and r is positive, this is confirming that there
is a significant and positive relationship between decentralized tax systems and effectiveness
of Public expenditures. Therefore, from the above information, the researcher found that as
long as decentralized tax systems done well, it lead to effectiveness of public expenditures on
the rate of 97.7%
Table 4.36: Relationship according to taxpayers

40
Decentralized Tax
revenue Public Expenditures
Decentralized Tax revenue Pearson Correlation 1 .885**
Sig. (2-tailed) .000
N 81 81
Public Expenditures Pearson Correlation .885** 1
Sig. (2-tailed) .000
N 81 81 **. Correlation is significant at the 0.01 level (2-tailed).
Source: Field Data
Table 4.35 indicates relationship between decentralized tax systems and Public Expenditures.
The researcher used SPSS and found that the Pearson correlation coefficient (r) equals to
.885, this implies that correlation coefficient r = .885 As well as P- value equals to 0.00,
correlation is significant at the 0.01 level and r is positive, this is confirming that there is a
significant and positive relationship between decentralized tax systems and effectiveness of
public expenditures in Rwanda. Therefore, from the above information, the researcher found
that as long as decentralized tax systems done well, and it will lead to Public Expenditures on
the rate of 88.5%.
Other researchers found that tax and fiscal decentralization contributed positively to the
management and utilization of resources in local Government. The results revealed that the
decentralization fund influenced significantly on government’s direct expenditure and
economic growth. The special local autonomy's fund has influenced considerably on
government’s indirect expenditure. Its effect has increased, through economic growth as the
intermediating variable, meaningfully on employment, poverty, and welfare. The results are
in line with the prior studies, which explore the consequences of decentralization and specific
autonomy to spur the economic growth in certain regions. Other study found that the
economic development strategies in Indonesia’s less-developed regions should be started
with a bigger autonomy transfer program to those regions and simultaneously enhanced it by
special budget allocation to trigger and support the development. The analysis found, that
non-tax income, which can be mostly influenced by local governments and local taxes
comprises but an insignificant share of all local governments income and they significance
were not great. Furthermore, as indicated in empirical studies of this study indicated local
authorities in Zimbabwe exercise varying taxing and expenditure powers under the rubric of
fiscal decentralization, creating a buoyant self-financing base was compromised by
interlocking factors that include continued central government grip, limited revenue base,
failure to devise long range revenue optimizing strategies, political interference, and an
institutionalized culture of rent seeking. The studies also found that the County Governments
in Kenya have indeed made significant progress in involvement of stakeholders on
41
development at County level, a realization of devolvement of funds, creation of employment
opportunities, a more accountable political system and devolvement of certain key functions
to the local level.
The research on Rwandan tax system found the major causes of tax collection problems
included lack of tax taxpayers’ education about tax relevance, and insufficient District means
to equip tax collectors with means of transport. From the above findings of other researchers,
this study also discussed the effect of decentralized fixed asset tax revenue to the
effectiveness of current expenditures; the main problems faced by taxpayers in relation to
trading license tax in Rwanda; the benefits brought by rental income tax decentralization in
development expenditures; the relationship between decentralized tax systems and Public
Expenditures and found that decentralized tax system contribute to the public expenditures.
CHAPTER FIVE: SUMMARY, CONCLUSIONS AND
RECOMMENDATIONS
5.0 Introduction
In this chapter, the researcher summarized the findings based on respondents’ opinions and
perception on decentralized tax system and effectiveness of public expenditures. The
summary of the findings is presented in line with the objectives of the research. The
researcher also presents the conclusion of the study, gives the recommendations and suggests
the possible areas for the future researchers.
5.1 Summary of Findings
This subsection is summarizing the research findings according to the research objectives. It
analyze the effect of decentralized fixed asset tax revenue to the effectiveness of current
expenditures, identify the main problems faced by taxpayers in relation to trading license tax
in Rwanda; analyze the benefits brought by rental income tax decentralization in
development expenditures, establish the relationship between decentralized tax systems and
effectiveness of public expenditures.
42
5.1.1 The Effect of Decentralized Fixed Asset Tax Revenue to the Effectiveness of
Current Expenditures
In relation to the first research objective on tax capacity out of 18 respondents 4(i.e. 22.2%)
respondents strongly agree while 9(i.e. 50%) respondents chose disagree, on tax regulations
27.8% select disagree while 38.9% select agree. On improved fairness, 22.2% tick agrees
while 50% tick strongly agree. But on level of tax burden out of 18 respondents 50% chose
strongly agree while 27.8% chose agree. Although on improved fairness, 27.8% tick strongly
agree while 50% tick undecided. Finally on monitoring and evaluation 27.8% chose
undecided while 38.9% chose strongly agree.
5.1.2 The Main Problems Faced by Taxpayers in Relation to Trading License Tax in
Rwanda
Concerning the second research objective, main problems faced by taxpayers in relation to
trading license tax in Rwanda on lack of information out of 18 respondents 22.2% chose
agree while 44.4% chose strongly agree. However on Lack of training 22.2% chose strongly
agree while 44.4% chose disagree. And on failure to file penalty 50% selected agree while
22.2% selected disagree. Although on making errors on their tax return 27.8% chose strongly
agree, while 38.9% chose disagree. But on data processing unclear written communication
22.2% ticked strongly agree while 38.9% ticked disagree. Finally on methods of tax
collection 22.2% selected disagree while 50% selected agree.
5.1.3 The benefits brought by rental income tax decentralization in development
expenditures
Concerning the third research objective on the benefits brought by rental income tax
decentralization in development expenditures out of 81 respondents 44.4% selected that the
benefit brought by rental income tax decentralization in development expenditures is ability
to raise revenue, 11.1% selected that the benefit brought by rental income tax
decentralization in development expenditures is low levels of expenditure and 11.1% also
selected that the benefit brought by rental income tax decentralization in development
expenditures is time management while 33.3% selected that the benefit brought by rental
income tax decentralization in development expenditures is easy to handle tax issues.
5.1.4 The relationship between decentralized tax systems and effectiveness of public
expenditures.
Concerning the fourth research objectives, using views and opinions of Taxpayers this study
used correlation coefficient through SPSS program and found that decentralized tax systems
correlate to effectiveness of public expenditures on the rate of 88.5%. Hence, there is a
positive and very high correlation between decentralized tax systems and effectiveness of
public expenditures
While by using Huye District staff this study used correlation coefficient through SPSS
program and found that decentralized tax systems correlate to effectiveness of public
expenditures on the rate of 97.7%. Hence, there is also a positive and very high correlation
between decentralized tax systems and effectiveness of public expenditures.
5.2 Conclusions
If citizens accept the existence of Government, paying taxes is obligation for every citizen.

43
As taxes is blood of government. However there is some challenge facing tax payers which
included lack of taxpayers’ education on tax payment and procedures, failure to understand
the relevance of paying taxes and higher tax rate imposed compared with taxpayer’s business
capacity and leads to the lack of tax morality and low tax payment capacity. Although
government uses decentralization tax systems for purpose of raising revenue ability for low -
levels of expenditure, for time management and also easy to handle tax issues. This system of
decentralization tax systems leads to accountability, transparency, respondents client need,
target achievement and also improve citizen’s welfare.
According to the staff there is a significant and positive relationship between decentralized
tax systems and effectiveness of Public expenditures. Therefore, from the above information,
the researcher found that as long as decentralized tax systems done well, it lead to
effectiveness of public expenditures on the rate of 97.7%. According to the taxpayers, the
researcher found that as long as decentralized tax systems done well, and it will lead to
Public Expenditures on the rate of 88.5%.
5.3 Recommendations
Local public functions should be financed by user charges and local taxes, especially by
property taxes and consumption taxes, leaving income taxes to the central government;
however, this division of revenues implies that lower levels of government are likely to end
up with greater expenditure responsibilities than can be financed from their own revenues.
However the merits of fiscal decentralization have to be measured relative to the existing
revenue and expenditure assignments and the stage of economic development. The central
government may be in a much better position to undertake public investment with nation-
wide externalities in the early stages of economic development. More importantly, if local
shares in total fiscal revenue and expenditure are already high, further decentralization may
result in slower overall economic growth.
5.4 Suggestions for Further Study
From the study limitations and related conclusions, the researcher recommends further
research in the area of decentralized tax systems to effectiveness of public expenditures to
continue to do a research in other districts. Future researchers should use secondary data to
analyze the contribution of decentralized tax systems to the effectiveness of public
expenditures.
REFERENCES Adebayo. (2004). Problems of taxation, collection in Nigeria, a case study of Uyo local
government area. Lagos: Longman.
Ahmed. (2013). Fiscal decentralalisation and political economy of poverty reduction.
Aigbepue,S. & Ainabor, A. (2011). Issues and Challenges of Nigerian Fiscal Federalism.
Interdisciplinary Journal of Research in Business, Vol.1(10), pp.26- 31).
44
Akpan, E. O. (2011). Fiscal Decentralization and Social Outcomes in Nigeria. European
Journal of Business and Management, Vol 3,.
Ariwodola, J. A. (2000). Personal Taxation in Nigeria (4th edition). Lagos: JAA Nigeria Ltd.
Azfar, O. & Jeffrey, L. (2002). Federalist disciplines or local capture an empirical analysis of
decentralization in Uganda.
Bardhan, P. (2002). Tax Decentralization of Governance and Development. Journal of
Economic Perspectives, Vol.16(4), PP.185–205.
Bhatia, H. L. (2009). International economics. New Delhi: Vicas Pubs.
Braithwaite, V. (2003). Taxing Democracy: Understanding Tax Avoidance and Evasion.
London: Ashgate.
Campbell, D. T., Shadish, W. R., & Cook, T. J. (2002). Experimentation And Quasi
Experimental Designs For Generalized Causal Inference. Boston: Brookings
Institution Press.
Chang & Lai. (2004). Collaborative Tax Evasion and Social Norms. Oxford economic
journal, pp.344-368.
Chaudhry I , Malik S and Hassan A. (2009). The Impact of Socioeconomic and Demographic
Variables on Poverty. The Lahore Journal of Economics , vol.14, pp39-68.
Chinyere, C. J. (2000). The Use of Consultants in Tax collection Analysis of the Accelerated
Revenue Generation Programme in River State. Nsukka: River states press.
Chris, W. H. & Elizabeth, S. B. (2001). Revenue Law, Principles and Practice (8th ed.).
London: Butter Worth Publishers.
Collier, P. (2008). Oil, Growth and Governance in Nigeria.
Cooper, Krever & Vann's. (2005). Income taxation, commentary and Materials (5th edition
ed.). Texas: Texas University Press.
Crawford, G. (2008). Decentralisation and the Limits to Poverty Reduction Findings from
Ghana.
Crook. (2003). Decentralization and Poverty Reduction in Africa: The Politics of Local-
centre relations Public administration and Development.
Faguet, J. P. (2004). Does decentralisation increase responsiveness to local needs?Evidence
from Bolivia‘. Journal of Public Economics, vol 88, pp. 867-894.
Fausto, H. & Brenda, J. (2008). ‗Is Local Beautiful? Decentralisation in Mexico. Journal of
World Development, vol.36(4), pp 1547-1558.
Frederick, M., Benjamin, B.,& Mukasharangabo, D. (2013). Assessment of challenges faced
by tax collectors and tax payers in rural areas: A case study of Nyaruguru District.
East African Journal of Science and Technology, Vol.2(2), PP.1-18.

45
Gediminas, D.,Kęstutis, P., & Neringa, S. (2013). Development of Local Municipality Taxes
and Principles of Fiscal Policy in Lithuania. American International Journal of
Contemporary Research, Vo.3(8), PP.38 - 50.
Iregui, A. M. (2005). Decentralised Provision of quasi-private goods. Economic Modeling,
vol.22, pp683-706.
Jing, J. & Heng, Z. (2005). Fiscal decentralization, revenue and expenditure assignments, and
growth in China. Journal of Asian Economics, Vol.16, PP.1047–1064.
Kaplow, L. (1990). Optimal Taxation with Costly Enforcement and Evasion. Journal of
Public Economics, pp. 221–36.
Kothari, C. R. (1985). Research Methodology- Methods And Technique. New Delhi: Wiley
Eastern Limited.
Kvale, S. (1996). Interviews: An Introduction to Qualitative Research Interviewing. London:
Sage Publications.
Lim, W. M., & Ting, D. H. (2009). Research Methodology: A Toolkit Of Sampling And Data
Analysis Techniques For Quantitative Research. London: Housing Policy.
Ministry of Finance and Economic Planning [MINECOFIN]. (2011). Fiscal And Financial
Decentralization Policy. Kigali - Rwanda: Ministry of Finance and Economic
Planning [MINECOFIN].
Mukabi, F.K.,Barasa, P. W. & Viola, Ch. (2015). Devolved Governance in Kenya; Is it a
False Start in Democratic Decentralization for Development? International Journal of
Economics, Finance and Management, Vol.4(1), PP. 26 - 37.
Nassiuma, A. (2000). Survey Sampling: Theory And Methods. Nairobi: University of Nairobi
Press.
Nicholas, T. (2003). Taxation in Kenya, Principles and Practices (5th Revised Edition ed.).
Nairobi, Kenya: Institute of Economic Affairs.
Okafor, R. (2012). Tax Revenue Generation and Nigerian Economic Development. European
Journal of Business and Management, Vol.4(19), PP.49 - 56.
Parkin, M. (2006). Principles of micro economics (8th edition ed.). Ontario, Canada:
university of Western Ontario.
Richard, B. (2010). Economic Premise: Taxation and Development. New York: World Bank.
Richard,M. B. (2015). Threading The Fiscal Labyrinth: Some Issues In Fiscal
Decentralization. Canada National Tax Journal , Vol.46(2), pp. 207-227.
Ross, K. N. (2005). Sample Design For Educational Survey Research. Paris: UNESCO.
Saleemi, N. (1981). Taxation simplified II (3rd ed.). Nairobi: Saleemi publishers.
Sanni, A. (2012). Multiplicity of Taxes in Nigeria: Issues, Problems and Solutions.
International Journal of Business and Social Science, Vol.3(17), PP.229 - 236.

46
Slemrod, J. B. (1995). Social Cost of Taxation and the Marginal Cost of fund. Washington
DC: Internationl monetary fund.
Smith, A. (1776). An inquiry into the nature and causes of the wealth of the nations (Book I,
II, III ans IV). London: Adam Smith.
Sultan, N. A. & Mairna, H. M. (2011). The Determinants of Public Expenditures in Jordan.
International Journal of Business and Social Science, Vol.2(8), PP.45 - 49.
Suwandi & Warokka, A. . (2013). Fiscal Decentralization and Special Local Autonomy:
Evidence from an Emerging Market. (Vol.1, Ed.) Journal of Southeast Asian
Research, PP. 1 - 14.
Tanzi, V. & Anthony, P. (1995). The reform of Tax Administration. Washington: Washington
International Monetary Fund.
Wales, C. (2008). fair tax towards a modern tax system. London, United Kingdom [UK]: The
Smith Institute.
Waswa, B.,Sudi, N., George, W. M.,Juma, T., & Kituyi, G. M. (2013). An analysis of fiscal
decentralization as a strategy for improving revenue performance in Ugandan Local
governments. Journal of Research in International Business and Management,
Vol.4(2), pp. 28-36.
World Bank. (2000). Entering the Twenty-First Century. Oxford and New York: Oxford
University Press.
Zhou, G. & Chilunjika, A. (2013). The Challenges of Self-Financing in Local Authorities in
Zimbabwe. International Journal of Humanities and Social Science, Vol.3(11),
PP.233 - 245.