Embed Size (px)
Citation preview

– Communication across borders - A cross cultural perspective By Oliver Kroener A DISSERTATION Submitted to The University of Liverpool in partial fulfillment of the requirements for the degree of MASTER OF BUSINESS ADMINISTRATION 2006
A Dissertation entitled
– Communication across borders - A cross cultural perspective By Oliver Kroener
We hereby certify that this Dissertation submitted by (Oliver Kroener)
conforms to acceptable standards, and as such is fully adequate in scope and
quality. It is therefore approved as the fulfillment of the Dissertation requirements for
the degree of Master of Business Administration.
Approved:
Dissertation Advisor Date
(Jonathan Picklesimer)
Faculty Reader (University of Liverpool) Date

The University of Liverpool 2006 CERTIFICATION STATEMENT
I hereby certify that this paper constitutes my own product, that where the
language of others is set forth, quotation marks so indicate, and that appropriate
credit is given where I have used the language, ideas, expressions or writings of
another.
Signed Oliver Kroener
ABSTRACT
- Communication across borders -
A cross cultural perspective
by Oliver Kroener
Communication across borders is omnipresent in the daily work of es-k®
it-solution, a small and flexible IT consulting company. In this context, communication
across borders means communication between people from different cultures and
backgrounds. This can mean that the customers come from another country or that
the supplier and development partner comes from another than the host’s country. In
this case the type of business is an outsourcing agreement, either near- or offshore.
We consider nearshore as outsourcing to Eastern Europe, Ukraine and Russia and
offshore as outsourcing to India and Far East. Outsourcing has become a more and
more important aspect of business in IT companies in the last couple of years, and
this happened also to es-k® it-solutions. In such an outsourcing scenario we have to
deal with two communication cycles, one with the customer and the other with the
outsourcing partner. The outsourcing partner will come from another country in any
case, and the customer can be in the same country or in another country as well. In
both communication cycles there can arise communication issues, especially when
the mother tongue is different. Communication, in general, can take place face-to-
face or via computer-mediated channels. In this dissertation the focus is on the
issues with computer-mediated channels, such as VoIP, chat and others. These
channels have different channels richness’s. The problem is that gestures, mimic and
other non-verbal communication can be only transmitted by communication channels
with high channel richness. And this is where the problem begins. People sometimes
use the wrong communication channels for the wrong purpose. From our experience
we have seen that face-to-face meetings are crucial to build trust between both sides.
In this dissertation, a survey will be conducted which should be used to
analyse the communication habits of people spread all over the world. The results
are examined further and conclusions are drawn from the data set. The aim is to find
out more about current habits of communication and to use these results to optimize
the communication in outsourcing agreements with people from different cultures and
countries.
Acknowledgements
I would like to thank Jonathan Picklesimer for the considerable help and
ongoing support and advice which I have received during the whole dissertation
process. I especially thank him for catching up with my dissertation after my
unexpected break and all the help during those bad times.
I would also like to thank the University of Liverpool and Laureate for the
ongoing support and the help. It was great to see also the support during my break
and the help from Nadia Piscini, Truna Jawsal and Martin Hellhake and all other who
helped me to have the faith to go on with my study and to complete the dissertation!
Finally, I would like to acknowledge the great continuing support shown by
all my friends and my family during the dissertation process.
Oliver Kroener
Table of contents CHAPTER 1 - INTRODUCTION............................................................................... 12
Virtual organisations ............................................................................................. 13 Communication channel richness ......................................................................... 13
CHAPTER 2 – OBJECTIVES................................................................................... 15
Experimental Design............................................................................................. 17
CHAPTER 3 – REVIEW OF LITERATURE.............................................................. 18
What is outsourcing .............................................................................................. 18 Outsourcing by numbers ................................................................................... 19 Outsourcing checklist ........................................................................................ 20
Reasons for outsourcing ....................................................................................... 21 How to think strategically about outsourcing ......................................................... 21
Take costs out, put value in............................................................................... 22 A catalyst for change......................................................................................... 22 Can outsourcing improve industry dynamics? ................................................... 23
Outsourcing methodology ..................................................................................... 24 Program initiation .............................................................................................. 24 Service implementation ..................................................................................... 24 Final agreement ................................................................................................ 25 Program closure ................................................................................................ 25 Staff reaction ..................................................................................................... 25
Main factors influencing successful outsourcing ................................................... 26 0pen communication ......................................................................................... 26 Executive support .............................................................................................. 27 Contracts and service level agreements............................................................ 27
The hidden costs of lT outsourcing ....................................................................... 28 The cost of selecting a vendor........................................................................... 29 The cost of transition ......................................................................................... 30 The cost of layoffs ............................................................................................. 32 The cultural cost ................................................................................................ 33 The cost of ramping up...................................................................................... 34 The cost of managing the offshore contract ...................................................... 35
Background on communication............................................................................. 38 Conceptualization of the cross-cultural problem................................................ 38 Cultural patterns of perception and thinking ...................................................... 41
Barriers and gateways to communication ............................................................. 44 Barrier: The tendency to evaluate ..................................................................... 44 Gateway: Listening with understanding ............................................................. 45 General Observations........................................................................................ 47
CHAPTER 4 - COMMUNICATION AT ES-K............................................................ 53
Statement of the problem...................................................................................... 53 Communication issues.......................................................................................... 53
CHAPTER 5 – DATA COLLECTION ....................................................................... 56
Methodology ......................................................................................................... 56

Analysed data ....................................................................................................... 57 Experimental design ............................................................................................. 59
General approach.............................................................................................. 59 Prediction efforts ............................................................................................... 61
Descriptive analysis .............................................................................................. 62 Summary statistics ............................................................................................ 62 Breakdown analyses ......................................................................................... 63 Details and conclusion....................................................................................... 64
Inferential analysis ................................................................................................ 64 Analysis type ..................................................................................................... 64 Basic goal.......................................................................................................... 66 ANOVA analysis ................................................................................................ 66
Application of the findings ..................................................................................... 67 Implication ......................................................................................................... 68
CHAPTER 6 - DATA ANALYSIS ............................................................................. 69
Summary statistics................................................................................................ 69 The analysis at a glance.................................................................................... 69 Correlation analysis ........................................................................................... 72
Detailed analyses.................................................................................................. 76 Usability............................................................................................................. 76 Usage ................................................................................................................ 78 Security ............................................................................................................. 80 Audit trail ........................................................................................................... 83 Impact of time zones ......................................................................................... 85 Perception ......................................................................................................... 88 Intercultural and location based aspects ........................................................... 90
Inferential analysis (ANOVA) ................................................................................ 91
CHAPTER 7 – CONCLUSION ................................................................................. 96
REFERENCES ........................................................................................................100
APPENDIX ..............................................................................................................109
1st Section........................................................................................................109 2nd Section ......................................................................................................112

List of figures
Figure 1: Communication channel richness.............................................................. 14 Figure 2: The hidden costs of outsourcing................................................................ 37 Figure 3: Representation of human experience........................................................ 42 Figure 4: Communication issues .............................................................................. 54 Figure 5: High vs. Low Context Cultures .................................................................. 55 Figure 6: Data Collection Process ............................................................................ 57 Figure 7: Questionnaire ............................................................................................ 57 Figure 8: Score of each investigated variable........................................................... 58 Figure 9: Data Collection .......................................................................................... 59 Figure 10: Implementation Steps.............................................................................. 60 Figure 11: Methodology............................................................................................ 62 Figure 12: Ranking ................................................................................................... 63 Figure 13: Example - Usability Chart (no real data).................................................. 63 Figure 14: Confirmatory analysis .............................................................................. 65 Figure 15: Exploratory analysis ................................................................................ 65 Figure 16: ANOVA example ..................................................................................... 67 Figure 17: Apply Findings ......................................................................................... 68 Figure 18: Implications ............................................................................................. 68 Figure 19: Respondents of the survey...................................................................... 69 Figure 20: Countries of respondents ........................................................................ 70 Figure 21: Respondents by profession ..................................................................... 71 Figure 22: Respondents by company size................................................................ 72 Figure 23: Scatter plot Audit Trail and Perception .................................................... 74 Figure 24: Scatter plot Usability and Perception....................................................... 74 Figure 25: Scatter plot Usability and Usage.............................................................. 75 Figure 26: Usability - by the mean ............................................................................ 78 Figure 27: Usage details........................................................................................... 79 Figure 28: Usage - by the mean ............................................................................... 80 Figure 29: Security - by the mean............................................................................. 83 Figure 30: Audit Trail - by the mean ......................................................................... 85 Figure 31: Impact of Time Zones - by the mean ....................................................... 88 Figure 32: Perception - by the mean ........................................................................ 89 Figure 33: Intercultural and location based aspects ................................................. 91 Figure 34: ANOVA for video conferencing and perception ....................................... 94 Figure 35: VE Topologies ......................................................................................... 97

List of tables
Table 1: Countries of respondents............................................................................ 70 Table 2: Respondents by profession ........................................................................ 71 Table 3: Respondents by company size................................................................... 72 Table 4: Classification of correlation......................................................................... 73 Table 5: Table of correlations ................................................................................... 73 Table 6: Table of correlations for section two ........................................................... 75 Table 7: Usability details........................................................................................... 77 Table 8: Usability ordered by the mean .................................................................... 77 Table 9: Usability ordered by the mean .................................................................... 79 Table 10: Security details ......................................................................................... 81 Table 11: Security ordered by the mean................................................................... 81 Table 12: Audit trail – details .................................................................................... 83 Table 13: Audit trail ordered by the mean................................................................. 84 Table 14: Impact of time zones – details .................................................................. 86 Table 15: Impact of time zones ordered by the mean............................................... 87 Table 16: Perception – details .................................................................................. 88 Table 17: Perception ordered by the mean............................................................... 89 Table 18: Cultural aspects – details.......................................................................... 90 Table 19: ANOVA for e-mail preference ................................................................... 91 Table 20: Confidence intervals for the mean difference - e-mail preference............. 92 Table 21: ANOVA for perception of security of the communication channels........... 92 Table 22: Sample details for perception of security of the communication channels 93 Table 23: ANOVA for usability and perception ......................................................... 93 Table 24: Sample details for usability and perception .............................................. 93 Table 25: ANOVA for telephone and different time zones ........................................ 94 Table 26: Sample details for telephone and different time zones ............................. 94 Table 27: Communication channel ranking............................................................... 96

Glossary
ANOVA Analysis of Variance
CCR Communication Channel Richness
CEO Chief Executive Officer
CIO Chief Information Officer
CMC Computer-mediated Communication
CMM Capability Maturity Model
FTF Face-to-Face
ICT Information and Communication
Technology
IT Information Technology
LAN Local Area Network
NET Network Organisation
OUN Organisational Unit
RFP Request for Proposal
SLA Service Level Agreement
TCO Total Cost of Ownership
VEN Virtual Enterprise
VoIP Voice over IP
WWW World Wide Web
- 12 -
Chapter 1 - Introduction Communication across borders in this context means communication
between people from different locations and cultures. This type of communication is
omnipresent in outsourcing agreements that es-k® it-solutions, a small and flexible
IT-consulting company, have to deal with every day. es-k® it-solutions have a
network structure and adopts aspects of virtual organisations. In this dissertation, a
survey is carried out regarding different communication channels (see Chapter 2 –
Objectives) and several aspects, such as usage and usability as well as cultural
aspects are examined. The aim is to find the most suitable channels for offshore
relationships, bearing in mind cultural aspects as well as the communication channel
richness (see Communication channel richness) of the examined communication
media.
The dissertation is broken down in several chapters. In chapter 2 the
objectives of this dissertation are outlined more detailed. The 3rd chapter is about
outsourcing and communication. In this chapter, basic aspects and pitfalls of
outsourcing are discussed, because it is important to isolate general outsourcing
issues, such as the hidden costs which in some cases have nothing to do with
communication, from communication based issues. For this reason, outsourcing is
discussed thoroughly. Then the focus is on communication, such as the barriers and
gateways to communication. In the 4th chapter, more background information on
general communication issues of es-k® it-solutions are discussed. This is done to
show an example in practice. In chapter 5 the whole data collection process and the
analysis is described in all details. Finally, in chapter 6 the data analysis is presented
followed by the last chapter “conclusion” where final conclusions are drawn from the
previous chapters.
The following introduction of virtual organisations and communication
- 13 -
channels and their channel richness should give some more background information
on virtual enterprises and communication channels.
Virtual organisations
Virtual teams allow companies to leverage their global expertise, take
the pulse of diverse markets, promote broader participation in key strategic decision
making, increase job flexibility, lower travel costs and pool the knowledge of experts
(Malhotra et al., 2005, p.11). Within the scope of virtual organisations, organisational
units are created that are restricted to the primary business processes; this structural
simplicity allows to achieve maximum efficiency (Scholz, 1997, p.12-19, own
translation from the German text). With regard to virtual organisation and degree of
virtuality, intra- and inter-organizational forms can be differentiated. Inter-
organizational forms of virtual organization are often called virtual enterprises, which
are generally understood as partnerships of dispersed organizational units or
independent companies (Malhotra, 2000). There is also another term for virtual
organisations. Sometimes they are also called “network or modular organisations”
(Robbins, 2003, p.437).
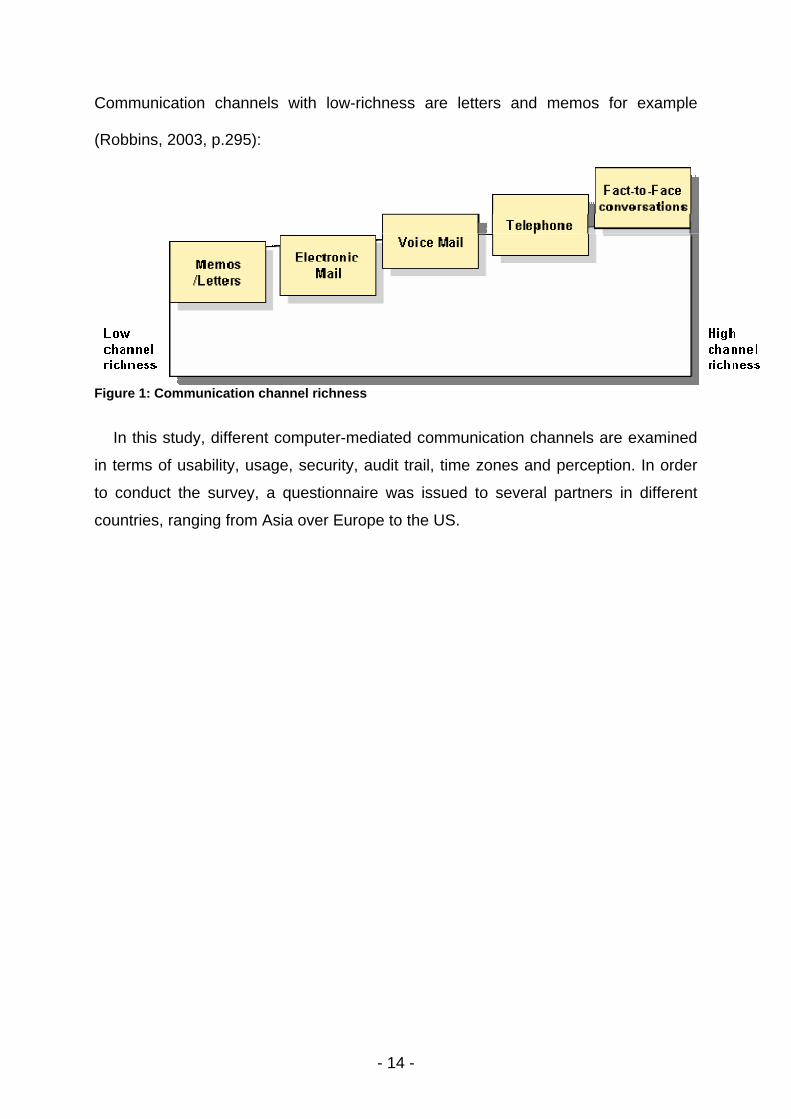
Communication channel richness
These networks can operate from all over the world, and communication is
a very important issue in such a network. Verbal and non-verbal communication
plays different roles, according to time zone differences and other determinants.
Robbins (2003, p.295) has developed a model of media richness which is used to
explain channel selection among managers. Research (Robbins, 2003, p.295) has
found that channels differ in their capacity to convey information. Some
communication channels are rich. This means that “they have the ability to handle
multiple cues simultaneously, facilitate rapid feedback, and are very personal”.
- 14 -
Communication channels with low-richness are letters and memos for example
(Robbins, 2003, p.295):
Figure 1: Communication channel richness
In this study, different computer-mediated communication channels are examined
in terms of usability, usage, security, audit trail, time zones and perception. In order
to conduct the survey, a questionnaire was issued to several partners in different
countries, ranging from Asia over Europe to the US.
- 15 -
Chapter 2 – Objectives The objective of the survey in this dissertation is to match survey results
against actual findings of technology and research of behaviour in communications.
For the investigation of the communication channels, the following variables should
be used in order to find out whether the right channels (with high channel richness)
are used at present. This is done with regards to virtual teams in organisations:
• Usability
• Usage
• Security
• Audit Trail
• Impact of Time Zones
• Impact on Perception
Usability is the perceived usability of the user, usage the actual usage.
Security should show in which way the user perceives the security of the channel,
audit trail whether a channel incorporates an audit trail. The impact of time zones
should show how useful a channel is to communicate across time zones. And last but
not least, the variable perception is used to identify how good the perception is using
the according channel. The investigation is carried out for the following different
media types (Robbins, 2003, p.295):
• Electronic Mail Systems • Newsgroups / Bulletin Boards
• Text based Conferencing Systems (Chat)

- 16 -
• Audio based Conferencing Systems
• Video based Conferencing Systems
• Meeting Support Systems (e.g. Yahoo Messenger, Net Meeting, ..)
• Workflow Systems (IBM MQ-Series, Lotus Notes, ..)
• Shared Editor / Whiteboards
• Shared Workspace Virtual Environments (virtual reality)
• Telephone
• Fax
The second issue addresses intercultural and location based aspects. The
following list shows the different aspects of the investigation:
• Different Mother Tongue
• Cultural diversity
• Diversity in project techniques
• Distance < 2 hours flight
• Distance > 2 hours flight
• Different Levels of Education
These aspects should be investigated regarding their impact on a general
project and its successful completion.

- 17 -
Experimental Design
There are two main problem areas that belong to software development
activities with near- or offshore outsourcing projects within current projects of es-k®:
• The communication channel • Cultural differences
A survey, which will be sent to current customers and development
partners, should be used to gather sample data. Communication channels should be
investigated how they are used at present and what the criteria for their usage are.
Based on the survey a ranking of communication channels should be established
and investigated regarding the actual usability and other aspects such as security.
The experiment should show first what communication channels are used
at present and why. Then in a second step, an investigation of optimal
communication channels and potential problems of channels with low channel
richness should be used to detect potential issues and suggest solutions and
changes to these issues. Further, cultural and location based aspects are an
important aspect as well. Current partners can be checked against these criteria and
the results found can be used in a partner selection process when looking for new
partners for the network.

- 18 -
Chapter 3 – Review of literature In this chapter a basic review of literature will provide some background
information about off shoring and communication in a cross-cultural perspective
within virtual teams. Since outsourcing is the driver for distance communication in
many cases, such as for es-k® it-solutions, it is important to identify the procedure of
outsourcing and common pitfalls. This is necessary to distinguish communication
issues in outsourcing agreements from general communication issues.
What is outsourcing
Outsourcing can be defined as the “strategic use of outside resources to
perform activities traditionally handled by internal staff and resources” (Griffiths,
2002, p.1).
There is a difference “between simply supplementing resources by
subcontracting and actual outsourcing”. The difference is, that outsourcing “involves
substantial restructuring of particular business activities”. This often includes the
transfer doom staff of the host company to a specialist, which is usually “a smaller
company with the required core competencies”. (Griffiths, 2002, p.1)
A more detailed specification of outsourcing can be found in the
Economist. There, outsourcing is defined as follows: (Economist A-Z, 2004)
“Shifting activities that used to be done inside a firm to an outside
company, which can do them more cost-effectively. Big firms have outsourced a
growing amount of their business since the early 1990s, including increasingly
offshoring work to cheaper employees at firms in countries such as India. This has

- 19 -
become politically controversial in countries that lose jobs as a result of offshoring.
However, a firm that outsources can improve its efficiency by focusing on those
activities in which it can create the most value; the firm to which it outsources can
also increase efficiency by specialising in that activity. That, at least, is the theory. In
practice, managing the outsourcing process can be tricky, particularly for more
complex activities.”
Outsourcing by numbers The following numbers should give a broad overview about offshore and
outsourcing from a global standpoint:
“15% of 145 large companies surveyed by Forrester Research say
offshore is a permanent part of their strategy” (Business Week, 2004)
“33.4 percent of companies surveyed are currently outsourcing projects,
42.8 percent are evaluating outsourcing providers, and 23.9 percent lack solid plans
to outsource” (Frauenheim, 2005)
“Sales of business-process-outsourcing services will increase 8% this year
to reach $131 billion, research firm Gartner predicts, and they're expected to hit $173
billion in 2007” (McDougall, 2004)
IDC research shows that “64% of CIOs and 77% of CFOs are positive
about selective IT outsourcing. The most popular part of an IT function to outsource
is the network/communications infrastructure (50 percent), followed by security
services (32 percent) and server management (32 percent).” (Equant, 2004)
- 20 -
From all these survey we can see that outsourcing is currently important
for businesses and will be even more important in the future.
Outsourcing checklist For most firms, the decision to outsource is a simple question of upside.
The bottom-line benefits of successful outsourcing promise to be substantial. For an
ever-growing cadre of executives outsourcing “is well worth the risks that accompany
ceding control over nonstrategic – and, in an increasing number of cases, strategic –
assets” (Michelman, 2005, p.3). Michelman (2005) mentions the following items as a
checklist for outsourcing efforts: (Michelman, 2005, p.3)
1. “Make an outsourcing decision based on strategic goals, not just tactical
urgency. Use an enterprise wide assessment of cost- and productivity
enhancing options”.
2. “Retain domain knowledge. Keep critical strategic know-how inside the
organization so that vendors don’t become competitors and so the company
remains in control of strategy”
3. “Design an exit strategy. Prepare to survive a contract termination, when
operations might need to be transferred to another vendor or brought back in-
house.”
4. “Communicate fully with current employees. They must shift from an initial
position of fear or anxiety to one of positive collaboration in transferring
knowledge to the vendor.”
5. “Build joint company-vendor teams. Joint transition efforts help to fine-tune
and introduce new processes. Training and site visits should be reciprocal”
6. “Invest in a robust selection process. It’s not easy to switch vendors later,
so careful consideration, interviews with other clients, detailed modelling,
multilevel contacts, and due diligence are worth the substantial effort.”
7. “Define appropriate performance measures. Key performance indicators
should address service delivery quality and total costs, and should be within
the provider’s clear control.”

- 21 -
8. “Provide the right incentives. Baseline and stretch targets provider payment
should link service levels, and supplier bonuses at every level should with
contract incentives.”
9. “Assess insurance coverage. Determine possible gaps by thoroughly
reviewing all relevant policies, adding needed coverage, and seeking suitable
provider liability.”
Reasons for outsourcing
What are the reasons for outsourcing? Is it a more long-term and
persisting idea or just a short-term trend? Is it more tactical or strategic? Griffiths
(2002, p.1) has found some common reasons for outsourcing:
• Reduce and control operation costs
• Improve host company focus
• Gain access to world-class capabilities
• Free internal resources for other purposes
• A function is time-consuming to manage or is out of control
• Insufficient resources are available internally
• Share risks with a partner company
Griffiths (2002, p.1) has found that, “in today’s world the drivers are often
more strategic, and focus on carrying out core value-adding activities in-house where
an organization can best utilize its own cove competencies”.
How to think strategically about outsourcing
Outsourcing used to be viewed as “little more than a ho-hum tactic for
reducing the costs of backroom functions such as payroll and IT”. In the past it did
not have much drive “and was never confused with a breakthrough management
idea”. But things started to change in the early ‘90s, as companies began outsourcing
more strategically functions such as manufacturing and logistics, and even product
- 22 -
design and other innovation-related activities. Now, outsourcing “had morphed into a
critical management tool”. (Craumer, 2002, p.3)
However, then the inevitable backlash came. Outsourcing seemed so
simple in theory but it turned out to be pretty tough in being well executed. It was not
living up to its promise. The problem was that “companies were outsourcing the
wrong things for the wrong reasons and going about it the wrong way”. Indeed a
study by Cap Gemini Ernst & Young shows that only 54% of the companies are
satisfied with outsourcing, down from more than 80% a decade ago. (Craumer, 2002,
p.3)
Craumer (2002) found that “outsourcing can free managers to focus on
more strategic, higher-value activities, but only if they discipline themselves to use
the freed-up time appropriate”.
Take costs out, put value in Craumer (2002) has found that “more and more companies are realizing
that their best partner is the one that offers them the greatest value; not necessarily
the lowest cost”. This happens because outsourcing continues to move beyond
backroom functions into more strategic areas of the business. Therefore, “the
standard bidding process is losing favor”. (Craumer, 2002, p.3)
A catalyst for change “Companies aren’t very good at change,” says Linder. “Whatever is
changing their business model or implementing innovations or reengineering, it is
hard work and people do not get everything they expect.” (Craumer, 2002, p.3)
Furthermore, Craumer (2002) found that “some forward thinking executives are
beginning to use outsourcing as a change-management tool to drive major,
enterprise-level transformation, such as a shift in competitive position or a major
- 23 -
increase in market share or stock price”.
Can outsourcing improve industry dynamics? According to Craumer (2002) “outsourcing has the potential to do away
with the boom-and-bust cycles that many industries experience on an ongoing basis”.
Frey contends that the recent high-tech meltdown was self-induced. (Craumer, 2002,
p.4)
Craumer (2002) says: “Outsourcing adds an extra layer to the supply
chain, and that typically means one more safety cushion. These cushions didn’t
create the industry recession in and of themselves, but they heightened its severity.”
This does not mean that outsourcing is bad in itself. Companies like Cisco probably
“could not have grown as big as it did with a vertically integrated model”. With
outsourcing, the company was able to use everyone else’s manufacturing capacity
and did not have to build its own plants. Nevertheless, Frey (2002 cited in Craumer,
2002, p.3) believes that the high-tech supply could be vastly improved: “l really
believe that where outsourcing works is where it gets at some major source of waste
and the easiest one to find is risk-or the things you do to manage risk.” Frey (2002
cited in Craumer, 2002, p.3) says: “That is why there’s so much potential outsourcing
value in the high-tech supply chain. The solution is the strategic management of four
levers: forecast, capacity, product design, and the relationship between the two parts
of the supply chain (who the hidden cost of lT controls that). By learning how to
adjust these settings to minimize and manage the inherent risks, companies can
avoid the wasteful safety cushions that so often result.”
“Do we really need about 15 different kinds of CD-drive motors?” asks
Frey (2002 cited in Craumer, 2002, p.3). “The risk of parts shortages would shrink
dramatically if the industry agreed on a smaller number of standardized
components”. In order to get more value out of the high-tech supply chain it is
- 24 -
important to “pool component risk, pool capacity risk, and standardizing the non-
value – or low-value-added - components of any product that comes out. And
outsourcing is an integral part of that process.” (Craumer, 2002, p.5)
Outsourcing methodology
The company Kudos uses “a sequence of logical actions for the
successful implementation of an outsourcing agreement”. There are four main
aspects to a typical Kudos outsourcing program: (Griffiths, 2002, p.2)
• Program Initiation
• Service Implementation
• Final Agreement
• Program closure
Program initiation “At the start of any outsourcing program, there are a variety of ideas and
opinions about the purpose and the scope of the programmer what the final result of
the program will be, and how the program will be carried out. The program initiation
stage is concerned with taking these ideas and intentions and documenting them to
form the basis of a draft contract.” (Griffiths, 2002, p.2)
Service implementation “Service implementation colors the activities required to take these ideas
and intentions and develop them into a formal, planned outsourcing program and to
make the transition to the outsourced service.” (Griffiths, 2002, p.2) Specifically these
activities are: (Griffiths, 2002, p.2)
• Refining the transition project
• Transferring the staff
• Retiming the Service Level Agreement (SLA)

- 25 -
• Defining service reporting implementing and handling over the service
• Implementing service management procedures
Final agreement “The draft contract produced at the initiation stage is generally amended
during negotiations and the final contract is produced on completion of the
negotiation cycle.” (Griffiths, 2002, p.2)
Program closure Griffiths (2002) has found: “In order to gain maximum benefit, the program
should go through a formal close down. There is no point in continuing to argue lost
causes once irrevocable decisions have been taken. Stall and companies alibi need
to accept the new situation and move forward. However there will be a lot of
information generated during the life of the program, and this will be stored with –
varying degrees of formality by the team members.” In order to have a track record,
this information needs to be stored and recorded for future reference. (Griffiths, 2002,
p.2)
Staff reaction Staff reaction is a very important issue in outsourcing projects. There are
essentially three different phases that people go through: (Griffiths, 2002, p.3)
1. Rejection: “in some people the initial reaction is almost as serious as in a lay-
off situation. There is an element of shock and horror at how their company
(for whom they may have worked for many years) can (a) do such a thing to
them as an individual and (b) even consider getting by without internal
information developers.”
2. Self-interest: “understandably many people’s sole aim when they finally come
to terms with the fact that something is going to change is to concentrate on
looking after their own career interests.”
- 26 -
3. Join forces “with the new company: in most successful outsourcing
arrangements, the majority of staff eventually come to realize that then
personal interests can best be served by supporting the new company.”
Griffiths (2002) has found that “open communication sessions are
essential means of winning the confidence of new staff gained this way. This third
phase of individual reaction has to be reached if the outsourcing deal is to be a
success for the new company and the staff involved.”
Main factors influencing successful outsourcing
The critical areas for a successful outsourcing program as identified in a
recent survey of “The Outsourcing Institute” (1998 cited in Griffiths, 2002, p.1) are:
• Understanding company goals and objectives
• A strategic vision and plan
• Selecting the right vendor
• Ongoing management of the relationships
• A properly structured contract
• Open communication with affected individual/ groups
• Seniors executive support and involvement
• Careful attention to personal issues
• Short-term financial justification
From this list two issues can be stressed: “open communication and
executive support”. These issues are most important for a successful outsourcing
process “and it can be added to the list the need for workable Service Level
Agreements (SLA), which are openly available to all staff involved”. (Griffiths, 2002,
p.1)
0pen communication Open communication is one of the most important issues. Thus, Griffiths
(2002) found that “whatever the outsourcing the outcome of the outsourcing

- 27 -
arrangement, managing change is fundamental to the success of the program.
Assessing stakeholder requirements is the first part of this process, and having open
channels of communication during this time are vital. Everyone concerned should be
involved in the process”.
Executive support Executive support is the other very important issue in outsourcing projects.
Griffiths (2002) found that: “strategic objectives, such as outsourcing initiatives, must
come from the echelons of a company. Senior management must articulate the goals
and objectives of the outsourcing initiative and communicate how the process will
benefit the organization. Today, managers are looking ahead and recognizing that
the responsibility for ensuring the success of then enterprise’s outsourcing initiatives
does not stop when the ink has dried on the contract. Unfortunately this has not
always been the case.” At present, 25% of outsourcing contracts will be re-negotiated
or cancelled within 3 years. (Kirkpatrick et al., 2002)
Contracts and service level agreements Griffiths (2002) found that “there are several critical components of a good
outsourcing agreement. The emphasis from the outset should not be on who wins the
best deal, but rather on negotiating a reasonable contract for both parties.” It is
important for both parties to reach consensus since each aspect of the outsourcing
relationship is governed by the contract. Issue resolution is a very important aspect of
this contract and both parties should agree on processes which both can accept.
(Griffiths, 2002, p.2)
Furthermore, the Service Level Agreement (SLA) is the most important
document in an outsourcing partnership. “It helps manage the strategic relationship
between the outsourcing company and the supplier and includes the identification of
- 28 -
responsibilities, which is important when processes change.” In order to be
successful, the outsourcing relationship must focus on results. “To be meaningful,
these results must be objective, measurable, quantifiable, and comparable against
pre-established criteria.” (Griffiths, 2002, p.2)
The hidden costs of lT outsourcing
It is important to understand the hidden costs of an outsourcing agreement
in order to make the right decision. Overby (2003) has identified important aspects,
such as “the importance to understand the issues which can lead to better
outsourcing decisions. The current stampede toward offshore outsourcing should
come as no surprise. For months now, the business press has been regurgitating
claims from offshore vendors that IT-work costing $100 an hour in the United States
can be done for $20 an hour in Bangalore or Beijing”. These figures sound too good
to be true, but in fact these figures are true (Overby, 2003, p.1).
However, this is not the whole story. Overby (2003) states that: “in fact,
such bargain-basement labor rates tell only a fraction of the story about offshore
outsourcing costs.” Thus, it would be ideal to save 80 percent by outsourcing, but the
reality is different. Most of the outsourcing companies do not even save half of that.
Overby (2003) shows United Technologies as one example. They are an
acknowledged leader in outsourcing best practices but they only save about 20
percent by outsourcing to India! (Overby, 2003, p.1)
That’s still a good deal and a pro for outsourcing but much less than many
people would have expected. However, it can take many years and huge up-front
investments to establish such a relationship. Therefore, it is not worth for every
company to outsource; the decision must be made very carefully. "Someone working
for $10,000 a year in Hyderabad can end up costing an American company four to

- 29 -
eight times that amount," says Hank Zupnick (2003 cited in Overby, 2003), CIO of
GE Real Estate. “Yet all too often, companies do not make the outlays required to
make offshore outsourcing work. And then they are shocked when they wind up not
saving a nickel.” (Overby, 2003, p.1)
In order to get the total cost of offshoring, a new TCO will be explored
which covers the total costs of offshoring (Overby, 2003, p.1): “All the hidden costs of
outsourcing will be uncovered - areas in which you'll have to invest more up front
than you might think, places where things such as productivity and poor processes
can eat away at potential savings, and spots where, if you're not careful, you could
wind up spending just as much as you would in the U.S.” For more details about how
to calculate the TCO please see “Figure 2: The hidden costs of outsourcing” at the
end of this chapter.
"You can't expect day-one or even month-six gains," Zupnick (2003 cited
in Overby, 2003) says. "You have to look at offshore outsourcing as a long-term
investment with long-term payback." (Overby, 2003, p.1)
The cost of selecting a vendor The costs of selecting a vendor are about “0.2 percent to 2 percent in
addition to the annual cost of the deal”. The following example shows the costs for a
project which is $20 million worth. Selecting a vendor in this case could cost from
$40.000 to $200.000 each year (Overby, 2003, p.2). Overby (2003) says that: “These
selection costs include documenting requirements, sending out RFPs (Request for
Proposal) and evaluating the responses, and negotiating a contract. A project leader
may be working full time on this, with others chipping in, and all of this represents an
opportunity cost. And then there are the legal fees. Some companies hire an
outsourcing adviser for about the same cost as doing it themselves.” The whole
process is very time consuming and can take from six months to a year. (Overby,

- 30 -
2003, p.2)
Overby (2003) found that “even when there is an existing tie between
customer and offshore vendors, the expensive and lengthy step of vendor selection
is a must-do for successful outsourcing”. The following examples show such a
process:
“David Raspallo, CIO of business unit Textron Financial, began exploring
offshore outsourcing in 1999, he still spent five months doing what he calls ‘the usual
Betty Crocker Bake-Off’ with service providers Covansys, ITS, TCS and Wipro.
Ultimately, he went with U.S.-based Covansys, which has three development centers
in India. Selecting the vendor took 500 hours in total, involved Raspallo and three
senior managers, and cost $20,000 in additional expenses.” (Overby, 2003, p.2)
Bottom line: “Expect to spend an additional 1 percent to 10 percent on
vendor selection and initial travel costs.” (Overby, 2003, p.2)
The cost of transition The next critical issue is the cost of transition. Overby (2003) found that
“the transition period is perhaps the most expensive stage of an offshore endeavor. It
takes from three months to a full year to completely hand the work over to an
offshore partner. If company executives aren't aware that there will be no savings -
but rather significant expenses - during this period, they are in for a nasty surprise”.
GE Real Estate's Zupnick (2003 cited in Overby, 2003, p.3) explains: "You
have to bring people to your home country to learn your applications, and that takes
time, particularly if you're doing it with a new vendor for the first time." Zupnick
maintains a handful of three-year contracts with offshore vendors, including TCS and
smaller vendor LSI Outsourcing. (Overby, 2003, p.3) In this case, the transition time
lasted from three months up to one year depending on the special case. (Overby,

- 31 -
2003, p.3)
Zupnick is very experienced in offshoring and has knowledge of over
seven years in offshoring IT-projects (Overby, 2003, p.3). He says (2003 cited in
Overby, 2003, p.3) “most of his peers don't appreciate the time and money it takes to
get a relationship up and running." In addition, the vendors say that you can not be
successful right away. “As a result, I've heard of CIOs who have tried to go the India
or China route, and nine months later they pulled the plug because they were not
saving money," Zupnick (2003 cited in Overby, 2003, p.3) says. "You have to build in
up to a year for knowledge transfer and ironing out cultural differences." (Overby,
2003, p.3)
Overyby (2003) says that: “CIOs must bring a certain number of offshore
developers to their U.S. headquarters to analyse the technology and architecture
before those developers can head back to their home country to begin the actual
work.” Furthermore, the prevailing U.S. hourly rates have to be paid for offshore
employees which are on-site. In addition, they need a temporary visa. It is obvious,
that there is no saving during that period of time and this time can last for a couple of
months. And in the beginning of the cooperation, offshore workers have to work
together with in-house employees, which is costing the company double, since both
the in-house trainer and the offshore worker have to be paid. “In addition, neither the
offshore nor in-house employee is producing anything during this training period.”
(Overby, 2003, p.3)
“During the transition period, the ratio of offshore employees in the United
States to offshore employees working at the vendor's overseas headquarters is high.
But after the transition is complete, CIOs have to get those employees out of the
office if offshoring is to be a money-saving move.” (Overby, 2003, p.3) "It's got to be
80 percent or 85 percent working offshore or the numbers just don't work," explains

- 32 -
GE Real Estate's Zupnick (2003 cited in Overby, 2003, p.3).
"On some of our projects, up to 50 percent of offshore workers are
onshore; on others it's closer to 10 percent," Hergenroether (2003 cited in 2003
Overby, p.3) says. Offshore talent might be brought in long-term in some cases, if the
talent is required. However, if this in done long-term, the cost saving might diminish
or not exist anymore. (Overby, 2003, p.3)
Bottom line: “Expect to spend an additional 2 percent to 3 percent on
transition costs.” (Overby, 2003, p.3)
The cost of layoffs Overby (2003) found that “Laying off American employees as a result of
your offshore contract poses other sometimes unanticipated costs.” Zupnick (2003
cited in Overby, 2003, p.4) explains: "You need to keep employees there long
enough to share their knowledge with their Indian replacements." Furthermore he
says: "People think if they give generous retention bonuses it will destroy the
business proposition. They cut corners because they want quick payback. But then
they lose the people that can help with the transition and incur the even bigger cost
of not doing the transition right." (Overby, 2003, p.4)
Overby (2003) found that “layoffs can also cause major morale problems
among in-house ‘survivors,’ in some cases leading to disaffection and work
slowdowns. Companies with experience in offshoring factor productivity dips and
potential legal action from laid-off employees into the cost-benefit analysis.”
"You can never underestimate the effect these issues will have on the
success the business venture," says Textron Financial's Raspallo (2003 cited in
Overby, 2003, p.4). “CIOs must take time to communicate with their staffs, being
brutally honest,” Raspallo says (2003 cited in Overby, 2003, p.4). It is important to let
- 33 -
the staff know about the management plan and to be very open. Furthermore, it is
important to share the vision with the employees and to constantly give them an
update on what is going on. (Overby, 2003, p.4)
Bottom line: “Expect to pay an extra 3 percent to 5 percent on layoffs and
related costs.” (Overby, 2003, p.4)
The cultural cost Different cultures have different project techniques and therefore also a
different productivity. (Overby, 2003, p.5) "You simply cannot take a person sitting
here in America and replace them with one offshore worker," GE Real Estate's
Zupnick (2003 cited in Overby, 2003, p.5) says. This applies regardless to their
location, “Whether they are in India or Ireland or Israel." (Overby, 2003, p.5)
One reason for that is the difference between cultures in speaking up and
making suggestions. "A good American programmer will push back and say, what
you're asking for doesn't make sense, you idiot," Zupnick (2003 cited in Overby,
2003, p.5) says. "Indian programmers have been known to say, this doesn't make
sense, but this is the way the client wants it." Thus, these communication issues will
lead to more project efforts and costs. Furthermore, a common project in the U.S.,
“like creating an automation system for consumer credit cards” may be not
understood by the offshore partner. Another problem is the lack of experience of the
developers involved (“the average experience of offshore developers is six years”).
(Overby, 2003, p.5)
“On average, IT organizations going offshore will experience a 20 percent
decline in application development efficiency during the first two years of a contract
as a result of such differences”, Meta Group Vice President of Service Management
Strategies Dean Davison (2003 cited in Overby, 2003, p.5) says. According to Meta
- 34 -
Group, “lags in productivity can add as much as 20 percent in additional costs to the
offshore contract”. (Overby, 2003, p.5)
Overby (2003) found that “another productivity killer is high turnover at
offshore vendors. Attrition rates climb as high as 35 percent in India, according to the
National Association of Software and Service Companies.” Zupnik adds (2003 cited
in Overby, 2003, p.5): "Unless you can somehow address that in your contract, you're
paying for someone to learn your product and then they're gone". Overby (2003)
found that “Turnover can cost an additional 1 percent to 2 percent”.
Communication issues are also a big factor in loss of productivity,
especially when there is a lot of distance communication (Overby, 2003, p.5). "We
had to do a lot more face-to-face interaction than originally anticipated because
offshore workers just didn't interpret things the same way," says DHL's Kifer (2003
cited in Overby, 2003, p.5). Kifer (2003 cited in Overby, 2003, p.5) adds: "That
resulted in a lot more travel there or bringing them onshore to bridge that gap. We did
that a lot more often than the model would have prescribed." According to the Meta
Group there are additional costs of 2 percent to 5 percent “for language and other
cultural differences”. (Overby, 2003, p.5)
Bottom line: “Expect to spend an extra 3 percent to 27 percent on
productivity lags.” (Overby, 2003, p.5)
The cost of ramping up Overby (2003) says, that “well-defined and accepted internal software
development and a maintenance process is also the key to making an offshore
situation work.” Raspallo, for instance, currently sends 65,000 man-hours to India.
He says: "If you're an organization that develops and maintains by the seat of your
pants, or it's a case where Mary Jo and Fred have been here for 30 years and they

- 35 -
know how to do everything, you are in trouble". (Raspallo, 2003 cited in Overby,
2003, p.6)
Overby (2003) says that “Raspallo spent five months and $80,000 in
consulting fees to get ISO certified in 1998, which puts his company at about Level 3
in terms of his employees' ‘capability maturity’ in developing software. He also
invested in an automated Web-based system to support the new software
development and labor management practices.” And it is a fact that many of the
offshore companies in India are ISO certified and have a CMM level of 3 or 5.
(Overby, 2003, p.6) "If your own staff can't get used to working at that level, you're
going to have a major disconnect," Raspallo (2003 cited in Overby, 2003, p.6) says.
Given the case that there are no solid in-house processes, "the vendor will have to
put more people onsite to compensate for your inadequacies, and they'll spend all of
your savings," says Meta Group's Davison. (Davison, 2003 cited in Overby, 2003,
p.6)
"When you're doing this stuff internally, you tend to be much more
cavalier," says Hergenroether (2003 cited in Overby, 2003, p.6). Hergenroether
(2003 cited in Overby, 2003, p.6) found that “creating a great spec package is costly
and time-consuming. On a 1,000 man-hour project for example, Hergenroether's staff
will spend 100 hours to create a spec package.”
Bottom line: “Expect to spend an extra 1 percent to 10 percent on
improving software development processes.” (Overby, 2003, p.6)
The cost of managing the offshore contract Overby (2003) found that “managing the actual offshore relationship is
also a major additional cost”. DHL’s Kiefer (2003 cited in Overby, 2003, p.6) explains:
“There's a significant amount of work in invoicing, in auditing, in ensuring cost centers
are charged correctly, in making sure time is properly recorded. We have as many as

- 36 -
100 projects a year, all with an offshore component, so you can imagine the number
of invoices and time sheets that have to be audited on any given day."
Kiefer (2003 cited in Overby, 2003, p.6) continues: “At DHL, each project
manager oversees the effort. He audits the time sheets from the vendor and rolls the
figure into an invoice, which then has to be audited against the overall project, which
is then funneled to finance for payment.” The staff was really surprised of the efforts
as the following statement shows: "We knew there would be invoicing and auditing,"
Kiefer (2003 cited in Overby, 2003, p.6) says, "but we didn't fully appreciate the due
diligence and time it would require."
Overby (2003) found that “at GE Real Estate, managing the offshore
vendor is such a big task that Zupnick assigned someone to handle it on a half-time
basis at a $50,000 salary. The individual makes sure projects move forward, and
develops and analyses vendor proposals against the RFPs when it comes time to bid
out new work.” Zupnik (2003 cited in Overby, 2003, p.6) says: "It's a critical job.
That's the price you have to pay to make this work."
Bottom line: “Expect to pay an additional 6 percent to 10 percent on
managing your offshore contract.” (Overby, 2003, p.6)
- 37 -
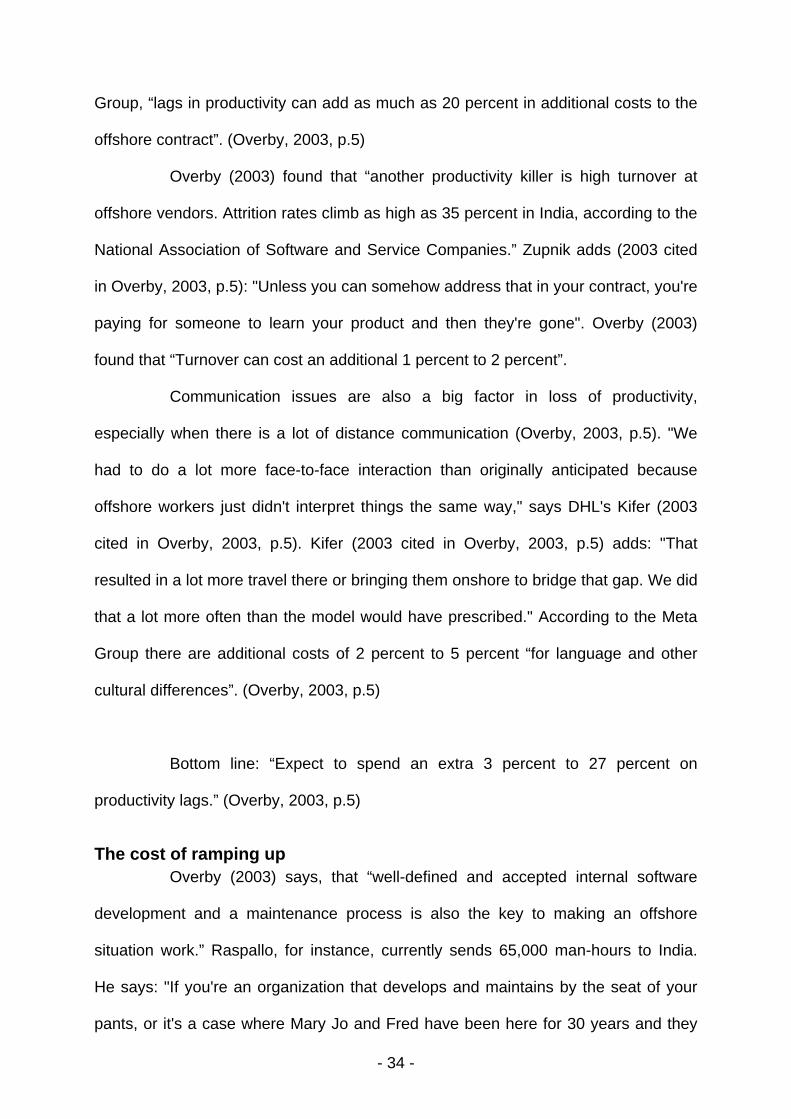
The following figure shows a complete overview of the cost incurred:
(Overby, 2003, p.10)
Figure 2: The hidden costs of outsourcing

- 38 -
Background on communication
In this chapter basic terms and conditions of communication are discussed
from the view of American culture. First of all some definitions should be used to
specify the use of terms like cross-cultural and intercultural.
Conceptualization of the cross-cultural problem Steward and Bennet (1991) found that “there have been adopted certain
conventions of expressions from the field of intercultural communication. Since the
words cross-cultural and intercultural have similar definitions, they are sometimes
used interchangeably, but they are also applied with more precise and separate
meanings. Cross-cultural normally refers to any comparison of cultural differences
(e.g. a cross-cultural study of values in the U.S. and Japan) or in situations where
differences exist (e.g. a cross-cultural teaching situation). The word intercultural is
usually added to communication or relations and refers to the actual interaction
between people of different cultures”.
Aspects of cross-cultural interactions Steward and Bennet (1991) found that “cross-cultural ambiguity and
reactions to it often become most prominent for the American in the world of work”.
Useem and Donoghue (1963, p.179) explain further: “In the foreign setting he sees
what looks like familiar bureaucratic structures and technological systems, but the
way they actually function is confusing. He meets people with professional training
similar to his own but who do not always act in their work role as expected – yet he
depends on them for getting the job done. Frustration becomes part of his everyday
language if he finds no way to achieve fuller understandings of why things which look
alike do not perform as they are supposed to”.
Steward and Bennet (1991, p.6) found that “the core difficulty in cross-
- 39 -
cultural interaction is a failure to recognize relevant cultural differences. Because of
superficial stereotyping and the belief that one’s own values and behaviors are
natural and universal; Americans (and others) at home or abroad often fail to grasp
the social dynamic that separates them from their associates”.
The basis for cultural contrast Americans who have worked and lived outside their home country need to
establish awareness of cultural contrast (Steward and Bennet, 1991, p.6). According
to Steward and Bennet (1991, p.6) they often say: “that non-Western countries,
mostly in Africa, Asia, and Latin America, differ from one another in some respects,
but all share common characteristics often referred to as non-Western”. This is an
important aspect in establishing cultural awareness.
Steward and Bennet (1991, p.7) continue: “Including the historical
dimension of colonialism in a cultural analysis increases the scope of understanding,
but social scientists are more at home with political, economic, and military events
than with subjective culture. Therefore, most do not give systematic treatment to the
ways of thinking of a people.” The German sociologist Tönnies (1957) is an
exception. “He analysed the social changes that take place as nations develop from
traditional, companionship societies into modern, society states. The social fiber of
companionship communities creates for its member an interpersonal reality, a
concept which Diaz-Guerrero (1976) uses to distinguish Mexican culture from
American culture which he refers to as having an objective reality. These concepts
are applied more generally to companionship and community societies”, Steward and
Bennet (1991, p.7) say.
Steward and Bennet (1991, p.8) continue: “The true relationship between
companionship and community is revealed by a historical glance at the role of
technology in society, particularly the technologies for industry and war. Two

- 40 -
technical innovations in particular were critical – gunpowder for firearms and coke-
fired production of steel and iron for industry and war. Neither innovation was
Western.” McNeill (1982, p.24-39) found that “both technologies had appeared in
China by A.D. 1000. Iron and steel production evolved in China under the aegis of
dramatically social innovation – market regulated behaviour, which replaced the
obedience to command. But in the centuries between A.D. 1000 and 1600, the
companionship interpersonal reality of Chinese mandarins successfully held in
balance the community drive of successful entrepreneurs.”
Assumptions and values Steward and Bennet (1991, p.12) found that “people typically have a
strong sense of what the world is really like, so it is with surprise that they discover
that ‘reality’ is build up out of certain assumptions commonly shared among members
of the same culture. Cultural assumptions may be defined an abstract, organized,
general concepts which pervade a person’s outlook and behavior. They are
existential in that they define what is ‘real’ and the nature of that reality for member of
a culture. Assumptions are not themselves behavior, which is concrete, discrete, and
specific. Additionally, cultural assumptions exist by definition outside of awareness.”
Bem Daryl (1970, p.5) concludes: “In this sense, assumptions are like primitive zero-
order beliefs”. He defines them as follows: (Bem Daryl, 1970, p.5)
“So taken for granted that we are apt not to notice that we hold them at all;
we remain unaware of them until they are called to our attention or are brought into
question by some bizarre circumstance in which they appear to be violated”.
Kluckenhohn and Strodtbeck (1961, p.3) note that “beyond personal
preferences, there are important sub cultural variations:
“In most of the analyses of the common value element in culture
patterning, the dominant values of peoples have been overstressed and variant

- 41 -
values largely ignored … Our most basic assumption is that there is a systematic
variation in the realm of cultural phenomena which is both as definite and as
essential as the demonstrated systematic variation in physical and biological
phenomena.”
Cultural patterns of perception and thinking Steward and Bennet (1991, p.17) found that “in everyday small talk among
Americans, the subject of perception repeatedly crops up. American conversation is
sprinkled with words such as ‘see’, ‘hear’, and ‘perceive’. People will say ‘I hear that
…,’ or someone may ask, ‘What do you see happening now?’ A Common statement
is ‘I saw what was coming next.’” Steward and Bennet (1991, p.17) continue: “the
number and variety of references to perception and its synonyms suggest that the
concept is diffuse and ambiguous. Americans speaking in English use the concept
with two distinct meanings.” They illustrate the following example of a hiker saying:
“From the mountain, I saw the village in the valley,” then perception is an observation
in which physical features of the world register in the brain (Steward and Bennet,
1991, p.17). But when the same hiker then says, “I saw it was time to turn back and
descend to the village,” the situation is different. In this case “perception is like a
judgment, referring to an appraisal of a situation”. (Steward and Bennet, 1991, p.17)
Platt (1968, p.63-64) concludes: “Based on these observations, one can
see that human perception resembles a Janus-like figure consisting of two faces, one
looking inward and one looking outward. The inward-looking face is associated with
subjective processes of perceiving and thinking such as perspective, intuition,
opinions, and beliefs. The outward-looking face monitors features of the physical
world and registers sensory impressions of objects which in the case of a vision, for
instance, are attributes such as shape, color, texture and size.” Steward and Bennet
(1991, p.17) continue: “The outward face of perception is objective; only
- 42 -
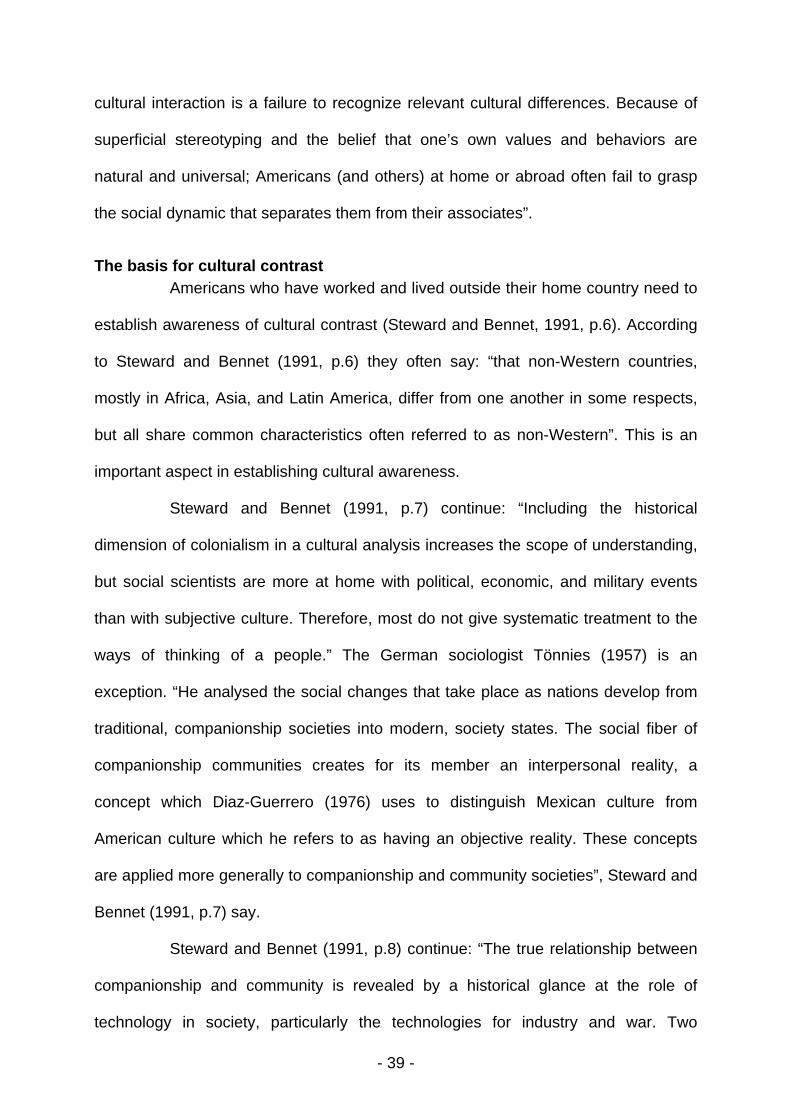
imperceptibly dies it shade off into the subjective and inward face.” The following
figure is a visual rendition of the perception/thinking process (Steward and Bennet,
1991, p.17):
Figure 3: Representation of human experience
Sensation Geldard (1953, p.53) found that “Human beings live in a world of
overwhelming sensations. The human eye is capable of identifying some 7,500,000
distinguishable colors”. Geldhard (1953, p.24) continues: “The human ear has been
estimated to respond to 340,000 discriminable sounds. Gregory (1970, p.12)
explains: “Smell, taste, touch, pain, and other senses signal information about
physical conditions that are immediately important for survival. Steward and Bennet
(1991, p.20) add: “Pain, touch and especially kinesthesis (movement) make us aware
of our own bodies and of interaction with objects in the environment. But human

- 43 -
beings live with only a vague awareness of the waves of stimulation that envelop the
sensory organs, are encoded, and eventually reach consciousness.”
Perception Perception is of paramount importance for this survey. Steward and
Bennet (1991, p.20) found that “the stable world we perceive is build in a succession
of perceptual stages through which objective features of the sensory stimuli are
encoded in increasingly complex structures of the brain. This encoding occurs first in
the perceptual process as percepts, perceptual objects, images and concepts.”
- 44 -
Barriers and gateways to communication
In this chapter basics of barriers and gateways to communication are
discussed.
Carl Rogers (2000, p.106) says: “Through my experience in counselling
and psychotherapy, I have found that there is one main obstacle to communication:
people’s tendency to evaluate. Fortunately, I have also discovered that if people can
learn to listen with understanding, they can mitigate their evaluative impulses and
greatly improve their communication with others.”
Barrier: The tendency to evaluate “We all have a natural urge to judge, evaluate, and approve (or
disapprove) another person’s statement,” Rogers (2000, p.106) says. For example, if
someone comments on what you have said, “I didn’t like what that man said.” There
are different ways to respond, but how will you do that? “Almost invariably your reply
will be either approval or disapproval of the attitude expressed.” (Rogers et al., 2000,
p.106) Rogers (2000, p.106) explains: “Either you respond, ‘I didn’t either; I thought it
was terrible,’ or else you say, ‘Oh, I thought it was really good.’ In other words, your
first reaction is to evaluate it from your point of view.”
Rogers (2000, p.106) adds: “Or suppose somebody says with some
feeling, ‘I think the Democrats are showing a lot of good sound sense these days.’
What is your first reaction? Most likely, it will be evaluative. You will find yourself
agreeing or disagreeing, perhaps making some judgment about him such as, ‘He
must be a liberal,’ or ‘He seems solid in his thinking.’”
Rogers (2000, p.106) continues: “If you have ever been a bystander at a
heated discussion – one in which you were not emotionally involved – you have
probably gone away thinking, ‘Well, they actually weren’t talking about the same
- 45 -
thing.’ And because it was heated, you were probably right. Each person was making
a judgment, an evaluation, from a personal frame of reference. There was nothing
that could be called communication in any real sense. And this impulse to evaluate
any emotionally meaningful statement from our own viewpoint is what blocks
interpersonal communication.”
Gateway: Listening with understanding Rogers (2000, p.106) has found that “we can achieve real communication
and avoid this evaluative tendency when we listen with understanding. This means
seeing the expressed idea and attitude from the other person’s point of view, sensing
how it feels to the person, achieving his or her frame of reference about the subject
being discussed.” This may sound absurdly simple, but it is not. Rogers (2000, p.106)
continues: “In fact, it is an extremely potent approach in psychotherapy. It is the most
effective way we have found to alter a person’s basic personality structure and to
improve the person’s relationships and communications with others. If I can listen to
what a person can tell me and really understand she hates her father or hates the
company or hates conservatives, or if I can catch the essence of her fear of insanity
or fear of nuclear bombs, I will be better able to help her alter those hatreds and fears
and establish realistic and harmonious relationships with the people and situations
that roused such emotions.” We know from research (Rogers, 2000, p.106) “that
such empathic understanding – understanding with a person, no about her – is so
effective that it can bring significant changes in personality.”
Rogers (2000, p.106) continues: “If you think that you listen well and yet
have never seen such results, your listening probably has not been of the type I am
describing. Here’s one way to test the quality of you understanding. The next time
you get into an argument with your spouse, friend, or small group of friends, stop the
discussion for a moment and suggest this rule: ‘Before each person speaks up, he or
- 46 -
she must first restate the ideas and feelings of the previous speaker accurately and
to that speaker’s satisfaction.’” This would mean a different approach than many
people do at the moment. “Before presenting your own point of view, you would first
have to achieve the other speaker’s frame of reference.” (Rogers et al., 2000, p.106)
Rogers (2000, p.107) asks the following question: “Why is this ‘listening’
approach not more widely used?” He mentions the following reasons: (Rogers et al.,
2000, p.107)
Lack of courage. “Listening with understanding means taking a very real
risk. If you really understand another person in this way, if you are willing to enter his
private world and see the way life appears to him, without any attempt to make
evaluative judgments, you run the risk of being changed yourself. You might see
things his way; you might find that he has influenced your attitudes or your
personality. Most of us are afraid to take that risk. So instead we cannot listen; we
find ourselves compelled to evaluate because listening seems to be too dangerous.”
Heightened emotions. “In heated discussions, emotions are strongest,
so it is especially hard to achieve the frame of reference of another person or group.
Yet it is precisely then that good listening is required if communication is to be
established. The influence of such an understanding catalyst in the group permits the
members to come closer to seeing the objective truth of the situation. This leads to
improved communication, to greater acceptance of each other, and to attitudes that
are more positive and more problem-solving nature.”
Too large a group. “Thus far, psychotherapists have been able to
observe only small, face-to-face groups that are working to resolve religious, racial,
or industrial tensions – or the personal tensions that are present in many therapy
groups. What about trying to achieve understanding between larger groups that are
geographically remote, for example, or between face-to-face groups that are

- 47 -
speaking not for themselves but simply as representatives for others?”
Rogers (2000, p.107) adds: “To be imaginative for a moment, suppose
that a therapeutically oriented international group went to each of two countries
involved in a dispute and said, ‘we want to achieve a genuine understanding of your
view, and even more important, of your attitudes and feelings towards X country. We
will summarize and resummarize these views and feelings if necessary, until you
agree that our description represents the situation as it seems to you. We can
understand the feelings of people who hate us much more readily when their
attitudes are accurately described to us by a neutral third party than we can when
they are shaking their fists at us.”
Rogers (2000, p.107) found that “communication through a moderator
who listens nonevaluatively and with understanding has proven effective, even when
feelings run high. This procedure can be initiated by one party, without waiting for the
other to be ready. It can even be initiated by a neutral third person, provided the
person can gain a minimum of cooperation from one of the parties. The moderator
can deal with insincerities, the defensive exaggerations, the lies and the ‘false fronts’
that characterize almost every failure in communication. These defense distortions
drop away with astonishing speed as people find that the person’s intention is to
understand, not to judge. And when one party begins to drop its defenses, the other
usually responds in kind, and together they begin to uncover the facts of a situation.”
General Observations Roethlisberger (2000, p.108) observed that “when we think about the
many barriers to personal communication, particularly those due to differences in the
background, experience and motivation, it seems extraordinary that any two people
can ever understand each other.” This is really an interesting aspect and shows that
communication and listening is not that simple. Roethlisberger (2000, p.108)
- 48 -
continues: “the potential for problems seems especially heightened in the context of a
boss-subordinate relationship. How is communication possible when people do not
see and assume the same thing or share the same values?”
Roethlisberger (2000, p.108) adds: “on this question, there are two
schools of thought. One school assumes that communication between A and B has
failed when B does not accept what A has to say as being factual, true, or valid; and
that the goal of communication is to get B to agree with A’s opinions, ideas, facts, or
information.” Roethlisberger (2000, p.108) continues: “The other school of thought is
quite different. It assumes that communication has failed when B does not feel free to
express his feelings to A because B fears they will not be accepted by A.
Communication is facilitated when A or B or both are willing to express and accept
differences.”
Roethlisberger (2000, p.109) explains that topic more detailed using the
following example: “To illustrate, suppose Bill, an employee, is in his boss’s office.
The boss says, ‘I think, Bill, that this is the best way to do your job.’ And to that, Bill
says, ‘Oh yeah?’ According to the first school of thought, this reply would be a sign of
poor communication; therefore, it is up to the boss to explain to Bill why the boss’s,
not Bill’s, way is the best.” Roethlisberger (200, p.109) states: “However, from the
second school’s point of view, Bill’s reply is a sign of neither good nor bad
communication; it is indeterminate. But the boss can take the opportunity to find out
what Bill means. In this case he would try to let Bill talk more about his job.”
Roethlisberger (2000, p.110) continues: ”We’ll call the boss representing the first
school of though ‘Mr Smith’ and the boss subscribing to the second school ‘Ms
Jones.’ Given identical situations, each behaves differently. Smith chooses to
explain; Jones chooses to listen. In my experience, Jones’s response works better
than Smith’s, because Jones is making a more proper evaluation of what is taking
- 49 -
place between her and Bill than Smith is.”
Roethlisberger (2000, p.110) continues with the story of Smith and Jones:
“Jones, remember, does not assume that she knows what Bill means when he says,
‘Oh yeah?’ so she has to find out. Moreover, she assumes that when Bill said this,
she had not exhausted his vocabulary or his feelings. Bill may mean not just one
thing but several different things. So Jones decides to listen. In this process, Jones is
not under any illusion that what will happen, will be purely logical exchange. Rather
she is assuming that what happens will be primarily an interaction of feelings.
Therefore, she cannot ignore Bill’s feelings, the effect of Bill’s feelings on her, or the
effect of her feelings on Bill. In other words, she cannot ignore her relationship to Bill;
she cannot assume that it will make no difference to what Bill will hear or accept.”
Roethlisberger (2000, p.110-111) remarks: “Therefore, Jones will be
paying strict attention to all of the things Smith has ignored. She will be addressing
herself to Bill’s feelings, her own feelings, and the interaction between them. Jones
will therefore realize that she has ruffled Bill’s feelings with her comment, ‘I think, Bill,
this is the best way to do your job.’ So instead of trying to get Bill to understand her,
she decides to try to understand Bill. She does this by encouraging Bill to speak.
Instead of telling Bill how he should feel or think, she asks Bill such questions as, ‘Is
this what you feel?’ ‘Is this what you see?’ ‘Is this what you assume?’ Instead of
ignoring Bill’s evaluations as irrelevant, not valid, inconsequential, or false, she tries
to understand Bill’s reality as he feels it, perceives it, and assumes it to be. As Bill
begins to open up, Jones’s curiosity is piqued by this process.”
Roethlisberger (2000, p.111) explains: “Bill isn’t so dumb; he’s quite an
interesting guy”. This becomes Jones’s attitude. “And that is what Bill hears.
Therefore Bill feels understood and accepted as a person. He becomes less
defensive. He is in a better frame of mind to explore and re-examine his perceptions,
- 50 -
feelings, and assumptions. Bill feels free to express his differences. In this process,
he sees Jones as a source of help and feels that Jones respects his capacity for self-
direction. These positive feelings towards Jones make Bill more inclined to say, ‘Well,
Jones, I don’t quite agree with you that this is the best way to do my job, but I’ll tell
you what I’ll do. I’ll try to do it that way for a few days, and then I’ll tell you what I
think.’” (Roethlisberger, 2000, p.111)
From this example, Roethlisberger (2000, p.111) makes the following
generalizations:
1. “Smith represents a very common pattern of misunderstanding. The
misunderstanding does not arise because Smith is not clear enough in
expressing himself. Rather, Smith misevaluates what takes place when two
people are talking together.”
2. “Smith’s misunderstanding of the process of personal communication is based
on common assumptions: (a) that what is taking place is something logical; (b)
that words mean something in and of themselves, apart from people speaking
them; (c) that the purpose of the interaction is to get Bill to see things from
Smith’s point of view.”
3. “These assumptions set off a chain reaction of perceptions and negative
feelings, which blocks communication. By ignoring Bill’s feelings and
rationalizing his own, Smith ignores his relationship to Bill as an important
determinant of their communication. As a result, Bill hears Smith’s attitude
more clearly than the logical content of Smith’s words. Bill feels that his
uniqueness is being denied. Since his personal integrity is at stake, he
becomes defensive and belligerent. And this frustrates Smith. He perceives
Bill as stupid, so he says and does things that make Bill still more defensive.”

- 51 -
4. “Jones makes a different set of assumptions: (a) that what is taking place
between her and Bill is an interaction of sentiments; (b) that Bill – not his
words in themselves – means something; and (c) that the object of interaction
is to give Bill a chance to express himself.”
5. “Because of these assumptions, there is a psychological chain reaction of
reinforcing feelings and perceptions that eases communication between Bill
and Jones. When Jones addresses Bill’s feelings and perceptions from Bill’s
point of view, Bill feels understood and accepted as a person; he feels free to
express his differences. Bill sees Jones as a source of help; Jones sees Bill as
an interesting person. Bill, in turn, becomes more cooperative.”
From these very common patterns of personal communication,
Roethlisberger (2000, pg.111) infers some interesting hypotheses: (Roethlisberger,
2000, p.111)
• “Jones’s method works better than Smith’s not because of any
magic but because Jones has a better map of the process of
personal communication”
• “Jones’s method, however, is not merely an intellectual exercise. It
depends on Jones’s capacity and willingness to see and accept
points of view that are different from her own and to practice this
orientation in a face-to-face relationship. This is an emotional and
intellectual achievement. It depends in part on Jones’s awareness
of herself, in part on the practice of a skill.”
• “Although universities try to get students to appreciate, at least
intellectually, points of view different from their own, little is done to
help them learn to apply this intellectual appreciation simple, face-

- 52 -
to-face relationships. Students are trained to be logical and clear –
but no one helps them to learn to listen carefully. As a result, our
educated world contains too many Smiths and too few Joneses.”
Roethlisberger (2000, p.111) concludes: “The biggest block between two
people is their inability to listen to each other intelligently, understandingly, and
skillfully. This deficiency in the modern world is widespread and appalling. We need
to make greater efforts to educate people in effective communication – which means,
essentially, teaching people how to listen.”
- 53 -
Chapter 4 - Communication at es-k The company es-k® it-solutions are a merger of high professionals with
manifold skills. It is a small and highly flexible ICT consulting and software
development company. The primary focus lies on consulting services regarding
business process reengineering using information technology in order to optimize
these processes. Information technology is used as an enabler for new processes or
for optimizing existing ones.
Statement of the problem
“I did not say that I didn’t say it. I said that I did not say that I said it. I want
to make that very clear.”- G. Romney
Communication is always about people - but there are cultural barriers that
have to be addressed. There are different barriers like the ones “caused by
semantics” and the others “caused by word and annotations” (Robbins, 2003, p.302).
In order to overcome these and other barriers caused by an international network
working with a customer in the local country, there are several issues that have to be
addressed.
Communication issues
The two main problem areas are communication between the customer
and es-k® it-solutions as well as es-k® it-solutions and the development partner:
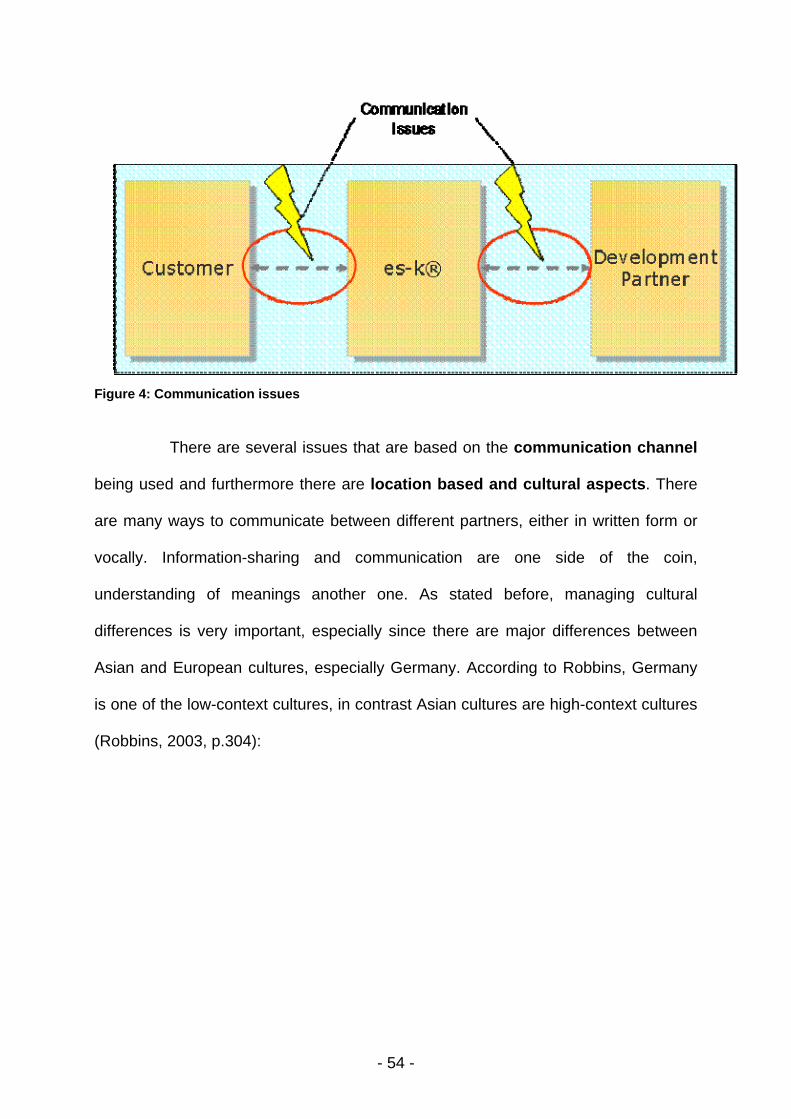
- 54 -
Figure 4: Communication issues
There are several issues that are based on the communication channel
being used and furthermore there are location based and cultural aspects. There
are many ways to communicate between different partners, either in written form or
vocally. Information-sharing and communication are one side of the coin,
understanding of meanings another one. As stated before, managing cultural
differences is very important, especially since there are major differences between
Asian and European cultures, especially Germany. According to Robbins, Germany
is one of the low-context cultures, in contrast Asian cultures are high-context cultures
(Robbins, 2003, p.304):

- 55 -
Figure 5: High vs. Low Context Cultures
Capon (2000, p.304) found that “High-context cultures heavily rely on non-
verbal and subtle situational cues in communication”. This can cause major
difficulties, which es-k® it-solutions experienced when working with partners in Asian
countries. Some nearshore activities with Eastern Europe were more successful,
mainly because of the significantly smaller cultural differences.
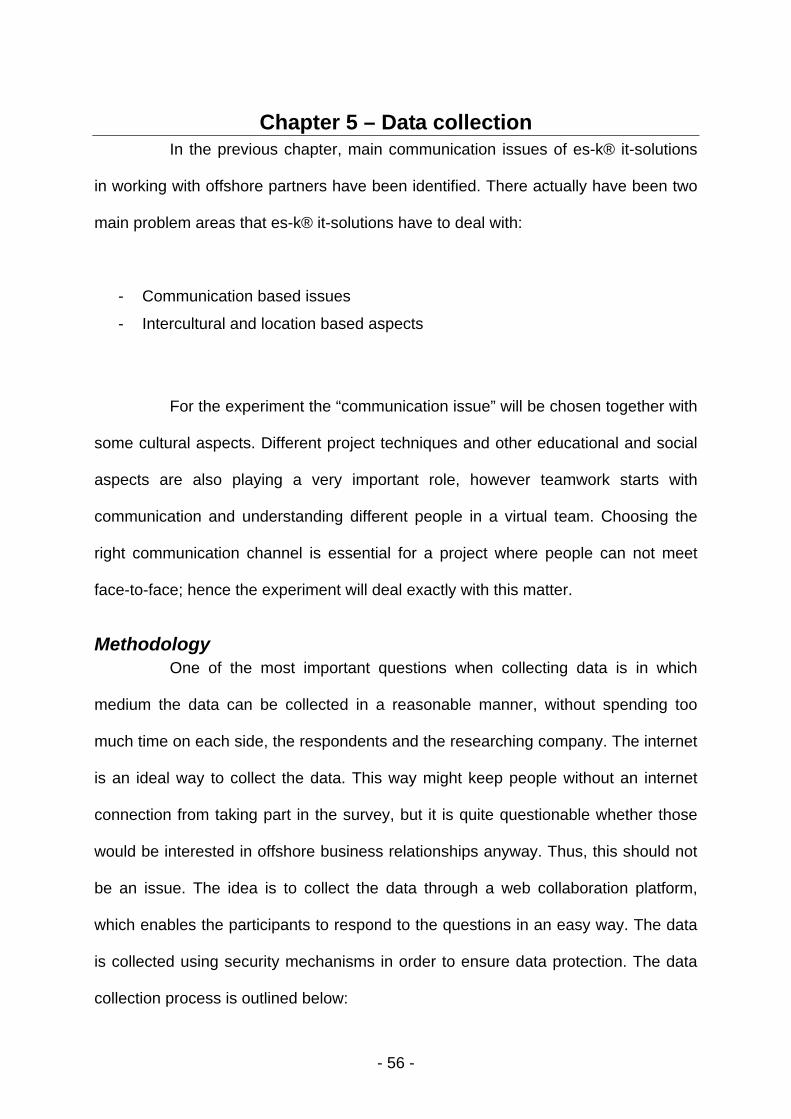
- 56 -
Chapter 5 – Data collection In the previous chapter, main communication issues of es-k® it-solutions
in working with offshore partners have been identified. There actually have been two
main problem areas that es-k® it-solutions have to deal with:
- Communication based issues
- Intercultural and location based aspects
For the experiment the “communication issue” will be chosen together with
some cultural aspects. Different project techniques and other educational and social
aspects are also playing a very important role, however teamwork starts with
communication and understanding different people in a virtual team. Choosing the
right communication channel is essential for a project where people can not meet
face-to-face; hence the experiment will deal exactly with this matter.
Methodology One of the most important questions when collecting data is in which
medium the data can be collected in a reasonable manner, without spending too
much time on each side, the respondents and the researching company. The internet
is an ideal way to collect the data. This way might keep people without an internet
connection from taking part in the survey, but it is quite questionable whether those
would be interested in offshore business relationships anyway. Thus, this should not
be an issue. The idea is to collect the data through a web collaboration platform,
which enables the participants to respond to the questions in an easy way. The data
is collected using security mechanisms in order to ensure data protection. The data
collection process is outlined below:

- 57 -
Figure 6: Data Collection Process
The respondents enter their answers in an online form. The web
application stores the results directly in a database. The analyst can retrieve the data
later on from the database and analyse the sample data in a spreadsheet or any
other suitable tool.
Analysed data
The observed data was specified in the previous chapter. Several
communication channels will be investigated regarding their usability, usage and
other factors, as shown below:
Usability Usage Security Audit Trail Impact of Time Zones Perception1 Electronic Mail System2 Newsgroups / Bulletin Boards3 Text based Conferencing Systems (Chat)4 Audio based Conferencing Systems5 Video based Conferencing Systems6 Meeting Support Systems
(e.g. Yahoo Messenger, Net meeting, ..)7 Workflow Systems
(IBM MQ-Series, Lotus Notes, ..)8 Shared Editor / Whiteboards9 Shared Workspace Virtual Environments
(virtual reality)10 Telephone11 Fax
Figure 7: Questionnaire
The sample size is to be expected at a reasonable level and should cover
different types of people, ranking from management level to general workers as well
as people from different countries.
For each communication media a variable score from 1 to 5 will be used to
identify the grade of usage, the usability or other measures for each question of the

- 58 -
survey. The meaning of the score is outlined below:
Figure 8: Score of each investigated variable
Each variable stands for a different question which can be used for the
analysis after the data is collected. The meaning of each is explained below:
• Usability: The usability should represent the respondent’s perception
of the usability of each communication channel (from low to high)
• Usage: The usage should represent the actual usage of the
communication channel by the respondent (from never to always)
• Security: Security is used to identify the perceived security of the given
channel (from low to high)
• Audit Trail: This criteria represents the usability of the communication
channel to create an audit trail easily (from low to high)
• Impact of Time Zones: How much is the impact of different time zones
on the communication channel? (from low to high)
• Perception: This question refers to the perception of the
communication channel and is ranked from low to high. High means a
good perception and low a bad one.
In addition there is an option for the respondent to enter some general
information, but this is not a requirement since not everybody might want to enter
those personal details. The following details are collected on a voluntary basis:
• Status (Employee, Manager, etc.)
• The company size
• The country the respondent works and lives in

- 59 -
Experimental design
The experimental design and the data collection process are depending
very much on the experiment itself and the scope of the whole investigation. The
data collection will be done using an internet platform. This makes it possible to
easily collect information from respondents all over the world and will reduce the time
needed to transform the data into an appropriate format. The collected data can
easily be used for further analysis, since it is already stored in a database. Other
solutions such as email or letter correspondence would always involve manual data
preparation. Regarding the goal to eliminate as much manual work as possible the
decision was made no to use such sources.
Online SurveyOnline Survey
- Worldwide access- Restricted access- Direct storage in database- Single solution- Easy to maintain
- Worldwide access- Restricted access- Direct storage in database- Single solution- Easy to maintain
E-Mail / Letter …E-Mail / Letter …- Hard to maintain- Manual data extraction- Several interfaces required - Analysis more difficult!
Figure 9: Data Collection
As a result of this approach, the effort of data collection should be reduced
to a minimum. The most difficult aspect regarding the survey is, to find an appropriate
number of respondents, who are willing to fill out the form and answer the questions.
But there might be incentives that could be used to attract the respondents, such as
promising them to receive the survey results once the analysis is completed.
General approach When carrying out an experiment, first of a decision has to be made, such
as: “Which type of test should be carried out?
One option is a matched-pair experiment. Such designs arise when:

- 60 -
(McCarthy, 2004)
- Same observations are exposed to 2 treatments over time
- Before and after experiments (temporally related)
- Side-by-side experiments (spatially related)
McCarthy (2004) continues: “This model makes the assumption that
without the intervention; things will go on as they did before. With the intervention,
things will change over time; it is hoped in a positive way.”
Blum et al. (1991 cited in Yap et al., 2000) found that “if the pattern of
achievement shows an upward trend over time (say, several years) then one can
interpret the trend as evidence of sustained effects of the intervention. Therefore, this
approach is some kind of a reduced time-series.
The pretest-posttest model is relatively easy to implement.” Important
steps include the following: (Yap et al., 2000)
Implementation StepsImplementation Steps
1 Decide what outcomes you want to look at1 Decide what outcomes you want to look at
2 Select or develop instruments to collect the pertinent data2 Select or develop instruments to collect the pertinent data
3 Decide whether sampling is desired3 Decide whether sampling is desired
4 Administer the instruments to target groups at pretest time 4 Administer the instruments to target groups at pretest time
5 Administer the instruments at posttest time 5 Administer the instruments at posttest time
6 Analyze and interpret the evaluation data6 Analyze and interpret the evaluation data
7 Report findings to stakeholder groups7 Report findings to stakeholder groups
8 Use evaluation data for accountability and program improvement8 Use evaluation data for accountability and program improvement
Figure 10: Implementation Steps
The steps are explained more specific for the experiment below (Yap et
al., 2000):

- 61 -
1. First, the outcomes, which should be investigated, have to be defined. The
main aspect of the analysis is to match current usage and perception of
communication channels against their channels richness and usability for their
purpose.
2. An internet platform is chosen to collect the pertinent data
3. Sampling is not required, also because of the nature of the sample and its
small size
4. There is no specific setup required
5. The same instruments are used as in the pre-test
6. The analysis should be done according to the details described in the previous
chapters
7. The findings should be reported to all stakeholders, including the respondents
8. Based on the findings, further investigation of improvements should be done
After the pre-test has be done successfully, a post-test later on (may be 1
or 2 years) should help to track the changes and see whether the initiated actions
have been successful!
Prediction efforts A further aspect of statistics is prediction. Regression analyses can be
used in order to predict future values, such as predicted sales volumes and other
important factors. Even seasonal factors can be incorporated in a prediction model,
which helps to be even more accurate. Even though, predictions can fail, especially
when exceptional events occur such as September 11th or other unexpected events.
This experiment however, is not like sales data or other predictable data,
which would be appropriate for such an analysis. It is more about an evaluation of the
status quo and then to develop a course of action in conjunction with a constant
monitoring of the success later on. Nevertheless, prediction in the area of
communication channels that are used would be very interesting, but this would go
beyond the scope of this experiment!

- 62 -
Descriptive analysis
The descriptive analysis is a very important part of the study. As
mentioned before, the primary issue is communication and the current usage of
different communication channels as well as their usability for the actual purpose.
Background and research information does play a very important role, since the
information is used to interpret and analyse the results from the observation. In the
previous chapters, some background information about virtual enterprises and
communication channels were given. This will be used as a basis for the descriptive
analysis in order to provide appropriate background information. The summary
statistics as well as breakdown analyses will follow these introductory items. In the
end, a summary and conclusion section will bring closure:
Figure 11: Methodology
Summary statistics In this section, more general statistics are shown, such as a correlation
matrix (as outlined in the following chapter, Table 5: Table of correlations).
Furthermore, general ranking of the different media should show the results at a
glance. General questions, such as “Which is the most preferred communication
channel?” should be addressed. The overall ranking of each communication channel
could be calculated in different ways. A feasible easily adaptable approach will be
used for the analysis. Several variables are added using weights (w1-w5), which
weights can be adjusted for different purposes:
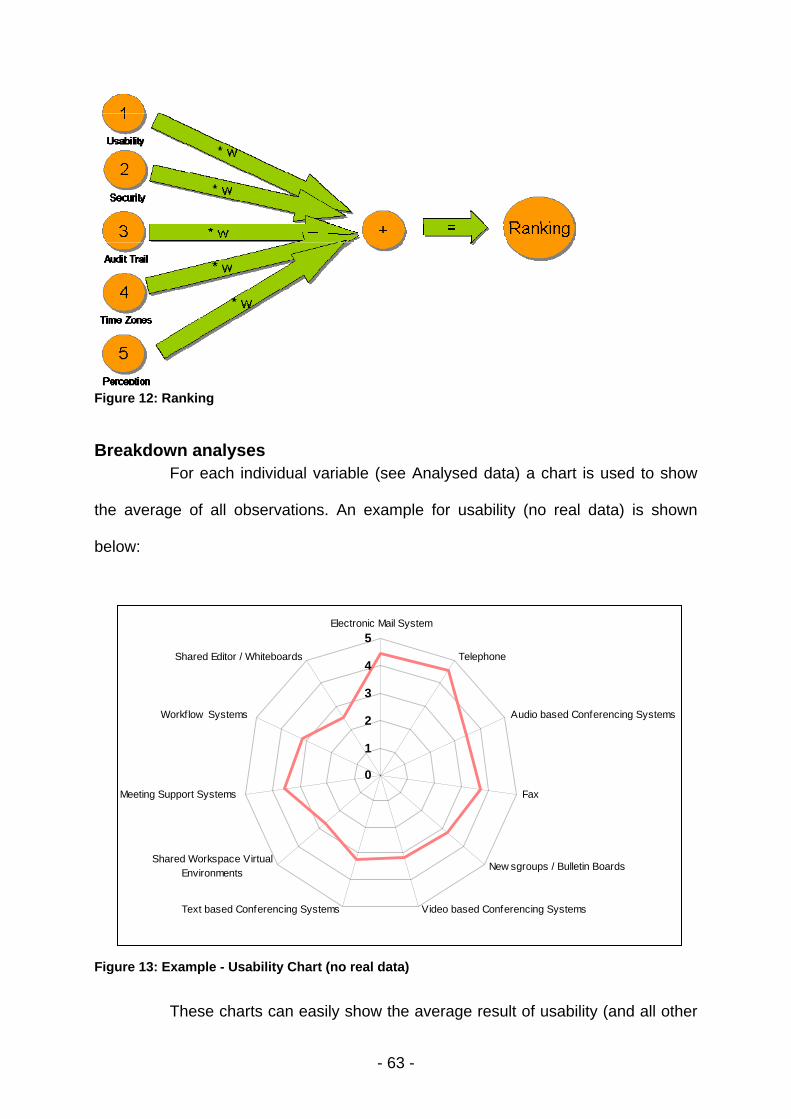
- 63 -
Figure 12: Ranking
Breakdown analyses For each individual variable (see Analysed data) a chart is used to show
the average of all observations. An example for usability (no real data) is shown
below:
0
1
2
3
4
5Electronic Mail System
Telephone
Audio based Conferencing Systems
Fax
New sgroups / Bulletin Boards
Video based Conferencing SystemsText based Conferencing Systems
Shared Workspace VirtualEnvironments
Meeting Support Systems
Workflow Systems
Shared Editor / Whiteboards
Figure 13: Example - Usability Chart (no real data)
These charts can easily show the average result of usability (and all other

- 64 -
aspects) for each individual communication channel.
Details and conclusion This is the last part of the descriptive presentation and may be the most
important one. In this section, conclusions are drawn from the investigated data such
as:
- Which channels are used the most?
- Are these channels secured?
- What about the channel richness?
Especially security is a big issue, as one can see from daily warning about
new computer viruses. However, according to an IDC white paper, “many companies
still lack proper security standards” (Carey et al., 2002). Such background
information can be used to verify current standards and tools and to make people
more aware of potential impacts of security, which in virtual enterprises with
necessary collaboration platforms play a very important role!
Inferential analysis
In the following paragraphs the inferential part of the analysis is discussed
in all details. The main focus is on the ANOVA which will be also part of the next
chapter (Chapter 6 - Data analysis).
Analysis type Joel (2004) explains that “an inferential study can be either exploratory or
confirmatory”. The following figures show some background information as well as
the pros and cons of both types (Joel, 2004):

- 65 -
Confirmatory Analysis
Inferential Statistics - Deductive Approach
Heavy reliance on probability models
Must accept untestable assumptions
Look for definite answers to specific questions
Emphasis on numerical calculations
Hypotheses determined at outset
Hypothesis tests and formal confidence interval estimation
PRO
Provide preciseinformation in the rightcircumstances
Well-established theoryand methods
CONS
Misleading impression ofprecision in less than idealcircumstances
Analysis driven bypreconceived ideas
Difficult to noticeunexpected results
Figure 14: Confirmatory analysis
Figure 15: Exploratory analysis
The data which is collected and the way the experiment is set up suggest
a more intuitive and not a direct way of analysing the data.

- 66 -
Basic goal Schwarz (2004) found that “it is important to distinguish between a
population parameter and a sample statistic.” Schwarz (2004) continues: “A
parameter is a numerical summary of a population; because populations have so
many members, these can never be known except if a census is taken.”
In general, the aim is to find an estimate for the population mean using the
collected sample data in order to derive general conclusions. Using the results of the
statistical analysis further conclusions should be drawn which help to find appropriate
ways to improve communication issues in cross border communication.
ANOVA analysis The ANOVA (ANalysis Of VAriance) is one instrument which is used in
this dissertation. Regarding to Wikipedia (2006) the ANOVA is: “… a collection of
statistical models and their associated procedures which compare means by splitting
the overall observed variance into different parts.” In our case, we can use the
ANOVA to analyse the data set more detailed and to get answers to questions such
as:
- “Is the preference for e-mail as a way of communication unaffected by the
cultural factors examined?”
- “Do the respondents perceive all communication channels as equally secure?”
The ANOVA results are given in an ANOVA table. The following table
shows an example:

- 67 -
Figure 16: ANOVA example
In this case, we can reject the null hypothesis (all mean are equal), since
the p-value is below the 0.05 significance level and the F-value is high (Albright et. al,
2003, p.531). The complete ANOVA of the given data set will follow in section
“Inferential analysis (ANOVA)” in the next chapter.
Application of the findings
Once the data is collected and the appropriate analyses are made. First a
complete review of currently used communication channels will be undertaken, and
ways to improve them should be investigated. If the findings show that people have
sometimes a wrong perception of more suitable communication media, then they
should be made aware of the benefits from changing to other media. Overall, a
complete review of the status quo is useful in order to derive appropriate action
alternatives:

- 68 -
FindingsFindings
Derive actionalternatives
Derive actionalternatives
TrainingTrainingUse other mediaUse other media Influence perceptionInfluence perception ……
Figure 17: Apply Findings
Implication There might be various implications from the findings of the study. One
part of the study considers distance as an important factor. This by means of the
ability to have an ad-hoc meeting face-to-face when required. A 2-4 hours flight in
that scenario would not be a big problem, but what about a travel time of 20 hours or
more? Thus, the result of the study might significantly influence the long-term
strategy of a balance between on-, near- and offshore development as a whole!
FindingsFindings
StrategyStrategy
Change strategy?Change strategy?New Opportunities?New Opportunities?
Figure 18: Implications

- 69 -
Chapter 6 - Data analysis The chapter “Data Analysis” consists of two main parts, first of all some
summary statistics and then some breakdown analyses.
Summary statistics
In this paragraph summary statistics are presented to show the data
analysis at a glance. These statistics should give the reader more insight into the
survey and provide basic statistics which are broken down in the next paragraphs.
The analysis at a glance As discussed in the previous chapters, the aim of the online survey was to
find our more about the working habits of the respondents. In this paragraph more
details about the surveyed persons are shown, this with regards to their location,
company size and function. It is to be noted, that the information was collected on a
voluntary basis and therefore is not available for all observations.
Number of respondents The survey was online for about 2 months and there was enough time for
many people to respond. The goal was to get more respondents by addressing them
through different channels. One way was to post a mail to known students. In
addition, the MBA event portal (MBA Events, 2005) was used to send a request to
about 150 potential respondents and at last a post in the Laureate Embanet platform
was used to get more responses.
Figure 19: Respondents of the survey

- 70 -
With this approach it was possible, to get finally 83 responses for the
survey.
Details of respondents In this paragraph the details of the respondents are analysed further. As
one can see from the following figure, the respondents came from various countries:
Germany21%
United Kingdom11% Saudi Arabia
2%
The Netherlands4%
Nigeria1%
United Arab Emirates1%
United States1%
Canada1%
China1%
Denmark1%
France1%
Indonesia1%
n/a53%
Luxembourg1%
Figure 20: Countries of respondents
Country # RespondentsGermany 17United Kingdom 9The Netherlands 3Saudi Arabia 2United States 1United Arab Emirates 1Nigeria 1Luxembourg 1Indonesia 1France 1Denmark 1China 1Canada 1n/a 43
Sum: 83 Table 1: Countries of respondents
Most respondents came from Germany, followed by the United Kingdom
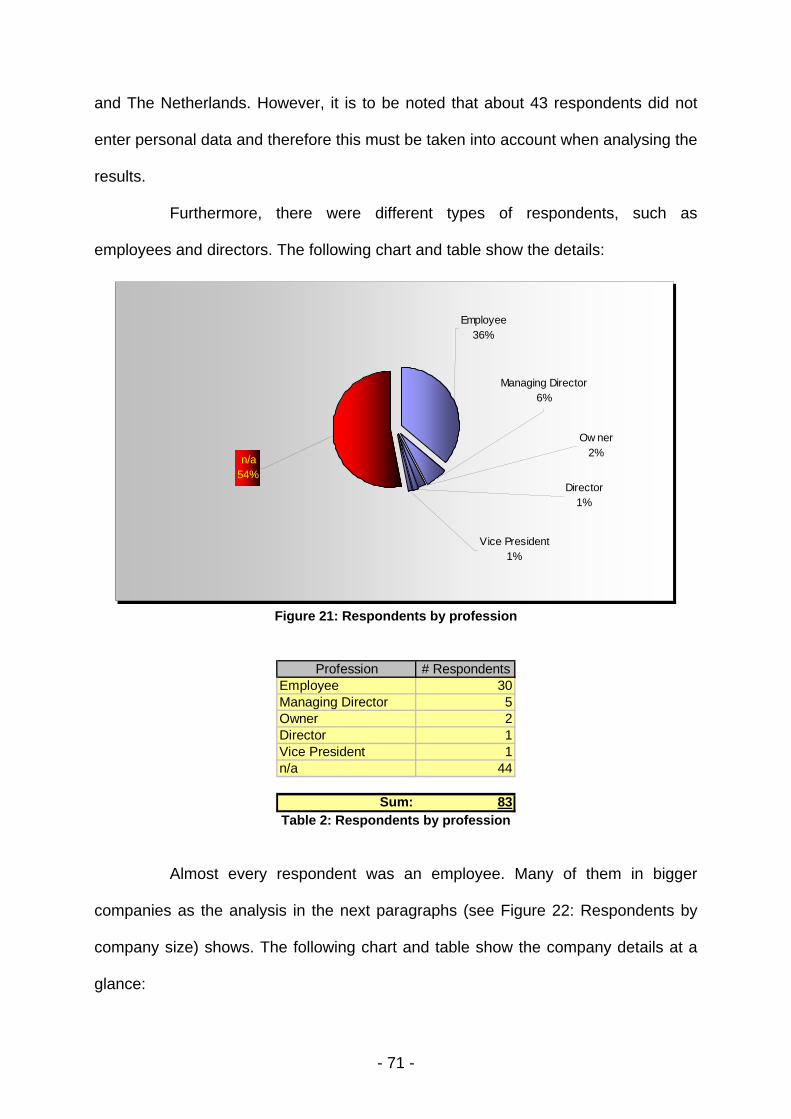
- 71 -
and The Netherlands. However, it is to be noted that about 43 respondents did not
enter personal data and therefore this must be taken into account when analysing the
results.
Furthermore, there were different types of respondents, such as
employees and directors. The following chart and table show the details:
Vice President1%
n/a54%
Ow ner2%
Director1%
Managing Director6%
Employee36%
Figure 21: Respondents by profession
Profession # RespondentsEmployee 30Managing Director 5Owner 2Director 1Vice President 1n/a 44
Sum: 83 Table 2: Respondents by profession
Almost every respondent was an employee. Many of them in bigger
companies as the analysis in the next paragraphs (see Figure 22: Respondents by
company size) shows. The following chart and table show the company details at a
glance:

- 72 -
n/a61% >=100 and
<10007%
<106%
>=10 and <1008%
>=100018%
Figure 22: Respondents by company size
Company Size # Respondents>=1000 15>=10 and <100 7>=100 and <1000 6<10 5n/a 50
Sum: 83 Table 3: Respondents by company size
Most respondents come from big companies, only some come from
smaller ones. However, 50 respondents did not enter the data.
Correlation analysis In the following paragraphs several correlation analyses are performed.
First of all the correlation between the different attributes (usability, usage, etc.) is
performed and then in a second analysis the correlation of between the investigated
variables of the second section (different mother tongue, different time zones …) of
the survey is shown.
For a better understanding of the correlation analysis, the following
definitions should be used. Thus, correlation can be classified by weak, moderate
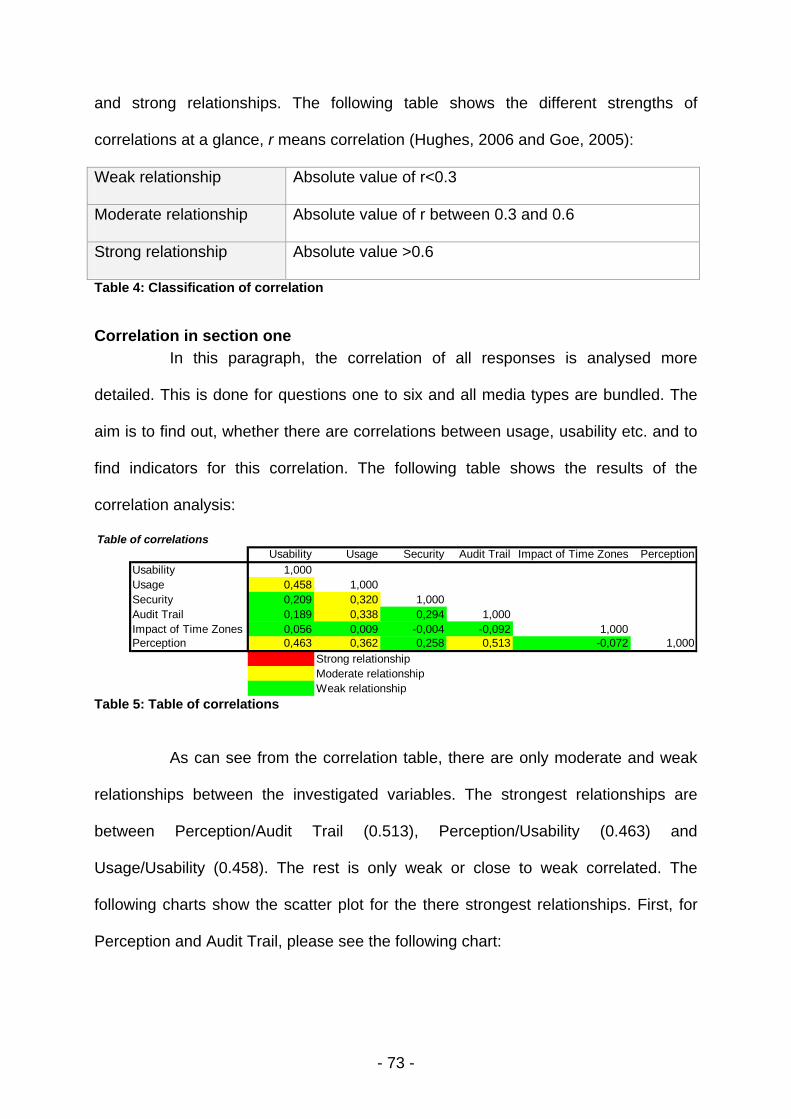
- 73 -
and strong relationships. The following table shows the different strengths of
correlations at a glance, r means correlation (Hughes, 2006 and Goe, 2005):
Weak relationship Absolute value of r<0.3
Moderate relationship Absolute value of r between 0.3 and 0.6
Strong relationship Absolute value >0.6
Table 4: Classification of correlation
Correlation in section one In this paragraph, the correlation of all responses is analysed more
detailed. This is done for questions one to six and all media types are bundled. The
aim is to find out, whether there are correlations between usage, usability etc. and to
find indicators for this correlation. The following table shows the results of the
correlation analysis:
Table of correlationsUsability Usage Security Audit Trail Impact of Time Zones Perception
Usability 1,000Usage 0,458 1,000Security 0,209 0,320 1,000Audit Trail 0,189 0,338 0,294 1,000Impact of Time Zones 0,056 0,009 -0,004 -0,092 1,000Perception 0,463 0,362 0,258 0,513 -0,072 1,000
Strong relationshipModerate relationshipWeak relationship
Table 5: Table of correlations
As can see from the correlation table, there are only moderate and weak
relationships between the investigated variables. The strongest relationships are
between Perception/Audit Trail (0.513), Perception/Usability (0.463) and
Usage/Usability (0.458). The rest is only weak or close to weak correlated. The
following charts show the scatter plot for the there strongest relationships. First, for
Perception and Audit Trail, please see the following chart:
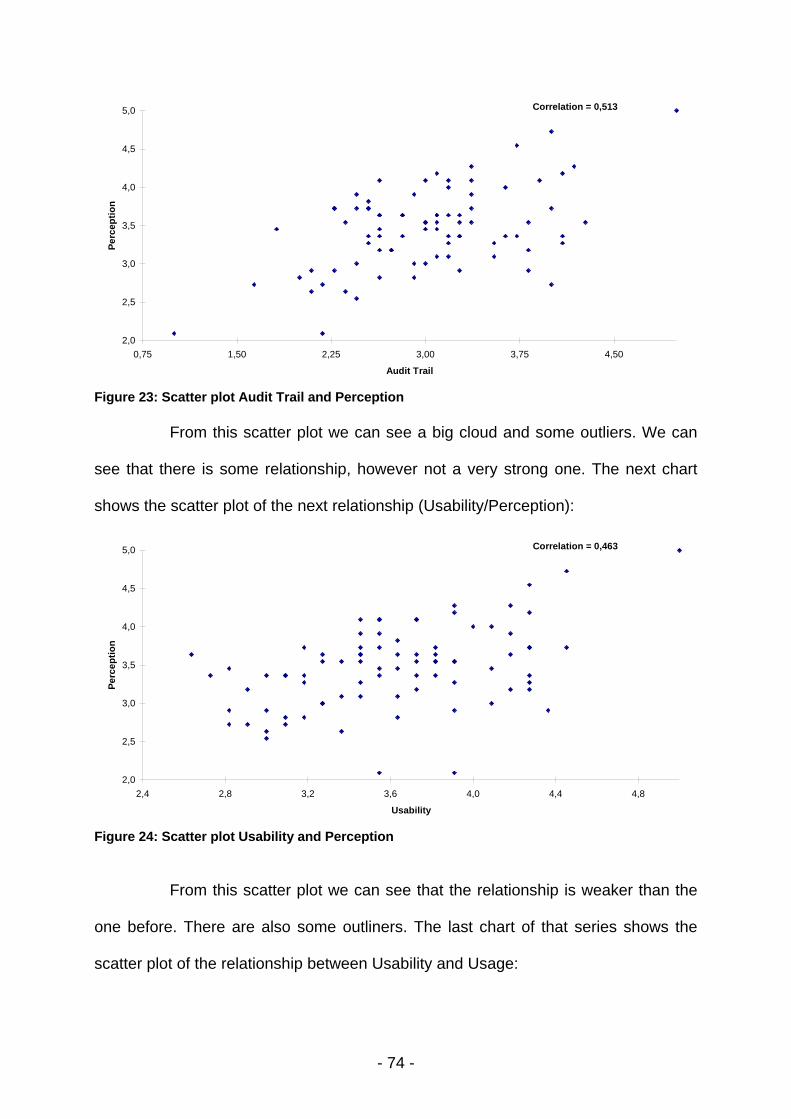
- 74 -
2,0
2,5
3,0
3,5
4,0
4,5
5,0
0,75 1,50 2,25 3,00 3,75 4,50
Audit Trail
Perc
eptio
nCorrelation = 0,513
Figure 23: Scatter plot Audit Trail and Perception
From this scatter plot we can see a big cloud and some outliers. We can
see that there is some relationship, however not a very strong one. The next chart
shows the scatter plot of the next relationship (Usability/Perception):
2,0
2,5
3,0
3,5
4,0
4,5
5,0
2,4 2,8 3,2 3,6 4,0 4,4 4,8
Usability
Perc
eptio
n
Correlation = 0,463
Figure 24: Scatter plot Usability and Perception
From this scatter plot we can see that the relationship is weaker than the
one before. There are also some outliners. The last chart of that series shows the
scatter plot of the relationship between Usability and Usage:

- 75 -
1,8
2,4
3,0
3,6
4,2
4,8
2,4 2,8 3,2 3,6 4,0 4,4 4,8
Usability
Usa
geCorrelation = 0,458
Figure 25: Scatter plot Usability and Usage
From this scatter plot we can see that the relationship is a bit weaker than
the one before. There are also some outliners.
Correlation in section two In this paragraph, the correlation of all responses in section two is
analysed more detailed. This is done for questions in the second section. The aim is
to find out, whether there are correlations between different mother tongue and
different time zones etc. and to find indicators for this correlation. The following table
shows the results of the correlation analysis:
Different Mother Tongue
Different time zones
Cultural diversity
Diversity in project
techniquesDistance < 2
hours flightDistance > 2
hours flight
Different Levels of
EducationDifferent Mother Tongue 1,000Different time zones 0,387 1,000Cultural diversity 0,329 0,366 1,000Diversity in project techniques 0,251 0,254 0,436 1,000Distance < 2 hours flight 0,461 0,377 0,248 0,170 1,000Distance > 2 hours flight 0,461 0,377 0,248 0,170 1,000 1,000Different Levels of Education 0,319 0,232 0,304 0,149 0,258 0,258 1,000
Strong relationshipModerate relationshipWeak relationship
Table 6: Table of correlations for section two
In this table we can see, that there are again only weak and moderate
relationships. Furthermore, it is to be noted that not all comparisons make really
sense with regards to the analysis of correlations, e.g. correlation between “<2 hours
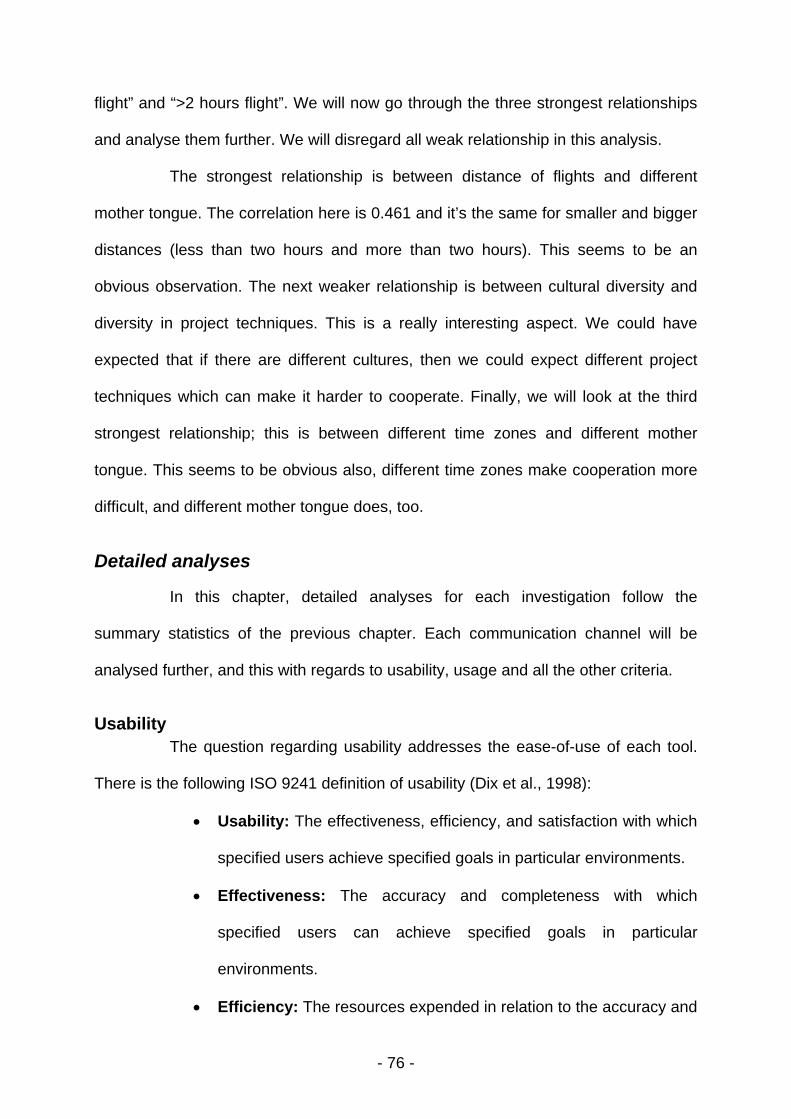
- 76 -
flight” and “>2 hours flight”. We will now go through the three strongest relationships
and analyse them further. We will disregard all weak relationship in this analysis.
The strongest relationship is between distance of flights and different
mother tongue. The correlation here is 0.461 and it’s the same for smaller and bigger
distances (less than two hours and more than two hours). This seems to be an
obvious observation. The next weaker relationship is between cultural diversity and
diversity in project techniques. This is a really interesting aspect. We could have
expected that if there are different cultures, then we could expect different project
techniques which can make it harder to cooperate. Finally, we will look at the third
strongest relationship; this is between different time zones and different mother
tongue. This seems to be obvious also, different time zones make cooperation more
difficult, and different mother tongue does, too.
Detailed analyses
In this chapter, detailed analyses for each investigation follow the
summary statistics of the previous chapter. Each communication channel will be
analysed further, and this with regards to usability, usage and all the other criteria.
Usability The question regarding usability addresses the ease-of-use of each tool.
There is the following ISO 9241 definition of usability (Dix et al., 1998):
• Usability: The effectiveness, efficiency, and satisfaction with which
specified users achieve specified goals in particular environments.
• Effectiveness: The accuracy and completeness with which
specified users can achieve specified goals in particular
environments.
• Efficiency: The resources expended in relation to the accuracy and

- 77 -
completeness of goals achieved.
• Satisfaction: The comfort and acceptability of the work system to
its users and other people affected by its use.
The following table shows the usability analysis at a glance:
No Communication Channel Min Max Range Mean StdDev1 Electronic Mail System 3 5 2 4,80 0,492 Newsgroups / Bulletin Boards 1 5 4 3,57 0,973 Text based Conferencing Systems (Chat) 1 5 4 3,71 0,964 Audio based Conferencing Systems 1 5 4 3,42 1,035 Video based Conferencing Systems 1 5 4 3,10 1,216 Meeting Support Systems (e.g. Yahoo Messenger, Net meeting, ..) 1 5 4 3,59 1,047 Workflow Systems (IBM MQ-Series, Lotus Notes, ..) 1 5 4 3,07 1,128 Shared Editor / Whiteboards 1 5 4 2,92 0,979 Shared Workspace Virtual Environments (virtual reality) 1 5 4 2,76 1,15
10 Telephone 1 5 4 4,66 0,8511 Fax 1 5 4 4,24 1,07
Table 7: Usability details
From that table we can see that the range is the same for all
communication channels, except electronic mail. Here, the minimum is three and the
maximum is five! Therefore, and because of the high mean value, we can see that
this communication channel is seen as very usable for all respondents.
Analysis by the mean The following table shows the usability results of the survey ordered by the
mean:
No Communication Channel Min Max Range Mean1 Electronic Mail System 3 5 2 4,802 Telephone 1 5 4 4,663 Fax 1 5 4 4,244 Text based Conferencing Systems (Chat) 1 5 4 3,715 Meeting Support Systems (e.g. Yahoo Messenger, Net meeting, ..) 1 5 4 3,596 Newsgroups / Bulletin Boards 1 5 4 3,577 Audio based Conferencing Systems 1 5 4 3,428 Video based Conferencing Systems 1 5 4 3,109 Workflow Systems (IBM MQ-Series, Lotus Notes, ..) 1 5 4 3,07
10 Shared Editor / Whiteboards 1 5 4 2,9211 Shared Workspace Virtual Environments (virtual reality) 1 5 4 2,76
Table 8: Usability ordered by the mean
From this table we can see that “Electronic Mail” is seen as the most
usable tool, followed by phone and fax. At the bottom, there are shared workspaces,
shared editors and workflow systems. Even video based conferencing is down.
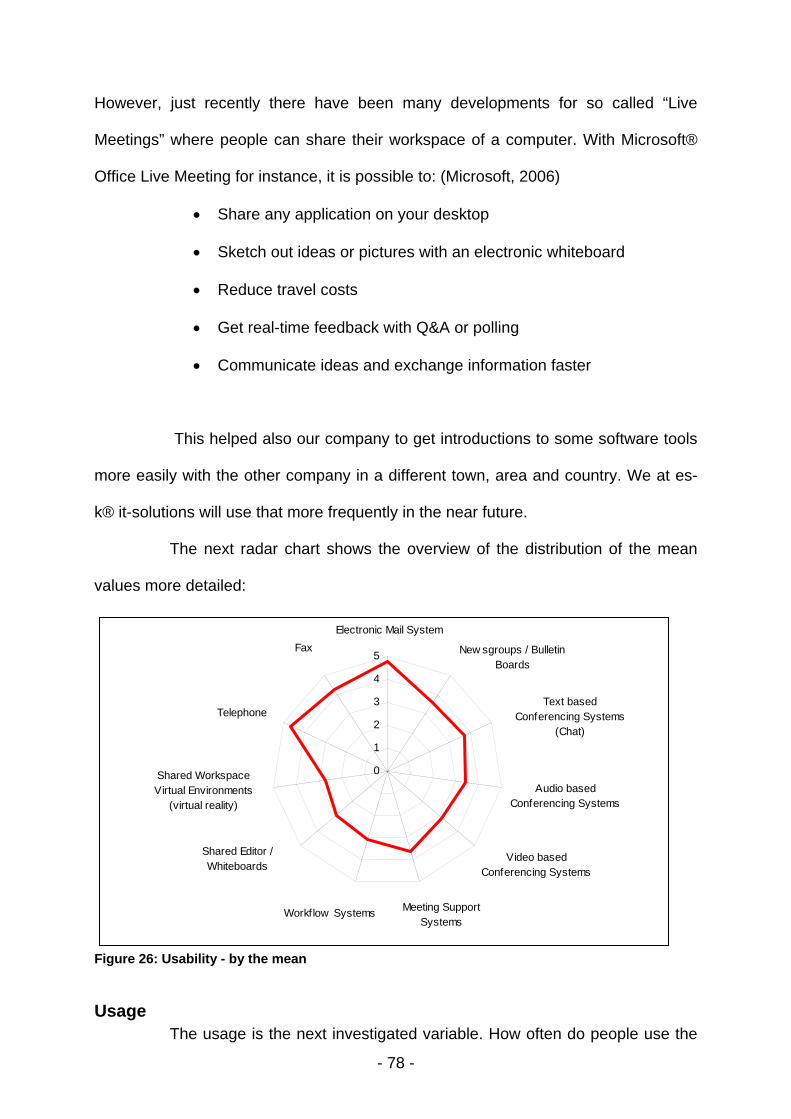
- 78 -
However, just recently there have been many developments for so called “Live
Meetings” where people can share their workspace of a computer. With Microsoft®
Office Live Meeting for instance, it is possible to: (Microsoft, 2006)
• Share any application on your desktop
• Sketch out ideas or pictures with an electronic whiteboard
• Reduce travel costs
• Get real-time feedback with Q&A or polling
• Communicate ideas and exchange information faster
This helped also our company to get introductions to some software tools
more easily with the other company in a different town, area and country. We at es-
k® it-solutions will use that more frequently in the near future.
The next radar chart shows the overview of the distribution of the mean
values more detailed:
Video based Conferencing Systems
Audio based Conferencing Systems
Text based Conferencing Systems
(Chat)
New sgroups / Bulletin Boards
Workflow Systems
FaxElectronic Mail System
Meeting Support Systems
Shared Editor / Whiteboards
Shared Workspace Virtual Environments
(virtual reality)
Telephone
0
1
2
3
4
5
Figure 26: Usability - by the mean
Usage The usage is the next investigated variable. How often do people use the

- 79 -
different communication channels? As we have seen in the correlation analysis, there
is a moderate correlation between usability and usage, so it seems the better the
usability; the more people use that communication media. However, it must be noted
that there is only a moderate, not a strong, relationship!
The following table shows the usage details at a glance, the usage ranks
from 1=never to 5=always:
No Communication Channel Min Max Range Mean StdDev1 Electronic Mail System 3 5 2 4,98 0,222 Newsgroups / Bulletin Boards 1 5 4 2,77 1,323 Text based Conferencing Systems (Chat) 1 5 4 2,88 1,534 Audio based Conferencing Systems 1 5 4 3,02 1,515 Video based Conferencing Systems 1 5 4 2,16 1,336 Meeting Support Systems (e.g. Yahoo Messenger, Net meeting, ..) 1 5 4 2,81 1,507 Workflow Systems (IBM MQ-Series, Lotus Notes, ..) 1 5 4 2,28 1,468 Shared Editor / Whiteboards 1 5 4 1,78 1,009 Shared Workspace Virtual Environments (virtual reality) 1 5 4 1,88 1,23
10 Telephone 3 5 2 4,92 0,3211 Fax 1 5 4 3,51 1,43
Figure 27: Usage details
From this table we can see that for all communication channels the range
is four, expect email and telephone, there the range is only two. This means that
there are no people who never use these two channels, for the other channels
however there are respondents who never use this channel.
Analysis by the mean The following table shows the usage results of the survey ordered by the
mean:
No Communication Channel Min Max Range Mean1 Electronic Mail System 3 5 2 4,982 Telephone 3 5 2 4,923 Fax 1 5 4 3,514 Audio based Conferencing Systems 1 5 4 3,025 Text based Conferencing Systems (Chat) 1 5 4 2,886 Meeting Support Systems (e.g. Yahoo Messenger, Net meeting, ..) 1 5 4 2,817 Newsgroups / Bulletin Boards 1 5 4 2,778 Workflow Systems (IBM MQ-Series, Lotus Notes, ..) 1 5 4 2,289 Video based Conferencing Systems 1 5 4 2,16
10 Shared Workspace Virtual Environments (virtual reality) 1 5 4 1,8811 Shared Editor / Whiteboards 1 5 4 1,78
Table 9: Usability ordered by the mean
From this table we can see that email is used most frequently, then comes

- 80 -
telephone and with some gap fax. Audio based conferencing and chat systems are
not used that much. Shared editors are used the least frequently. In our company this
is different. Chat is also used very often when talking to offshore partners. However,
this might change in the near future, since tools such as Skype® are now used more
often to communicate with these partners, since chat is less efficient than voice.
The next radar chart shows the overview of the distribution of the mean
values more detailed:
Video based Conferencing Systems
Audio based Conferencing Systems
Text based Conferencing Systems
(Chat)
New sgroups / Bulletin Boards
Workflow Systems
Fax
Electronic Mail System
Meeting Support Systems
Shared Editor / Whiteboards
Shared Workspace Virtual Environments
(virtual reality)
Telephone
0
1
2
3
4
5
Figure 28: Usage - by the mean
Security Especially security is a big issue, as one can see from daily warnings
about new computer viruses, however, according to an IDC white paper; many
companies still lack proper security standards (Carey et al., 2002):
“Very few public or private enterprises have the proper security standards
or external benchmarks to evaluate their current security strategy. The benchmarks
currently employed tend to be more internally derived than based on industry or
government standards, such as ISO 17799.”
“ISO 17799 is a comprehensive set of controls compromising best

- 81 -
practices in information security. It compromises two parts, a code of practice (ISO
17799) and a specification for an information management system (BS7799-2). It is
basically and internationally recognised generic information security standard.” (ISO
17799, p.2)
The following table shows the analysis for security at a glance:
No Communication Channel Min Max Range Mean StdDev1 Electronic Mail System 1 5 4 2,83 1,302 Newsgroups / Bulletin Boards 1 5 4 2,18 1,123 Text based Conferencing Systems (Chat) 1 4 3 2,28 0,974 Audio based Conferencing Systems 1 5 4 2,98 1,105 Video based Conferencing Systems 1 5 4 3,08 1,156 Meeting Support Systems (e.g. Yahoo Messenger, Net meeting, ..) 1 5 4 2,54 1,037 Workflow Systems (IBM MQ-Series, Lotus Notes, ..) 1 5 4 3,37 1,178 Shared Editor / Whiteboards 1 5 4 2,73 1,059 Shared Workspace Virtual Environments (virtual reality) 1 5 4 2,88 1,03
10 Telephone 1 5 4 3,33 1,2911 Fax 1 5 4 3,08 1,37
Table 10: Security details
From that table we can see that the range is 4 for all communication
channels, except for chat. No one of the respondents has considered chat to be
highly secure.
Analysis by the mean The following table shows the security results of the survey ordered by the
mean:
No Communication Channel Min Max Range Mean1 Workflow Systems (IBM MQ-Series, Lotus Notes, ..) 1 5 4 3,372 Telephone 1 5 4 3,333 Video based Conferencing Systems 1 5 4 3,084 Fax 1 5 4 3,085 Audio based Conferencing Systems 1 5 4 2,986 Shared Workspace Virtual Environments (virtual reality) 1 5 4 2,887 Electronic Mail System 1 5 4 2,838 Shared Editor / Whiteboards 1 5 4 2,739 Meeting Support Systems (e.g. Yahoo Messenger, Net meeting, ..) 1 5 4 2,54
10 Text based Conferencing Systems (Chat) 1 4 3 2,2811 Newsgroups / Bulletin Boards 1 5 4 2,18
Table 11: Security ordered by the mean
From this table we can see, that all communication channels are
considered insecure or moderate secure by the average of the respondents.
Workflow systems and telephone as well as video based conferencing are seen as

- 82 -
the most secure communication channels. Meeting support systems, chat and
newsgroups are seen as the weakest ones. One very important point is, that email is
not considered as secure, which is right. Recently, we had observed such an issue in
a project where someone was asked to send out some data using electronic mail.
This person refused to send the information since he did not consider this channel as
secure. The other person involved in that project said, “Well, we only send the email
to person XYZ …” However, what he not knew is that also other people can possibly
read the contents of the mail. To the question: “What research is available that shows
the prevalence of email messages being intercepted by a third party?” Bruce
Schneier (2000) answered:
“Like everything else in computer crime, there's no real research to
support any statistics about prevalence of attacks. Although interception of email is
possible—and government programs like Carnivore make it easier—email is at much
greater a risk at the endpoints. Just yesterday the press reported that the FBI
installed a keyboard sniffer on someone's computer and intercepted the plaintext of
his PGP-encrypted email.”
The next radar chart shows the overview of the distribution of the mean
values more detailed:
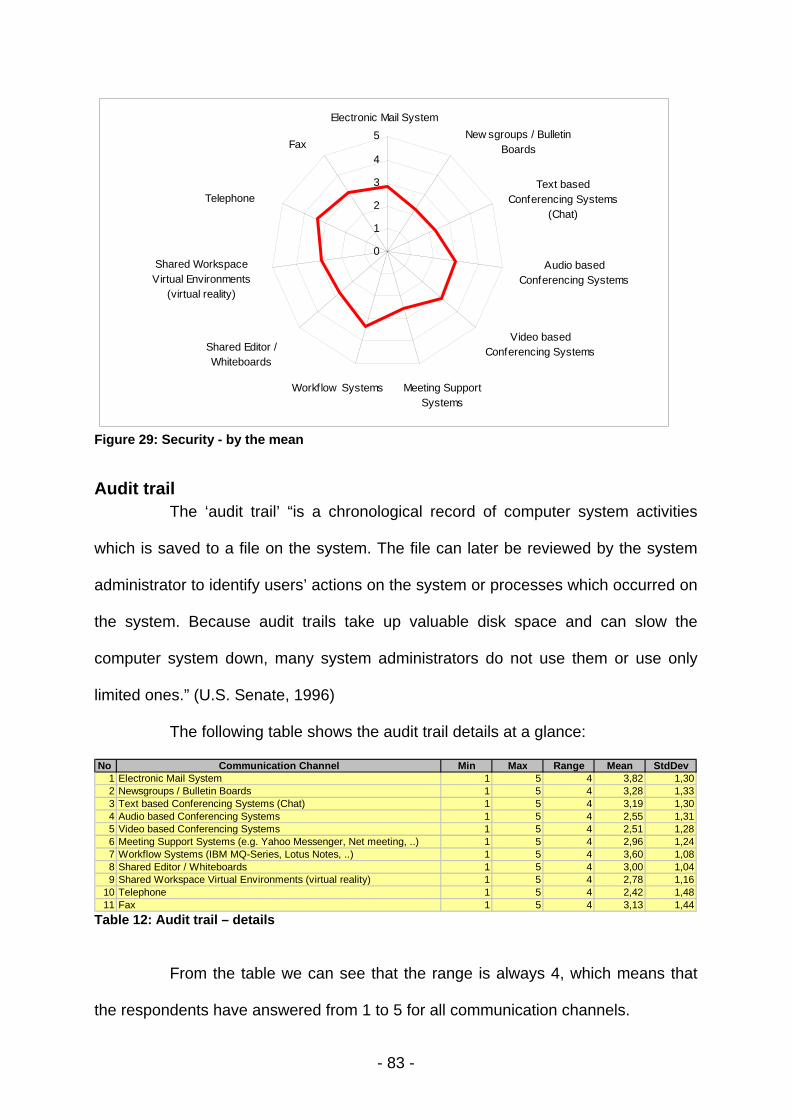
- 83 -
Video based Conferencing Systems
Audio based Conferencing Systems
Text based Conferencing Systems
(Chat)
New sgroups / Bulletin Boards
Workflow Systems
Fax
Electronic Mail System
Meeting Support Systems
Shared Editor / Whiteboards
Shared Workspace Virtual Environments
(virtual reality)
Telephone
0
1
2
3
4
5
Figure 29: Security - by the mean
Audit trail The ‘audit trail’ “is a chronological record of computer system activities
which is saved to a file on the system. The file can later be reviewed by the system
administrator to identify users’ actions on the system or processes which occurred on
the system. Because audit trails take up valuable disk space and can slow the
computer system down, many system administrators do not use them or use only
limited ones.” (U.S. Senate, 1996)
The following table shows the audit trail details at a glance:
No Communication Channel Min Max Range Mean StdDev1 Electronic Mail System 1 5 4 3,82 1,302 Newsgroups / Bulletin Boards 1 5 4 3,28 1,333 Text based Conferencing Systems (Chat) 1 5 4 3,19 1,304 Audio based Conferencing Systems 1 5 4 2,55 1,315 Video based Conferencing Systems 1 5 4 2,51 1,286 Meeting Support Systems (e.g. Yahoo Messenger, Net meeting, ..) 1 5 4 2,96 1,247 Workflow Systems (IBM MQ-Series, Lotus Notes, ..) 1 5 4 3,60 1,088 Shared Editor / Whiteboards 1 5 4 3,00 1,049 Shared Workspace Virtual Environments (virtual reality) 1 5 4 2,78 1,16
10 Telephone 1 5 4 2,42 1,4811 Fax 1 5 4 3,13 1,44
Table 12: Audit trail – details
From the table we can see that the range is always 4, which means that
the respondents have answered from 1 to 5 for all communication channels.

- 84 -
Analysis by the mean An audit trail is very important for business transactions and
communication, otherwise people might contradict that they have made any
comment on a business issue. The following table shows the audit trail results of the
survey ordered by the mean:
No Communication Channel Min Max Range Mean1 Electronic Mail System 1 5 4 3,822 Workflow Systems (IBM MQ-Series, Lotus Notes, ..) 1 5 4 3,603 Newsgroups / Bulletin Boards 1 5 4 3,284 Text based Conferencing Systems (Chat) 1 5 4 3,195 Fax 1 5 4 3,136 Shared Editor / Whiteboards 1 5 4 3,007 Meeting Support Systems (e.g. Yahoo Messenger, Net meeting, ..) 1 5 4 2,968 Shared Workspace Virtual Environments (virtual reality) 1 5 4 2,789 Audio based Conferencing Systems 1 5 4 2,55
10 Video based Conferencing Systems 1 5 4 2,5111 Telephone 1 5 4 2,42
Table 13: Audit trail ordered by the mean
From this table we can see that email is considered to have the best audit
trail, followed by workflow systems and newsgroups. The phone is considered to
have the weakest audit trail, followed by video and audio based conferencing
systems. It is interesting to see that workflow systems are not at the top of this
analysis, since they provide an integrated audit trail as noted by Muehlen and
Rosemann (2000):
“Workflow management systems enable the exact and timely analysis of
automated business processes through the analysis of the logged audit trail data.”

- 85 -
The next radar chart shows the overview of the distribution of the mean
values more detailed:
Video based Conferencing Systems
Audio based Conferencing Systems
Text based Conferencing Systems
(Chat)
New sgroups / Bulletin Boards
Workflow Systems
Fax
Electronic Mail System
Meeting Support Systems
Shared Editor / Whiteboards
Shared Workspace Virtual Environments
(virtual reality)
Telephone
0
1
2
3
4
5
Figure 30: Audit Trail - by the mean
Impact of time zones Different time zones can have a significant impact on communication.
Pankaj and Jain (2004) found that “with the advent of globalization and the Internet,
the concept of global software development is gaining ground. The global
development model opens up the possibility of 24-hour software development by
effectively utilizing the time zone differences. To harness the potential of the 24-hour
software development model for reducing the overall development time, a key issue
is the allocation of project tasks to the resources in the distributed team.”
As stated before, different time zones can also open up new possibilities
of teamwork, but how much do they impact the teamwork as a whole? The following
tables show the results of the survey at a glance:
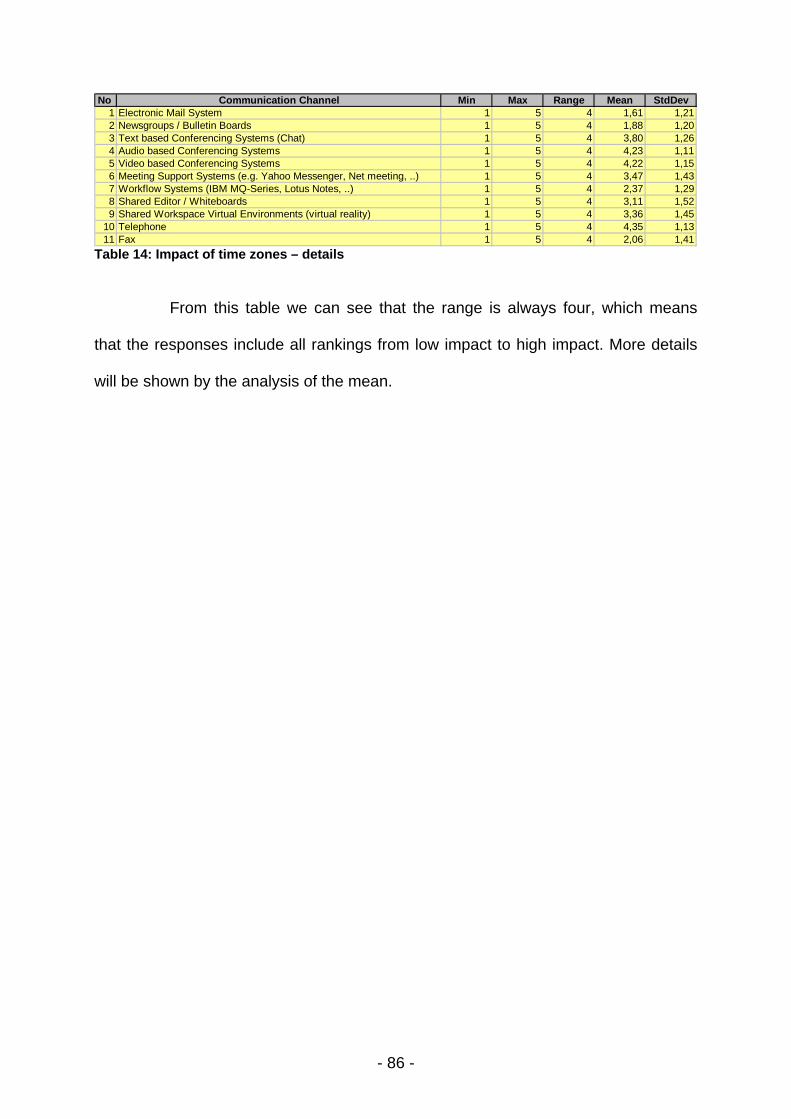
- 86 -
No Communication Channel Min Max Range Mean StdDev1 Electronic Mail System 1 5 4 1,61 1,212 Newsgroups / Bulletin Boards 1 5 4 1,88 1,203 Text based Conferencing Systems (Chat) 1 5 4 3,80 1,264 Audio based Conferencing Systems 1 5 4 4,23 1,115 Video based Conferencing Systems 1 5 4 4,22 1,156 Meeting Support Systems (e.g. Yahoo Messenger, Net meeting, ..) 1 5 4 3,47 1,437 Workflow Systems (IBM MQ-Series, Lotus Notes, ..) 1 5 4 2,37 1,298 Shared Editor / Whiteboards 1 5 4 3,11 1,529 Shared Workspace Virtual Environments (virtual reality) 1 5 4 3,36 1,45
10 Telephone 1 5 4 4,35 1,1311 Fax 1 5 4 2,06 1,41
Table 14: Impact of time zones – details
From this table we can see that the range is always four, which means
that the responses include all rankings from low impact to high impact. More details
will be shown by the analysis of the mean.

- 87 -
Analysis by the mean The following table shows the time zone results of the survey ordered by
the mean:
No Communication Channel Min Max Range Mean1 Telephone 1 5 4 4,352 Audio based Conferencing Systems 1 5 4 4,233 Video based Conferencing Systems 1 5 4 4,224 Text based Conferencing Systems (Chat) 1 5 4 3,805 Meeting Support Systems (e.g. Yahoo Messenger, Net meeting, ..) 1 5 4 3,476 Shared Workspace Virtual Environments (virtual reality) 1 5 4 3,367 Shared Editor / Whiteboards 1 5 4 3,118 Workflow Systems (IBM MQ-Series, Lotus Notes, ..) 1 5 4 2,379 Fax 1 5 4 2,06
10 Newsgroups / Bulletin Boards 1 5 4 1,8811 Electronic Mail System 1 5 4 1,61
Table 15: Impact of time zones ordered by the mean
From this table we can see that phone, video and audio based
conferencing are seen to be most affected by different time zone, and this is true.
Electronic mail, Newsgroups and fax are the least affected ones. Hence, cross time
zone communication must consider these facts to be effective. During the online
MBA study for instance, it was necessary to coordinate teams across time zones,
there it was necessary to use the right communication channels, mostly chat and
email since it was sometimes not possible for the whole team to meet at the same
time, especially when team members came from America, Europe and Asia. It must
be noted, that the richer communication channels are, the more they are affected by
time zone differences. Since in international communication, time zones are mostly
an issue, it is important to choose the right media in order to enable communication
despite timing differences.
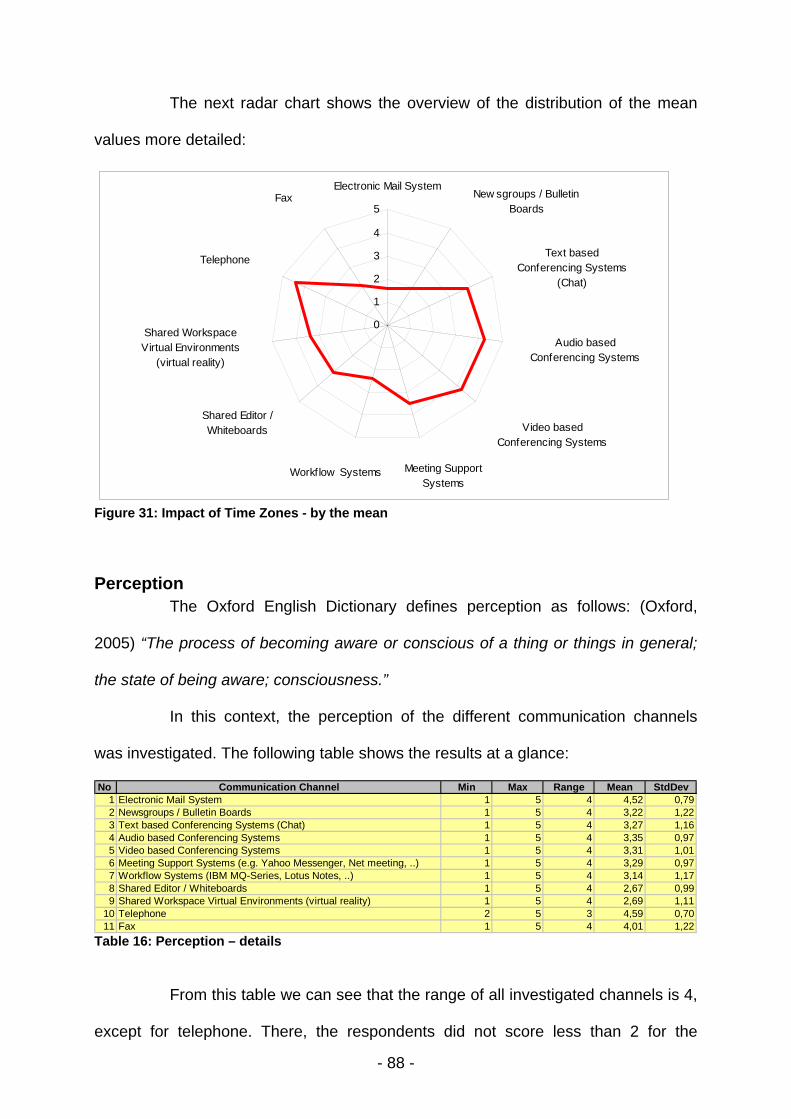
- 88 -
The next radar chart shows the overview of the distribution of the mean
values more detailed:
Video based Conferencing Systems
Audio based Conferencing Systems
Text based Conferencing Systems
(Chat)
New sgroups / Bulletin Boards
Workflow Systems
FaxElectronic Mail System
Meeting Support Systems
Shared Editor / Whiteboards
Shared Workspace Virtual Environments
(virtual reality)
Telephone
0
1
2
3
4
5
Figure 31: Impact of Time Zones - by the mean
Perception The Oxford English Dictionary defines perception as follows: (Oxford,
2005) “The process of becoming aware or conscious of a thing or things in general;
the state of being aware; consciousness.”
In this context, the perception of the different communication channels
was investigated. The following table shows the results at a glance:
No Communication Channel Min Max Range Mean StdDev1 Electronic Mail System 1 5 4 4,52 0,792 Newsgroups / Bulletin Boards 1 5 4 3,22 1,223 Text based Conferencing Systems (Chat) 1 5 4 3,27 1,164 Audio based Conferencing Systems 1 5 4 3,35 0,975 Video based Conferencing Systems 1 5 4 3,31 1,016 Meeting Support Systems (e.g. Yahoo Messenger, Net meeting, ..) 1 5 4 3,29 0,977 Workflow Systems (IBM MQ-Series, Lotus Notes, ..) 1 5 4 3,14 1,178 Shared Editor / Whiteboards 1 5 4 2,67 0,999 Shared Workspace Virtual Environments (virtual reality) 1 5 4 2,69 1,11
10 Telephone 2 5 3 4,59 0,7011 Fax 1 5 4 4,01 1,22
Table 16: Perception – details
From this table we can see that the range of all investigated channels is 4,
except for telephone. There, the respondents did not score less than 2 for the
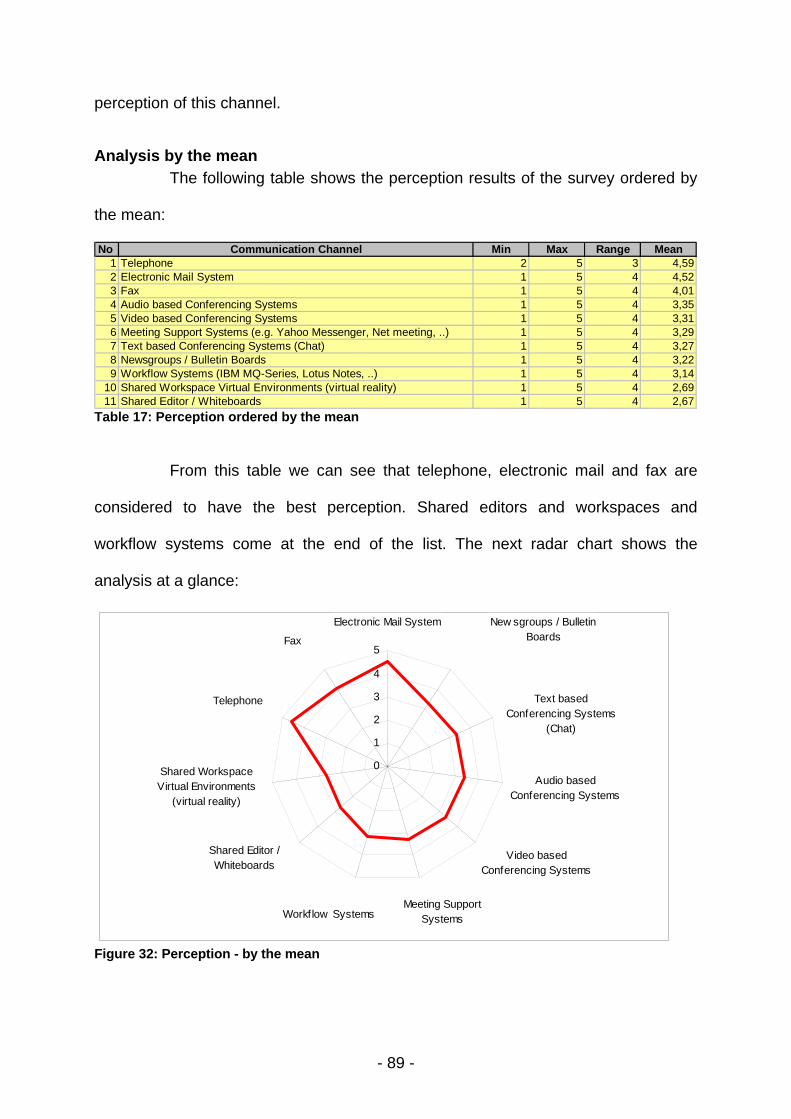
- 89 -
perception of this channel.
Analysis by the mean The following table shows the perception results of the survey ordered by
the mean:
No Communication Channel Min Max Range Mean1 Telephone 2 5 3 4,592 Electronic Mail System 1 5 4 4,523 Fax 1 5 4 4,014 Audio based Conferencing Systems 1 5 4 3,355 Video based Conferencing Systems 1 5 4 3,316 Meeting Support Systems (e.g. Yahoo Messenger, Net meeting, ..) 1 5 4 3,297 Text based Conferencing Systems (Chat) 1 5 4 3,278 Newsgroups / Bulletin Boards 1 5 4 3,229 Workflow Systems (IBM MQ-Series, Lotus Notes, ..) 1 5 4 3,14
10 Shared Workspace Virtual Environments (virtual reality) 1 5 4 2,6911 Shared Editor / Whiteboards 1 5 4 2,67
Table 17: Perception ordered by the mean
From this table we can see that telephone, electronic mail and fax are
considered to have the best perception. Shared editors and workspaces and
workflow systems come at the end of the list. The next radar chart shows the
analysis at a glance:
Video based Conferencing Systems
Audio based Conferencing Systems
Text based Conferencing Systems
(Chat)
New sgroups / Bulletin Boards
Workflow Systems
Fax
Electronic Mail System
Meeting Support Systems
Shared Editor / Whiteboards
Shared Workspace Virtual Environments
(virtual reality)
Telephone
0
1
2
3
4
5
Figure 32: Perception - by the mean
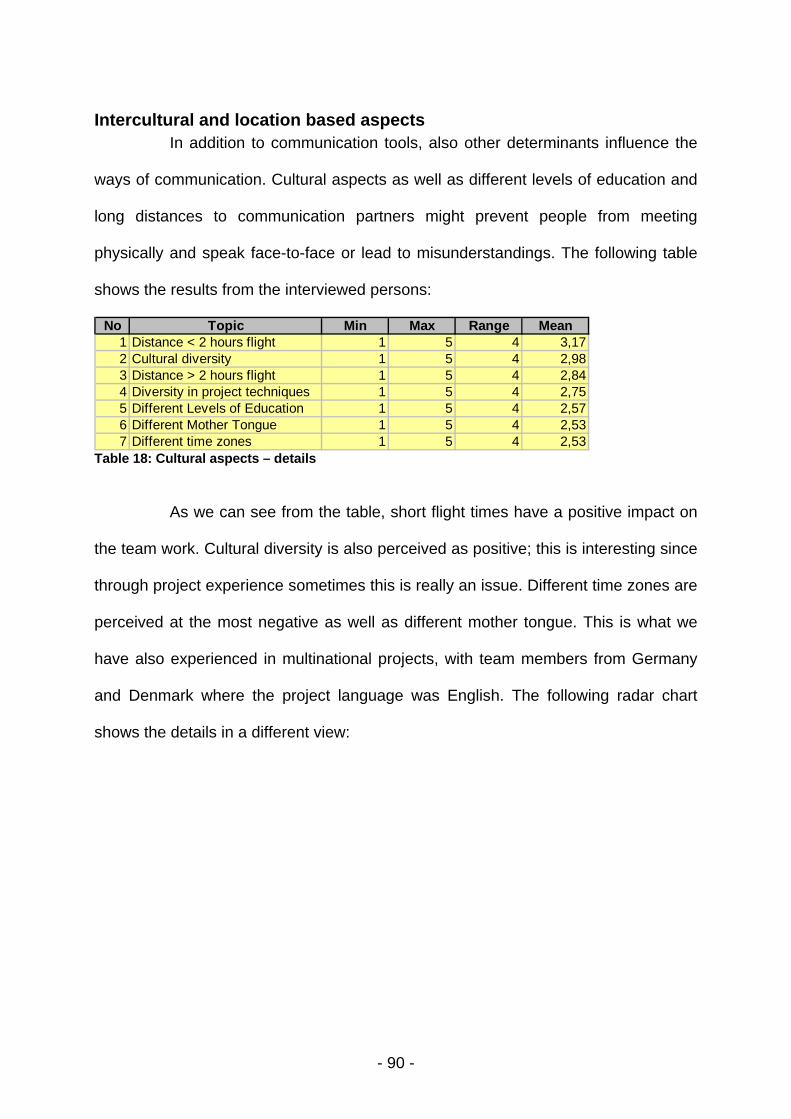
- 90 -
Intercultural and location based aspects In addition to communication tools, also other determinants influence the
ways of communication. Cultural aspects as well as different levels of education and
long distances to communication partners might prevent people from meeting
physically and speak face-to-face or lead to misunderstandings. The following table
shows the results from the interviewed persons:
No Topic Min Max Range Mean1 Distance < 2 hours flight 1 5 4 3,172 Cultural diversity 1 5 4 2,983 Distance > 2 hours flight 1 5 4 2,844 Diversity in project techniques 1 5 4 2,755 Different Levels of Education 1 5 4 2,576 Different Mother Tongue 1 5 4 2,537 Different time zones 1 5 4 2,53
Table 18: Cultural aspects – details
As we can see from the table, short flight times have a positive impact on
the team work. Cultural diversity is also perceived as positive; this is interesting since
through project experience sometimes this is really an issue. Different time zones are
perceived at the most negative as well as different mother tongue. This is what we
have also experienced in multinational projects, with team members from Germany
and Denmark where the project language was English. The following radar chart
shows the details in a different view:
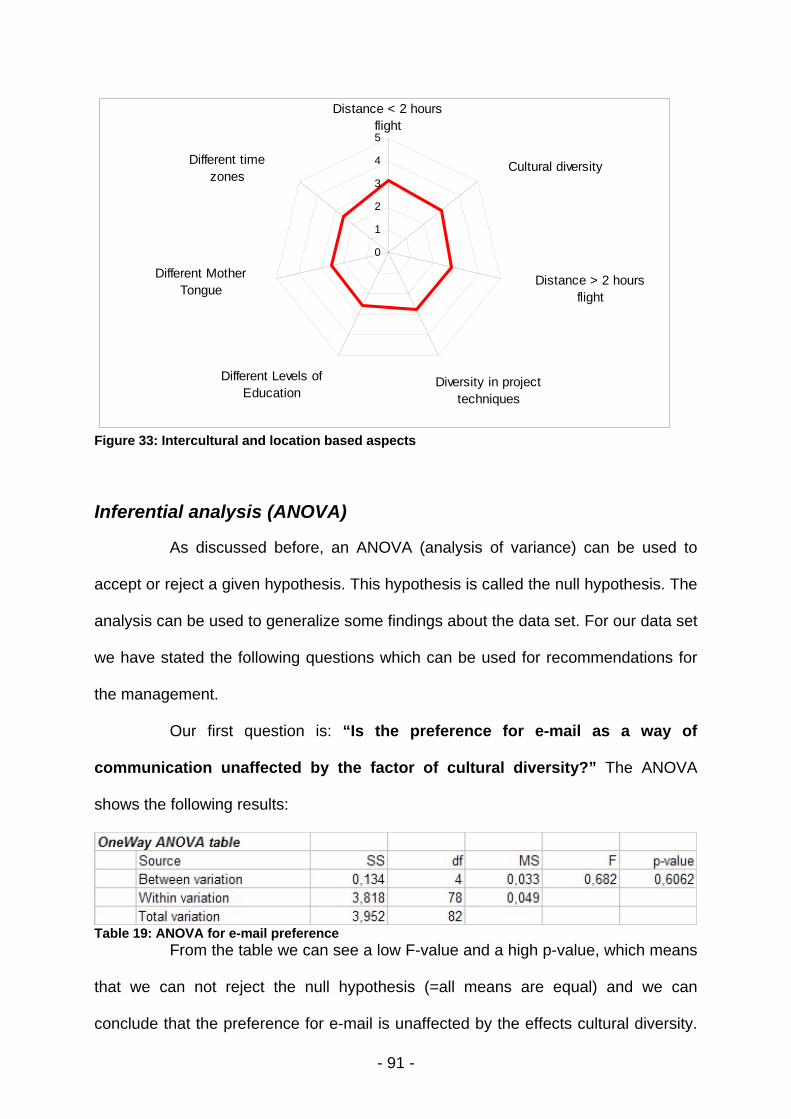
- 91 -
Distance < 2 hours flight
Cultural diversity
Distance > 2 hours flight
Diversity in project techniques
Different Levels of Education
Different Mother Tongue
Different time zones
0
1
2
3
4
5
Figure 33: Intercultural and location based aspects
Inferential analysis (ANOVA)
As discussed before, an ANOVA (analysis of variance) can be used to
accept or reject a given hypothesis. This hypothesis is called the null hypothesis. The
analysis can be used to generalize some findings about the data set. For our data set
we have stated the following questions which can be used for recommendations for
the management.
Our first question is: “Is the preference for e-mail as a way of
communication unaffected by the factor of cultural diversity?” The ANOVA
shows the following results:
Table 19: ANOVA for e-mail preference
From the table we can see a low F-value and a high p-value, which means
that we can not reject the null hypothesis (=all means are equal) and we can
conclude that the preference for e-mail is unaffected by the effects cultural diversity.

- 92 -
This is also confirmed by the following analysis of the difference in sample means:
Table 20: Confidence intervals for the mean difference - e-mail preference
Our second question is about security: “Do the respondents perceive all
communication channels as equally secure?” The results of the ANOVA are
shown below:
Table 21: ANOVA for perception of security of the communication channels
In this case we can see a higher F-value and on very low p-value, which is
significantly below the 0.05 significance level of our analysis. Thus, we can reject the
null hypothesis and can conclude that the respondents do not perceive all channels
as equally secure. This can also be seen in the following table which shows the
investigated samples at a glance:
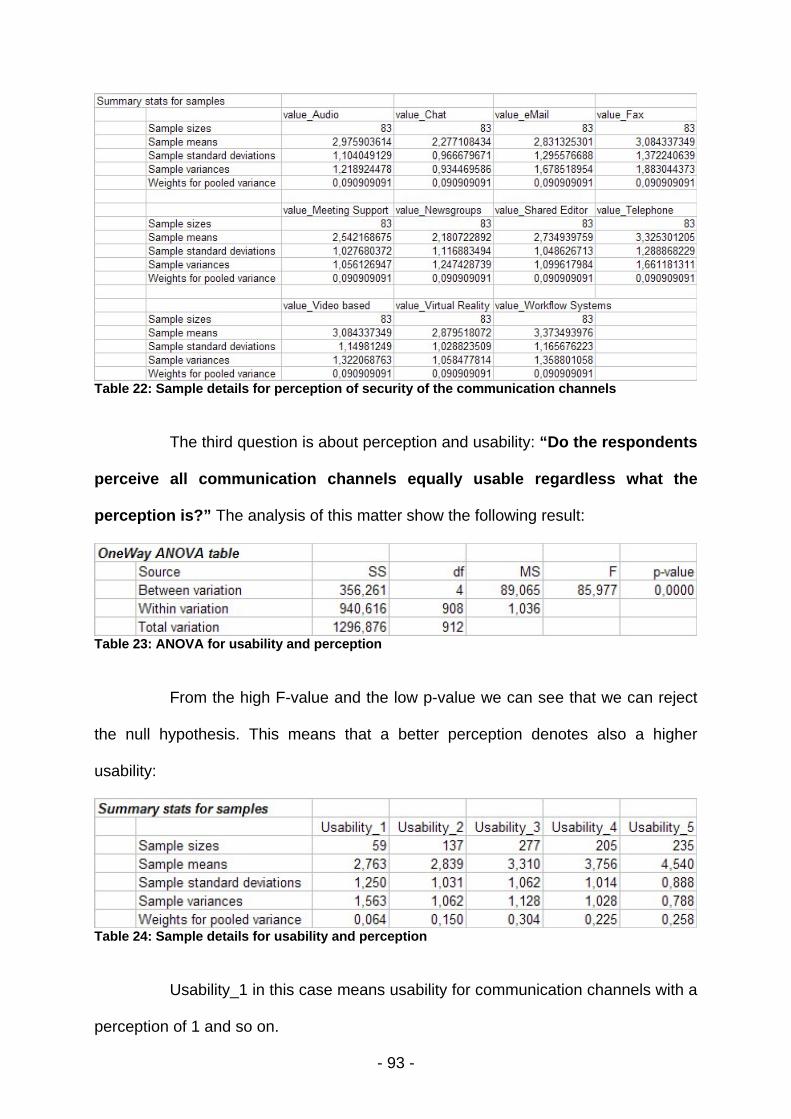
- 93 -
Table 22: Sample details for perception of security of the communication channels
The third question is about perception and usability: “Do the respondents
perceive all communication channels equally usable regardless what the
perception is?” The analysis of this matter show the following result:
Table 23: ANOVA for usability and perception
From the high F-value and the low p-value we can see that we can reject
the null hypothesis. This means that a better perception denotes also a higher
usability:
Table 24: Sample details for usability and perception
Usability_1 in this case means usability for communication channels with a
perception of 1 and so on.
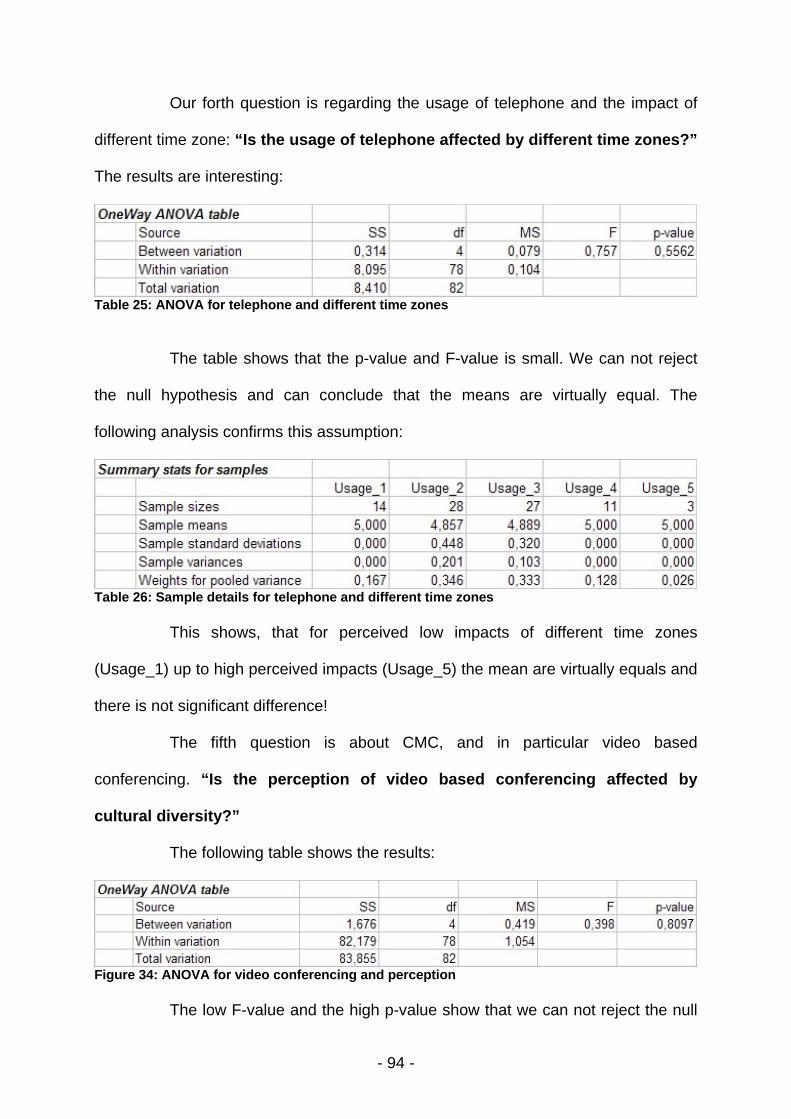
- 94 -
Our forth question is regarding the usage of telephone and the impact of
different time zone: “Is the usage of telephone affected by different time zones?”
The results are interesting:
Table 25: ANOVA for telephone and different time zones
The table shows that the p-value and F-value is small. We can not reject
the null hypothesis and can conclude that the means are virtually equal. The
following analysis confirms this assumption:
Table 26: Sample details for telephone and different time zones
This shows, that for perceived low impacts of different time zones
(Usage_1) up to high perceived impacts (Usage_5) the mean are virtually equals and
there is not significant difference!
The fifth question is about CMC, and in particular video based
conferencing. “Is the perception of video based conferencing affected by
cultural diversity?”
The following table shows the results:
Figure 34: ANOVA for video conferencing and perception
The low F-value and the high p-value show that we can not reject the null

- 95 -
hypothesis. We can conclude, that the perception of video based conferencing is
similar, regardless what the perception of cultural diversity is. This means that video
based conferencing is a good tool for communication which can also handle non-
verbal aspect of the communication.
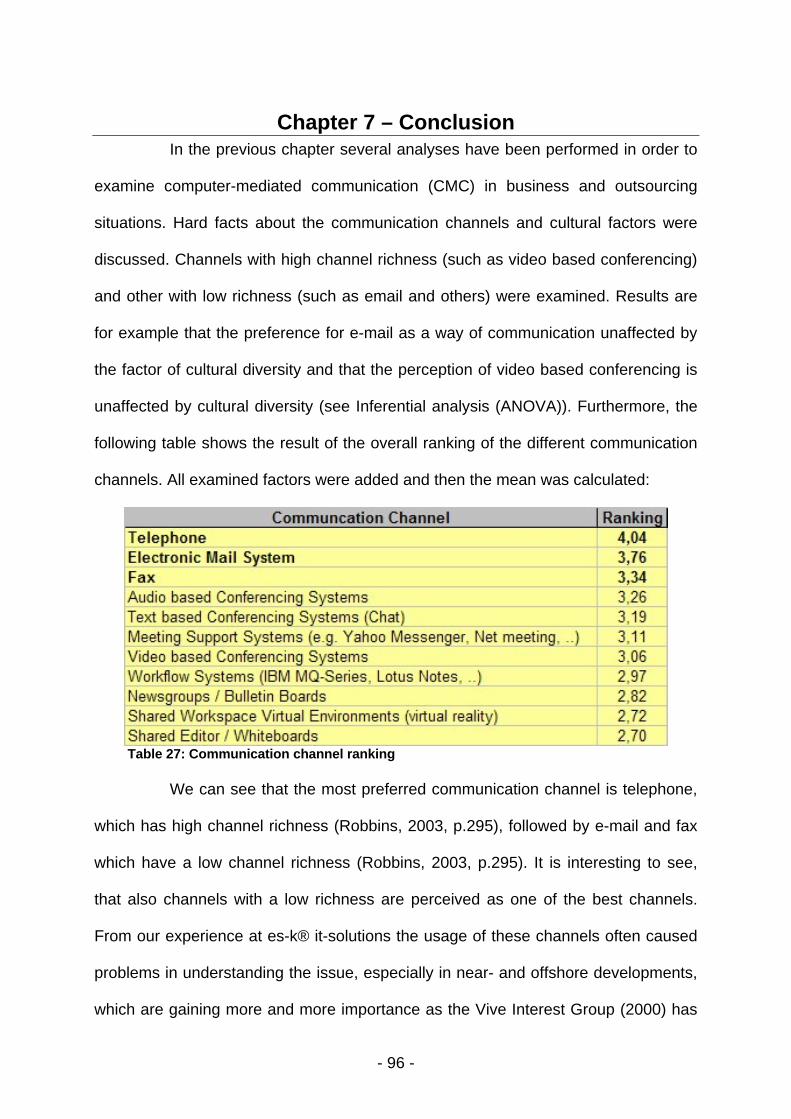
- 96 -
Chapter 7 – Conclusion In the previous chapter several analyses have been performed in order to
examine computer-mediated communication (CMC) in business and outsourcing
situations. Hard facts about the communication channels and cultural factors were
discussed. Channels with high channel richness (such as video based conferencing)
and other with low richness (such as email and others) were examined. Results are
for example that the preference for e-mail as a way of communication unaffected by
the factor of cultural diversity and that the perception of video based conferencing is
unaffected by cultural diversity (see Inferential analysis (ANOVA)). Furthermore, the
following table shows the result of the overall ranking of the different communication
channels. All examined factors were added and then the mean was calculated:
Table 27: Communication channel ranking
We can see that the most preferred communication channel is telephone,
which has high channel richness (Robbins, 2003, p.295), followed by e-mail and fax
which have a low channel richness (Robbins, 2003, p.295). It is interesting to see,
that also channels with a low richness are perceived as one of the best channels.
From our experience at es-k® it-solutions the usage of these channels often caused
problems in understanding the issue, especially in near- and offshore developments,
which are gaining more and more importance as the Vive Interest Group (2000) has
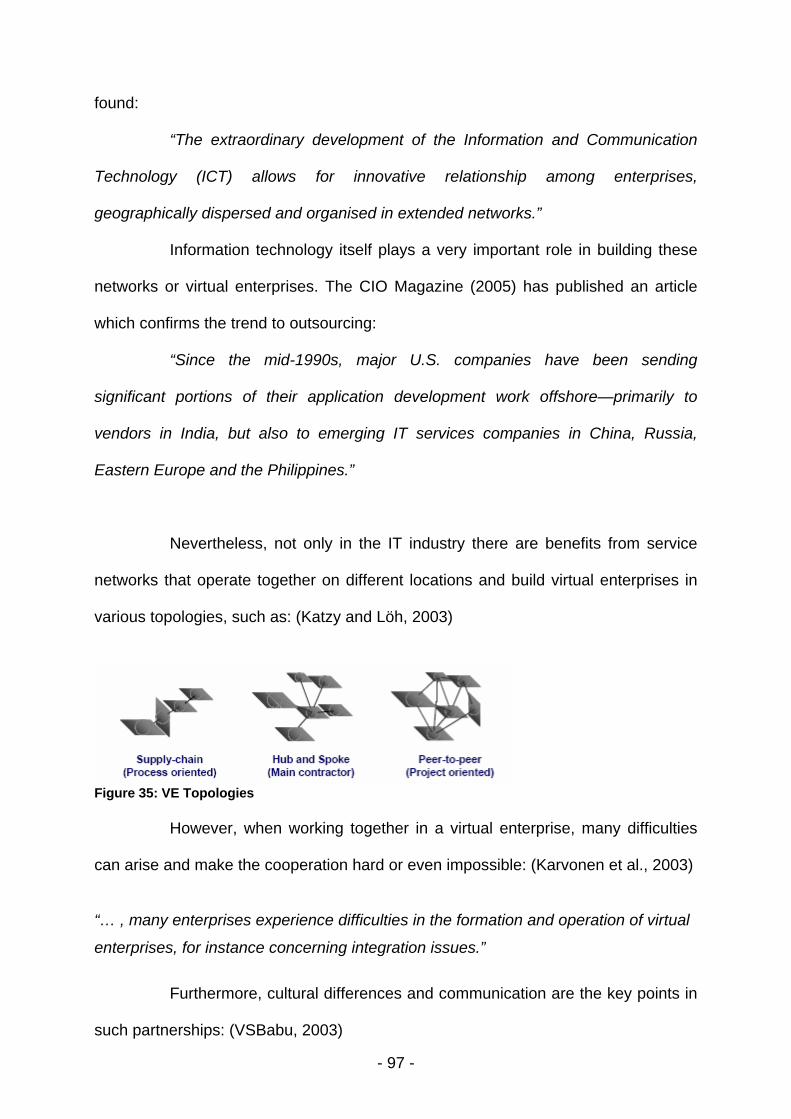
- 97 -
found:
“The extraordinary development of the Information and Communication
Technology (ICT) allows for innovative relationship among enterprises,
geographically dispersed and organised in extended networks.”
Information technology itself plays a very important role in building these
networks or virtual enterprises. The CIO Magazine (2005) has published an article
which confirms the trend to outsourcing:
“Since the mid-1990s, major U.S. companies have been sending
significant portions of their application development work offshore—primarily to
vendors in India, but also to emerging IT services companies in China, Russia,
Eastern Europe and the Philippines.”
Nevertheless, not only in the IT industry there are benefits from service
networks that operate together on different locations and build virtual enterprises in
various topologies, such as: (Katzy and Löh, 2003)
Figure 35: VE Topologies
However, when working together in a virtual enterprise, many difficulties
can arise and make the cooperation hard or even impossible: (Karvonen et al., 2003)
“… , many enterprises experience difficulties in the formation and operation of virtual
enterprises, for instance concerning integration issues.”
Furthermore, cultural differences and communication are the key points in
such partnerships: (VSBabu, 2003)
- 98 -
“Cultural differences can play a huge part in ineffective communications.
Accent, assumptions and unfamiliar idioms can cause issues. Usually, this results in
a situation where everything is written down and goes through several reviews.”
With regards to communication and the channel richness it is important to
mention that non-verbal communication, which include stance, gestures, eye
movement, hand and/or arm placement, facial expression, etc., play an important
role. (Bergeson, 2006) Communication experts estimate, in fact, that only 10 percent
of our communication is represented in the words we say. Another 30 percent is
represented by our sounds and 60 percent by our body language. (Covey, 2004,
p.240-241) This show how important the usage of rich channels is, and what
mistakes are often made during and outsourcing agreement, just to reduce travel
costs or any other cost saving measure.
Then, there is a general problem with listening, since “Most people are
afraid to listen because what they hear might make them change.” (Rogers et al.,
2000, p.107) Communication issues can slow things to a halt. "We had to do a lot
more face-to-face interaction than originally anticipated because offshore workers
just didn't interpret things the same way," says DHL's Kifer. (Overby, 2003, p.5) This
can be also stressed by the hypothesis that CMC (Computer-mediated
communication) groups at times perform worse on intellective tasks than FTF (face-
to-face) groups (Roch and Ayman, 2005). Baltes et al. (2002 cited in Roch and
Ayman, 2005) based their hypothesis that CMC groups would perform worse than
FTF groups on Straus and McGrath’s (1994 cited in Roch and Ayman, 2005)
assertion that communication will most likely affect outcomes when tasks require
coordination, persuasion, consensus, and both the perception and expression of
emotion. Baltes et al. (2002 cited in Roch and Ayman, 2005) argued that intellective
- 99 -
and decision-making tasks have these properties, and these properties seem to be
dependent on social cues. Therefore, because CMC lacks social cues, CMC groups
will perform worse.
In conclusion: “Moving jobs overseas can be a much more expensive
proposition than you may think.” (Overby, 2003, p.1) “It's a false savings to keep
costs down by communicating only by phone." (Overby, 2003, p.3) Hence, it is
important to use the right channels at the right time of an outsourcing agreement, and
fact-to-face conversation is a very important aspect which should not be ignored in
building trust between both sides. In future studies it might be interesting to
investigate all phases of outsourcing (initiation to closure) and to investigate the
usage of the different communication channels and to make suggestions about an
ideal process, which is supported by the right communication channels at the right
time!

- 100 -
References
Albright, S. et al. (2003). Data Analysis & Decision Making with Microsoft® Excel.
Thomson Brooks/Cole.
Baltes, B. B. et al. (2002). Computermediated communication and group decision
making: A meta-analysis. Organizational Behavior and Human Decision
Processes, 87, 156–179.
Bem, Daryl J. (1970) Beliefs, Attitudes, and Human Affairs. Belmont, CA:
Brooks/Cole Publishing Company.
Bergeson, T. (2006). Communication Glossary. [Internet] Washington. Available
from: http://www.k12.wa.us/curriculumInstruct/communications/
frameworks/glossary.aspx (Accessed: 11 January 2006).
Blum, R. et al. (1991). Onward to Excellence impact study. Portland, OR: Northwest
Regional Educational Laboratory.
Business Week (2004) Look Who's Going Offshore. [Internet] Available from:
http://www.businessweek.com/magazine/content/04_20/b3883090_mz063
.htm (Accessed: 21 May 2005).
Capon, C. (2000). Understanding Organisation Context. Prentice Hall 2000.

- 101 -
Carey, A. et al. (2002). Challenges and Requirements of Enterprise Security. IDC
White Paper.
CIO Magazine (2005) Offshore Outsourcing: Navigating the Opportunities and Risks.
[Internet] Available from: http://www.theciostore.com/
guide_product.asp?id=236 (Accessed: 4 May 2005).
Covey, S. (2004) The 7 habits of highly effective people. Free Press, Published by
Simon & Schuster New York.
Craumer, M. (2002) How to think strategically about outsourcing. Harvard
Management Update.
Diaz-Guerrero, R. (1976) Psychology of the Mexican: Culture and Personality.
Austin: University of Texas Press.
Dix, Alan et al. (1998) Human Computer Interaction. Prentice Hall Europe 1998.
Economist A-Z (2004). Research Tools. [Internet] Available from:
http://www.economist.com/research/Economics/
searchactionterms.cfm (Accessed: 10 June 2005).
Equant (2004). IT outsourcing survey reveals strong trend for communications
infrastructure outsourcing. [Internet] Available from:
http://www.equant.com/content/xml/pr_IDC_outsourcing_24_11_04.xml
(Accessed: 7 February 2006).

- 102 -
Frauenheim, E. (2005) Study: Outsourcing mostly domestic. [Internet] Published:
November 5, 2004. Available from: http://news.com.com/Study:
Outsourcing mostly domestic/2110-1022_3-
5440319.html?tag=fd_nbs_ent&tag=nl.e433 (Accessed: 6 December
2005).
Geldard, Frank A. (1953) The Human Senses. New York: John Wiley and Sons.
Goe, W. Richard (2005) Quantitative methods for testing hypotheses. [Internet]
Kansas State University Manhattan. Available from http://www-
personal.ksu.edu/~goe/lec071sl/sld060.htm (Accessed: 28 December
2005).
Gregory, R. L. (1970) The Intelligent Eye. New York: McGraw-Hill.
Griffiths, D. (2002) The theory and practice of outsourcing. Kudos Information Ltd.
Hughes, M. (2006) Computing Pearson’s correlation coefficient (r). [Internet]
Available from: http://www.towson.edu/~mhughes/
Computing%20Pearson.htm (Accessed: 9 January 2006).
IBM Intl. (2005) Chart of IBM. [Internet] Available from http://www.cortalconsors.de
(Accessed: 4 May 2005).
- 103 -
Karvonen, I. et al. (2003) VERAM: Virtual Enterprise Reference Architecture and
Methodology. [Internet] Helsinki. GLOBEMEN final plenary, December
2002. Available from http://www.ipl.dtu.dk/publikation/7099/dk (Accessed:
4 May 2005).
ISO 17799 (2006). The ISO 17799 Security Standard - A Presentation. [Internet]
Available from http://www.computersecuritynow.com/presentation/
sld002.htm (Accessed: 21 January 2006).
Joel, M. (2004) Confirmatory vs Exploratory Data Analysis. [Internet] Santa Barbara.
Available from: http://www.geog.ucsb.edu/~joel/g210_w04/
lecture_notes/lect01/oh04_01_2.html (Accessed: 29 April 2005).
Katzy, B. and Löh, H. (2003) Virtual Enterprise Research State of the Art and Ways
Forward. [Internet] Munich, Germany. Available from
http://portal.cetim.org/file/1/63/104_Katzy_Loehprint.pdf (Accessed: 29
April 2005).
Kirkpatrick, T. et al. (2002). Outsourcing 2002: How CIOs Reach Outsourcing Deals.
[Internet] Available from: http://www.cioinsight.com/print_article2/
0,1217,a=27000,00.asp (Accessed: 7 February 2006).
Kluckenhohn, Florence R. and Strodtbeck, Fred L. (1961) Variations in Value
Orientation. New York: Row, Peterson.

- 104 -
Kroener, O. (2003) es-k® it-solutions: the Company. [Internet] Stuttgart, Germany.
Available from http://www.es-k.com/down/es-k_the-company.pdf
(Accessed: 29 April 2005)
Malhotra, A. et al (2005). Virtual Workspace Technologies. MIT Sloan Management
Review. Cambridge: Winter 2005. Vol. 46, Iss. 2; p.11.
Malhotra, Y. (2000) Knowledge Management and Virtual Organizations. Chapter II.
Idea Group Publishing. Hershey (USA).
MBA Events (2005) MBA Event Platform. [Internet] Germany. Available from
http://www.mba-events.com (Accessed: 28 December 2005).
McCarthy, Brian C. (2004). Quantitative business analysis. [Internet] Ohio University.
Available from http://www.plantbio.ohiou.edu/epb/instruct/quantmet/
lectures/lec7/ (Accessed: 29 April 2005).
McDougall, P. (2004) Optimizing Through Outsourcing. [Internet] Available from:
http://www.informationweek.com/shared/printableArticleSrc.jhtml?articleID
=18200825 (Accessed: 7 December 2005).
Microsoft (2006). Microsoft Office Live Meeting. [Internet] Available from:
http://www.microsoft.com/office/rtc/livemeeting/default.mspx (Accessed:
14 February 2006).
- 105 -
McNeill, William H. (1982) The Pursuit of Power. Chicago: University of Chicago
Press.
Michelman, Paul (2005) An Outsourcing Checklist. Hardvard Business School
Publishing Cooperation.
Muehlen, M. and Rosemann M. (2000). Workflow-based process monitoring and
controlling-technical and organizational issues. Published in System
Sciences, 2000. Proceedings of the 33rd Annual Hawaii International
Conference.
Overby, S. (2003). The Hidden Costs of Offshore Outsourcing. [Internet] Available
from: http://www.cio.com/archive/090103/money.html?printversion=yes
(Accessed: 2 January 2006).
Oxford (2005). Oxford English Dictionary. Oxford University Press 2005
Pankaj, J. and Jain G. (2004). Assigning Tasks in a 24-Hour Software
DevelopmentModel. Indian Institute of Technology, Kanpur, India. 11th
Asia-Pacific Software Engineering Conference (APSEC'04) pp.309-315.
Platt, John R. (1968) The Two Faces of Perception. In Changing Perspectives on
Man, edited by Ben Rathblatt. Chicago: University of Chicago Press.
Robbins, S. (2003) Organizational Behavior. Prentice Hall
- 106 -
Roch, S. and Ayman, R. (2005) Group Decision Making and Perceived Decision
Success: The Role of Communication Medium. Group Dynamics: Theory,
Research, and Practice 2005, Vol. 9, No. 1, pp.15–31.
Roethlisberger, F. J. (2000) Barriers and Gateways to Communication. Harvard
Business Review November-December 1991, pp.108-111.
Rogers, Carl R. (2000) Barriers and Gateways to Communication. Harvard Business
Review November-December 1991, pp.105-107.
Schneier, B. (2000). What research is available that shows the prevalence of email
messages being intercepted by a third party? [Internet] Available from:
http://www2.cio.com/ask/author/2000/questions/question95.html
(Accessed: 11 January 2006)
Scholz, C. (1997) Das Virtuelle Unternehmen - Schlagwort oder echte Vision.
Manager Bilanz. WM Wirtschaftsmedien AG. Zurich (CH). Release
111997. pp.12-19.
Schwarz, C. (2004) Population parameter versus sample statistic. [Internet] Available
from http://www.math.sfu.ca/~cschwarz/Stat-301/Handouts/node29.html
(Accessed: 29 April 2005).
Steward, E. C. and Bennet, M. J. (1991) American Cultural Patterns: A Cross-
Cultural Perspective. Intercultural Press, Inc.
- 107 -
Straus, S. G. and McGrath, J. E. (1994). Does medium matter? The interaction of
task type and technology on group performance and member reactions.
Journal of Applied Psychology, 79, 87–97.
Tönnies, Ferdinand (1957) Community and Society. East Lansing: Michigan State
University Press. Originally published in German in 1887.
U.S. Senate (1996). Security in Cyberspace. Hearings on June 5th, 1996. [Internet]
Available from: http://www.fas.org/irp/congress/1996_hr/s960605a.htm
(Accessed: 11 January 2006)
Useem, J. and R. & Donoghue, J. (1963). Men in the Middle of the Third Culture: The
Roles of American and Non-Western People in Cross Cultural
Administration. Human Organization 3, Vol. 2, pp.169-179.
VIVE Interest Group (2000) Virtual Enterprise: The new paradigm enabling SME's
competitiveness in the digital Economy. [Internet] Available from:
http://www.ceconsulting.it/ve/3rdwshop2000.html (Accessed: 4 May 2005).
VSBabu (2003) Offshore outsourcing or domestic process fixes. [Internet] Available
from http://vsbabu.org/mt/archives/2003/11/03/offshore_outsourcing_
or_domestic_process_fixes.html (Accessed: 4 May 2005).
Wikipedia (2006). Analysis of Variance. [Internet] Available from
http://en.wikipedia.org/wiki/ANOVA (Accessed: 22 February 2006)

- 108 -
Yap, K. et al. (2000). Evaluating Whole-School Reform Efforts: A Guide for District
and School Staff. [Internet] NWREL, Portland, Oregon. Available from
http://www.nwrac.org/whole-school/index.html (Accessed: 13 February
2006).

- 109 -
Appendix The online survey is following on the next pages:
Dissertation for the MBA programme of: Laureate and the University of Liverpool Title: "Communication Across Borders"
by Oliver Kroener This is a survey concerning communication channels in regards with communication across borders in IT Outsourcing projects. The objective is to find out which channels are mainly used and how usable and suitable they are. In addition security aspects are considered!
Please enter some general data (not required):
The country you live in: n/a
The size of the company you work for: n/a
Your status in the company: n/a
Please answer all the following questions! Thank you very much for your help! If you have any question, please contact me directly [email protected]
1st Section
1. Usability: Is this technology easy to use and to implement? High5 4 3 2
Low 1
Electronic Mail System
Newsgroups / Bulletin Boards
Text based Conferencing Systems (Chat)
Audio based Conferencing Systems
Video based Conferencing Systems
Meeting Support Systems (e.g. Yahoo Messenger, Net meeting, ..)
Workflow Systems (IBM MQ-Series, Lotus Notes, ..)
Shared Editor / Whiteboards
Shared Workspace Virtual Environments (virtual reality)
Telephone

- 110 -
Fax
2. Usage: Do you use this technology frequently? High5 4 3 2
Low 1
Electronic Mail System
Newsgroups / Bulletin Boards
Text based Conferencing Systems (Chat)
Audio based Conferencing Systems
Video based Conferencing Systems
Meeting Support Systems (e.g. Yahoo Messenger, Net meeting, ..)
Workflow Systems (IBM MQ-Series, Lotus Notes, ..)
Shared Editor / Whiteboards
Shared Workspace Virtual Environments (virtual reality)
Telephone
Fax
3. Security: Do you think that this is a secure technology? High5 4 3 2
Low 1
Electronic Mail System
Newsgroups / Bulletin Boards
Text based Conferencing Systems (Chat)
Audio based Conferencing Systems
Video based Conferencing Systems
Meeting Support Systems (e.g. Yahoo Messenger, Net meeting, ..)
Workflow Systems (IBM MQ-Series, Lotus Notes, ..)
Shared Editor / Whiteboards
Shared Workspace Virtual Environments (virtual reality)
Telephone
Fax 4. Audit Trail: How much does this medium support automated audit trails (minutes of meeting)?
High5 4 3 2
Low 1
Electronic Mail System
Newsgroups / Bulletin Boards
Text based Conferencing Systems (Chat)
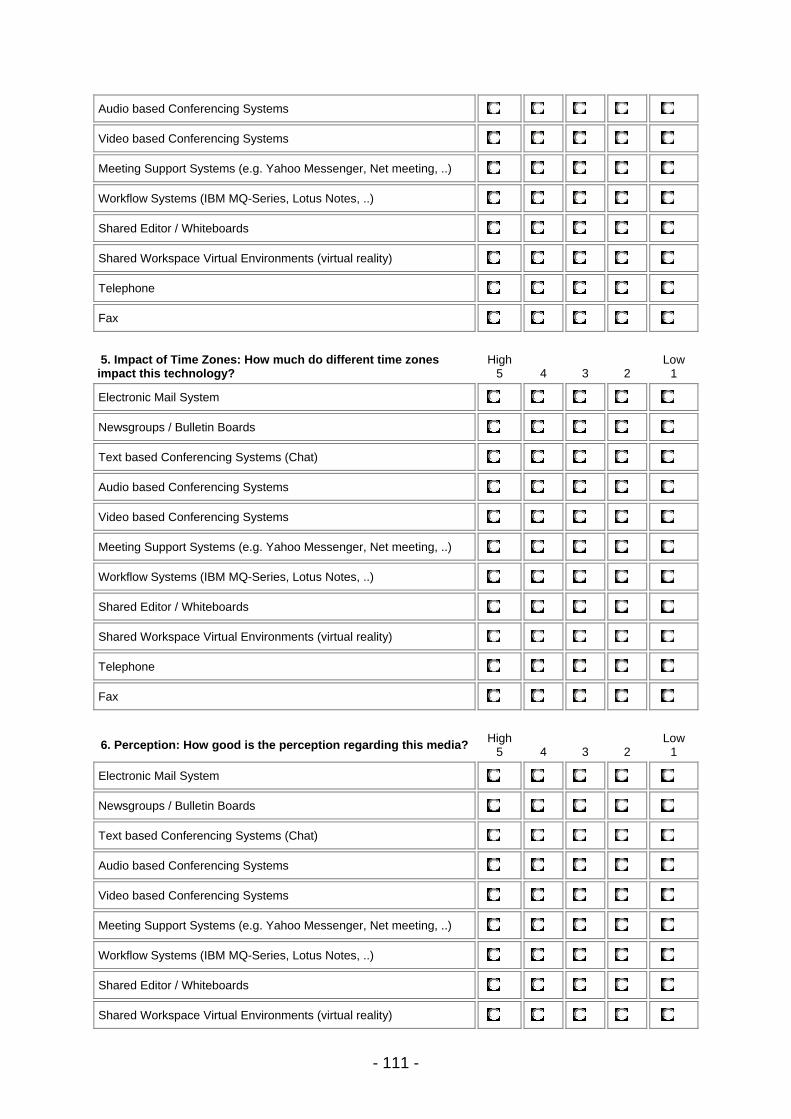
- 111 -
Audio based Conferencing Systems
Video based Conferencing Systems
Meeting Support Systems (e.g. Yahoo Messenger, Net meeting, ..)
Workflow Systems (IBM MQ-Series, Lotus Notes, ..)
Shared Editor / Whiteboards
Shared Workspace Virtual Environments (virtual reality)
Telephone
Fax 5. Impact of Time Zones: How much do different time zones impact this technology?
High5 4 3 2
Low 1
Electronic Mail System
Newsgroups / Bulletin Boards
Text based Conferencing Systems (Chat)
Audio based Conferencing Systems
Video based Conferencing Systems
Meeting Support Systems (e.g. Yahoo Messenger, Net meeting, ..)
Workflow Systems (IBM MQ-Series, Lotus Notes, ..)
Shared Editor / Whiteboards
Shared Workspace Virtual Environments (virtual reality)
Telephone
Fax
6. Perception: How good is the perception regarding this media? High5 4 3 2
Low 1
Electronic Mail System
Newsgroups / Bulletin Boards
Text based Conferencing Systems (Chat)
Audio based Conferencing Systems
Video based Conferencing Systems
Meeting Support Systems (e.g. Yahoo Messenger, Net meeting, ..)
Workflow Systems (IBM MQ-Series, Lotus Notes, ..)
Shared Editor / Whiteboards
Shared Workspace Virtual Environments (virtual reality)
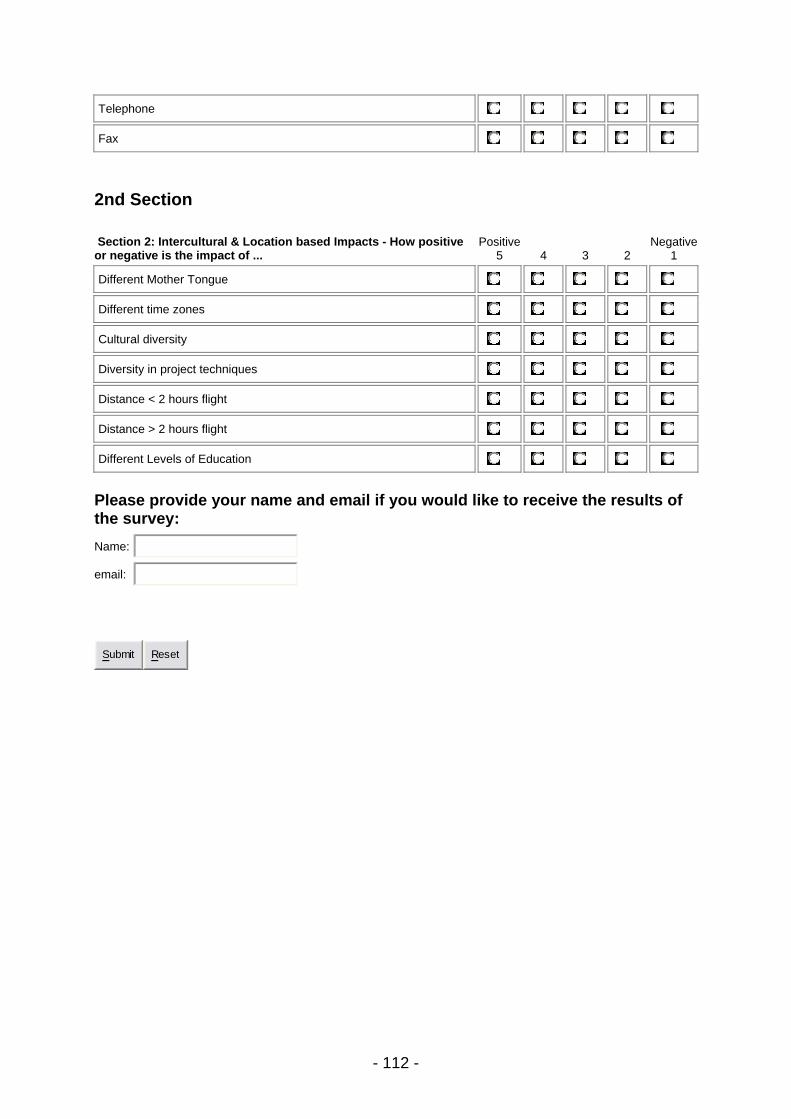
- 112 -
Telephone
Fax
2nd Section Section 2: Intercultural & Location based Impacts - How positive or negative is the impact of ...
Positive5 4 3 2
Negative1
Different Mother Tongue
Different time zones
Cultural diversity
Diversity in project techniques
Distance < 2 hours flight
Distance > 2 hours flight
Different Levels of Education
Please provide your name and email if you would like to receive the results of the survey: Name:
email:
Submit Reset
THE UNIVERSITY OF LIVERPOOL MASTER OF BUSINESS ADMINISTRATION
Submitted to: Jonathan Picklesimer
Submitted by: Oliver Kroener
Ludwigstrasse 87D 70197 Stuttgart Germany Phone: +49 711 67 400 196 Mobile: +49 171 7962523 Email: [email protected]
Date of Submission: 02/28/2006
Title: Communication Across Borders
Certification of Authorship: I hereby certify that this paper constitutes my own product, that where the language of others is set forth, quotation marks so indicate, and that appropriate credit is given where I have used the language, ideas, expressions or writings of another. Student’s Signature: (Oliver Kroener)