Embed Size (px)
Citation preview

A KANBAN/SCRUM MASHUP TO DELIVER FP PROJECTS
Sudipta Lahiri06-06-15

Sudipta Lahiri (Sudi)[email protected], [email protected]
• Senior Vice President, Digité
• Agile/Lean practitioner (75%)
• Lean Transformation of our own team
• Developed SwiftKanban (www.swiftkanban.com), SwiftALM (www.digite.com)
• Licensed user base of over 300,000
• Agile Coach (25%)
• Train and coach teams/organizations in Lean/Agile
• Run the LimitedWIP Societies in India
My Background
06-06-15

Fixed Price projects – almost always associated with Fixed Scope and Fixed Timeline projects
FP Projects
06-06-15

Understanding the problem... Large number of companies execute FP projects
in India Strong perception that Agile is not suitable for
this.
Traditional software
development
Scope
Time Cost(resources)
Scope
TimeCost
(resources)
Agile software development
(Target business goals & outcomes)
06-06-15

Understanding the problem... Part II Large number of teams DO NOT have
stable teams A sample of my current project...
Sep/
14
Oct/1
4
Nov/1
4
Dec/1
4
Jan/
15
Feb/
15
Mar/1
5
Apr/1
5
May/1
5
Jun/
15
Jul/1
5
Aug/1
5
Sep/
15
Oct/1
5
Nov/1
5
Dec/1
5
Jan/
160
20
40
60
80
100
120
140
Team Size Velocity/throughput
based projections are based on stable teams
A simple extrapolation is grossly inaccurate!
06-06-15

Understanding the problem... Part III
06-06-15
Fixed Price projects need strong budget control Need to keep an eye on your budget
closely... Scope creep needs to be controlled
Anti-pattern to Agile thinking They often have “large” teams
A few days of “unnoticed” delay causes a loss of multiple person months

Yet, teams want to adopt Agile/Lean: Selectively... Slowly... Steadily
Lean thinking
• Value• Value
Stream• Flow• Pull• Continuous
Improvement
• Respect for people
Kanban Thinking
• Lean principles
• Visualize Value Stream
• Limit WIP• Make
process policies explicit
SCRUM thinking
• Cadences• Artefacts• Ceremonies
• Standups• Retrospecti
ves• Roles
06-06-15

What we will talk about today? Different ways to handle these problem statements
These are executed/WIP projects
Bottomline, don’t jump to the conclusion: “Agile/Lean is not for you” Understand the thinking behind and see how you can
apply! There is rarely anything that Agile/Lean cannot be
applied to, if you focus on applying the “thinking”
06-06-15

Size: 150+ man years, with 60-70 team sizeEnterprise Implementation7 parallel tracks
4 functional; 1 Integration; 1 migration; 1 Customization; 1 Test Automation
3 distributed locations
Executing the mashup...
06-06-15

Project Initiation: Kickoff Meeting
06-06-15
The standard stuff... with a “twist” Mandatory demos in the value stream: pre-
FT Welcome feedback and change! Requirements: a starting point + a basis for
Acceptance Criteria Take its commercial impact in Change Control
track Define an initial approach; keep changing
with retrospectives

Project Planning: The approach
Our DNA is Lean thinking We needed to commit to a
timeline... In a Fixed Scope project,
customer demands a schedule
Schedule must meet business/contractual commitments
Further, we needed something for close tracking of milestones/deadlines
Our solution: The Kanban Method + Iteration Planning + Burndown Charts
Why not SCRUMBAN? “Scope” Boards vs
“Task” Boards Change Management
Issues Customer is applying
Agile/Lean for the first time
HR and structural issues
No existing throughput data Half the team is from
the customer
06-06-15

Project Planning: Building the baseline
06-06-15
Inputs:• Requirement
Documents• Resource
Availability• Timeline
commitments from business
Tasks:• CSF: Scope decomposition as
per INVEST => EPICS (Functional Units)
• Product Fit Analysis:• CSF: Identify Customizations
• Quick “Gut Feel” Estimation• Allocation and Prioritization of
Epics into Sprints, taking Customization timelines into account
• Subsequent Sprints get 10% less allocation
• Plan for Contingency:• Additional Sprints Planned
with no allocated cards• Iterate this process!
Output:• Sprint Plan• Schedule for
Customer• Resource Plan
We called this Sprint 0!

Sample artefacts...
06-06-15
Team Sprint Dev Wk
Dev Wk
Start Date
End Date # Des Res
# Dev Res
Des Cap
Dev Cap
Des Alloc
Dev Alloc
Des Rem Cap
Dev Rem Cap
Des % Rem Cap
Dev % Rem Cap
Team X Mini 1 2 17-Nov 07-Dec 3 4 105 280 59 258 46 22 43% 8%Team X Sprint 1 4 6 24-Nov 18-Jan 1 3 140 630 122 583 18 47 13% 7%Team X Sprint 2 4 4 22-Dec 15-Feb 1 3 140 420 80 361 60 59 43% 14%Team X Sprint 3 4 4 19-Jan 15-Mar 1 3 140 420 68 309 72 111 52% 26%Team X Sprint 4 4 4 16-Feb 12-Apr 1 3 140 420 140 420 100% 100%Team Y Mini 1 2 17-Nov 07-Dec 1 2 35 140 30 130 5 10 14% 7%Team Y Sprint 1 4 6 24-Nov 18-Jan 1 2 140 420 78 349 62 71 44% 17%Team Y Sprint 2 4 4 22-Dec 15-Feb 1 2 140 280 44 190 96 90 69% 32%Team Y Sprint 3 4 4 19-Jan 15-Mar 1 2 140 280 15 91 125 189 89% 68%Team Y Sprint 4 4 4 16-Feb 12-Apr 1 2 140 280 140 280 100% 100%

Sprint Plan/Baseline Schedule
Overall effort: 0.5%
06-06-15
mid-Jan mid-Feb mid-Mar mid-Apr
BR Mini Sprint 1 Sprint 2 Sprint 3 Sprint 4EPICS Allocated
EPICS Total
EPICS Unallocated
1 4 20 1 0 0 25 27 22 0 1 8 0 0 9 9 03 3 1 14 0 0 18 19 14 0 0 10 0 0 10 11 15 0 1 0 0 0 1 2 16 0 5 0 0 0 5 5 07 4 7 1 0 0 12 14 28 0 4 0 0 0 4 4 09 0 5 1 1 0 7 7 0
10 0 1 0 0 0 1 1 011 0 2 0 2 0 4 4 012 1 1 0 0 0 2 2 013 2 0 0 0 0 2 4 214 1 3 0 1 0 5 5 015 2 0 5 3 0 10 11 116 0 0 6 1 0 7 9 217 0 0 12 0 0 12 90 7818 0 0 0 1 0 1 1 019 0 2 0 2 0 4 4 020 2 1 0 0 0 3 3 021 2 0 0 0 0 2 3 122 0 0 0 0 0 0 3 323 0 0 0 3 0 3 8 524 0 0 0 8 0 8 8 0
21 54 58 11 0 144 254 91
Contingency

Project Execution: Kanban Method
06-06-15

Project Execution: Tracking Burndown
06-06-15
Spillover work from one Sprint would be created as “Spillover” card in the next Sprint

06-06-15
Project Execution: Early feedback with Demos before FT
Changes are welcomeDon’t compromise the solution quality because of budget/cost considerations
Take Commercial considerations under Change Control

Project Monitoring: Quick and simple
06-06-15

One possible solution: AgileEVM
This is good... but what happens when your team size is dynamic at the individual team level?
06-06-15

An adaptation of EVM to Agile
06-06-15
Define by Tamara Sulaiman and 2 others http://www.solutionsiq.com/Portals/93486/docs/earned-value-analysis-in-scrum-
projects-wp.pdf
Key difference: "Work" is given credit when it is completes testing/deployment
Aligns with the Agile’s value on "Working Software“Traditional
EVMApproach
AgileAnalytics
ExpandedAgile
Analytics

15/04/2023
21
Here is what we do...
Define a resource
plan for the MMF scope
Use this as the basis for EVM
Track velocity/
throughput information
Re-calibrate capacity to
delivery date
Allow for scope
changes to happen
Planning Phase
Activities
Execution Phase
Activities

22Original budget 48.57 MM 1020 MDOriginal timeline 10Original Wk1 Wk2 Wk3 Wk4 Wk5 Wk6 Wk7 Wk8 Wk9 Wk10Productivity 100% 100% 100% 100% 100% 100% 100% 100% 100% 100%Overall Development Resources 14 14 18.5 18.5 18.5 18.5 18.5 18.5 18.5 18.5Overall ST Resources 3 3 3 3 3 3 3 3 3 3
Overall Development Resources 14 14 18.5 18.5 16.5 18.5 18.5 18.5 18.5 18.5Overall ST Resources 3 3 3 3 3 3 3 3 3 3
Technical Requirement 1 2 2 4 4 2 2MMF 1
User Story 1.1 2 2 4 1 1User Story 1.2 2 2 2 2 2User Story 1.3 1 1 1 1 1ST Resources 1.5 1.5 1.5 1 1
MMF2User Story 2.1 2 2 2 1 1User Story 2.2 2 2 2 2 2User Story 2.3 1 1 1.5 1.5 1.5ST Resources 1.5 1.5 1.5 1 1
MMF3User Story 3.1 2 2 2 2 2 2 2ST Resources 1 1 1 1
MMF4User Story 4.1 2 2 4 5 6 6 6User Story 4.2 2 2 2 2 2User Story 4.3 1.5 1.5 1.5 1.5 1.5ST Resources 1 1 1.5 1.5 1.5
MMF5User Story 5.1 2 2 4 5 6 6 6User Story 5.2 2 2 2 2 2User Story 5.3 1 1 1 1 1ST Resources 1 1 1.5 1.5 1.5
Total (Current) 17 17 21.5 21.5 19.5 21.5 21.5 21.5 21.5 21.5Planned value 85 85 107.5 107.5 97.5 107.5 107.5 107.5 107.5 107.5Cumm. Original Plan Value 85 170 278 385 483 590 698 805 913 1020
Weeks
Project Planning: Capacity vs Timeline
Original Wk1 Wk2 Wk3 Wk4 Wk5 Wk6 Wk7 Wk8 Wk9 Wk10
Overall Development Resources 14 14 18.5 18.5 16.5 18.5 18.5 18.5 18.5 18.5Overall ST Resources 3 3 3 3 3 3 3 3 3 3 Total (Current) 17 17 21.5 21.5 19.5 21.5 21.5 21.5 21.5 21.5
Cumm. Original Plan Value 85 170 278 385 483 590 698 805 913 1020
Wk1
Wk2
Wk3
Wk4
Wk5
Wk6
Wk7
Wk8
Wk9
Wk1
00
200
400
600
800
1000
1200
Planned Value
Man D
ays
Detailed resource timeline level
planning at the Story Level, time
consuming and full of assumptions...

15/04/2023
Project Planning:Make it a little more practical...
Positive/negative factors on productivity: Resource ramp-up, skill
training, domain training, etc.
Team decides how to calibrate productivity across time
Benefits: PV: Planned Value PV reflects reality S-curve in PV
Wk0
Wk1
Wk2
Wk3
Wk4
Wk5
Wk6
Wk7
Wk8
Wk9
Wk1
00
200
400
600
800
1000
1200
Planned Value
Man D
ays
Original Wk1 Wk2 Wk3 Wk4 Wk5 Wk6 Wk7 Wk8 Wk9 Wk10Productivity 25% 50% 75% 100% 125% 125% 125% 125% 112% 112%Development Res. 14 14 18.5 18.5 18.5 18.5 18.5 18.5 18.5 18.5ST res. 3 3 3 3 3 3 3 3 3 3Total (Current) 4.25 8.5 16.13 21.5 26.88 26.88 26.88 26.88 24.08 24.08Cumm. Original Plan Value 21 64 144 252 386 521 655 789 910 1030
23

15/04/2023
24
Project Monitoring: Tracking EV Most Kanban tools dump their Board data to an Excel
Gives card wise, stage wise breakup Two alternatives:
Give a certain % completion to each stage of the value stream completed on their estimated size
For example: Requirement done is 20% value earned, Design completed is 15% value earned.... OR
Stick to Agile emphasis on “working software” and give 100% value earned when a card is archived
Aggregate across the Board weekly and you will get the EV trend
To track Actual Cost: Get a weekly resource allocation OR Get your TimeSheet data

15/04/2023
25
Project Monitoring: PV vs EV tracking
wk20wk2
1wk2
2wk2
3wk2
4wk2
5wk2
6wk2
7wk2
8wk2
9wk3
0wk3
1wk3
2wk3
3wk3
4wk3
5wk3
6wk3
7wk3
8wk3
90
100
200
300
400
500
600
700
800
900
Planned Value
Earned Value
Actual CostScheduleVariance
CostVariance

15/04/2023
26
Accepting change is “key” to Agile thinking
Challenge:In fixed projects, how done one handle timeline and budget?
Impacting Scope Change
15/04/2023
27
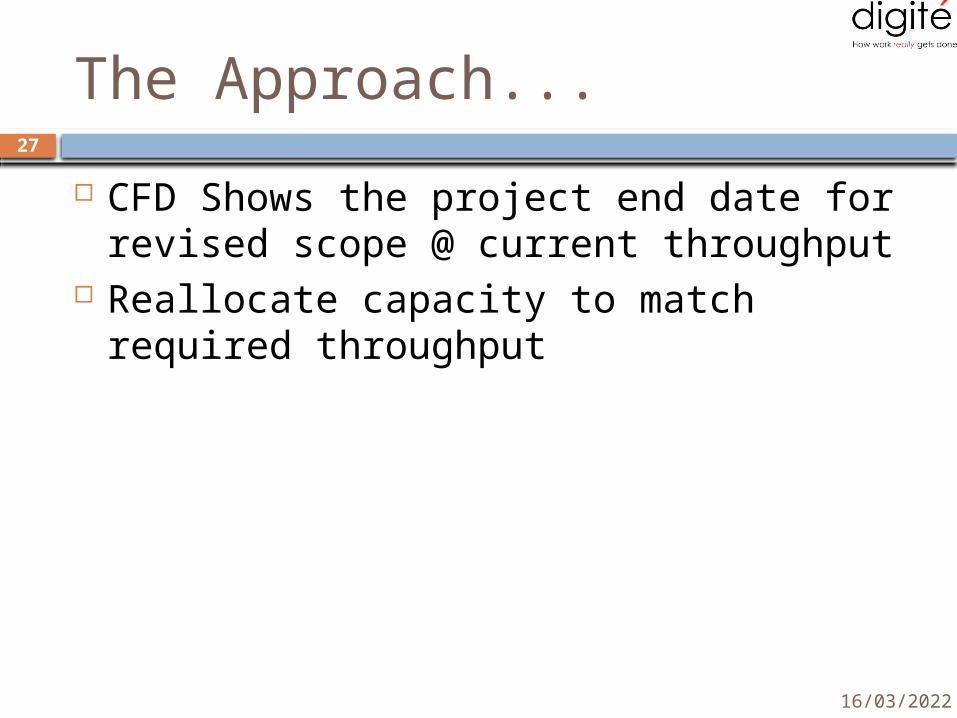
The Approach...
CFD Shows the project end date for revised scope @ current throughput
Reallocate capacity to match required throughput

15/04/2023
28
Let us understand this with an example...
Consider the following Board....XXXXXXXXXXXXXXXXX
XXXXXXXXXXXXX
XXXXXXXXXXXXXXXXXXXXXXX
XXXXXXXXXX

15/04/2023
29
Current throughput
Assume that the team is performing at the Required Burn-up rate

15/04/2023
Now, evaluate Scope change... 120md of work has been added and
updated in the Backlog (highligted in red)
30
XXXXXXXXXXXXXXXXX
XXXXXXXXXXXXXXXXXXXXX

15/04/2023
31
Project the CFD again...
Required Throughput increases from 16.13/day to 18.09/day to meet the same timeline An increase of 12% in addition

15/04/2023
32
An iterative process with stakeholders to evaluate options and converge
Option I: Increase capacity by 12-15% to reach desired throughput
Factor in an increase in overhead as team size increases
Option II: Keep the same capacity but push back the timeline by 12-15%
Option III Reprioritize scope to keep the total scope largely unchanged
but deliver to the revised timeline Option IV
A combination of all of above for overall stakeholder agreement
Partial capacity increase + partial extension in timeline + reprioritizing scope
For each option, use CFD projection to evaluate the final result

15/04/2023
Step 3: Adjust PV for revised plan
For small changes in resource availability/scope, Planned Value need not change Small: < 10% estimate
variation For significant changes,
rework Planned Value as for modified Resource Plan
0
200
400
600
800
1000
1200
1400
Cumm. Origi-nal Plan Value
33
Revised Wk1 Wk2 Wk3 Wk4 Wk5 Wk6 Wk7 Wk8 Wk9 Wk10 Wk11 Wk12Productivity 25% 50% 75% 100% 125% 125% 125% 125% 112% 112% 112% 112%Development Res. 14 14 15 15 15 18 18 18 18 12 12 12ST res. 3 3 3 3 4 4 4 4 4 4 4 4Total (Current) 4.25 8.5 13.5 18 23.75 27.5 27.5 27.5 24.64 17.92 17.92 17.92Scope Addition (in mm) 5 Cumm. Revised Plan Value 21.3 63.8 131.3 221.3 340 477.5 615 752.5 875.7 965.3 1054.9 1144.5

15/04/2023
34
A quick re-cap
Agile/Lean “thinking” can be applied to FP projects Don’t copy the practices, templates... Adapt!
Quite simple if you have stable teams; a little more tricky if you do not have stable teams
Use Throughput/Velocity to track if the team is delivering at the desired pace
When scope changes, evaluate multiple options using the Throughput and iterate with stakeholders

15/04/2023
35
Thank you for your time today...
For any questions or clarifications, you can reach me at: @sudiptal [email protected]
I share my experiences at: http://www.swiftkanban.com/
blog/sudipta-lahiri http://sudi-thoughts.blogspot.in/
Join Limited WIP Society NCR, Bangalore, Pune and Chennai Chapters