Embed Size (px)
Citation preview

1
Conference Call / WebcastRESULTS ANNOUCEMENT3rd Quarter 2008(Brazilian Corporate Law)
Almir Guilherme BarbassaCFO and Investor Relations OfficerNovember, 12th 2008

2
Disclaimer
The presentation may contain forecasts about future events. Such forecasts merely reflect the expectations of the Company's management. Such terms as "anticipate", "believe", "expect", "forecast", "intend", "plan", "project", "seek", "should", along with similar or analogous expressions, are used to identify such forecasts. These predictions evidently involve risks and uncertainties, whether foreseen or not by the Company. Therefore, the future results of operations may differ from current expectations, and readers must not base their expectations exclusively on the information presented herein. The Company is not obliged to update the presentation/such forecasts in light of new information or future developments.
The United States Securities and Exchange Commission permits oil and gas companies, in their filings with the SEC, to disclose only proved reserves that a company has demonstrated by actual production or conclusive formation tests to be economically and legally producible under existing economic and operating conditions. We use certain terms in this presentation, such as oil and gas resources, that the SEC’s guidelines strictly prohibit us from including in filings with the SEC.
CAUTIONARY STATEMENT FOR US INVESTORS

3
NATIONAL OIL AND NATURAL GAS PRODUCTION – 3Q08 VS 2Q08
271 321 330
1,8541,797 1,883
3Q07 2Q08 3Q08Oil and LNG Natural Gas
Thou
s. b
pd
2,1752,213
2%
Oil and Gas Average National Production
2,068
• 2% Increase in oil production due to productiongrowth in platforms P-52 and P-54 .
105.295.262.2P-54
149.1
Production3Q08
P-52
Platforms
155.7107.9
Current ProductionOct, 2008Production 2Q08
7%
Thou
sand
bpd
1,887 1,885
1,898
July August September

4
P-51 P-53 FPSO Cidade de Niterói
JAN/09
NOV/08
JAN/09
FIRST OIL
Marlim Leste
Marlim Leste
Marlim Sul
FIELD
100 th. bpd3.5 million m3/d
180 th. bpd6 million m3/d
180 th. bpd6 million m3/d
CAPACITY
Arrival to thelocation andbegining theancoring
Wells connection
Move to location
NEXT STEPS
Coming to BrazilFPSO Cidade de Niterói
On LocationP-53
Soon leaving theshipyard
P-51
STATUSPLATFORMS
STATUS OF NEW PRODUCTION SYSTEMS

5
UPDATE ON SANTOS BASIN PRE SALT
BM-S-17
BM-S-50
BM-S-52(Corcovado)
BM-S-42
Wells Drilled
BM-S-21 (Caramba)
BM-S-8 (Bem-te-Vi)
BM-S-10 (Parati)
BM-S-11(Tupi)
(Guará)
BM-S-24(Jupiter)
(Yara)
BM-S-22
BM-S-9 (Carioca)
Updates:
• Completed the MinimalExploratory Program;
• Preparation for theextended well test ofTupi. The test and thepilot system are onschedule;
• Presently evaluatingwhere to developadditional well tests andpilot systems, in thecluster.

6
LIFTING COST IN BRAZIL
14.45 14.66 15.22 15.16 16.34 17.61
20.58 23.26 25.76 28.0434.80 36.79
0
10
20
30
40
50
60
70
80
2Q07 3Q07 4Q07 1Q08 2Q08 3Q08
Lifting Cost (R$) Gov Take (R$)
7.33 7.65 8.60 8.66 9.88 10.21
10.62 12.48 14.56 16.1621.20 20.06
115
96.9
121
88.774.968.8
0
10
20
30
40
50
60
70
80
2Q07 3Q07 4Q07 1Q08 2Q08 3Q080
20
40
60
80
100
120
140
Lifting Cost (US$) Gov. Take (US$) Brent
US$/barrel R$/barrel
Increase in lifting cost without government take:
• Higher expenses with maintenance and intervention ;
• Higher expenses with personnel;
Increase in government take:
• Increase of the production in Roncador field which began to pay higher special participation tax;
• Increase in referential oil price from R$ 160,59 in 2Q08 to R$ 162,30 in 3Q08.
7
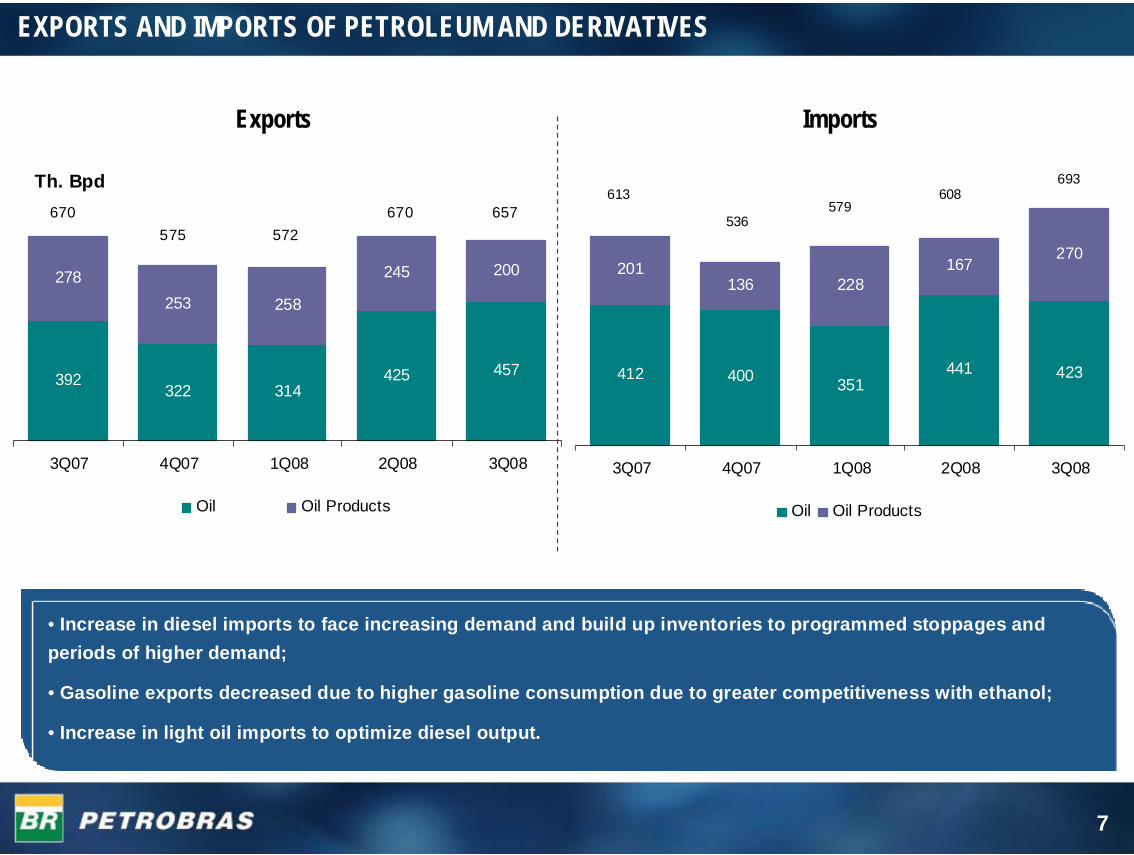
EXPORTS AND IMPORTS OF PETROLEUM AND DERIVATIVES
• Increase in diesel imports to face increasing demand and build up inventories to programmed stoppages and periods of higher demand;
• Gasoline exports decreased due to higher gasoline consumption due to greater competitiveness with ethanol;
• Increase in light oil imports to optimize diesel output.
392322 314
425 457
278253 258
245 200
3Q07 4Q07 1Q08 2Q08 3Q08
Oil Oil Products
670575 572
670 657
Th. Bpd
412 400 351441 423
201136 228
167270
3Q07 4Q07 1Q08 2Q08 3Q08
Oil Oil Products
613
536579
608693
Exports Imports

8
1,8211,790
1,846
1,7761,8061,796 1,795 1,7641,768
1,709
1,776
1,703
89909189 95 93
777978 7878 76
1,500
1,650
1,800
1,950
2Q07 3Q07 4Q07 1Q08 2Q08 3Q0830
40
50
60
70
80
90
Output of Domestic Oil Products Sales Volume of Total Oil ProductsUse of Installed Capacity - Brazil (%) Domestic Crude (%) of Total Feedstook Processed
Thous. bpd %
DOWNSTREAM OPERATIONAL PERFORMANCE
• Maintenance of the output in higher levels as a result of continued operational reliability;• Increase of oil products sales in the 3Q08 due to seasonality and economic growth;• Highlights: diesel sales growth (5% - supplied by imports), gasoline (7%) and fuel oil (8%).
9
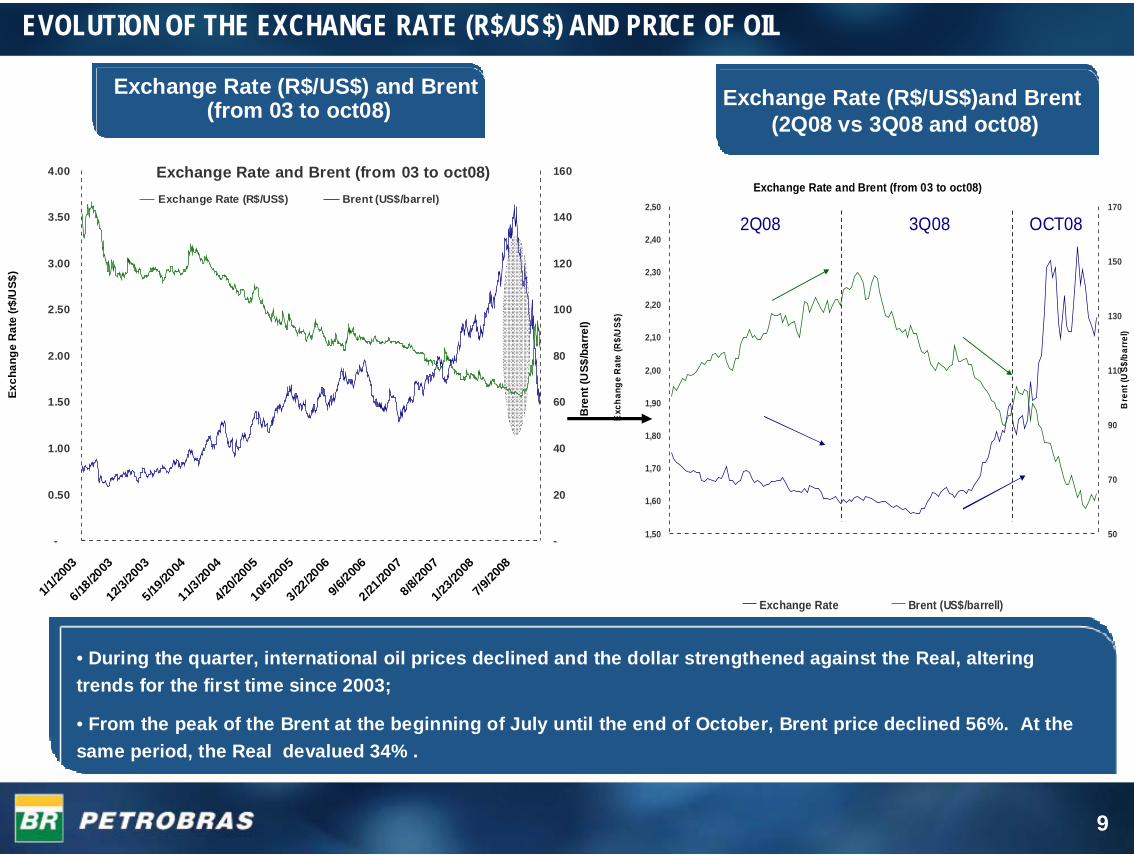
EVOLUTION OF THE EXCHANGE RATE (R$/US$) AND PRICE OF OIL
Exchange Rate (R$/US$)and Brent(2Q08 vs 3Q08 and oct08)
Exchange Rate (R$/US$) and Brent (from 03 to oct08)
• During the quarter, international oil prices declined and the dollar strengthened against the Real, altering trends for the first time since 2003;
• From the peak of the Brent at the beginning of July until the end of October, Brent price declined 56%. At the same period, the Real devalued 34% .
Exchange Rate and Brent (from 03 to oct08)
-
0.50
1.00
1.50
2.00
2.50
3.00
3.50
4.00
1/1/20
036/18
/2003
12/3/
2003
5/19/20
0411/3
/2004
4/20/2
005
10/5/20
053/22
/2006
9/6/200
62/21
/2007
8/8/20
071/2
3/200
87/9
/2008
Exch
ange
Rat
e (r$
/US$
)
-
20
40
60
80
100
120
140
160
Bre
nt (U
S$/b
arre
l)
Exchange Rate (R$/US$) Brent (US$/barrel)Exchange Rate and Brent (from 03 to oct08)
1,50
1,60
1,70
1,80
1,90
2,00
2,10
2,20
2,30
2,40
2,50
1/4/20
089/4/
2008
17/4/
2008
25/4/
2008
5/5/20
0813/5
/2008
21/5/
2008
29/5/
2008
6/6/20
0816
/6 /2008
24/6/
2008
2/7/20
0810/7
/2008
18/7/200
828
/7 /2008
5/8/20
0813
/8/20
0821/8
/2008
29/8/
2008
8/9/20
0816
/9/20
0824/9
/2008
2/10/200
810
/10/20
0820
/10/20
0828/1
0/200
8
Exc
hang
e R
ate
(R$/
US$
)
50
70
90
110
130
150
170
Bre
nt (U
S$/b
arre
l)
Exchange Rate Brent (US$/barrell)
2Q08 3Q08 OCT08
10
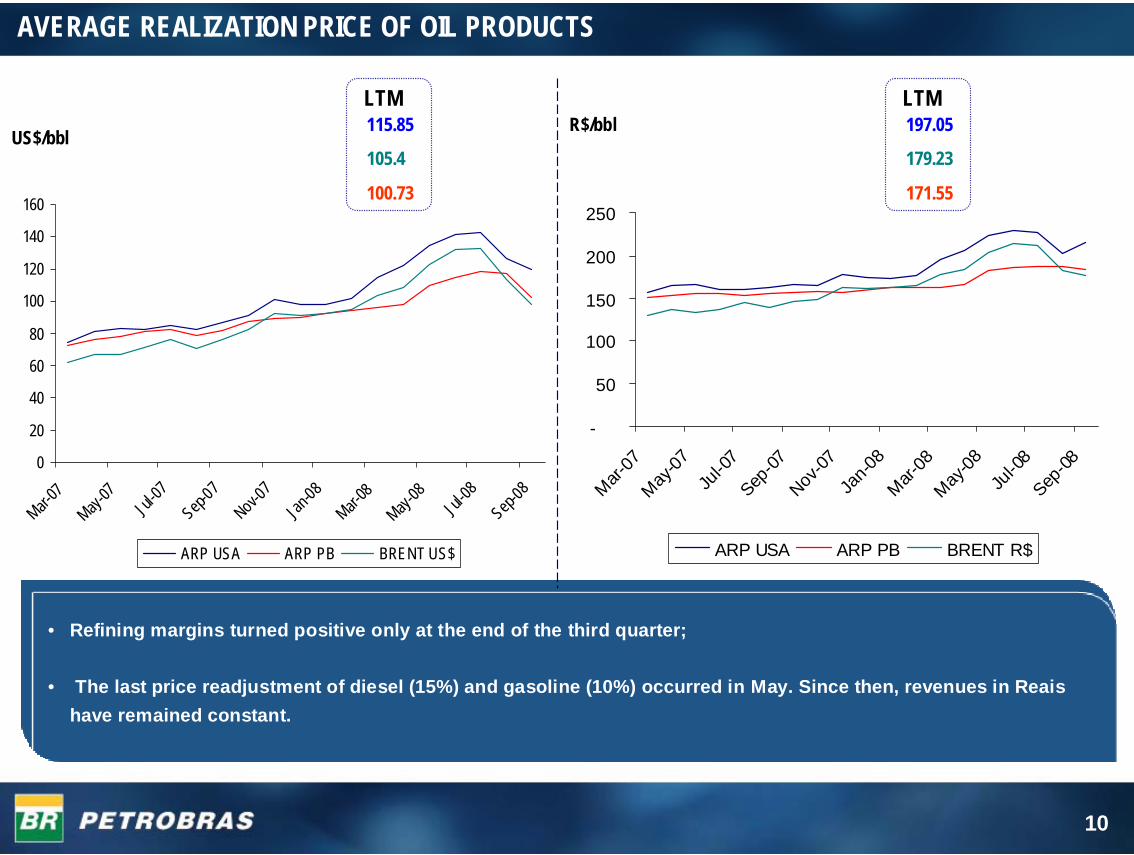
AVERAGE REALIZATION PRICE OF OIL PRODUCTS
US$/bbl
• Refining margins turned positive only at the end of the third quarter;
• The last price readjustment of diesel (15%) and gasoline (10%) occurred in May. Since then, revenues in Reaishave remained constant.
R$/bblLTM115.85
105.4
100.73
LTM197.05
179.23
171.55
0
20
40
60
80
100
120
140
160
Mar-07
May-07
Jul-07
Sep-07
Nov-07
Jan-08
Mar-08
May-08
Jul-08
Sep-08
ARP USA ARP PB BRENT US$
-
50
100
150
200
250
Mar-07
May-07
Jul-0
7Sep
-07Nov
-07Ja
n-08
Mar-08
May-08
Jul-0
8Sep
-08
ARP USA ARP PB BRENT R$
11
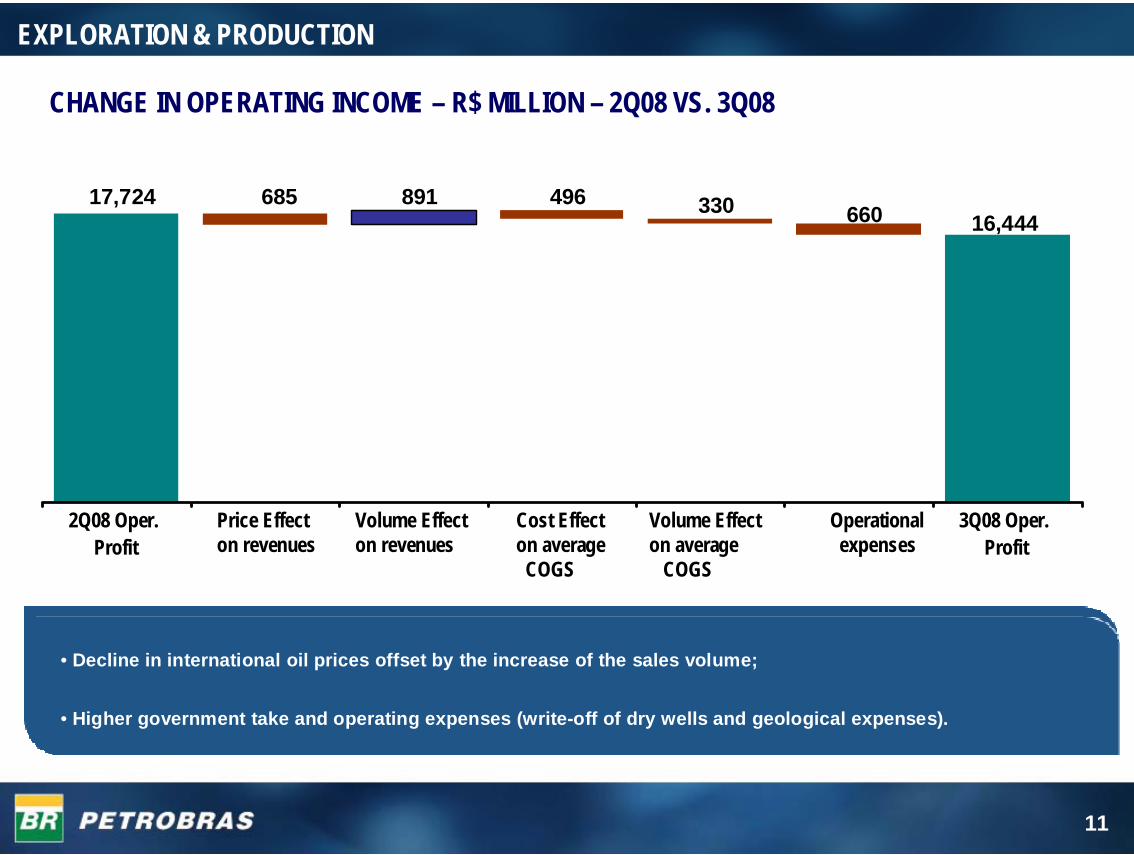
17,724 685 891 496 330 660 16,444
• Decline in international oil prices offset by the increase of the sales volume;
• Higher government take and operating expenses (write-off of dry wells and geological expenses).
EXPLORATION & PRODUCTION
2Q08 Oper.Profit
Price Effecton revenues
Volume Effecton revenues
Cost Effecton averageCOGS
Volume Effecton average
COGS
Operationalexpenses
3Q08 Oper.Profit
CHANGE IN OPERATING INCOME – R$ MILLION – 2Q08 VS. 3Q08

12
(577)
7,545
2,110 9,467
1,720
440
(2,549)
• Higher COGS due to increased oil products imports;
• Sales of inventories acquired at a higher cost in the previous quarters.
DOWNSTREAM
Volume Effecton average
COGS
OperationalExpenses
3Q08Oper. Loss
2Q08 Oper. Loss Volume Effecton Revenue
Price Effect onRevenue
Cost Effecton average COGS
CHANGE IN OPERATING INCOME – R$ MILLION – 2Q08 VS. 3Q08

13
• Lower margins due to increase of the purchase price of natural gas and electrical energy;
• Higher operating expenses from contractual fines and charges related to natural gas supply.
452
192
235 699
176
270 (266)
2Q08 Oper.Profit
Price Effecton revenues
Volume Effecton revenues
Cost Effecton averageCOGS
Volume Effecton average
COGS
Operationalexpenses
3Q08 Oper.Profit
GAS & POWER
CHANGE IN OPERATING INCOME – R$ MILLION – 2Q08 VS. 3Q08
14
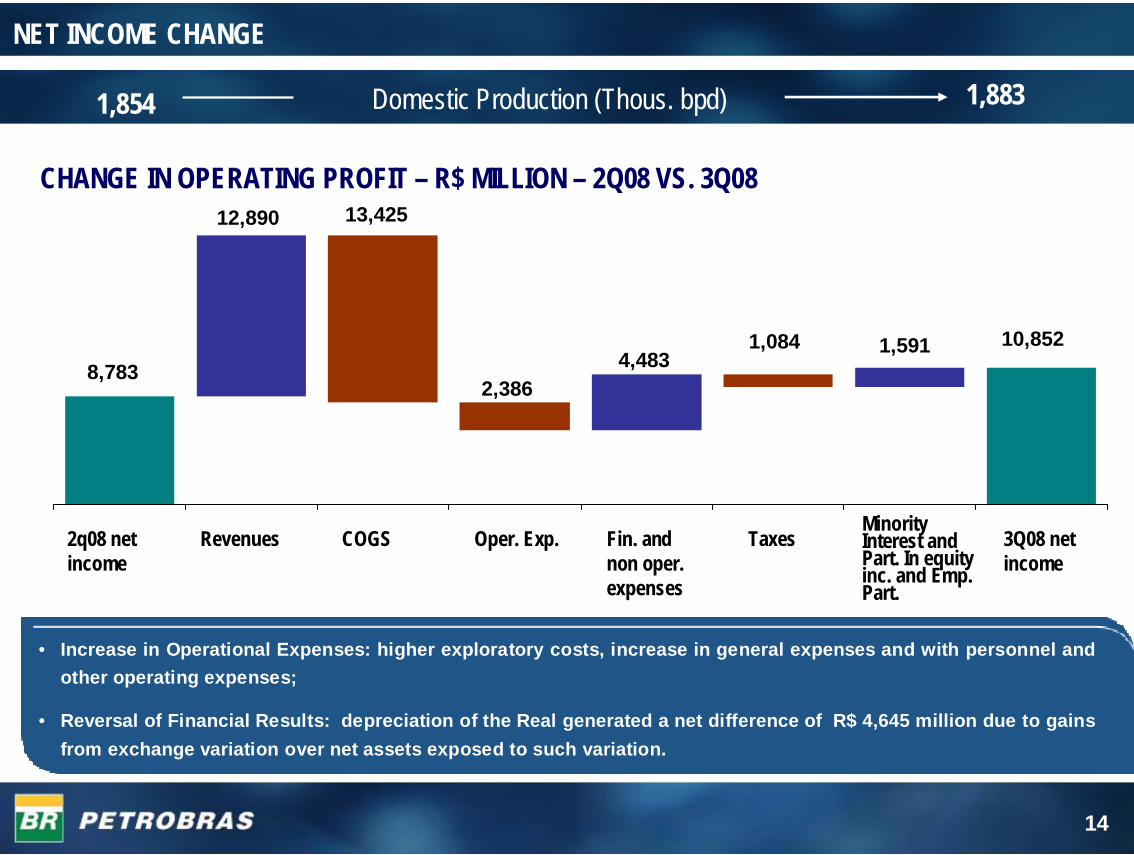
1,8831,854 Domestic Production (Thous. bpd)
• Increase in Operational Expenses: higher exploratory costs, increase in general expenses and with personnel and other operating expenses;
• Reversal of Financial Results: depreciation of the Real generated a net difference of R$ 4,645 million due to gains from exchange variation over net assets exposed to such variation.
NET INCOME CHANGE
8,783
12,890 13,425
2,3864,483
1,084 1,591 10,852
2q08 net income
Revenues Fin. andnon oper. expenses
MinorityInterest andPart. In equityinc. and Emp. Part.
Taxes 3Q08 net income
COGS Oper. Exp.
CHANGE IN OPERATING PROFIT – R$ MILLION – 2Q08 VS. 3Q08

15
ASSETS AND LIABILITIES SUBJECT TO MONETARY VALUATION
• The increase of the Net Asset exposure to exchange variation was due to the investments in International Area and E&P assets (Platforms and other oil production assets used in Brazil are owned through offshore subsidiaries) and to the decrease of the liabilities (suppliers) . • This increase of the Net Assets and the depreciation of the exchange rate (20% in the third quarter) resulted in an Net Financial Result of R$ 2,843 million in 3Q08.
(in R$ Million) 09.30.2008 06.30.2008AssetsCurrent Assets 6,884 6,692 Non-current Assets 26,498 20,227 Total Assets 33,382 26,919 LiabilitiesCurrent Liabilities (6,632) (6,332) Long-Term Liabilities (12,845) (12,601) Total Liabilities (19,477) (18,933)
Others -322 -258
Net Assets (Liabilities) in Reais 13,583 7,728

16
CASH FLOW
Jan-Sep/08 2007Net Cash Generated by Operating Activities 34,673 41,897 (-) Cash used for Capex (35,167) (45,233) E&P Investments (17,286) (20,405)
Downstream Investments (8,140) (9,647) Others (9,741) (15,181) (=)Free Cash Flow (494) (3,336)(-) Cash used in Financing Activities (1,801) (11,422)
Financing 4,386 (3,948)Dividends (6,187) (7,474)
(=) Net Cash Generated in the Period (2,295) (14,758)Cash at Beginning of Period 13,071 27,829 Cash at End of Period 10,776 13,071
R$ million
• The Cash Flow from Operating activities in 2008 is essentially in balance with our investment spending;
• Investment portfolio gives flexibility to adjust CAPEX spending.

17
DEBT PROFILE
• Petrobras maintains its relationship with numerous funding sources and has already financed all its needs for 2008;
• In 2008, including short term lines, the Company has already contracted/disbursed, approximately, US$ 9.2 billion. Of this total amount, US$1.1 billion was financed by capital markets and foreign commercial banks.
Sources 2007 2008Commercial Banks 3.6 5.3 Trade Finance 1.5 1.8 Internacional 1.0 0.6 Domestic 0.3 2.9Capital Markets 1.3 0.8Project Finance 2.3 2.9ECA - 0.2TOTAL 7.2 9.2
NEW FUNDING (US$ billion)
Sources 2007 Jun-08Commercial Banks 4.7 7.2Capital Markets 7.4 8Project Finance 4.4 4.8ECA 1.6 1.5BNDES 2.5 3.1Others 1.3 1.3TOTAL 21.9 25.9
SOURCE OF FUNDING (US$ billion) - US GAAP

18
QUESTION AND ANSWER SESSIONVisit our website: www.petrobras.com.br/ri
For more information contact:Petróleo Brasileiro S.A – PETROBRAS
Investor Relations
E-mail: [email protected]. República do Chile, 65 – 22o floor
20031-912 – Rio de Janeiro, RJ(55-21) 3224-1510 / 3224-9947


![TSKB 3Q08 IR-(14Nov08) internet.ppt [Read-Only] · 2008-11-21 · 3Q08 BRSA RESULTS INVESTOR PRESENTATION. TSKB APPENDICES. TSKB at a Glance ... (000 USD) 3Q07 3Q08 Change Adj. Net](https://img.pdfslide.us/doc/110x75/5fb9e4cfee80b63d2e0ecfb8/tskb-3q08-ir-14nov08-read-only-2008-11-21-3q08-brsa-results-investor-presentation.jpg)