Embed Size (px)
Citation preview
1
Conference Call / Webcast
Almir Guilherme BarbassaCFO and Investor Relations Officer
Results Announcement
2nd Quarter 2010 (IFRS)
August 17th, 2010
2
DISCLAIMER
FORWARD-LOOKING STATEMENTS:
DISCLAIMER
The presentation may contain forward-looking statementsabout future events within the meaning of Section 27A ofthe Securities Act of 1933, as amended, and Section 21Eof the Securities Exchange Act of 1934, as amended, thatare not based on historical facts and are not assurances offuture results. Such forward-looking statements merelyreflect the Company’s current views and estimates offuture economic circumstances, industry conditions,company performance and financial results. Such termsas "anticipate", "believe", "expect", "forecast", "intend","plan", "project", "seek", "should", along with similar oranalogous expressions, are used to identify such forward-looking statements. Readers are cautioned that thesestatements are only projections and may differ materiallyfrom actual future results or events. Readers are referredto the documents filed by the Company with the SEC,specifically the Company’s most recent Annual Report onForm 20-F, which identify important risk factors that couldcause actual results to differ from those contained in theforward-looking statements, including, among otherthings, risks relating to general economic and businessconditions, including crude oil and other commodityprices, refining margins and prevailing exchange rates,uncertainties inherent in making estimates of our oil andgas reserves including recently discovered oil and gasreserves, international and Brazilian political, economicand social developments, receipt of governmentalapprovals and licenses and our ability to obtain financing.
We undertake no obligation to publicly update orrevise any forward-looking statements, whether asa result of new information or future events or forany other reason. Figures for 2010 on areestimates or targets.
All forward-looking statements are expresslyqualified in their entirety by this cautionarystatement, and you should not place reliance onany forward-looking statement contained in thispresentation.
NON-SEC COMPLIANT OIL AND GAS RESERVES:
CAUTIONARY STATEMENT FOR US INVESTORS
We present certain data in this presentation, suchas oil and gas resources, that we are not permittedto present in documents filed with the UnitedStates Securities and Exchange Commission (SEC)under new Subpart 1200 to Regulation S-K becausesuch terms do not qualify as proved, probable orpossible reserves under Rule 4-10(a) of RegulationS-X.
3
HIGHLIGHTS FOR THE QUARTER
o Net Income increased 7%, reaching R$ 8.3 billion;
o New light oil discoveries in Campos Basin pre-salt.
Recoverable volume estimates of around 500 million
boe;
o Start-up of FPSO Capíxaba, producing from pre-salt
horizon in Espírito Santo in July;
o Business Plan 2010-2014 disclosed, with total planned
investments of US$ 224 billion;
o Two Extraordinary General Assemblies:
1. Increase in authorized capital and authorization for the
Board to execute the capitalization;
2. Approval of the method to value Brazilian Treasury Notes
in the capitalization.
4
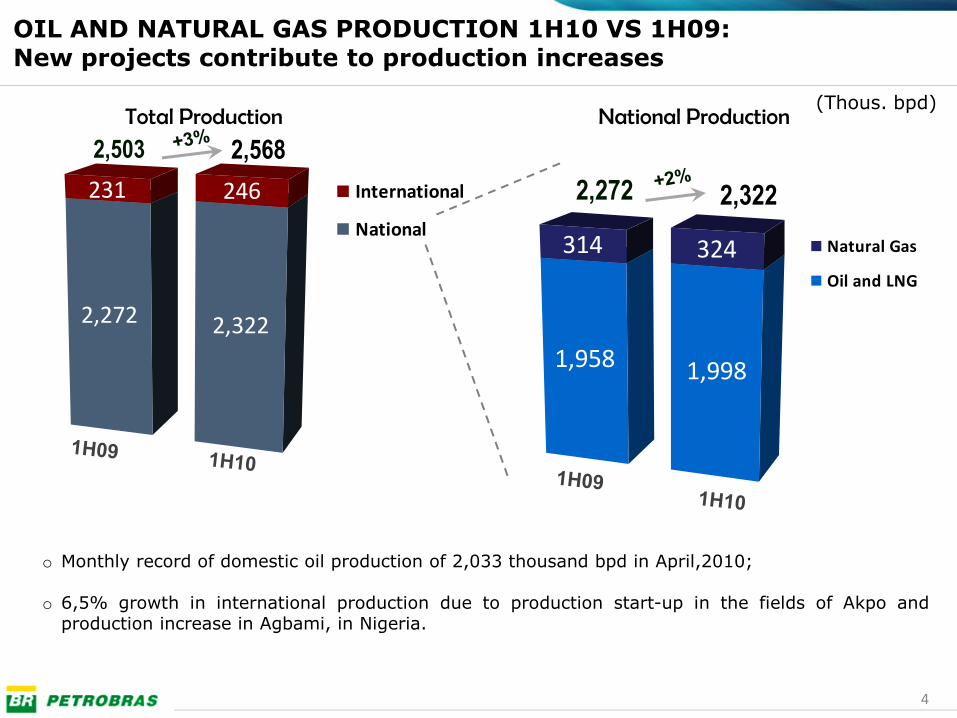
OIL AND NATURAL GAS PRODUCTION 1H10 VS 1H09:New projects contribute to production increases
1,958
314
1,998
324 Natural Gas
Oil and LNG
National Production
2,272 2,322
2,272
231
2,322
246 International
National
Total Production
2,503 2,568
o Monthly record of domestic oil production of 2,033 thousand bpd in April,2010;
o 6,5% growth in international production due to production start-up in the fields of Akpo andproduction increase in Agbami, in Nigeria.
(Thous. bpd)
5
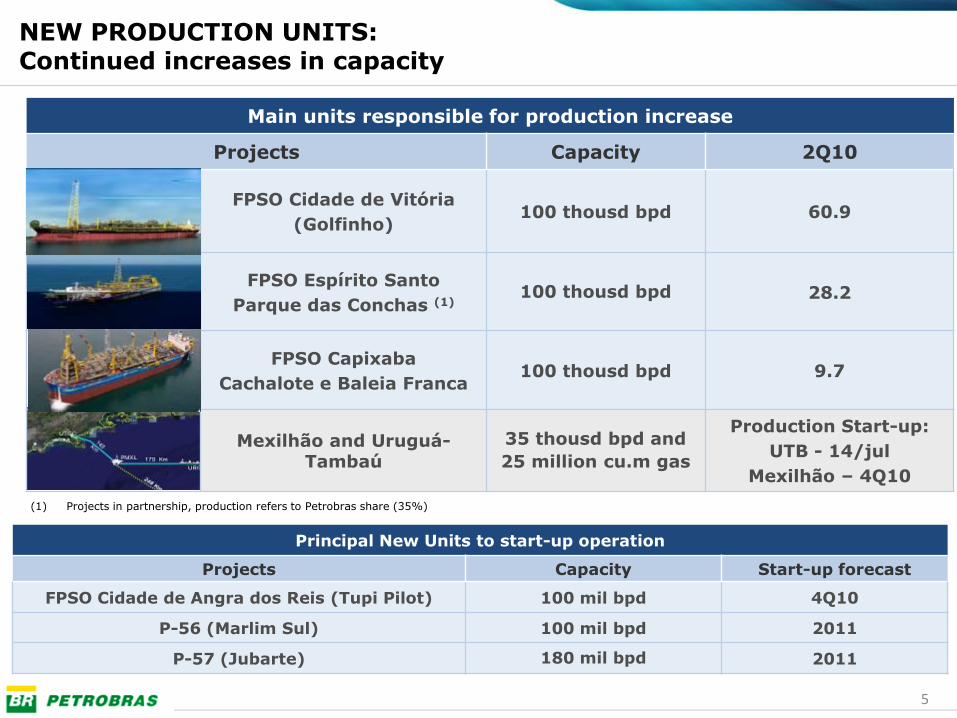
NEW PRODUCTION UNITS:Continued increases in capacity
Main units responsible for production increase
Projects Capacity 2Q10
FPSO Cidade de Vitória
(Golfinho)100 thousd bpd 60.9
FPSO Espírito Santo
Parque das Conchas (1)100 thousd bpd 28.2
FPSO Capixaba
Cachalote e Baleia Franca100 thousd bpd 9.7
Mexilhão and Uruguá-Tambaú
35 thousd bpd and
25 million cu.m gas
Production Start-up:
UTB - 14/jul
Mexilhão – 4Q10
(1) Projects in partnership, production refers to Petrobras share (35%)
Principal New Units to start-up operation
Projects Capacity Start-up forecast
FPSO Cidade de Angra dos Reis (Tupi Pilot) 100 mil bpd 4Q10
P-56 (Marlim Sul) 100 mil bpd 2011
P-57 (Jubarte) 180 mil bpd 2011
6
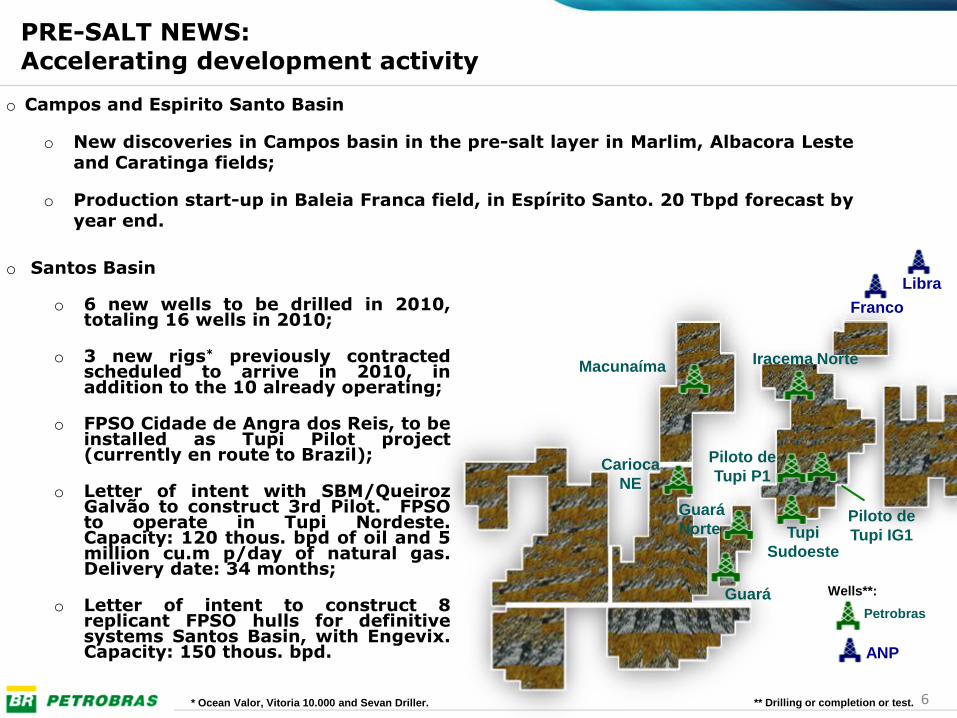
PRODUÇÃO 2010
Guará
Macunaíma
Guará
Norte
Franco
Libra
o Campos and Espirito Santo Basin
o New discoveries in Campos basin in the pre-salt layer in Marlim, Albacora Lesteand Caratinga fields;
o Production start-up in Baleia Franca field, in Espírito Santo. 20 Tbpd forecast byyear end.
Petrobras
ANP
o Santos Basin
o 6 new wells to be drilled in 2010,totaling 16 wells in 2010;
o 3 new rigs* previously contractedscheduled to arrive in 2010, inaddition to the 10 already operating;
o FPSO Cidade de Angra dos Reis, to beinstalled as Tupi Pilot project(currently en route to Brazil);
o Letter of intent with SBM/QueirozGalvão to construct 3rd Pilot. FPSOto operate in Tupi Nordeste.Capacity: 120 thous. bpd of oil and 5million cu.m p/day of natural gas.Delivery date: 34 months;
o Letter of intent to construct 8replicant FPSO hulls for definitivesystems Santos Basin, with Engevix.Capacity: 150 thous. bpd.
Iracema Norte
Piloto de
Tupi IG1Tupi
Sudoeste
Piloto de
Tupi P1Carioca
NE
Wells**:
** Drilling or completion or test.
PRE-SALT NEWS:Accelerating development activity
* Ocean Valor, Vitoria 10.000 and Sevan Driller.
7
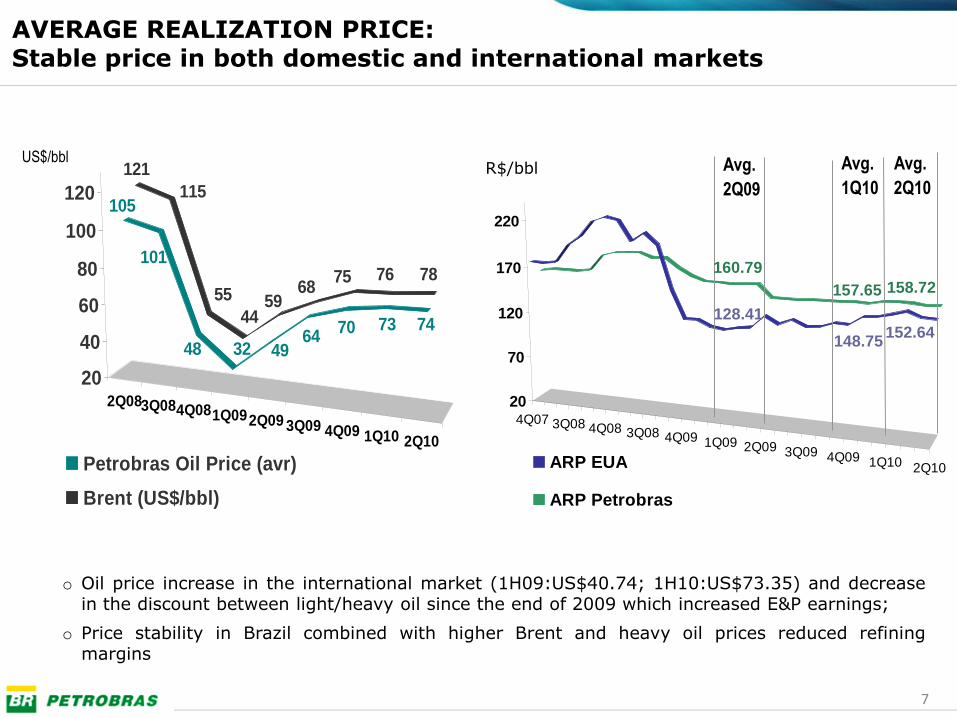
4Q07 3Q08 4Q08 3Q08 4Q09 1Q09 2Q09 3Q09 4Q09 1Q10 2Q10
20
70
120
170
220
ARP EUA
ARP Petrobras
R$/bbl
o Oil price increase in the international market (1H09:US$40.74; 1H10:US$73.35) and decreasein the discount between light/heavy oil since the end of 2009 which increased E&P earnings;
o Price stability in Brazil combined with higher Brent and heavy oil prices reduced refiningmargins
AVERAGE REALIZATION PRICE:Stable price in both domestic and international markets
2Q083Q084Q081Q092Q09 3Q09 4Q09 1Q10 2Q10
121
115
55
4459
6875 76 78
105
101
48 32 4964
70 73 74
20
40
60
80
100
120
Petrobras Oil Price (avr)
Brent (US$/bbl)
US$/bbl Avg.
2Q10
Avg.
2Q09
152.64128.41
160.79
158.72
Avg.
1Q10
157.65
148.75
8
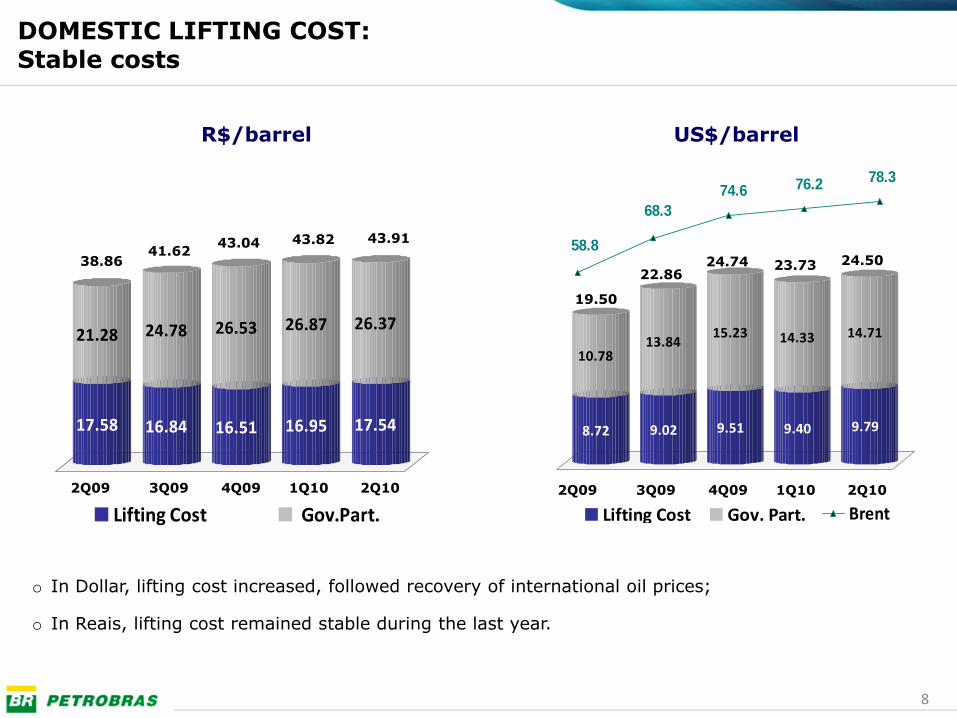
58.8
68.3
78.376.274.6
Brent
DOMESTIC LIFTING COST:Stable costs
R$/barrel US$/barrel
o In Dollar, lifting cost increased, followed recovery of international oil prices;
o In Reais, lifting cost remained stable during the last year.
19.50
22.8624.74 23.73 24.50
17.58
21.28
16.84
24.78
16.51
26.53
16.95
26.87
17.54
26.37
Lifting Cost Gov.Part.
2Q09 2Q101Q104Q093Q09 2Q09 2Q101Q104Q093Q09
8.72
10.78
9.02
13.84
9.51
15.23
9.40
14.33
9.79
14.71
Lifting Cost Gov. Part.
38.8641.62
43.04 43.82 43.91
9
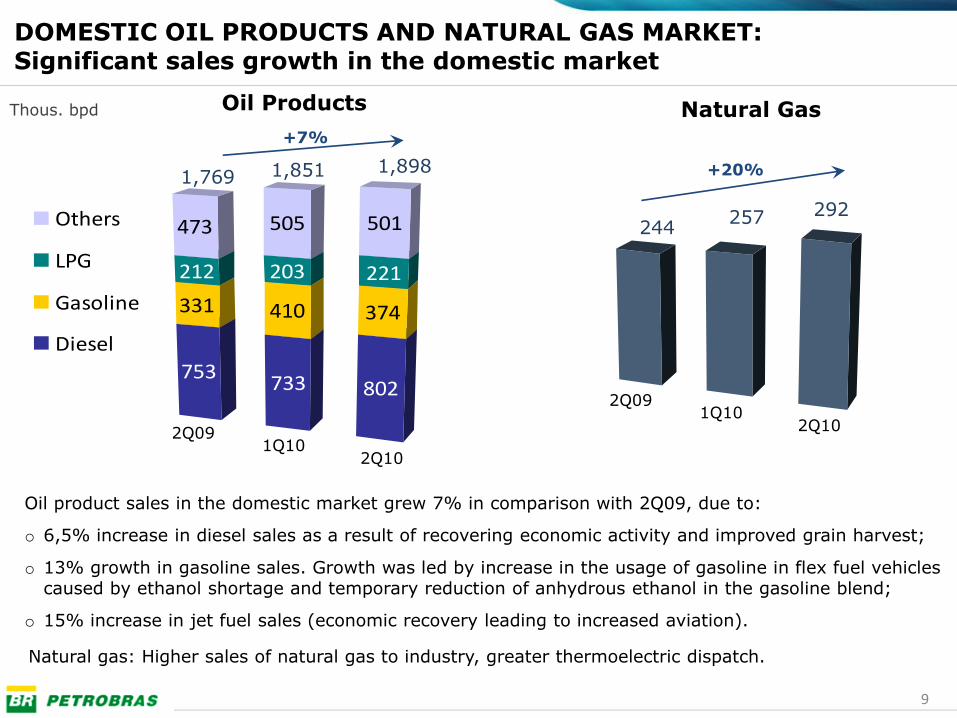
Oil product sales in the domestic market grew 7% in comparison with 2Q09, due to:
o 6,5% increase in diesel sales as a result of recovering economic activity and improved grain harvest;
o 13% growth in gasoline sales. Growth was led by increase in the usage of gasoline in flex fuel vehiclescaused by ethanol shortage and temporary reduction of anhydrous ethanol in the gasoline blend;
o 15% increase in jet fuel sales (economic recovery leading to increased aviation).
DOMESTIC OIL PRODUCTS AND NATURAL GAS MARKET:Significant sales growth in the domestic market
Oil Products Natural Gas
753
331
212
473
733
410
203
505
802
374
221
501Others
LPG
Gasoline
Diesel
1,8981,851
+7%
1,769
2Q09
2Q101Q10
+20%
257 292244
2Q09
2Q101Q10
Thous. bpd
Natural gas: Higher sales of natural gas to industry, greater thermoelectric dispatch.
10
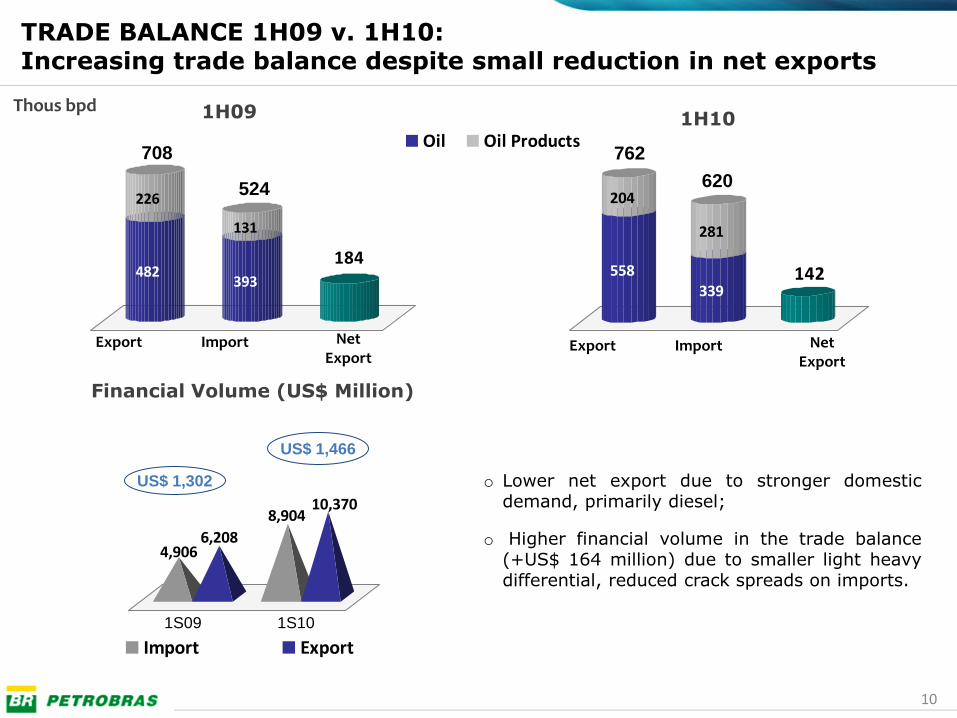
482
226
393
131
184
Oil Oil Products
1H09
Export Import Net Export
558
204
339
281
142
TRADE BALANCE 1H09 v. 1H10:Increasing trade balance despite small reduction in net exports
o Lower net export due to stronger domesticdemand, primarily diesel;
o Higher financial volume in the trade balance(+US$ 164 million) due to smaller light heavydifferential, reduced crack spreads on imports.
1H10
762
620524
708
Financial Volume (US$ Million)
Thous bpd
Export Import NetExport
1S09 1S10
4,9066,208
8,90410,370
Import Export
US$ 1,466
US$ 1,302
11
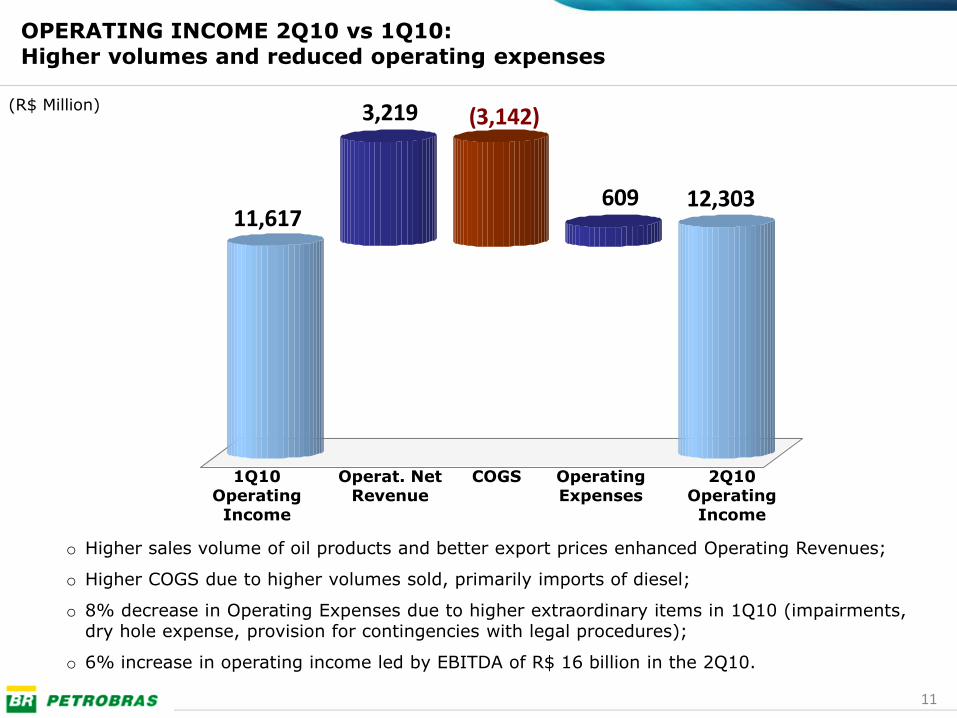
1Q10Operating Income
Operat. Net Revenue
COGS Operating Expenses
2Q10Operating Income
OPERATING INCOME 2Q10 vs 1Q10:Higher volumes and reduced operating expenses
o Higher sales volume of oil products and better export prices enhanced Operating Revenues;
o Higher COGS due to higher volumes sold, primarily imports of diesel;
o 8% decrease in Operating Expenses due to higher extraordinary items in 1Q10 (impairments,dry hole expense, provision for contingencies with legal procedures);
o 6% increase in operating income led by EBITDA of R$ 16 billion in the 2Q10.
(R$ Million)
11,617
3,219 (3,142)
609 12,303
12
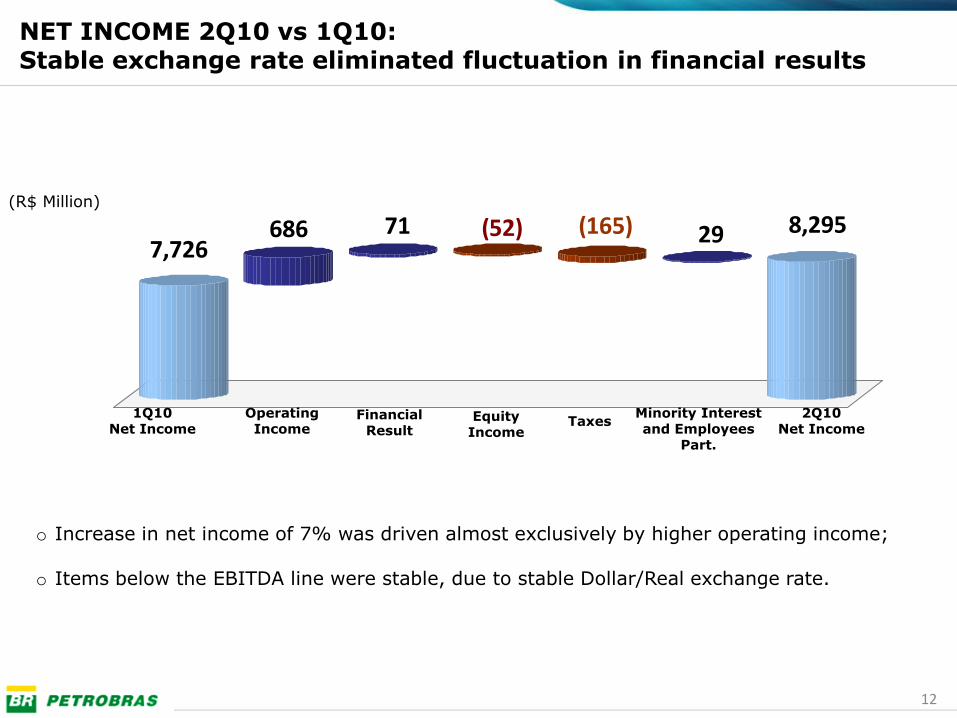
7,726686 71 (52) (165) 29 8,295
NET INCOME 2Q10 vs 1Q10: Stable exchange rate eliminated fluctuation in financial results
1Q10Net Income
Financial Result
TaxesEquity Income
Operating Income
2Q10Net Income
Minority Interest and Employees
Part.
(R$ Million)
o Increase in net income of 7% was driven almost exclusively by higher operating income;
o Items below the EBITDA line were stable, due to stable Dollar/Real exchange rate.
13
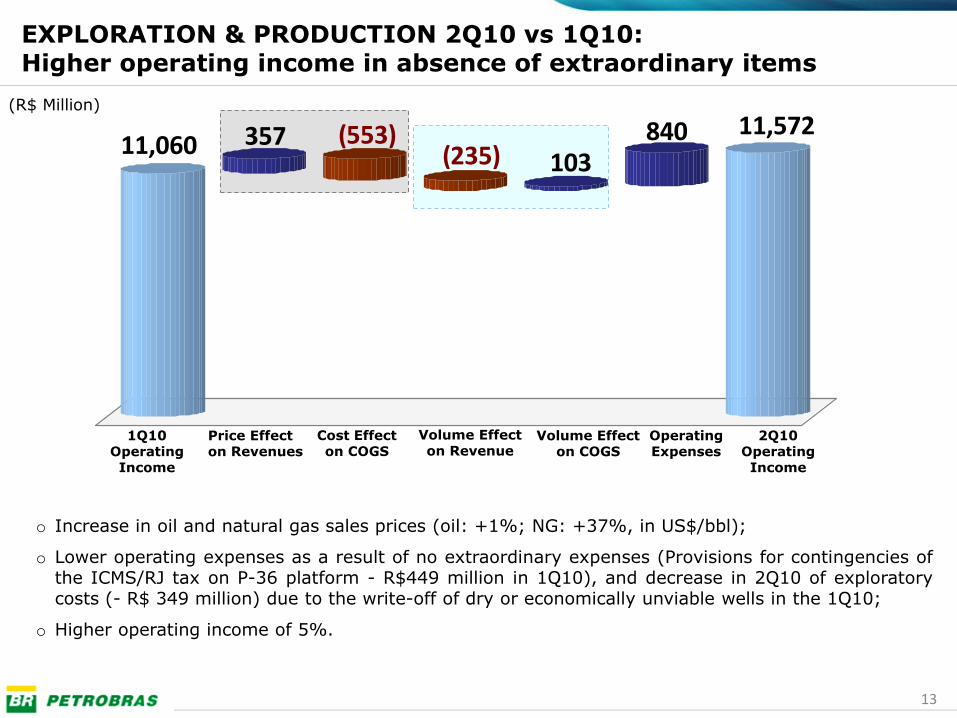
o Increase in oil and natural gas sales prices (oil: +1%; NG: +37%, in US$/bbl);
o Lower operating expenses as a result of no extraordinary expenses (Provisions for contingencies ofthe ICMS/RJ tax on P-36 platform - R$449 million in 1Q10), and decrease in 2Q10 of exploratorycosts (- R$ 349 million) due to the write-off of dry or economically unviable wells in the 1Q10;
o Higher operating income of 5%.
EXPLORATION & PRODUCTION 2Q10 vs 1Q10: Higher operating income in absence of extraordinary items
Cost Effecton COGS
Volume Effect on COGS
Operating Expenses
2Q10Operating Income
1Q10Operating Income
Volume Effect on Revenue
Price Effect on Revenues
(R$ Million)
11,060 357 (553)(235) 103
840 11,572
14
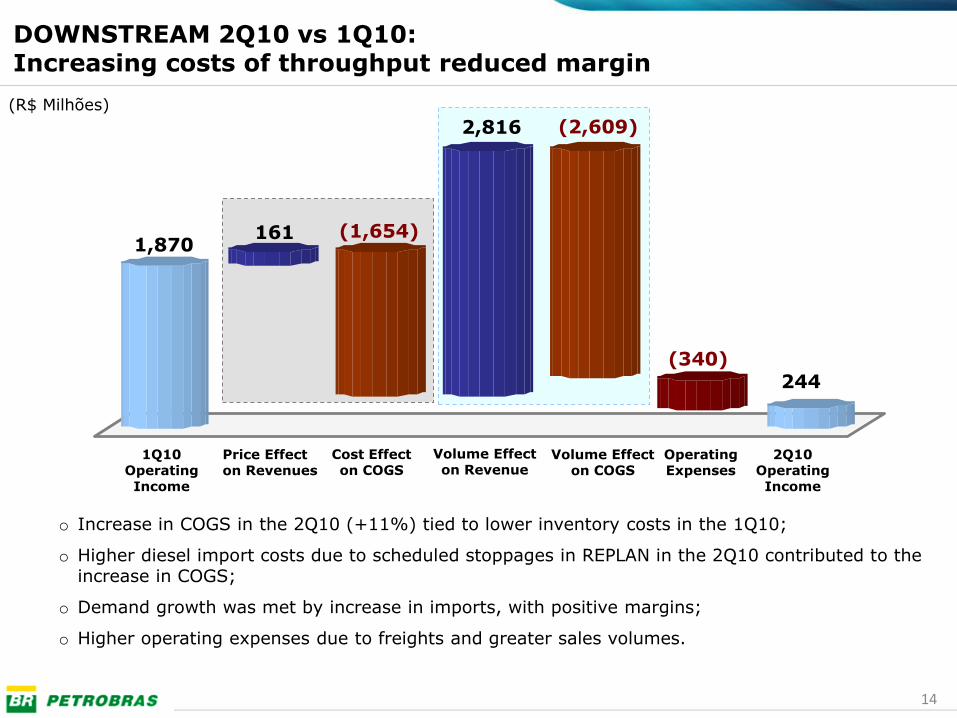
1,870
244(340)
(2,609)
(1,654)161
2,816
DOWNSTREAM 2Q10 vs 1Q10: Increasing costs of throughput reduced margin
(R$ Milhões)
Cost Effecton COGS
Volume Effect on COGS
Operating Expenses
2Q10Operating Income
1Q10Operating Income
Volume Effect on Revenue
Price Effect on Revenues
o Increase in COGS in the 2Q10 (+11%) tied to lower inventory costs in the 1Q10;
o Higher diesel import costs due to scheduled stoppages in REPLAN in the 2Q10 contributed to theincrease in COGS;
o Demand growth was met by increase in imports, with positive margins;
o Higher operating expenses due to freights and greater sales volumes.
15
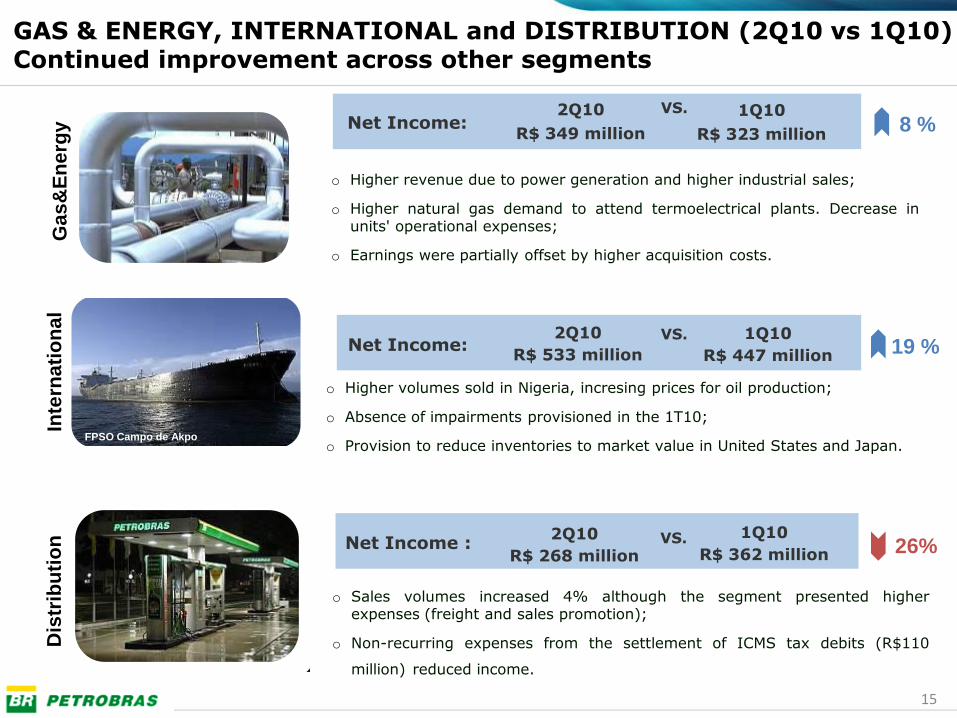
GAS & ENERGY, INTERNATIONAL and DISTRIBUTION (2Q10 vs 1Q10)Continued improvement across other segments
Net Income:2Q10
R$ 349 million
1Q10
R$ 323 million
VS.
Net Income:2Q10
R$ 533 million
1Q10
R$ 447 million
VS.
Net Income :2Q10
R$ 268 million
1Q10
R$ 362 millionVS.
FPSO Campo de Akpo
o Higher revenue due to power generation and higher industrial sales;
o Higher natural gas demand to attend termoelectrical plants. Decrease inunits' operational expenses;
o Earnings were partially offset by higher acquisition costs.
o Higher volumes sold in Nigeria, incresing prices for oil production;
o Absence of impairments provisioned in the 1T10;
o Provision to reduce inventories to market value in United States and Japan.
o Sales volumes increased 4% although the segment presented higherexpenses (freight and sales promotion);
o Non-recurring expenses from the settlement of ICMS tax debits (R$110
million) reduced income.
8 %
19 %
26%
Gas
&E
ne
rgy
Inte
rna
tio
na
lD
istr
ibu
tio
n
16
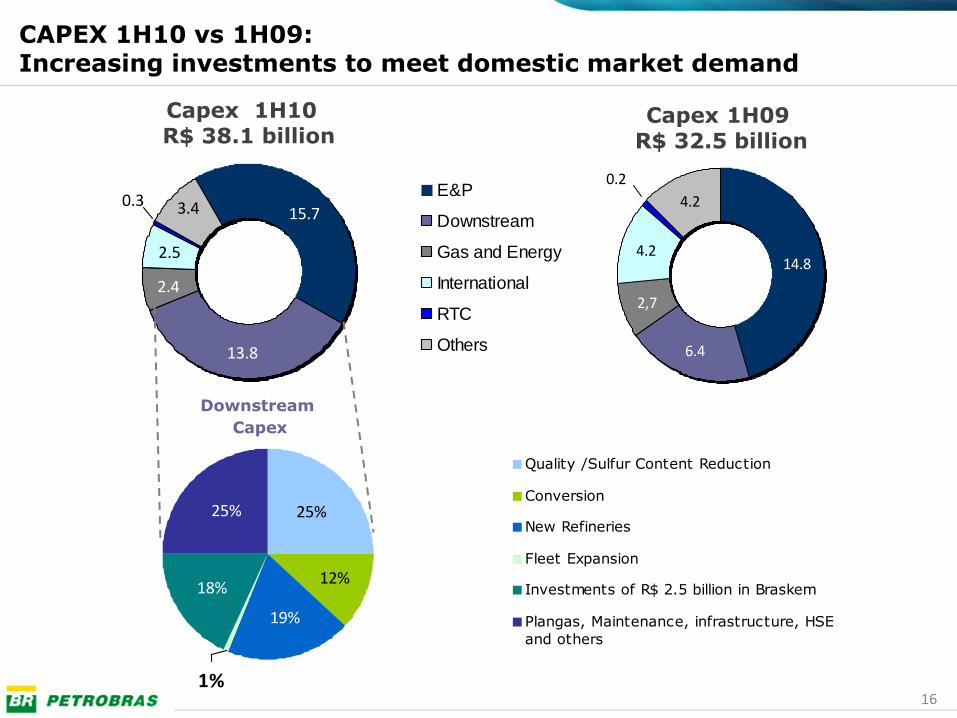
Capex 1H10 R$ 38.1 billion
5,6
6,1
24,710,1
0,05
1,3
1,1
3,8
CAPEX 1H10 vs 1H09:Increasing investments to meet domestic market demand
Capex 1H09R$ 32.5 billion
4.2
4.2
2,7
0.2
14.8
6.4
15.7
13.8
2.4
3.40.3
2.5
E&P
Downstream
Gas and Energy
International
RTC
Others
25%
18%
1%
25%
12%
19%
Quality /Sulfur Content Reduction
Conversion
New Refineries
Fleet Expansion
Investments of R$ 2.5 billion in Braskem
Plangas, Maintenance, infrastructure, HSE
and others
Downstream
Capex
17
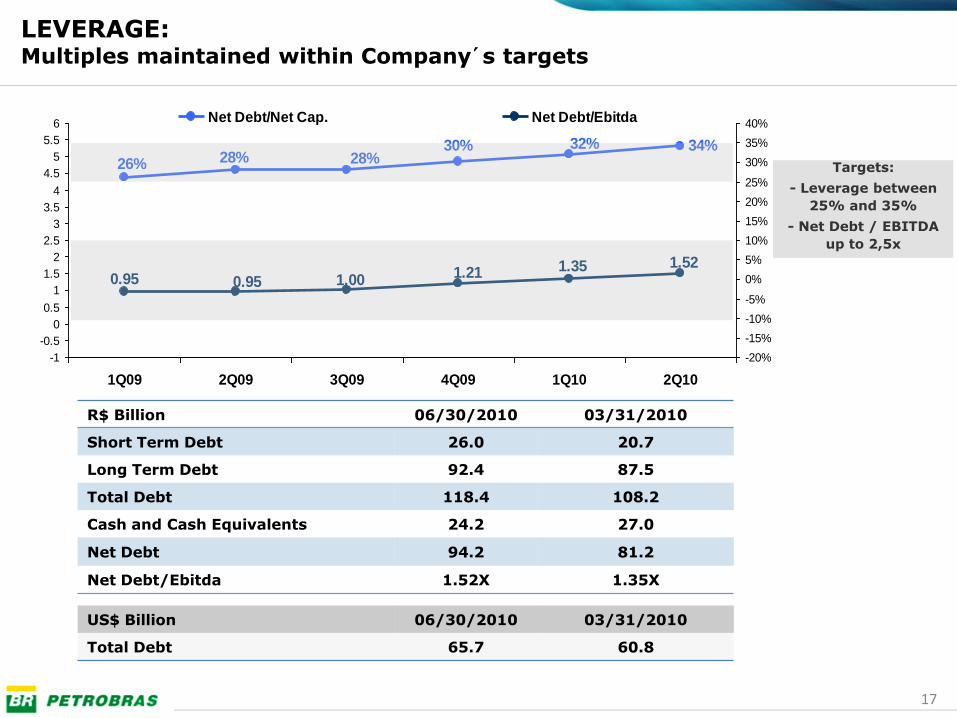
LEVERAGE:Multiples maintained within Company´s targets
R$ Billion 06/30/2010 03/31/2010
Short Term Debt 26.0 20.7
Long Term Debt 92.4 87.5
Total Debt 118.4 108.2
Cash and Cash Equivalents 24.2 27.0
Net Debt 94.2 81.2
Net Debt/Ebitda 1.52X 1.35X
US$ Billion 06/30/2010 03/31/2010
Total Debt 65.7 60.8
28%26% 28%30% 32% 34%
0.95 1.001.21 1.35 1.52
0.95
-1
-0.5
0
0.5
1
1.5
2
2.5
3
3.5
4
4.5
5
5.5
6
1Q09 2Q09 3Q09 4Q09 1Q10 2Q10
-20%
-15%
-10%
-5%
0%
5%
10%
15%
20%
25%
30%
35%
40%Net Debt/Net Cap. Net Debt/Ebitda
Targets:
- Leverage between
25% and 35%
- Net Debt / EBITDA
up to 2,5x
18
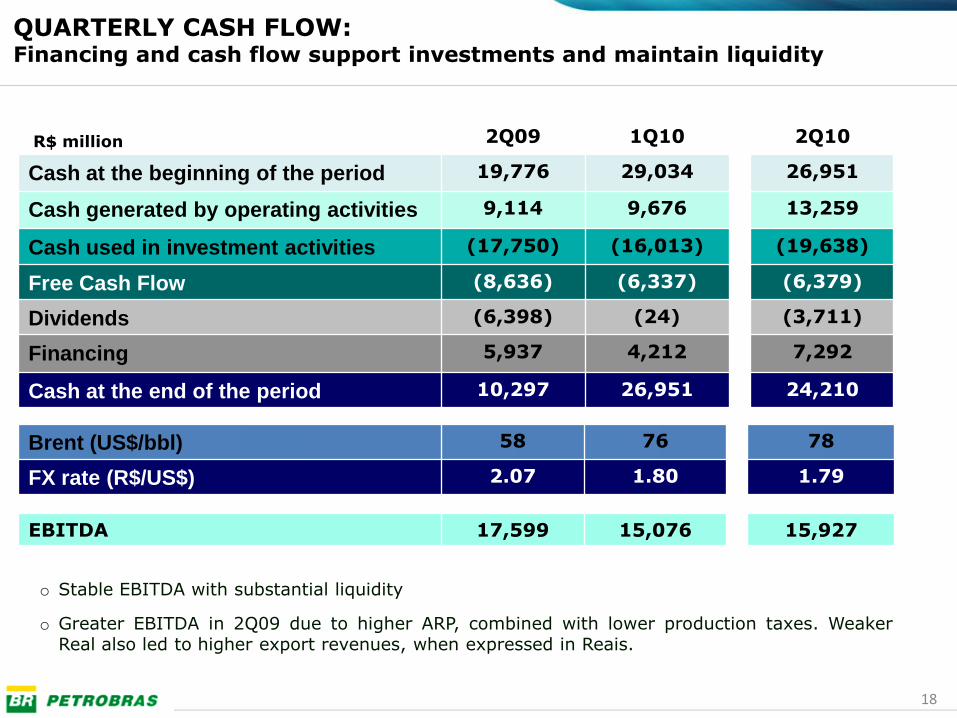
2Q09 1Q10 2Q10
Cash at the beginning of the period 19,776 29,034 26,951
Cash generated by operating activities 9,114 9,676 13,259
Cash used in investment activities (17,750) (16,013) (19,638)
Free Cash Flow (8,636) (6,337) (6,379)
Dividends (6,398) (24) (3,711)
Financing 5,937 4,212 7,292
Cash at the end of the period 10,297 26,951 24,210
R$ million
o Stable EBITDA with substantial liquidity
o Greater EBITDA in 2Q09 due to higher ARP, combined with lower production taxes. WeakerReal also led to higher export revenues, when expressed in Reais.
Brent (US$/bbl) 58 76 78
FX rate (R$/US$) 2.07 1.80 1.79
EBITDA 17,599 15,076 15,927
QUARTERLY CASH FLOW:Financing and cash flow support investments and maintain liquidity


![Deloitte IFRS 4 Phase II Webcast Feb2016.pptx [Read-Only] · Ø This is similar to the process adopted for the other major IFRS completed in the past two years (IFRS 9, IFRS 15 and](https://img.pdfslide.us/doc/110x75/5f0e77327e708231d43f6153/deloitte-ifrs-4-phase-ii-webcast-read-only-this-is-similar-to-the-process-adopted.jpg)


![Deloitte IFRS 4 Phase II Webcast Feb2016.pptx [Read-Only]...Ø IFRS 4 Phase II could be issued by the end of 2016 and it should become IFRS 17 Insurance Contracts Ø Deloitte commented](https://img.pdfslide.us/doc/110x75/60229b679783d838186f4f03/deloitte-ifrs-4-phase-ii-webcast-read-only-ifrs-4-phase-ii-could-be-issued.jpg)