Embed Size (px)
DESCRIPTION
This is the second edition of the Annual WASH Sector Performance Report. Like the first edition, the fundamental issue with non-harmonized M&E systems and indicators is still the main challenge (though anticipated) encountered in producing this report. This means that the Editorial Team once again had to resort to the annual reports from the sub-sector agencies - CWSA, GWCL and WRC - for most of the information. As the annual reports from these agencies are usually published between June and August, the team had to wait all that while before compiling and analyzing the information to produce this report, explaining the late publication.
Citation preview
Ministry of Water Resources, Works and Housing
Water and Sanitation Sector Performance Report
2010
2
Editorial Team
Emmanuel Addai (WSMP) Editorial Team Leader
Ben Yaw Ampomah (WRC) Water Resources Management
Ben Arthur (CONIWAS)
CSO Contribution
Michael Agyemang (GWCL)
Urban Water Supply
Attah Arhin (IWSPMF)
Member (Editing)
George Boakye Yiadom (CWSA) Rural and Small Town Water Supply
Enoch Ofosu (MWRWH)
Member (Editing)
Kweku Quansah (EHSD) Sanitation, Hygiene and School WASH
Patrick Apoya (Skyfox Ltd) Consultant (Data Collection)
3
Foreword
The Government of Ghana is determined to work towards a Ghana that is continuously better to live
in. Through this commitment, the Government is developing systems and structures that would
enable Ghanaians to experience progressively better living conditions in all sectors including the
provision of clean and safe water for all by 2025.
Over the years, lack of accurate data and information has hampered effective policy making as well
as effective decision-making in the area of water, sanitation and hygiene. It has been a challenge to
develop accurate statistics on water and sanitation in the country for several years. This challenge
has stemmed from the lack of standard definitions and indicators when dealing with our water and
sanitation programmes.
This second edition of the water and sanitation performance report is designed to consolidate the
gains made with the maiden edition last year in setting standards for better data collection, analysis
and proper implementation of programmes in the sector. Data quality and availability will lay the
foundation for creating a common monitoring system that would help resolve the existing problems.
The report makes it clear how the sector has underperformed due to lack of sufficient funding
resulting, partly, from the fact that approved budgets have usually not been fully released to the
relevant agencies for implementation. Though there was some improvement in budget releases in
2010 over the 2009 performance, government will sill pursue a stronger agenda in the years ahead
to ensure that the “Better Ghana” is indeed achieved through increased funding to the water and
sanitation sector.
It is my conviction that future editions of this report will deliver more comprehensive information on
functionality, gender and vulnerability, hygiene and sanitation as well as NGO participation in the
delivery of water and sanitation facilities to the people of Ghana. Though this edition provided some
information on these parameters, the Ministry will till work harder to obtain more in subsequent
editions.
I extend my sincere appreciation to the Water Directorate and the WSMP, our Development Partners,
NGOs, the Media and partners from the Private Sector and individuals who have made this issue a
success. I hope that we can continue to count on their support to realize universal access to potable
water by the year 2025. I also wish to particularly thank the EU and UNICEF for sponsoring the
production of the report.
Hon. Alban S. K. Bagbin (MP)
Minister for Water Resources,
Works and Housing
4
Acknowledgements
The Ministry of water Resources, Works and Housing, on behalf of the Government of Ghana, wishes
to acknowledge the contribution of some institutions and individuals to the production of this second
Ghana Water and Sanitation Sector Report.
The government acknowledges the role of the EU Water facility and UNICEF for funding this project.
Special mention also goes to the WASH Sector Group for mooting the idea of a sector report in 2008
as a requirement under the march towards a Sectorwide Approach (SWAp).
Again, the government wishes to commend the Community Water and Sanitation Agency, Ghana
Water Company Limited, the Water Resources Commission, the Environmental Health and Sanitation
Directorate (WHSD), and the Coalition of NGOs in Water and Sanitation (CONIWAS) for volunteering
most of the information that form the core of this report, as well as the Water and Sanitation
Monitoring Platform (WSMP), for coordinating the compilation and analyses of information and the
production of this report.
The following individuals deserve special mention for their special contribution to this work: Alban S.
K. Bagbin, (Minister for Water Resources, Works and Housing), Sumani Al-Hassan (Director, Water
Directorate) Minta A. Aboagye, (Former Director, Water Directorate), Yaw Asante Sarkodie, (Team
Leader, WSMP), Emmanuel Addai, (Communication Specialist, WSMP), Lovia Adu-Agyeman, (Office
Manager, WSMP), Enoch Ofosu, (Water Resources Specialist, Water Directorate), Attah Arhin,
(Project Manager, IWSPMF-WD), Michael Agyemang, (Director of Public Relations, GWCL), Ben
Ampomah, (Executive Secretary, WRC), George Boakye-Yiadom, (Investment Planner, CWSA),
Benjamin Arthur (Executive Secretary, CONIWAS), Kweku Quansah (Programme Officer, EHSD)
Benedict Kubabom (Director of Planning and Investments, CWSA), Jonas K. Jabulo (GWCL), Abraham
Otabil (PRO MWRWH), Patrick Apoya (SkyFox Ltd.) and Abraham Otabil (PRO, Ministry of Water
Resources, Works and Housing).
5
Table of Contents
Chapter 1: Historical Overview ....................................................................................... 18
1.1 Decline in Operational Efficiency of GWSC ............................................................................... 18
1.2 Interventions by to Improve Efficiency ...................................................................................... 19
1.3 Recent Water Sector Reforms ................................................................................................... 19
Chapter 2: Institutional and Policy Developments ........................................................ 21
2.1 The Ghana Shared Growth and Development Framework ....................................................... 21
2.2 Strategic Sector Development Plan ........................................................................................... 21
2.3 Other Water Related Strategies and Plans ................................................................................ 21
2.4 Environmental Sanitation Policy, Strategies and Plans ............................................................ 22
2.5 National School Health Education Policy ................................................................................... 22
2.6 Institutional Developments ......................................................................................................... 23
Chapter 3: Sector Coordination ...................................................................................... 24
3.1 SWAp ............................................................................................................................................ 24
3.2 National Environmental Sanitation Policy Coordinating Council (NESPoCC) .......................... 26
3.3 The Sector Working Group .......................................................................................................... 26
Chapter 4: Water Resources Management ................................................................... 27
4.1 Overview of Ghana‟s water resources ...................................................................................... 27
4.2 Water Resources Monitoring and Assessment ........................................................................ 29
4.3 Water Resources Planning and Regulation .............................................................................. 31
4.4 River Basin Management and Planning ................................................................................... 33
4.5 Transboundary Water Resources Management ...................................................................... 34
4.6 Climate Change Adaptation ....................................................................................................... 36
Chapter 5: Sector Performance against MDG Targets ................................................. 37
5.1 Ghana‟s MDG Progress on WASH as at 2010 ......................................................................... 37
5.2 The „Time Factor‟ in MDG Reporting ......................................................................................... 38
Chapter 6: Urban Water Supply ...................................................................................... 39
6
6.1 Urban Water Coverage .............................................................................................................. 39
6.2 Regional Trends in Water Coverage .......................................................................................... 40
6.3 Coverage and Pro-Poor Issues .................................................................................................. 41
6.4 Water Supply Infrastructure and Sources ................................................................................ 41
6.5 Peri Urban and Low Income Urban Communities .................................................................... 42
6.6 Water Quality .............................................................................................................................. 43
6.7 Quality of Service ....................................................................................................................... 43
6.8 Efficiency .................................................................................................................................... 44
6.9 Status of the GWCL/AVRL Management Contract ................................................................... 46
Chapter 7: Rural and Small Town Water Supply ........................................................... 47
7.1 Access to improved drinking water sources (Regional/national) ........................................... 47
7.2 Facility Delivery Status ............................................................................................................... 49
7.3 Functionality of Rural Water Supply Systems .......................................................................... 49
7.4 Information on self supply in rural & small town water supply ............................................... 50
Chapter 8: Sanitation ...................................................................................................... 51
8.1 Access to Improved Household Toilet Facilities – provider-based data ................................. 51
8.2 Access to Improved Household Toilet Facilities – user-based data ....................................... 51
8.3 Sanitation Facility Delivery in 2010 .......................................................................................... 52
Chapter 9: Hygiene .......................................................................................................... 54
9.1 Access to Household Handwashing Facilities .......................................................................... 54
9.2 Handwashing Promotion Activities............................................................................................ 54
9.3 Household Water Treatment and Storage (HWTS) .................................................................. 55
9.4 Capacity Development for Hygiene Promotion ......................................................................... 55
9.5 Scaling up CLTS in communities ............................................................................................... 56
9.6 ODF Community Awards ............................................................................................................ 58
Chapter 10: WASH in Schools ........................................................................................ 59
10.1 State of WASH in Schools - National ..................................................................................... 59
10.2 State of WASH in Schools – Regional Breakdown ............................................................... 59
7
10.3 School WASH Activities Implemented in 2010 .................................................................... 61
Chapter 11: WASH Sector Financing .............................................................................. 62
11.1 WASH Sector Share of GDP ................................................................................................... 62
11.2 WASH Sector Allocations against the National Budget ....................................................... 62
11.3 GoG versus Donor Contributions to WASH Sector ............................................................... 63
11.4 WASH Sector Agency Budget Performance 2010 ................................................................ 64
11.5 The Sanitation and Water for ALL Compact ........................................................................ 67
Chapter 12: Contribution from Non-State Actors .......................................................... 69
12.1 Water and Sanitation Facility Delivery .................................................................................. 69
12.2 Other Activities by CONIWAS ................................................................................................. 70
12.3 Private Contribution ............................................................................................................... 71
Chapter 13: Sector M&E and Reporting ........................................................................ 72
13.1 Current M&E practices ........................................................................................................... 72
13.2 Data storage and Retrieval .................................................................................................... 73
13.3 Towards a Coordinated M&E Approach ................................................................................ 73
13.4 Use of WASH Sector Survey Reports ..................................................................................... 73
Chapter 14: Conclusions and Recommendations ........................................................ 75
14.1 Institutional and policy developments .................................................................................. 75
14.2 Water Resources Management............................................................................................. 75
14.3 Access to Urban Water Supply .............................................................................................. 75
14.4 Access to Rural and Small town Water Supply .................................................................... 76
14.5 Sanitation and Hygiene .......................................................................................................... 76
14.6 Sector Financing .................................................................................................................... 76
14.7 Harmonization of M&E processes ......................................................................................... 76
Annexes ............................................................................................................................ 78
8
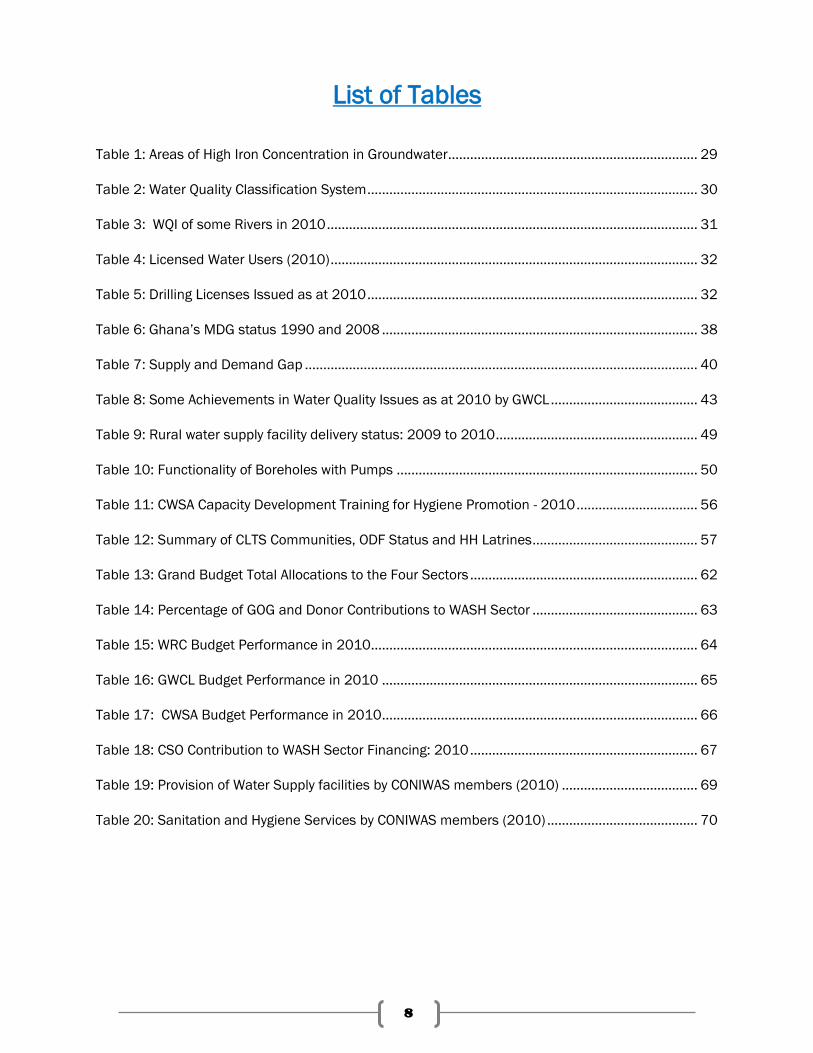
List of Tables
Table 1: Areas of High Iron Concentration in Groundwater .................................................................... 29
Table 2: Water Quality Classification System .......................................................................................... 30
Table 3: WQI of some Rivers in 2010 ..................................................................................................... 31
Table 4: Licensed Water Users (2010) .................................................................................................... 32
Table 5: Drilling Licenses Issued as at 2010 .......................................................................................... 32
Table 6: Ghana‟s MDG status 1990 and 2008 ...................................................................................... 38
Table 7: Supply and Demand Gap ........................................................................................................... 40
Table 8: Some Achievements in Water Quality Issues as at 2010 by GWCL ........................................ 43
Table 9: Rural water supply facility delivery status: 2009 to 2010 ....................................................... 49
Table 10: Functionality of Boreholes with Pumps .................................................................................. 50
Table 11: CWSA Capacity Development Training for Hygiene Promotion - 2010 ................................. 56
Table 12: Summary of CLTS Communities, ODF Status and HH Latrines ............................................. 57
Table 13: Grand Budget Total Allocations to the Four Sectors .............................................................. 62
Table 14: Percentage of GOG and Donor Contributions to WASH Sector ............................................. 63
Table 15: WRC Budget Performance in 2010 ......................................................................................... 64
Table 16: GWCL Budget Performance in 2010 ...................................................................................... 65
Table 17: CWSA Budget Performance in 2010 ...................................................................................... 66
Table 18: CSO Contribution to WASH Sector Financing: 2010 .............................................................. 67
Table 19: Provision of Water Supply facilities by CONIWAS members (2010) ..................................... 69
Table 20: Sanitation and Hygiene Services by CONIWAS members (2010) ......................................... 70
9
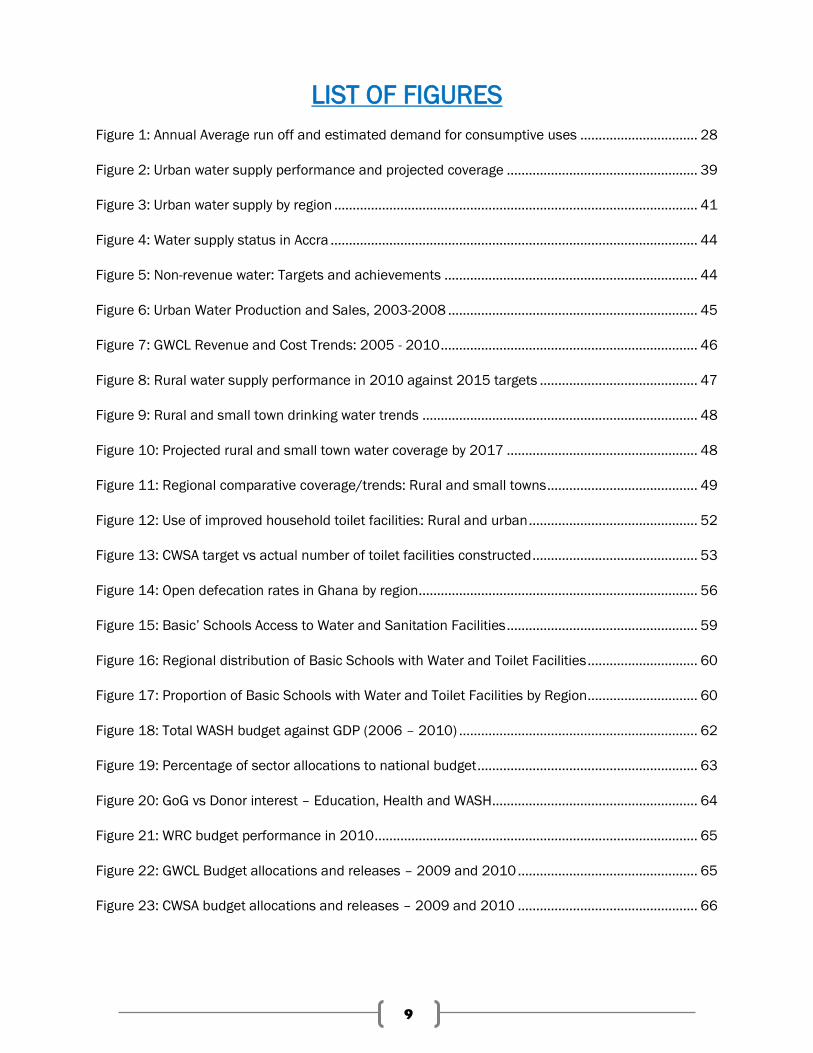
LIST OF FIGURES
Figure 1: Annual Average run off and estimated demand for consumptive uses ................................ 28
Figure 2: Urban water supply performance and projected coverage .................................................... 39
Figure 3: Urban water supply by region ................................................................................................... 41
Figure 4: Water supply status in Accra .................................................................................................... 44
Figure 5: Non-revenue water: Targets and achievements ..................................................................... 44
Figure 6: Urban Water Production and Sales, 2003-2008 .................................................................... 45
Figure 7: GWCL Revenue and Cost Trends: 2005 - 2010 ...................................................................... 46
Figure 8: Rural water supply performance in 2010 against 2015 targets ........................................... 47
Figure 9: Rural and small town drinking water trends ........................................................................... 48
Figure 10: Projected rural and small town water coverage by 2017 .................................................... 48
Figure 11: Regional comparative coverage/trends: Rural and small towns ......................................... 49
Figure 12: Use of improved household toilet facilities: Rural and urban .............................................. 52
Figure 13: CWSA target vs actual number of toilet facilities constructed ............................................. 53
Figure 14: Open defecation rates in Ghana by region ............................................................................ 56
Figure 15: Basic‟ Schools Access to Water and Sanitation Facilities .................................................... 59
Figure 16: Regional distribution of Basic Schools with Water and Toilet Facilities .............................. 60
Figure 17: Proportion of Basic Schools with Water and Toilet Facilities by Region .............................. 60
Figure 18: Total WASH budget against GDP (2006 – 2010) ................................................................. 62
Figure 19: Percentage of sector allocations to national budget ............................................................ 63
Figure 20: GoG vs Donor interest – Education, Health and WASH ........................................................ 64
Figure 21: WRC budget performance in 2010 ........................................................................................ 65
Figure 22: GWCL Budget allocations and releases – 2009 and 2010 ................................................. 65
Figure 23: CWSA budget allocations and releases – 2009 and 2010 ................................................. 66
10
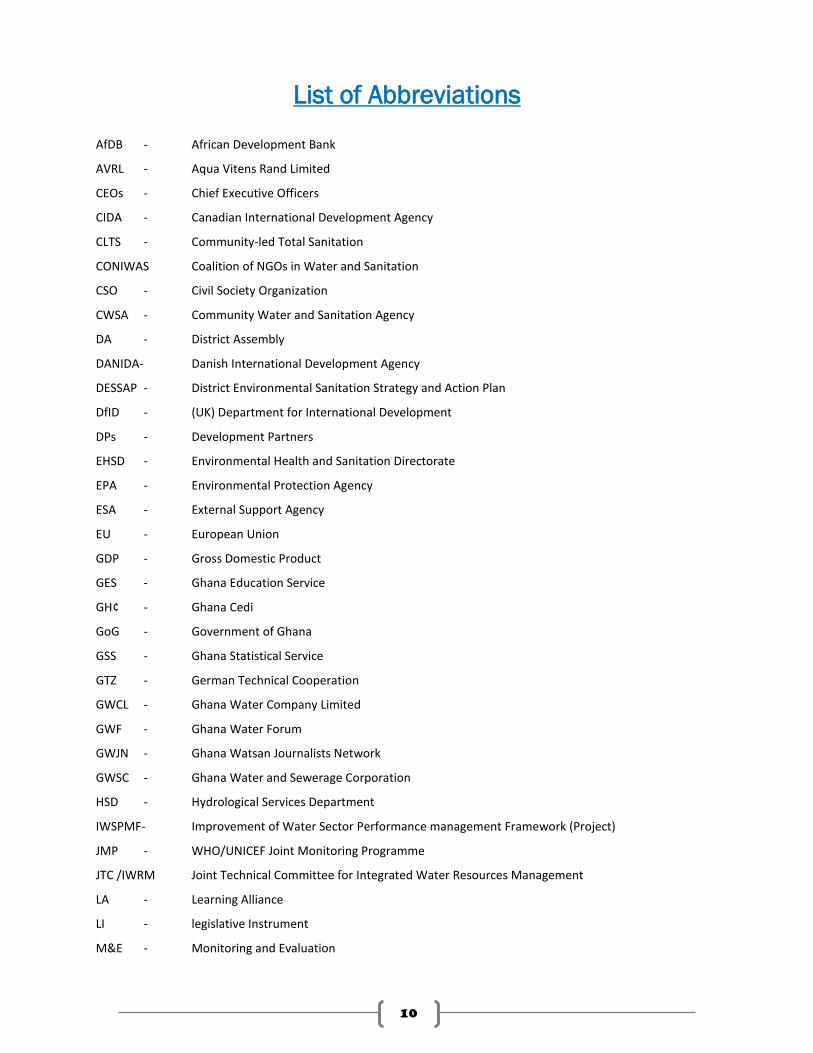
List of Abbreviations
AfDB - African Development Bank
AVRL - Aqua Vitens Rand Limited
CEOs - Chief Executive Officers
CIDA - Canadian International Development Agency
CLTS - Community-led Total Sanitation
CONIWAS Coalition of NGOs in Water and Sanitation
CSO - Civil Society Organization
CWSA - Community Water and Sanitation Agency
DA - District Assembly
DANIDA- Danish International Development Agency
DESSAP - District Environmental Sanitation Strategy and Action Plan
DfID - (UK) Department for International Development
DPs - Development Partners
EHSD - Environmental Health and Sanitation Directorate
EPA - Environmental Protection Agency
ESA - External Support Agency
EU - European Union
GDP - Gross Domestic Product
GES - Ghana Education Service
GH¢ - Ghana Cedi
GoG - Government of Ghana
GSS - Ghana Statistical Service
GTZ - German Technical Cooperation
GWCL - Ghana Water Company Limited
GWF - Ghana Water Forum
GWJN - Ghana Watsan Journalists Network
GWSC - Ghana Water and Sewerage Corporation
HSD - Hydrological Services Department
IWSPMF- Improvement of Water Sector Performance management Framework (Project)
JMP - WHO/UNICEF Joint Monitoring Programme
JTC /IWRM Joint Technical Committee for Integrated Water Resources Management
LA - Learning Alliance
LI - legislative Instrument
M&E - Monitoring and Evaluation
11
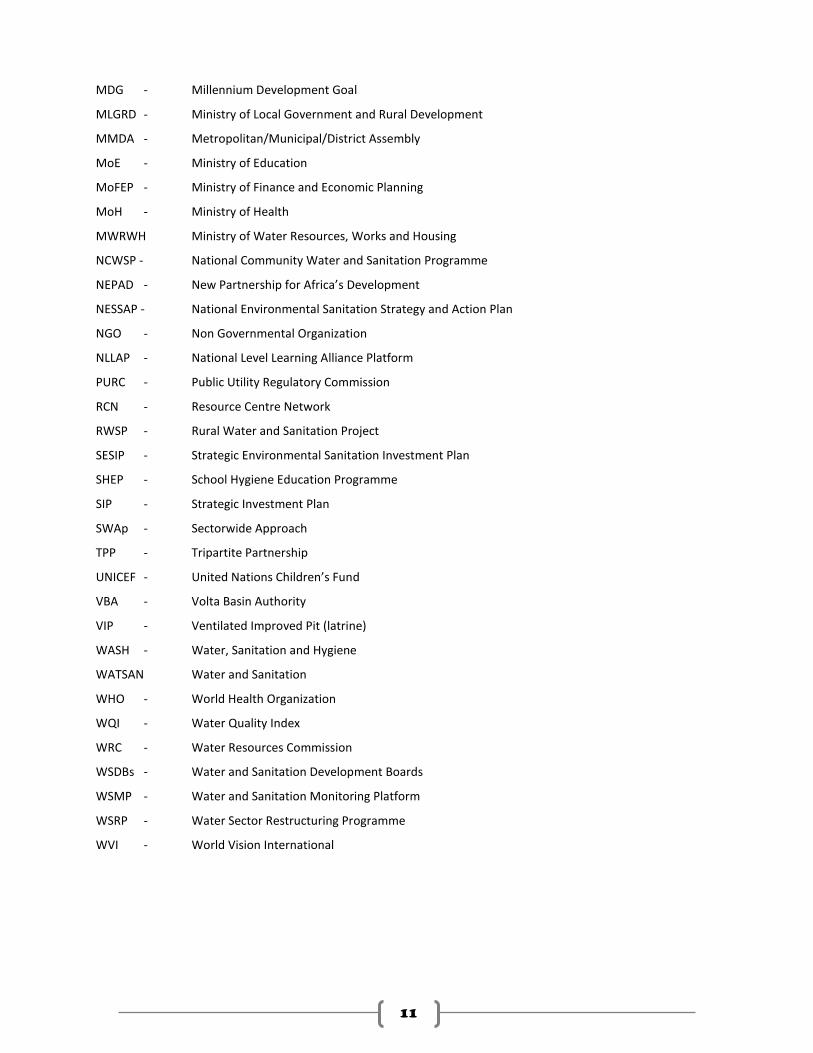
MDG - Millennium Development Goal
MLGRD - Ministry of Local Government and Rural Development
MMDA - Metropolitan/Municipal/District Assembly
MoE - Ministry of Education
MoFEP - Ministry of Finance and Economic Planning
MoH - Ministry of Health
MWRWH Ministry of Water Resources, Works and Housing
NCWSP - National Community Water and Sanitation Programme
NEPAD - New Partnership for Africa’s Development
NESSAP - National Environmental Sanitation Strategy and Action Plan
NGO - Non Governmental Organization
NLLAP - National Level Learning Alliance Platform
PURC - Public Utility Regulatory Commission
RCN - Resource Centre Network
RWSP - Rural Water and Sanitation Project
SESIP - Strategic Environmental Sanitation Investment Plan
SHEP - School Hygiene Education Programme
SIP - Strategic Investment Plan
SWAp - Sectorwide Approach
TPP - Tripartite Partnership
UNICEF - United Nations Children’s Fund
VBA - Volta Basin Authority
VIP - Ventilated Improved Pit (latrine)
WASH - Water, Sanitation and Hygiene
WATSAN Water and Sanitation
WHO - World Health Organization
WQI - Water Quality Index
WRC - Water Resources Commission
WSDBs - Water and Sanitation Development Boards
WSMP - Water and Sanitation Monitoring Platform
WSRP - Water Sector Restructuring Programme
WVI - World Vision International
12
Executive Summary
This is the second edition of the Annual WASH Sector Performance Report. Like the first edition, the
fundamental issue with non-harmonized M&E systems and indicators is still the main challenge
(though anticipated) encountered in producing this report. This means that the Editorial Team once
again had to resort to the annual reports from the sub-sector agencies - CWSA, GWCL and WRC - for
most of the information. As the annual reports from these agencies are usually published between
June and August, the team had to wait all that while before compiling and analyzing the information
to produce this report, explaining the late publication.
Institutional and Policy Developments
The preparation of a Strategic Sector Development Plan (SSDP) for the WASH sector was initiated
towards the last quarter of 2010. The SSDP is a consolidation of the separate sub sector investment
plans and strategies into a single harmonized sector plan. These plans include the Strategic
Investment Plans (SIP) of the CWSA and GWCL and a strategic plan is being developed for the WRC.
The National Environmental Sanitation Strategy and Action Plan (NESSAP) of the MLGRD will also be
incorporated into the SSDP with the exception of the urban sanitation component. The SSDP will
effectively address the absence of a common sector-wide coordination framework covering the
different components of the sector and serve as the basis for implementing the Sector Wide
Approach (SWAp) for the WASH sector. Completion of the SSDP is a trigger under the Multi-Donor
Budget Support (MDBS) framework. The SSDP is expected to be completed by December 2011.
Progress was made in the development of key sector policy and strategic instruments including the
following:
The Integrated Water Resources Management (IWRM) Strategic Plan was initiated and ongoing;
The Buffer Zone Policy was completed;
The sector also made progress in the development of key policy and strategic instruments including
the following:
A Revised National Environmental Sanitation Policy, which was finalized and launched;
National Environmental Sanitation Strategy and Action Plan (NESSAP), which was completed;
District Environmental Sanitation Strategy and Action Plans (DESSAP), which were completed by
every district and in operation;
Strategic Environmental Sanitation Investment Plan (SESIP), completed but pending cabinet and
parliamentary approval;
A Rural Sanitation Model and Strategy was also developed.
CLTS was also endorsed as the rural sanitation model during the year.
A National School Health Education Policy (SHEP) was completed in 2010 to provide a holistic
approach to the implementation of School Health interventions and streamline the various policies
and activities of all agencies, departments, NGOs, and individuals who offer School Health services.
Water Resources
The total annual runoff is 56.4 billion m3 with the Volta River accounting for 41.6 billion m3. The
mean annual runoff from Ghana alone is about 40 billion m3. The Volta, Southwestern and Coastal
systems contribute 65%, 29% and 6%, respectively, of this runoff. However, the runoffs are
characterized by wide disparities between the wet season and dry season flows. The total amount of
groundwater available in the country is yet to be determined.
13
The main consumptive uses of water in Ghana are drinking water supply, irrigation, livestock
watering, and industrial supply. On the basis of surface water resources alone, the consumptive
water demand for 2010 was estimated at 3.0 billion m3, which is equivalent to about 7.4% of the
annual run off from Ghana alone.
The quality of water resources, which hitherto was fairly good, has in very recent years been showing
signs of gradual deterioration. Water pollution of varying degrees is prevalent in almost all the river
basins of Ghana but is more pronounced in urbanized river basins like the Densu and in areas where
mining activities take place especially, in the Pra, Ankobra, and Birim basins. The water quality
monitoring and assessment program started in 2005 in the Southwestern and Coastal River
Systems, with nineteen 19 stations. In 2010 the number of monitoring stations was increased to 40
to include the Volta River System and now covers the whole country.
Urban Water Supply
Urban water supply coverage improved from 59% in 2009 to 64% in 2010. However, even with this
positive improvement, a similar trend will only help the sub-sector to achieve only 72% by 2015
instead of the 85% national target. There was a total shortfall of 388,576.39m3. The Upper West
Region continued to be the least served as more than 88% of the urban population in the region still
does not have access to improved drinking water sources, while the Western Region moved to the
top with almost 77% of the population covered. Non-revenue water as at 2010 was 49.3% as against
the 2010 target of 25%. A technical audit of the operations of AVRL was concluded by a team of
consultants in 2010 and the findings, generally indicating low performance based on the terms in
the contract, were shared with key stakeholders.
Rural Water Supply
The national Rural and Small Town drinking water supply coverage target for 2015 is 76%. Coverage
as at 2010 was about 62%, an encouraging increase from about 59% in 2009 (expected coverage
for 2010 was 63%). This, however, leaves 38% of the Rural and Small Town Population without
access to safe drinking water. The Upper West Region continued to lead in rural and small town
water supply, improving slightly from 76.34% in 2009 to 76.94% in 2010, while the Western Region
remained at the bottom at 52.45%. Only three regions, Upper West, Ashanti and Volta, performed
above the national average of (61.74%); all the rest performed below the national average.
Sanitation
Provider-based data on sanitation was still unavailable in 2010. The only type of data often used
during the year was from the 2008 GDHS and JMP reports. Available user based data on sanitation
therefore still indicates 13% nationally as the proportion of the population using improved sanitation
facilities (18% urban and 7% rural (2008). In terms of supply of toilet facilities in 2010, the CWSA
facilitated the construction of 5,384 toilets comprising 3,660 household VIP latrines, 1,430
household KVIP latrines and 294 institutional latrines nationwide.
Hygiene
No statistical data on hygiene for 2010 is available. However, there was evidence on a number of
hygiene-related activities carried out by the CWSA, EHSD and SHEP. The MLGRD also endorsed CLTS
as the rural sanitation model. As at 31st December 2009, there were 308 CLTS communities out of
which 69 had been declared open defecation-free (ODF). The latest user-based data on household
water treatment and storage was reported in the GDHS 2008. According to the report, about 8.7% of
the population practised appropriate household water treatment methods. In 2010, a Household
14
Water Treatment and Safe Storage (HWTS) strategy was developed by sector agencies under the
leadership of the Ministry of Local Government and Rural Development/ Environmental Health and
Sanitation Directorate. The strategy gives direction to how water can be kept safe throughout the
water chain of fetching-transportation-storage-usage.
WASH in Schools
Out of a total of 11,140 basic schools throughout the country, 5,360, representing 48%, had toilet
facilities and 7,075, representing 63.5%, had water facilities attached to them. This means that as
at 2009, there were 5,780 basic schools without toilet facilities and 4,065 basic schools without
water facilities. Data for 2010 was not available for this report. While the Western Region had the
highest coverage for water facilities, with 79% of basic schools in the region having access, it had the
lowest for toilet facilities with only 33% of basic schools having access. The Greater Accra Region
was highest for toilet facilities with 74% percent of basic schools in the region having access. The
Upper West Region had the lowest coverage figures for water (46%).
WASH Sector Financing
Government allocations to the WASH Sector since 2006 have consistently fallen below 2% of annual
Gross Domestic Product (GDP). It has also shown a downward trend, having dropped from 1.52% in
2006 to 0.52% in 2010. As MWRWH and MLGRD received 2.7% and 3.55% respectively of the total
national budget in 2010, the Ministry of Health alone received more than 11%, while the Ministry of
Education received 26%. Release of GoG allocated budgets to sector agencies, however, improved
tremendously as the WRC received 77% (3.2% in 2009), CWSA received about 87% (about 10% in
2009) and the GWCL received about 269% (23% in 2009) of allocated budget. CSO contribution to
sector financing is still not yet known as information in 2010 was inadequate.
Conclusions and Recommendations
The current institutional arrangements for the WASH Sector have been tested for some time now.
It might be useful to undertake thorough assessments on these arrangements and make some
reviews where necessary.
The capacity building package in the 2010 SWA Compact for the Water Directorate and the
Environmental Health and Sanitation Directorates must be fulfilled as a matter of urgency since
the two Directorates are woefully understaffed and ill-equipped to take on the huge task of
coordinating all WASH Sector strategic directions for government ownership in a SWAp
environment.
Since ground water sources are so vital and are a preferred choice especially for rural water
supply, it would be useful for the country to know how much of it is available.
Urban water management is also still a major issue since evaluation of AVRL‟s performance has
indicated failures in many areas. It is therefore recommended that the value addition of the AVRL
Management Contract be critically evaluated so that a more efficient model may be found.
For the sake of sustainability of rural and small town water supply facilities, the current
Community Ownership and Management model should be evaluated and possibly reviewed.
Since the Community-led Total Sanitation approach has been adopted, all stakeholders are
encouraged to embrace it and support its implementation.
15
The WASH sector is still not adequately funded. It is recommended that the commitments in the
2010 Ghana Compact be fulfilled.
This report has again been produced without a harmonized M&E framework. It has been
suggested that the development of a Strategic Sector Development Plan (SSDP) should include a
sectorwide M&E plan and framework. It is therefore expected that by the time the SSDP is ready,
the sector would have harmonized M&E processes.
It is commendable that CSOs began to track their contribution to the WASH sector and submitted
for publication in this report. It is hoped that more information will be made available for
subsequent reports.
16
Introduction This WASH sector report aims to assemble all sector progress information in one document and
make it available to government, development partners, the media, the public, and all key decision-
makers in the sector. The intention is to publish the status of the sector annually to help track
achievements against set targets and support effective decision-making and policy formulation.
The Water, Sanitation and Hygiene (WASH) Sector of Ghana has come a long way in terms of
institutional arrangement and policy environment especially since the early 1990s.
The development of the National Community Water and Sanitation Programme and the subsequent
creation of the Community Water and Sanitation Agency, the establishment of the Water Resources
Commission, the Ghana Water Company Limited, the creation of a Water Directorate and an
Environmental Health and Sanitation Directorate, as well as the formation of the Coalition of NGOs in
Water and Sanitation, have all tremendously promoted and facilitated coordination in the sector.
In addition to all these wonderful institutional arrangements, coupled with the need for better aid as
directed by the Paris Declaration and the Accra Agenda for Action, the Government of Ghana has
collaborated effectively with her development partners to work towards a sectorwide approach
(SWAp), where there will be a move-away from the current project-driven and less coordinated
approach to working within a more coherent national plan to minimize the incidence of improper
allocation of scarce resources.
Over the years, it has always been difficult or even impossible to obtain a harmonized set of data or
information for a national level decision-making. Last year, the Ministry of Water Resources, Works
and Housing, in an attempt to harmonize WASH sector information to respond to this challenge,
produced the first WASH Sector Performance Report with coordination by the Water and Sanitation
Monitoring Platform. The strategy was to compile all agency level annual reports and other relevant
reports. This was because there was no sector M&E plan and framework to guide the production of
an independent sector report.
This is the second edition; while there is no significant change in the sector M&E environment, we
have had to apply the same methodology as that of last year (though the parameters have been
widened slightly this time round), as we wait for the completion of the sectorwide M&E plan and
framework with an agreed set of sectorwide harmonized indicators.
As expected, some of the core indicators whose status many stakeholders would love to know still
have virtually no records on them simply because it has not been the tradition to keep such records.
For instance it was still difficult for the team to assemble data on functionality of systems, gender
and vulnerability, NGO contribution in terms of facility delivery, advocacy and sector funding.
Information on District Assemblies‟ direct investment in the WASH sector is also still missing.
The production of this report, nonetheless, offers some hope as it brings on board, some information
on hygiene, sanitation and school sanitation, all of which were missing in the 2009 edition. We still
hope that as subsequent editions are published and information gaps are exposed, all appropriate
institutions will be challenged to improve on documentation. At the ministry level, the first major
action is to fast track the development of the national level M&E Framework in order to facilitate the
production of this report and sector monitoring as a whole.
17
This report has been grouped under fourteen chapters; chapters one to three provide information on
historical overview of Ghana‟s Water and Sanitation Sector, institutional developments and sector
coordination. Chapter four to seven provide performance information on water resources
management, urban, rural and small town water supply in 2010 with some comparisons between
2009 and 2010. Chapters eight, nine and ten provide performance information on sector
performance on sanitation, hygiene and school WASH in 2010. Chapter eleven to fourteen contain
information on WASH sector financing, contributions from non-state actors to the WASH sector,
monitoring, evaluation and sector reporting and some recommendations for decision-making.
This second edition may also not provide the harmonized information needs as expected.
Nonetheless, it has widened the reporting parameters of the 2009 edition and provides a stronger
hope for a faster drive towards data harmonization in the sector.
18
Chapter 1: Historical Overview
Introduction
The first public water supply system in Ghana, then Gold Coast, was established in Accra just before
the First World War. Extensions were made exclusively to other urban areas, among them the
colonial capital of Cape Coast, Winneba and Kumasi in the1920s.
During this period, the water supply systems were managed by the Hydraulic Division of the Public
Works Department (PWD). With time the responsibilities of the Hydraulic Division were widened to
include the planning and development of water supply systems in other parts of the country.
In 1948, the Department of Rural Water Development was established to engage in the
development and management of rural water supply through the drilling of bore holes and
construction of wells for rural communities.
After Ghana‟s independence in 1957, a Water Supply Division, with headquarters in Kumasi, was set
up under the Ministry of Works and Housing with responsibilities for both urban and rural water
supplies.
During the dry season of 1959, there was severe water shortage in the country. Following this crisis,
an agreement was signed between the Government of Ghana and the World Health Organization
(WHO) for a study to be conducted into the water sector development of the country.
The study focused not only on technical engineering but also on the organization of national water
and sewerage authority and the methods of financing. The study recommended the preparation of a
20-year (1960 to 1980) Master Plan for water supply and sewerage services in Accra-Tema.
In line with the recommendations of WHO, the Ghana Water and Sewerage Corporation (GWSC), was
established in 1965 under an Act of Parliament (Act 310) as a legal public utility entity. GWSC was
responsible for:
water supply and sanitation in rural as well as urban areas
the conduct of research on water and sewerage as well as the making of engineering surveys
and plans
the construction and operation of water and sewerage works, and
the setting of standards and prices and collection of revenues
1.1 Decline in Operational Efficiency of GWSC
In 1957, there were 35 pipe-borne water supply systems in the country. The number of pipe-borne
systems rose to 69 in 1961 and then to 194 in 1979. At this time, there were 2,500 hand pumped
borehole systems in the country and by 1984, additional 3,000 boreholes had been drilled and fitted
with hand pumps. However by the late 1980s and early 1990s, 33% of the water supply systems had
deteriorated greatly or completely broken down due to inadequate funding to carry out maintenance
and rehabilitation. A World Bank report in 1998 states that: “The water supply systems in Ghana
deteriorated rapidly during the economic crises of the 1970s and early 1980s when Government‟s
ability to adequately operate and maintain essential services was severely constrained.”
19
1.2 Interventions to Improve Efficiency
To reverse the decline in water supply services, interventions in the area of sector reforms and
project implementation were made in 1970, 1981 and 1988. These included interventions by the
World Bank, IDA, donor countries and other external support agencies such as Austrian Government,
Italian Government, Nordic Development Fund, the African Development Bank, Canadian
International Development Agency, Department for International Development, KfW, GTZ, OECF,
ECGD and CFD/ADF.
Though some gains were derived from these interventions, their general impact on service delivery
was not very significant. Due to the failure of these interventions to achieve the needed results,
several efforts were made to improve efficiency within the water supply sector in Ghana especially
during the era of the Economic Recovery Programme from 1983 to 1993. During this period, loans
and grants were sought from the World Bank and other donors for the initiation of rehabilitation and
expansion programmes, to train personnel and to buy transport and maintenance equipment.
In addition, user fees for water supply were increased and subsidies on water tariffs were gradually
removed for GWSC to achieve self-financing. Although subvention for both operational and
developmental programmes was withdrawn in 1986, government funding for development
programmes continued. The government at that time approved a formula for annual tariff
adjustments to enable the corporation generate sufficient funds to cover all annual recurrent costs
as well as attain some capacity to undertake development projects.
1.3 Recent Water Sector Reforms
A number of organizational reforms within the Ghanaian water sector were initiated in the early
1990s. As a first step, responsibilities for sanitation and water supply to small towns were
decentralized from the Ghana Water and Sewerage Corporation (GWSC) to the District Assemblies in
1993.
The Water Resources Commission (WRC) was founded in 1996 to be in charge of overall regulation
and management of water resources utilization. In 1997, the Public Utilities Regulatory Commission
(PURC) was established with the purpose of setting tariffs and quality standards for the operation of
public utilities (notably water and electricity).
With the passage of Act 564 of 1998, the Community Water and Sanitation Agency (CWSA) was
established to be responsible for management of rural and small town water supply systems,
hygiene education and provision of sanitary facilities. After the establishment of CWSA, 120 water
supply systems serving small towns and rural communities were transferred from the GWSC to the
District Assemblies and communities to manage under the community-ownership and management
scheme.
Finally, pursuant to the Statutory Corporations (Conversion to Companies) Act 461 of 1993 as
amended by LI 1648, on 1st July 1999, GWSC was converted into a 100% state owned limited
liability company – the Ghana Water Company Limited - with the responsibility for urban water supply
only.
In 2003, NGOs and CBOs in the WASH sector, including some international NGOs, formed the
Coalition of NGOs in Water and Sanitation (CONIWAS). The Coalition has so far contributed a lot in
coordinating the activities of their members and also in playing a great advocacy role by constantly
raising pro-poor issues for national attention. CONIWAS also took over the organization of the Mole
Conference Series, an annual platform held since 1989 to contribute towards sector policy reviews.
20
A Water Directorate was also created within the Ministry of Water Resources, Works and Housing in
2004 to oversee sector policy formulation and review, monitoring and evaluation of the activities of
the agencies, and overall co-ordination of the activities in the sector.
The Environmental Health and Sanitation Department of the Ministry of Local Government and Rural
Department was also upgraded into a Directorate in 2008.
As the WASH sector has mainly been project-driven with little coordination of these projects, there
have been more discussions on effective coordination especially by the Sector Ministries. Since
2009, efforts have been made to move towards a sector-wide approach (SWAp), where there will be
a programmatic approach with the Sector Ministries in the driving seat and coordinating all
programmes implemented by the various agencies and civil society. In 2009, a SWAp roadmap was
developed and in 2010, the Government of Ghana signed a SWAp Code of Conduct, spelling out
roles and responsibilities, with her development partners.
In order to promote learning and regular policy review to effective service delivery, the Ministry of
Water Resources, Works and Housing (MWRWH) and the Ministry of Local Government and Rural
Development (MLGRD) introduced annual conferences with a wide range of local and international
participation. While the MWRWH introduced the Ghana Water Forum (GWF) in 2009 to replace the
then GoG/Donors Conference, the MLGRD introduced the National Environmental Sanitation
Conference (NESCON) in 2010.
In 2007, the MWRWH developed the first National Water Policy and launched it in 2008. This policy
has since guided the sector in all its programmes and provides directions in all aspects of water from
resources management to supply and services delivery, as well as monitoring and evaluation.
Though the MLGRD had a sanitation policy since 1999, there was a major review between 2007 and
2010. The reviewed policy was launched in December 2010. Operational and investment strategies
of both, however, are yet to be launched.
21
Chapter 2: Institutional and Policy
Developments
Introduction
This chapter presents recent developments in the WASH Sector concerning institutional
arrangements and capacity building as well as policy formulation and reviews. This includes an
overview of the national development agenda, strategic plans, among others as pertained in recent
years up to 2010.
2.1 The Ghana Shared Growth and Development Framework
The Ghana Shared Growth and Development Agenda (GSGDA) replaced the Growth and Poverty
Reduction Strategy II as the Medium Term Development Policy Framework for the period 2010-
2013i. Water, Environmental Sanitation and Hygiene (WASH) is one of six (6) key focus areas under
the Infrastructure and Human Settlement Development thematic area. About 15 priority policy
interventions on WASH have been identified for implementation to achieve the following key
objectives:
Ensuring efficient management of water resources; accelerating the provision of safe and
affordable water;
Accelerating the provision of improved environmental sanitation;
Ensuring the implementation of health education programmes as a component of all water and
sanitation programmes;
Improving sector coordination through a sector-wide approach to water and environmental
sanitation delivery;
Improving sector institutional capacity, and
Ensuring sustainable, predictable and adequate financing to the sector.
2.2 Strategic Sector Development Plan
The development of a Strategic Sector Development Plan (SSDP) for the WASH sector was initiated
towards the last quarter of 2010. The SSDP is a consolidation of the separate sub sector investment
plans and strategies into a single harmonized sector plan. These plans include the Strategic
Investment Plans (SIP) of the CWSA and GWCL and a strategic plan is being developed for the WRC.
The National Environmental Sanitation Strategy and Action Plan (NESSAP) of the MLGRD will also be
incorporated into the SSDP with the exception of the urban sanitation component. The SSDP will
effectively address the absence of a common sector-wide coordination framework covering the
different components of the sector and serve as the basis for implementing the Sector Wide
Approach (SWAp) for the WASH sector. Completion of the SSDP is a trigger under the Multi-Donor
Budget Support (MDBS) framework. The SSDP is expected to be completed by December 2011.
2.3 Other Water Related Strategies and Plans
In 2010, progress was made in the development of key sector policy and strategic instruments
including the following:
The Integrated Water Resources Management (IWRM) Strategic Plan was initiated and ongoing;
The Buffer Zone Policy was completed;
22
These strategic documents complement the already existing National Water Policy and the Strategic
Investment Plan for the CWSA.
2.4 Environmental Sanitation Policy, Strategies and Plans
The Environmental Health and Sanitation Unit was upgraded into a Directorate in 2008 and
mandated to provide guidance to the MLGRD on environmental sanitation, sector planning, policy,
M&E and regulatory issues. In 2010, the sector made progress in the development of key policy and
strategic instruments including the following:
A Revised National Environmental Sanitation Policy, which was finalized and launched;
National Environmental Sanitation Strategy and Action Plan (NESSAP), which was completed;
District Environmental Sanitation Strategy and Action Plans (DESSAP), which were completed by
every district and in operation;
Strategic Environmental Sanitation Investment Plan (SESIP), completed but pending cabinet and
parliamentary approval;
A Rural Sanitation Model and Strategy was developed.
A shift in emphasis from direct provision of subsidies to households for latrine construction to the
Community-Led Total Sanitation Approach (CLTS) in Ghana received prominence in 2010. This
approach emphasizes triggering of communities to initiate their own actions to stop open defecation
as a first step, and to improvise local technologies to contain human excreta from contact with food
and water. The national strategy builds on nationwide evaluation of all isolated experiences of CLTS
promoted in different parts of the country carried out in November 2009. This evaluation distilled
useful lessons for effectively scaling up CLTS in Ghana.
The DESSAPs have been developed by all 170 Districts and have already been validated at various
workshops. The NESSAP is a reflection of the revised National Environmental Sanitation Policy (ESP
Revised 2010) which places emphasis on the strategic sanitation approach that matches facilities
with housing segments and affordability of residents. It also targets total access for environmental
sanitation through incremental achievements. The basic challenge of the sector regarding excreta
management include training staff to manage a vigorous nationwide scaling up of home toilets
promotion through emerging techniques such as Community Led Total Sanitation (CLTS) to achieve
modest country wide target of 75% by 2015 (Interim NESSAP: 2008). The process of finalizing the
strategies remains critical to avoiding overlaps and ensuring incorporation of the key emerging
trends.
2.5 National School Health Education Policy
A National School Health Education Policy (SHEP) was completed in 2010 to provide a holistic
approach to the implementation of School Health interventions and streamline the various policies
and activities of all agencies, departments, NGOs, and individuals who offer School Health services.
The National SHEP Policy seeks toii:
Bring together all policy issues on School Health into a comprehensive policy document to give
focus and measurable direction to programme implementation;
Streamline and enhance programme co-ordination;
Effectively and efficiently maximize the use of available scarce resources;
Provide institutional framework within which stakeholders will be assigned roles and
responsibilities;
Provide the channel and mechanism through which the commitment of political leaders and
stakeholders can be sought;
Give legal backing to the programme;

23
Define linkages with other national programmes and goals;
Provide the basis and framework for Strategic Planning for programme scaling up;
Provide framework for monitoring and evaluation of school health programmes;
Provide the basis for Sustainable Financing for SHEP.
2.6 Institutional Developments
The direct mandate for WASH is shared between the Ministries of Water Resources Works and
Housing and the Ministry of Local Government and Rural Development. The Water Directorate and
the Environmental Health and Sanitation Directorate are the two institutional pillars within the
respective ministries that coordinate and oversee development of sector policies, strategies and
plans.
The Water Directorate coordinates three distinct institutional sub-divisions, namely: Urban Water
Supply (Ghana Water Company Limited); Water Resources Management (Water Resources
Commission) and Rural Water and related sanitation (Community Water and Sanitation Agency).
Environmental Sanitation is coordinated by the EHSD of the Ministry of Local Government and Rural
Development (MLGRD). School WASH is coordinated by the School Health Education Program (SHEP)
of the Ghana Education Service (GES).
The GSGDA acknowledges that improving sector institutional capacity is of essence to ensuring
efficient water resources management, and water and sanitation services delivery in the country. The
Water Directorate and the Environmental Sanitation and Hygiene Directorate will be strengthened
with adequately trained number of personnel and other resources to enable them take ownership
and lead roles of the sector. Sector agencies such as WRC, GWCL, CWSA, MMDAs and community
management structures will also be given the needed capacity to enable them better manage water
resources, water and environmental sanitation facilities at the various levels. Capacity building will
be provided as a continuous process. A Sanitation and Water for ALL (SWA) Compact was also
launched in 2010 to further emphasize government‟s commitment to list WASH among the Essential
Services, develop the capacities of the WASH Directorates to ensure WASH sector growth. Despite
this explicit intention of the government, not much was achieved for the WASH sector with regard to
strengthening the Water Directorate and the EHSD in 2010. Besides the Director for Water, the
Water Directorate continued to rely on three seconded and project staff for all its operations, while
the EHSD hardly received any staffing and logistical boost during the year.
24
Chapter 3: Sector Coordination
Introduction
This chapter discusses WASH sector coordination issues in 2010. Discussions cover the move from
project-based approaches to a Sector Wide Approach (SWAp), the development of a SWAp roadmap,
formation of a SWAp Implementation Task force, signing of a Code of Conduct between the
Government and development partners, SWAp-related action-oriented workshops as part of the
SWAp process among others. The chapter also discusses a couple of coordination structures
including the National Environmental Sanitation Policy Coordinating Council (NESPoCC), the Sector
Working Group and the National Sanitation Technical Working Group on Sanitation (NTWGS).
3.1 SWAp
Over the years, the WASH sector in Ghana has seen significant growth and development, with
competent technical agencies, a dynamic private sector and sustained service delivery, especially for
the rural sub sector. Despite this progress, the sector is hampered by the lack of a common strategy
or sector-wide coordination framework that pulls together the different sub sectors and related
aspects of sanitation. Most interventions are project driven, with different project teams adopting
their own systems and procedures independent of others, sometimes with little or no government
influence. This results in poor prioritization and planning of investments, increased transaction costs,
lack of government leadership and ownership.
For many years, there was discourse among sector stakeholders towards a better coordinated and
more effective WASH sector in line with the Paris Declaration. Discussions about a better
coordinated WASH sector took shape in 2010, when stakeholders finally embarked on efforts to
adopt a Sector Wide Approach (SWAP). Government, Development Partners, Civil Society and other
relevant stakeholders in the sector actively engaged in a stepwise process towards adoption of
SWAp. Under SWAp all Development Partners (DPs) are expected to make use of national systems of
planning, management, implementation, monitoring and evaluation and to contribute to
reinforcement of these systems. Capacity development has been made an explicit cross-cutting
focus.
A SWAp Roadmap was developed, and SWAp Implementation Taskforce was constituted under the
leadership of the Water Directorate to oversee the SWAp Implementation process. The Roadmap
outlined a series of eight (8) action oriented workshops to be held, including the following:
1) SWAp Road Map Introductory workshop: to solicit the buy-in of all sector stakeholder (i.e.
Government of Ghana, Development Partners, Sector Agencies, NGOs and other relevant
stakeholders;
2) Workshop to deepen understanding of Ghana‟s Water Sector SWAp and agree on a Code of
Conduct (and eventual MoU) of the SWAp;
3) Workshop to Agree on a Comprehensive Sector Wide Development Action Plan (including:
assigning leaders and responsible stakeholders for conducting sector assessments, the
establishment of an annual sector-wide program of work - with corresponding prioritized budget
and results based management framework for the SWAp);
4) Workshop to Discuss Ways to Support Decentralization under the SWAp;
25
5) Workshop to Discuss the Implementation of a Comprehensive Monitoring and Evaluation System
for the SWAp;
6) Workshop to Discuss and Agree on Procurement Principles and Guidelines under the SWAp;
7) Workshop to Agree on Various Financing Options for the SWAp; and
8) Any other Workshops required for successful SWAp Road Map implementation.
The first four in the series were held in 2010, and the remainder is expected to be completed in
2011. The Code of Conduct was also signed. The following results are expected at the end of the
roadmap:
Awareness and common understanding established among stakeholders on the extent and
scope of cooperation required with respect to harmonized approaches and the need for
government leadership as well as donor, NGO, private sector and other stakeholders‟ alignment
to national development priorities.
Discussion of short, medium and long term benefits from harmonization, lessons of experience,
issues and measures to overcome critical and strategic barriers to harmonization and alignment.
Formulation of ways and means to operationalize the national sector plan and the SWAp which
will lead to increased development effectiveness and ultimately, real outcomes in regard to
water and sanitation targets as well as poverty reduction goals, through the implementation of
concrete Action Plans.
During the Second Action Oriented SWAp workshop held in Accra in March 2010, stakeholders
identified short and long term priority actions to be undertaken for the effective implementation of
the SWAp. The Short term priority actions included:
Operationalization of District Monitoring & Evaluation System, in all regions and
Metropolitan/Municipal/District assemblies. The system should cater for different types of data
streams within the sector
Sector-wide capacity assessment to identify gaps in financial absorption capacity and human
resources (public, private)
Develop strategies for capacity enhancement
Some of the long term priority actions included:
Clarifying roles, mandates and structures at regional and district levels
Identify sustainable funding mechanisms
Development of private sector capacity, including private for profit and non-profit organizations
A critical requirement for the successful implementation of the SWAp is the strengthening of the
Water Directorate in terms of staffing, office space and logistics and the development of a Sector
Strategic Development Plan (SSDP). Programmes and projects are currently coordinated by the
GWCL, CWSA and WRC as discrete interventions in their specific areas of mandate. To address this
fragmentation, the government now plans to develop a Sector Strategic Development Plan (SSDP)
for the WASH sector. The SSDP will be a key instrument for the implementation of the Sector Wide
Approach (SWAp) for the WASH sector and all DP support would be driven by the SSDP priorities.
More details about the SSDP are provided in Chapter 2.
26
3.2 National Environmental Sanitation Policy Coordinating Council (NESPoCC)
A National Environmental Sanitation Policy Coordinating Council (NESPoCC) comprising all relevant
stakeholders is the highest policy making and coordination body for environmental sanitation in
Ghana. NESPoCC met about 3 times, as against 4 meetings expected for the year.
3.3 The Sector Working Group
The Sector Working Group comprises Government, Development Partners and Civil Society in the
WASH sector that meets monthly to review critical issues and overall progress of the sector. The
group is chaired by the Directors for Water, and Environmental Health and Sanitation. DPs select a
Lead annually. The group successfully met on all occasions as planned throughout the year.
3.4 National Sanitation Technical Working Group
The National Technical Working Group on Sanitation (NTWGS) was formed in 2008 comprising key
stakeholders and organizations. Following the evaluation of CLTS in 2009, the NTWGS supported the
development of a number of documents to guide CLTS implementation including a protocol for the
declaration of open defecation-free (ODF) communities. The group has also proposed to solicit a
technical support visit to Ghana by Kamal Kar, the initiator of the CLTS approach in 2011.
27
Chapter 4: Water Resources
Management
Introduction
This chapter provides information on water resources management. The chapter presents an
overview of Ghana's water resources, including availability, demand, and water quality.
4.1 Overview of Ghana‟s water resources
Ghana‟s water resources are divided into surface and groundwater sources. Surface water resources
are mainly from three river systems that drain Ghana, namely: the Volta, South Western and Coastal
river systems. The Volta system is made up of the Red, Black and White Volta Rivers as well as the
Oti River. The southwestern river system is made up of the Bia Tano, Ankobra and Pra rivers. The
Tordzie/Aka, Densu, Ayensu, Ochi-Nakwa and Ochi-Amissah comprise the coastal river systems.
These river systems make up 70%, 22% and 8% respectively of Ghana‟s total land area of about
240,000 km2. In addition to these, the only significant natural freshwater lake in Ghana is Lake
Bosomtwi with a surface area of 50km2, and a maximum depth of 78m.
In terms of groundwater resources, Ghana is underlain by three main geological formations, namely
the basement complex comprising crystalline igneous and metamorphic rocks; the consolidated
sedimentary formations underlying the Volta basin (including the limestone horizon) and the
mesozoic and cenozoic sedimentary rocks. These formations represent 54%, 45% and 1 % of the
land area of the country respectively.
4.1.1 Water availability The total annual runoff is 56.4 billion m3 with the Volta River accounting for 41.6 billion m3. The
mean annual runoff from Ghana alone is about 40 billion m3. The Volta, Southwestern and Coastal
systems contribute 65%, 29% and 6%, respectively, of this runoff. However, the runoffs are
characterized by wide disparities between the wet season and dry season flows.
The total amount of groundwater available in the country is yet to be determined. The depth of
aquifers in the basement complex and the Volta Basin is normally between 10m to 60m with yields
rarely exceeding 6m3/h. The aquifer depths in the mesozoic and cenozoic formations are usually
between six and 120m with average yields of about 184m3/h particularly in the limestone aquifer.
Groundwater occurrences in limestone formations, which also exist, are located much deeper,
typically in the range of 120m to 300m. The average yield in the limestone formation is 180m3/h.
Experience has shown that groundwater has a number of advantages over surface water for the
provision of water supply and is used as the first choice among other options for community water
supplies whenever it is available.
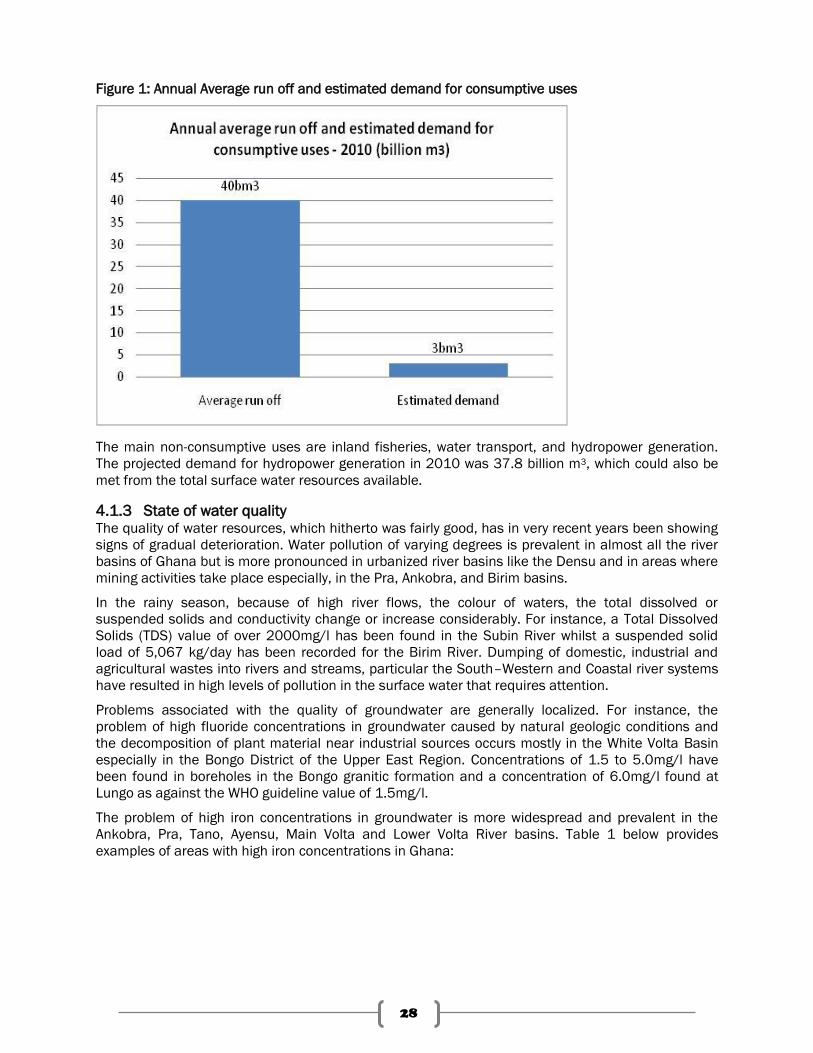
4.1.2 Water demand The main consumptive uses of water in Ghana are drinking water supply, irrigation, livestock
watering, and industrial supply. On the basis of surface water resources alone, the consumptive
water demand for 2010 was estimated at 3.0 billion m3, which is equivalent to about 7.4% of the
annual run off from Ghana alone.
28
Figure 1: Annual Average run off and estimated demand for consumptive uses
The main non-consumptive uses are inland fisheries, water transport, and hydropower generation.
The projected demand for hydropower generation in 2010 was 37.8 billion m3, which could also be
met from the total surface water resources available.
4.1.3 State of water quality The quality of water resources, which hitherto was fairly good, has in very recent years been showing
signs of gradual deterioration. Water pollution of varying degrees is prevalent in almost all the river
basins of Ghana but is more pronounced in urbanized river basins like the Densu and in areas where
mining activities take place especially, in the Pra, Ankobra, and Birim basins.
In the rainy season, because of high river flows, the colour of waters, the total dissolved or
suspended solids and conductivity change or increase considerably. For instance, a Total Dissolved
Solids (TDS) value of over 2000mg/l has been found in the Subin River whilst a suspended solid
load of 5,067 kg/day has been recorded for the Birim River. Dumping of domestic, industrial and
agricultural wastes into rivers and streams, particular the South–Western and Coastal river systems
have resulted in high levels of pollution in the surface water that requires attention.
Problems associated with the quality of groundwater are generally localized. For instance, the
problem of high fluoride concentrations in groundwater caused by natural geologic conditions and
the decomposition of plant material near industrial sources occurs mostly in the White Volta Basin
especially in the Bongo District of the Upper East Region. Concentrations of 1.5 to 5.0mg/l have
been found in boreholes in the Bongo granitic formation and a concentration of 6.0mg/l found at
Lungo as against the WHO guideline value of 1.5mg/l.
The problem of high iron concentrations in groundwater is more widespread and prevalent in the
Ankobra, Pra, Tano, Ayensu, Main Volta and Lower Volta River basins. Table 1 below provides
examples of areas with high iron concentrations in Ghana:
29
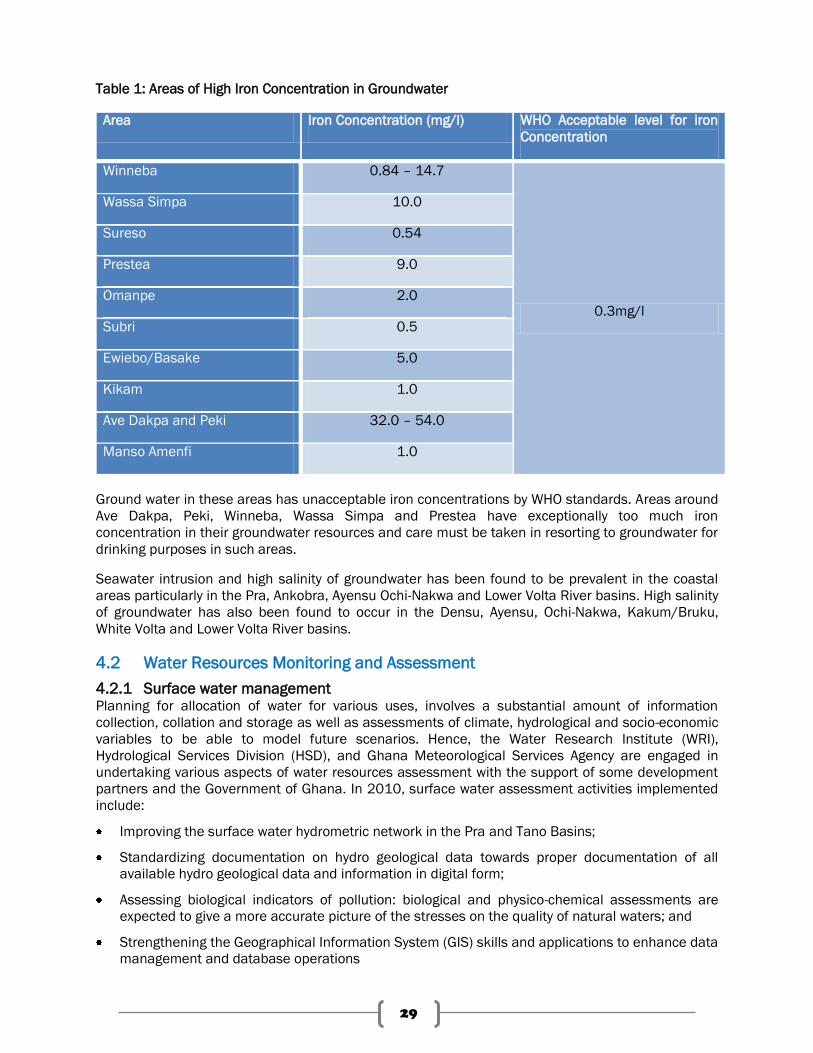
Table 1: Areas of High Iron Concentration in Groundwater
Area Iron Concentration (mg/l) WHO Acceptable level for iron
Concentration
Winneba 0.84 – 14.7
0.3mg/l
Wassa Simpa 10.0
Sureso 0.54
Prestea 9.0
Omanpe 2.0
Subri 0.5
Ewiebo/Basake 5.0
Kikam 1.0
Ave Dakpa and Peki 32.0 – 54.0
Manso Amenfi 1.0
Ground water in these areas has unacceptable iron concentrations by WHO standards. Areas around
Ave Dakpa, Peki, Winneba, Wassa Simpa and Prestea have exceptionally too much iron
concentration in their groundwater resources and care must be taken in resorting to groundwater for
drinking purposes in such areas.
Seawater intrusion and high salinity of groundwater has been found to be prevalent in the coastal
areas particularly in the Pra, Ankobra, Ayensu Ochi-Nakwa and Lower Volta River basins. High salinity
of groundwater has also been found to occur in the Densu, Ayensu, Ochi-Nakwa, Kakum/Bruku,
White Volta and Lower Volta River basins.
4.2 Water Resources Monitoring and Assessment
4.2.1 Surface water management Planning for allocation of water for various uses, involves a substantial amount of information
collection, collation and storage as well as assessments of climate, hydrological and socio-economic
variables to be able to model future scenarios. Hence, the Water Research Institute (WRI),
Hydrological Services Division (HSD), and Ghana Meteorological Services Agency are engaged in
undertaking various aspects of water resources assessment with the support of some development
partners and the Government of Ghana. In 2010, surface water assessment activities implemented
include:
Improving the surface water hydrometric network in the Pra and Tano Basins;
Standardizing documentation on hydro geological data towards proper documentation of all
available hydro geological data and information in digital form;
Assessing biological indicators of pollution: biological and physico-chemical assessments are
expected to give a more accurate picture of the stresses on the quality of natural waters; and
Strengthening the Geographical Information System (GIS) skills and applications to enhance data
management and database operations
30
4.2.2 Groundwater management Groundwater assessment was basically anchored under the CIDA supported Hydro geological
Assessment Project (HAP), which seeks to improve the knowledge base and comprehension of the
hydro-geological make-up of the three (3) regions in Northern Ghana. Latest activities have been
geared towards the monitoring of groundwater resources and creation of a database with
information and data from groundwater levels and quality. The essence of monitoring and data
collection was to determine trends in water level fluctuations as well as anthropogenic impacts on
the resource for effective planning and forecasting purposes. Performance in 2010 included:
Chloride Mass Balance recharge assessment focusing on the analyses of precipitation samples
collected from meteorological stations in the area.
Harmonization of the hydro geological database to provide easy access to reliable
information/data.
Basic training was also given to some technical staff in the use of some software programs for
the management of the database.
Monitoring of the 37 monitoring boreholes (22 existing and 15 newly constructed) continued.
Analysis revealed that more than half of the 15 new boreholes have yields exceeding 300 litres
per minute (more than the statistical average expected). Examination of the impact of deeper
drilling depths as a possible sector approach to improving the success rates of drilling as well as
increasing yields is currently being applied in sections of the Brong Ahafo Region.
4.2.3 Water quality management The water quality monitoring and assessment program started in 2005 in the Southwestern and
Coastal River Systems, with nineteen 19 stations. In 2010 the number of monitoring stations was
increased to 40 to include the Volta River System and hence cover the whole country. In all, 31 river
stations and nine reservoir/lakes stations were monitored during the year. The break-down of
monitoring stations is as follows:
South-Western System - 19 stations;
Coastal System - 8 stations;
Volta System - 13 stations.
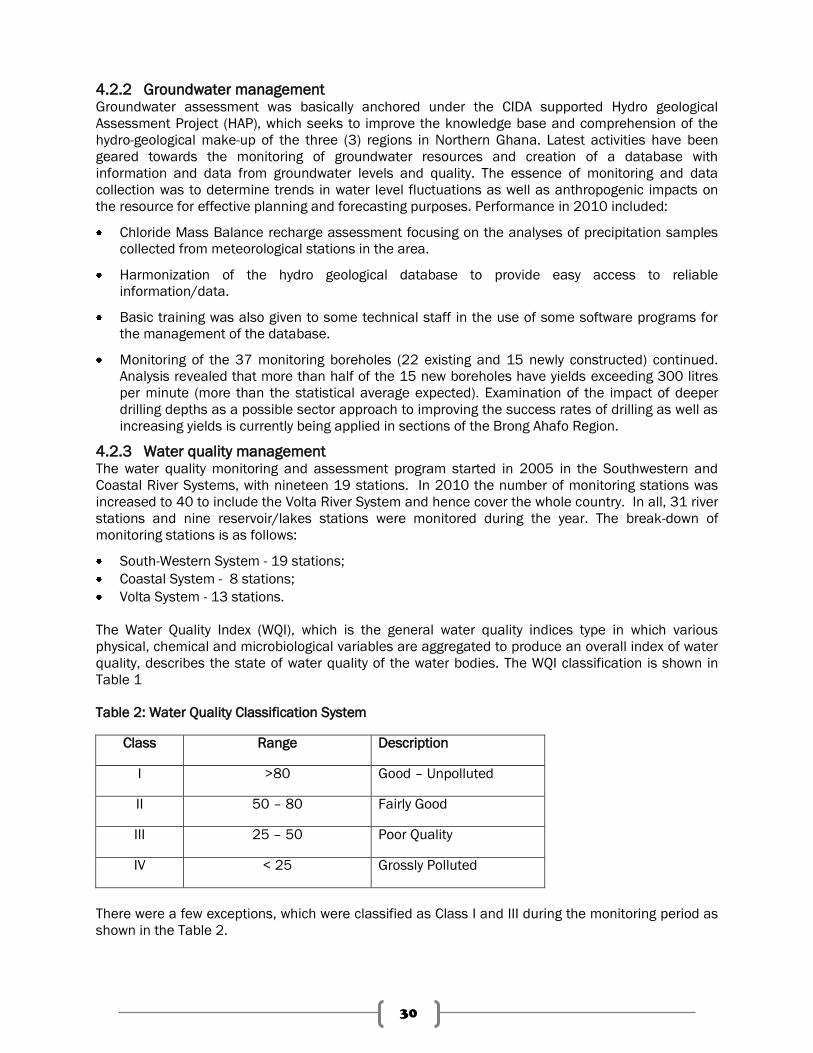
The Water Quality Index (WQI), which is the general water quality indices type in which various
physical, chemical and microbiological variables are aggregated to produce an overall index of water
quality, describes the state of water quality of the water bodies. The WQI classification is shown in
Table 1
Table 2: Water Quality Classification System
Class Range Description
I >80 Good – Unpolluted
II 50 – 80 Fairly Good
III 25 – 50 Poor Quality
IV < 25 Grossly Polluted
There were a few exceptions, which were classified as Class I and III during the monitoring period as
shown in the Table 2.
31
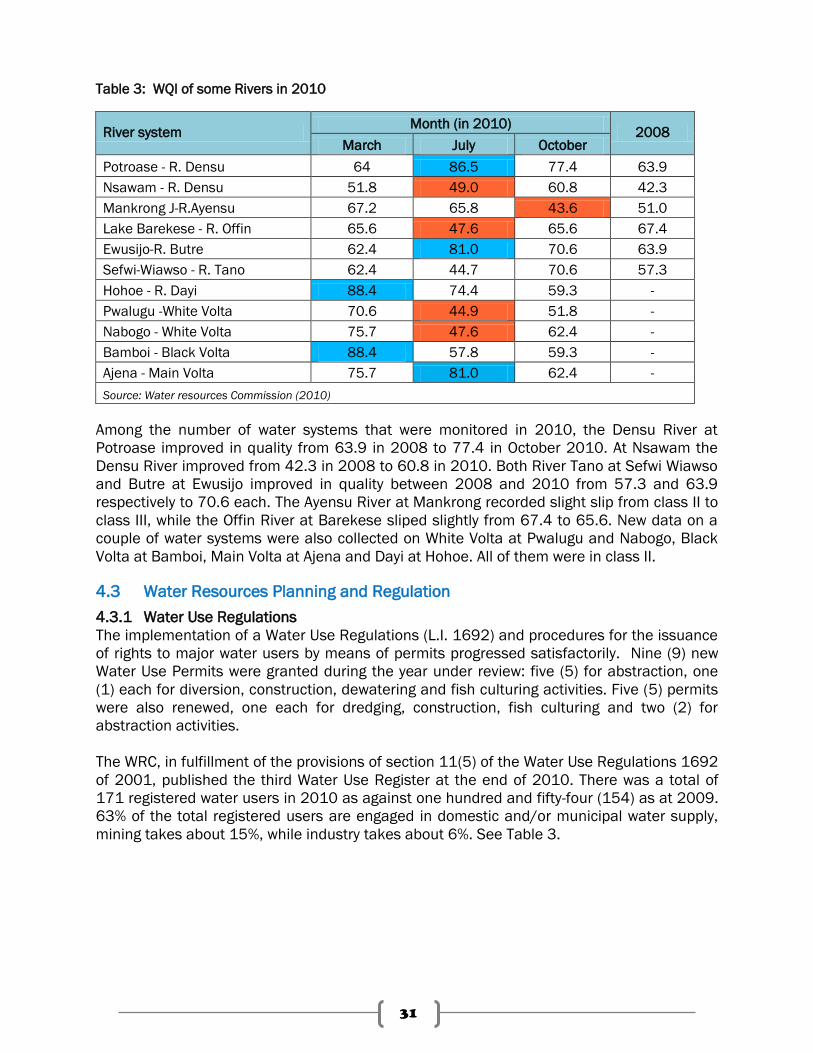
Table 3: WQI of some Rivers in 2010
River system Month (in 2010)
2008 March July October
Potroase - R. Densu 64 86.5 77.4 63.9
Nsawam - R. Densu 51.8 49.0 60.8 42.3
Mankrong J-R.Ayensu 67.2 65.8 43.6 51.0
Lake Barekese - R. Offin 65.6 47.6 65.6 67.4
Ewusijo-R. Butre 62.4 81.0 70.6 63.9
Sefwi-Wiawso - R. Tano 62.4 44.7 70.6 57.3
Hohoe - R. Dayi 88.4 74.4 59.3 -
Pwalugu -White Volta 70.6 44.9 51.8 -
Nabogo - White Volta 75.7 47.6 62.4 -
Bamboi - Black Volta 88.4 57.8 59.3 -
Ajena - Main Volta 75.7 81.0 62.4 -
Source: Water resources Commission (2010)
Among the number of water systems that were monitored in 2010, the Densu River at
Potroase improved in quality from 63.9 in 2008 to 77.4 in October 2010. At Nsawam the
Densu River improved from 42.3 in 2008 to 60.8 in 2010. Both River Tano at Sefwi Wiawso
and Butre at Ewusijo improved in quality between 2008 and 2010 from 57.3 and 63.9
respectively to 70.6 each. The Ayensu River at Mankrong recorded slight slip from class II to
class III, while the Offin River at Barekese sliped slightly from 67.4 to 65.6. New data on a
couple of water systems were also collected on White Volta at Pwalugu and Nabogo, Black
Volta at Bamboi, Main Volta at Ajena and Dayi at Hohoe. All of them were in class II.
4.3 Water Resources Planning and Regulation
4.3.1 Water Use Regulations
The implementation of a Water Use Regulations (L.I. 1692) and procedures for the issuance
of rights to major water users by means of permits progressed satisfactorily. Nine (9) new
Water Use Permits were granted during the year under review: five (5) for abstraction, one
(1) each for diversion, construction, dewatering and fish culturing activities. Five (5) permits
were also renewed, one each for dredging, construction, fish culturing and two (2) for
abstraction activities.
The WRC, in fulfillment of the provisions of section 11(5) of the Water Use Regulations 1692
of 2001, published the third Water Use Register at the end of 2010. There was a total of
171 registered water users in 2010 as against one hundred and fifty-four (154) as at 2009.
63% of the total registered users are engaged in domestic and/or municipal water supply,
mining takes about 15%, while industry takes about 6%. See Table 3.
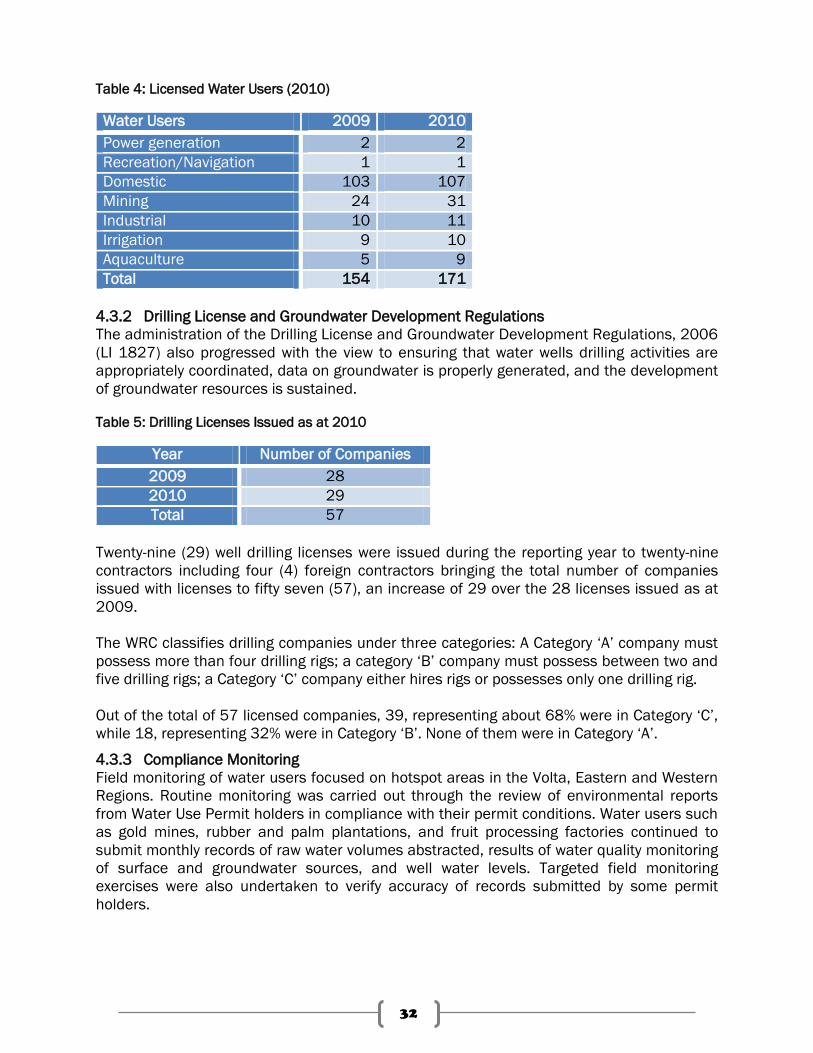
32
Table 4: Licensed Water Users (2010)
Water Users 2009 2010
Power generation 2 2
Recreation/Navigation 1 1
Domestic 103 107
Mining 24 31
Industrial 10 11
Irrigation 9 10
Aquaculture 5 9
Total 154 171
4.3.2 Drilling License and Groundwater Development Regulations
The administration of the Drilling License and Groundwater Development Regulations, 2006
(LI 1827) also progressed with the view to ensuring that water wells drilling activities are
appropriately coordinated, data on groundwater is properly generated, and the development
of groundwater resources is sustained.
Table 5: Drilling Licenses Issued as at 2010
Year Number of Companies
2009 28
2010 29
Total 57
Twenty-nine (29) well drilling licenses were issued during the reporting year to twenty-nine
contractors including four (4) foreign contractors bringing the total number of companies
issued with licenses to fifty seven (57), an increase of 29 over the 28 licenses issued as at
2009.
The WRC classifies drilling companies under three categories: A Category „A‟ company must
possess more than four drilling rigs; a category „B‟ company must possess between two and
five drilling rigs; a Category „C‟ company either hires rigs or possesses only one drilling rig.
Out of the total of 57 licensed companies, 39, representing about 68% were in Category „C‟,
while 18, representing 32% were in Category „B‟. None of them were in Category „A‟.
4.3.3 Compliance Monitoring
Field monitoring of water users focused on hotspot areas in the Volta, Eastern and Western
Regions. Routine monitoring was carried out through the review of environmental reports
from Water Use Permit holders in compliance with their permit conditions. Water users such
as gold mines, rubber and palm plantations, and fruit processing factories continued to
submit monthly records of raw water volumes abstracted, results of water quality monitoring
of surface and groundwater sources, and well water levels. Targeted field monitoring
exercises were also undertaken to verify accuracy of records submitted by some permit
holders.
33
Reports submitted generally indicated that the effluent concentrations of most parameters
discharged into water bodies were within prescribed guidelines of the Environmental
Protection Agency (EPA).
4.3.4 Development of Dam Safety Regulations
The Commission in 2009 initiated the process of developing a third set of Regulations and
set up of a National Dam Safety Unit to regulate and coordinate all relevant activities related
to dam design, construction, operations, maintenance, and decommissioning. The ultimate
goal was to ensure uniform and adequate level of safety for all dams throughout Ghana.
Accordingly, an agreement was completed and signed with the Norwegian Agency for
Development Cooperation (NORAD) for a 3-year support program for the establishment of a
Dam Safety Unit and the development of dam safety regulations. At the end of 2010
technical committees (Dam Safety Working Group, Legal Committee and Finance
Committee) were set up to provide technical inputs and facilitate the process.
4.4 River Basin Management and Planning
4.4.1 Functionality of River Basin Institutions
One of the key principles for ensuring proper management of water resources is to promote
decision-making and action at the lowest appropriate level. Hence, the strategy has been to
decentralize water resources management and planning to the river basin level and
encourage the active involvement of local level institutions through the setting up of
functional river basin management structures.
In line with this objective of decentralizing IWRM in Ghana, the process of setting up two
new functional and priority river Basin Secretariats and Boards for the Pra and Tano Basins
continued. The Pra Basin Secretariat was successfully set up in Kumasi, while the
membership for its Basin Board was however still being garnered. Establishment of the
Tano Basin Secretariat began with the employment of a Basin Officer and the acquisition of
office space in collaboration with the Brong Ahafo Regional Coordinating Council.
Identification of key stakeholders and a physical survey of the Tano Basin were also carried
out. When completed, the total number of basin offices will increase to five.
4.4.2 River Basin and National IWRM Plans
IWRM plans seek to address and incorporate actions towards the more local (community
based) initiatives, which can be taken to reverse prevalent catchment degradation trends,
viz. encroachment, deforestation and unabated pollution. Regarding the development of
river basin IWRM plans, baseline studies were successfully conducted and the initial
stakeholder strategic environment assessment undertaken to serve as inputs towards the
development of IWRM plans for the Pra and Tano Basins.
In the case of the Dayi Basin, both the baseline studies and development of a Water
Evaluation and Planning System (WEAP) model were completed. The baseline studies
focused on information on the physical and socio-economic features of the basin, water
resources assessment, and demand projections.
On the other hand, the development of the National IWRM plan was initiated with the
completion of inception workshops and commencement of requisite baseline studies.
4.4.3 Policy Initiatives: Riparian Buffer Zone policy
A Riparian Buffer Zone Policy is being designed as a harmonized document of all the
dormant and fragmented regulations in the country concerning buffers bordering water
34
bodies or river systems. It is also being designed to provide comprehensive measures and
actions that would guide the creation of vegetative buffers along open water bodies (rivers,
streams, lakes) for their preservation and functioning.
The draft Buffer Zone Policy document was subjected to the Strategic Environment
Assessment (SEA) principles through consultative workshops. Subsequently, the document
is being finalized for approval by the Commission before submission to the MWRWH for
adoption.
4.4.4 IWRM promotion and public awareness
The WRC Communication Strategy continued to be executed with water resources
management education and awareness raising elements countrywide. Specifically, three
documentaries (for Pra, Tano and national) were produced for screening. Other
communication materials such as T-shirts and brochures were also produced, while the
production of two information billboards for the Pra and Tano basins was initiated. Finally,
eight of the nine targeted regional fora were organized. The workshops were designed to
promote and facilitate IWRM awareness at the district level and were organized for women‟s
groups including queen mothers, women, NGOs, and the media, amongst others.
4.5 Transboundary Water Resources Management
4.5.1 The Volta Basin Authority (VBA)
The Volta Basin Authority (VBA), which was formally established on 14th August, 2009, seeks
to ensure international cooperation for the rational and sustainable management of the
water resources of the Volta basin, shared by the six riparian countries Burkina Faso, Benin,
Cote d‟Ivoire, Ghana, Mali and Togo. By the end of 2010, the interim VBA secretariat
focusing on its immediate objective of achieving an effective establishment and operation of
the VBA, had accomplished, among others, the following:
i. Production of a meta-database on the hydro-meteorological networks and an atlas of
thematic maps on the Volta Basin. This was achieved from a study on the division of the
basin into homogeneous areas and assessment of hydro-meteorological networks for
data collection in the Volta basin;
ii. Completion of Pre-investment studies for the establishment of a Pre-investment Fund to
facilitate pre-feasibility and feasibility studies of identified areas of priority development;
iii. Implementing a 3-year program towards the establishment and functioning of an
Observatory for Water Resources in the basin;
iv. Initiated the drafting of a Water Charter; and
v. Organized three key thematic fora on cartography, agricultural water, and sustainable
management of groundwater.
4.5.2 The Project on Improving Water Governance in the Volta Basin (PAGEV)
The Project on Improving Water Governance in the Volta Basin (PAGEV), which is in its 2nd
phase, was initiated by IUCN in 2004 in response to the need for transboundary
coordination and cooperation regarding the management of the water resources of the Volta
basin and is focusing on the White Volta basin. The areas benefitting in Ghana are the
districts of Bawku West, Bawku Municipality, and Garu Tempane. The project had recorded,
as at end of 2010, significant results that set benchmarks for enhanced transboundary
water resources management of the Volta. These include:
35
Compilation of knowledge on status and dynamics of water resources in the Volta;
Production of base and thematic maps;
Establishment of committees for the protection of the riverbanks in eight pilot
communities. About 139 community members were trained and sensitized in group
dynamics, management and decision making towards effective management of
riverbank protection interventions in the Bawku East Municipal, Bawku West and Garu
Tempane Districts;
Reforestation of riverbanks of the pilot zone with fruit trees and woodlots as alternatives
for income generation and fuel wood. 80 nursery attendants were trained and about
4,000 seedlings were raised and planted out of which 3,742 trees have so far survived
in 7 seven communities in the Bawku Municipal and Bawku West District along the
White Volta River; and
Establishment of local trans-border stakeholders‟ forum in both Ghana and Burkina Faso
to promote transboundary dialogue and cooperation.
4.5.3 Ghana-Burkina Faso Joint Technical Committee on IWRM (JTC-IWRM)
The Ghana-Burkina Faso Joint Technical Committee on IWRM (JTC-IWRM) was set up in
2005 and functioning since 2006, with the WRC as the focal institution for Ghana. The JTC-
IWRM advises the Ministers in charge of water of the two countries.
In 2010, Ghana hosted the Burkina Faso counterpart in a reciprocal visit at the national
level with the view to sharing experiences in the management of water resources at the
national and local levels and also initiated discussions on collaboration on risk
management, particularly relating to annul floods that affect the northern regions of Ghana.
4.5.4 The UNEP/GEF Project
The WRC is on behalf of Ghana hosting a 4-year UNEP/GEF Volta project, which started in
January 2008. The Project is a regional imitative of the six riparian countries of the basin
(Benin, Burkina Faso, Cote d‟Ivoire, Ghana, Mali and Togo) and is intended to address the
perceived major transboundary problems and issues of the Volta basin leading to the
degradation of the environment as a result of human activities, by reducing those activities
that lead to water scarcity and to integrate environmental concerns into development plans
of the basin. It is also designed to promote a more sectorwide–coordinated management
approach, based on the principles of Integrated Water Resources Management, both at the
national and regional levels with strong emphasis on an expanded role for all stakeholders.
Key activities performed in 2010 include:
Completion of national studies on stakeholders/institutional framework, and data and
information management for the Volta basin;
Completion of national Transboundary Diagnostics Study (TDA) on the Volta Basin; and
Initiated a demonstration project in the Bole and Sawla/Tuna/Kalba Districts for
addressing land degradation in selected areas of the Black Volta sub-basin.
36
4.6 Climate Change Adaptation
A two-year DANIDA supported project, Climate Change Adaptation through IWRM, is being
piloted in the White Volta basin from 2009-2011. It is to address floods and drought
disasters on the biophysical environment, and to collate indigenous knowledge on
adaptation. The project is focused on promoting adaptive and coping strategies for water
resources use and management to reduce livelihood vulnerability in the three northern
regions. Interventions accomplished include the development of:
Climate safe and minimum evaporative community own dug-outs and wells. Three (3)
communities in the Bongo District benefited from such wells;
Community nurseries towards tree planting around water storage facilities;
Designed appropriate non-traditional water harvesting climate safe subsurface water
storage facility/reservoir and to minimize the impact of floodwaters. Three (3)
communities in Savelugu Nanton, West Mamprusi, and Central Gonja Districts benefitted
from such storage facilities/reservoirs. The construction of similar facilities was ongoing
in seven other communities;
A draft water conservation and irrigation strategy was been developed.
37
Chapter 5: Sector Performance against
MDG Targets
Introduction
This chapter presents a summary of Ghana‟s WASH Sector performance against the UN
Millennium Development Goals (MDGs). Though this report focuses on local targets as
against the Un MDG targets whose methodologies are different (relying on user-based data
rather than provider-based data), this chapter has been introduced to report solely on MDG
progress to help data users make the right choice at the right time. After this chapter, the
rest of the report will be based on national targets only.
Users of WASH data are reminded that once MDG is the subject, only user-based survey
data from the Ghana Statistical Service or the WHO/UNICEF Joint Monitoring Programme
(JMP) data is used. It is therefore misleading to use provider data from any WASH Sector
agency when reporting on the MDGs since different methodologies are applied to derive
such data. The 85% coverage set by the GWCL for urban water supply by 2015 is a national
target and should not be reported as Ghana‟s MDG target for urban water. In the same vein,
the CWSA‟s 76% target by 2015 is a national target and not MDG target. The aggregated
national target, as reported in the 2009 Sector Performance Report, is 80% by 2015.
MDG targets are not set deliberately by any institution but are derived from a simple
calculation based on reported coverage data in 1990 by national statistical offices
worldwide. This is because the MDG for water and sanitation is to “halve by 2015, the
proportion of people without sustainable access to safe drinking water and basic
sanitation.” The base year for monitoring MDG progress is 1990.
5.1 Ghana‟s MDG Progress on WASH as at 2010iii
Since there were no surveys in 2010 apart from the Population and Housing Census (PHC)
whose report was not ready as at the end of the year, the latest available data is the
Demographic and Health Survey Report (DHS 2008) and the JMP report 2010 (which also
reports on 2008 surveys). The indicators used to measure MDG progress on water and
sanitation are:
The proportion of the population that uses an improved drinking water source, urban
and rural;
The proportion of the population that uses an improved sanitation facility, urban and
rural.
The table below presents Ghana‟s status as at 1990 and her recent position (as at 2008).
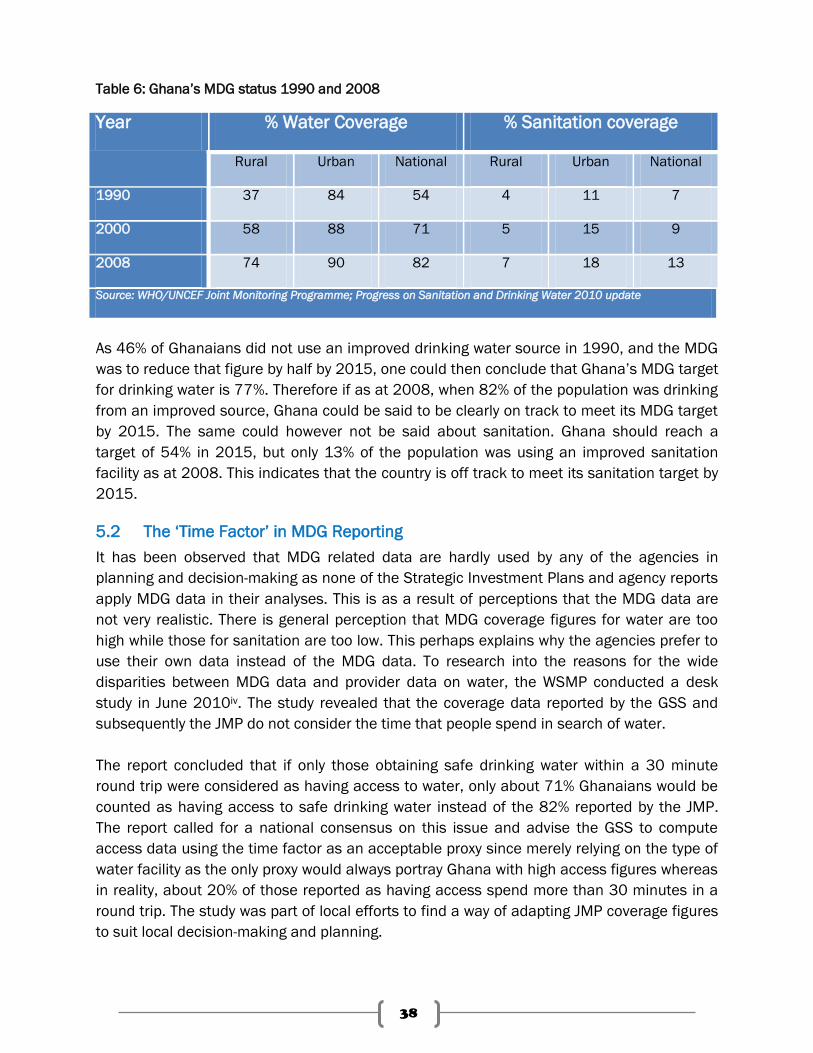
38
Table 6: Ghana‟s MDG status 1990 and 2008
Year % Water Coverage % Sanitation coverage
Rural Urban National Rural Urban National
1990 37 84 54 4 11 7
2000 58 88 71 5 15 9
2008 74 90 82 7 18 13
Source: WHO/UNCEF Joint Monitoring Programme; Progress on Sanitation and Drinking Water 2010 update
As 46% of Ghanaians did not use an improved drinking water source in 1990, and the MDG
was to reduce that figure by half by 2015, one could then conclude that Ghana‟s MDG target
for drinking water is 77%. Therefore if as at 2008, when 82% of the population was drinking
from an improved source, Ghana could be said to be clearly on track to meet its MDG target
by 2015. The same could however not be said about sanitation. Ghana should reach a
target of 54% in 2015, but only 13% of the population was using an improved sanitation
facility as at 2008. This indicates that the country is off track to meet its sanitation target by
2015.
5.2 The „Time Factor‟ in MDG Reporting
It has been observed that MDG related data are hardly used by any of the agencies in
planning and decision-making as none of the Strategic Investment Plans and agency reports
apply MDG data in their analyses. This is as a result of perceptions that the MDG data are
not very realistic. There is general perception that MDG coverage figures for water are too
high while those for sanitation are too low. This perhaps explains why the agencies prefer to
use their own data instead of the MDG data. To research into the reasons for the wide
disparities between MDG data and provider data on water, the WSMP conducted a desk
study in June 2010iv. The study revealed that the coverage data reported by the GSS and
subsequently the JMP do not consider the time that people spend in search of water.
The report concluded that if only those obtaining safe drinking water within a 30 minute
round trip were considered as having access to water, only about 71% Ghanaians would be
counted as having access to safe drinking water instead of the 82% reported by the JMP.
The report called for a national consensus on this issue and advise the GSS to compute
access data using the time factor as an acceptable proxy since merely relying on the type of
water facility as the only proxy would always portray Ghana with high access figures whereas
in reality, about 20% of those reported as having access spend more than 30 minutes in a
round trip. The study was part of local efforts to find a way of adapting JMP coverage figures
to suit local decision-making and planning.
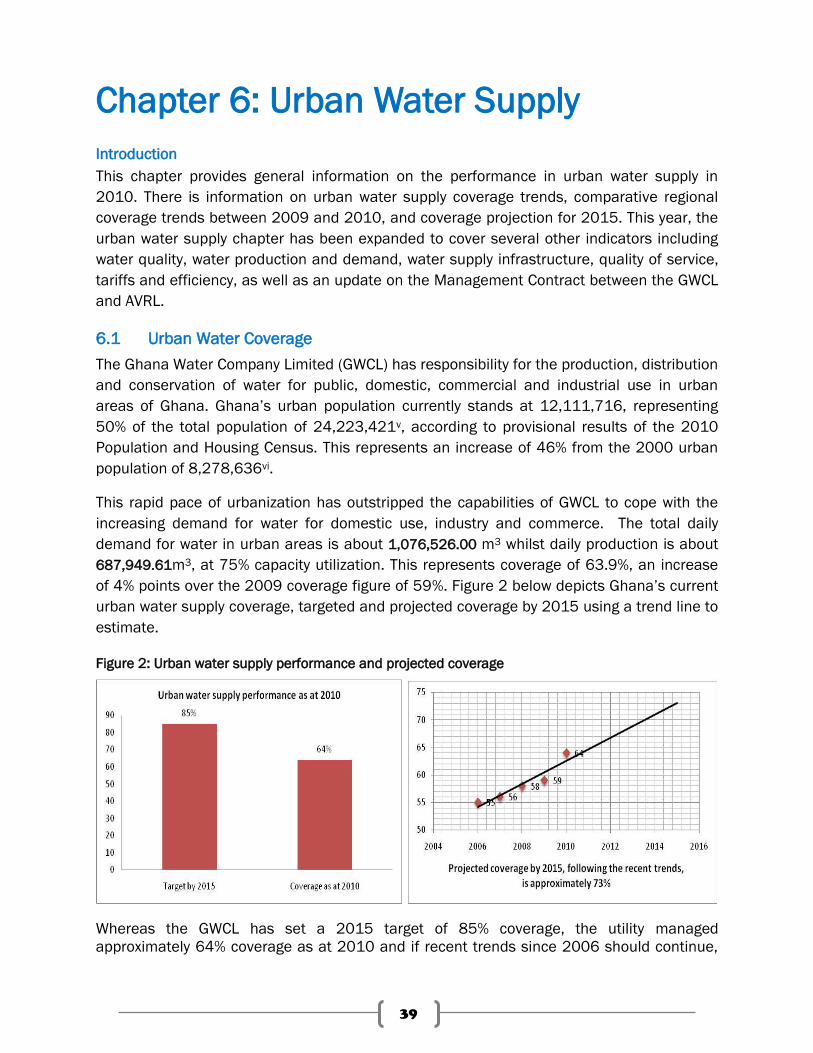
39
Chapter 6: Urban Water Supply
Introduction
This chapter provides general information on the performance in urban water supply in
2010. There is information on urban water supply coverage trends, comparative regional
coverage trends between 2009 and 2010, and coverage projection for 2015. This year, the
urban water supply chapter has been expanded to cover several other indicators including
water quality, water production and demand, water supply infrastructure, quality of service,
tariffs and efficiency, as well as an update on the Management Contract between the GWCL
and AVRL.
6.1 Urban Water Coverage
The Ghana Water Company Limited (GWCL) has responsibility for the production, distribution
and conservation of water for public, domestic, commercial and industrial use in urban
areas of Ghana. Ghana‟s urban population currently stands at 12,111,716, representing
50% of the total population of 24,223,421v, according to provisional results of the 2010
Population and Housing Census. This represents an increase of 46% from the 2000 urban
population of 8,278,636vi.
This rapid pace of urbanization has outstripped the capabilities of GWCL to cope with the
increasing demand for water for domestic use, industry and commerce. The total daily
demand for water in urban areas is about 1,076,526.00 m3 whilst daily production is about
687,949.61m3, at 75% capacity utilization. This represents coverage of 63.9%, an increase
of 4% points over the 2009 coverage figure of 59%. Figure 2 below depicts Ghana‟s current
urban water supply coverage, targeted and projected coverage by 2015 using a trend line to
estimate.
Figure 2: Urban water supply performance and projected coverage
Whereas the GWCL has set a 2015 target of 85% coverage, the utility managed
approximately 64% coverage as at 2010 and if recent trends since 2006 should continue,
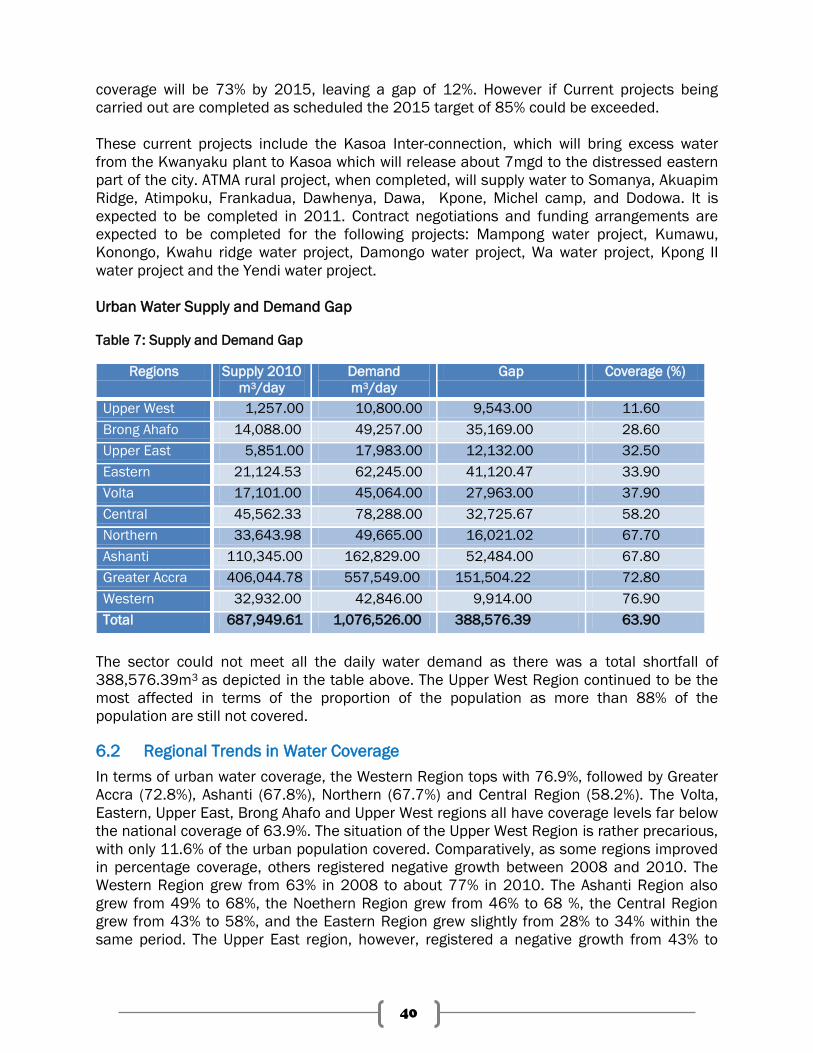
40
coverage will be 73% by 2015, leaving a gap of 12%. However if Current projects being
carried out are completed as scheduled the 2015 target of 85% could be exceeded.
These current projects include the Kasoa Inter-connection, which will bring excess water
from the Kwanyaku plant to Kasoa which will release about 7mgd to the distressed eastern
part of the city. ATMA rural project, when completed, will supply water to Somanya, Akuapim
Ridge, Atimpoku, Frankadua, Dawhenya, Dawa, Kpone, Michel camp, and Dodowa. It is
expected to be completed in 2011. Contract negotiations and funding arrangements are
expected to be completed for the following projects: Mampong water project, Kumawu,
Konongo, Kwahu ridge water project, Damongo water project, Wa water project, Kpong II
water project and the Yendi water project.
Urban Water Supply and Demand Gap
Table 7: Supply and Demand Gap
Regions Supply 2010
m3/day
Demand
m3/day
Gap Coverage (%)
Upper West 1,257.00 10,800.00 9,543.00 11.60
Brong Ahafo 14,088.00 49,257.00 35,169.00 28.60
Upper East 5,851.00 17,983.00 12,132.00 32.50
Eastern 21,124.53 62,245.00 41,120.47 33.90
Volta 17,101.00 45,064.00 27,963.00 37.90
Central 45,562.33 78,288.00 32,725.67 58.20
Northern 33,643.98 49,665.00 16,021.02 67.70
Ashanti 110,345.00 162,829.00 52,484.00 67.80
Greater Accra 406,044.78 557,549.00 151,504.22 72.80
Western 32,932.00 42,846.00 9,914.00 76.90
Total 687,949.61 1,076,526.00 388,576.39 63.90
The sector could not meet all the daily water demand as there was a total shortfall of
388,576.39m3 as depicted in the table above. The Upper West Region continued to be the
most affected in terms of the proportion of the population as more than 88% of the
population are still not covered.
6.2 Regional Trends in Water Coverage
In terms of urban water coverage, the Western Region tops with 76.9%, followed by Greater
Accra (72.8%), Ashanti (67.8%), Northern (67.7%) and Central Region (58.2%). The Volta,
Eastern, Upper East, Brong Ahafo and Upper West regions all have coverage levels far below
the national coverage of 63.9%. The situation of the Upper West Region is rather precarious,
with only 11.6% of the urban population covered. Comparatively, as some regions improved
in percentage coverage, others registered negative growth between 2008 and 2010. The
Western Region grew from 63% in 2008 to about 77% in 2010. The Ashanti Region also
grew from 49% to 68%, the Noethern Region grew from 46% to 68 %, the Central Region
grew from 43% to 58%, and the Eastern Region grew slightly from 28% to 34% within the
same period. The Upper East region, however, registered a negative growth from 43% to
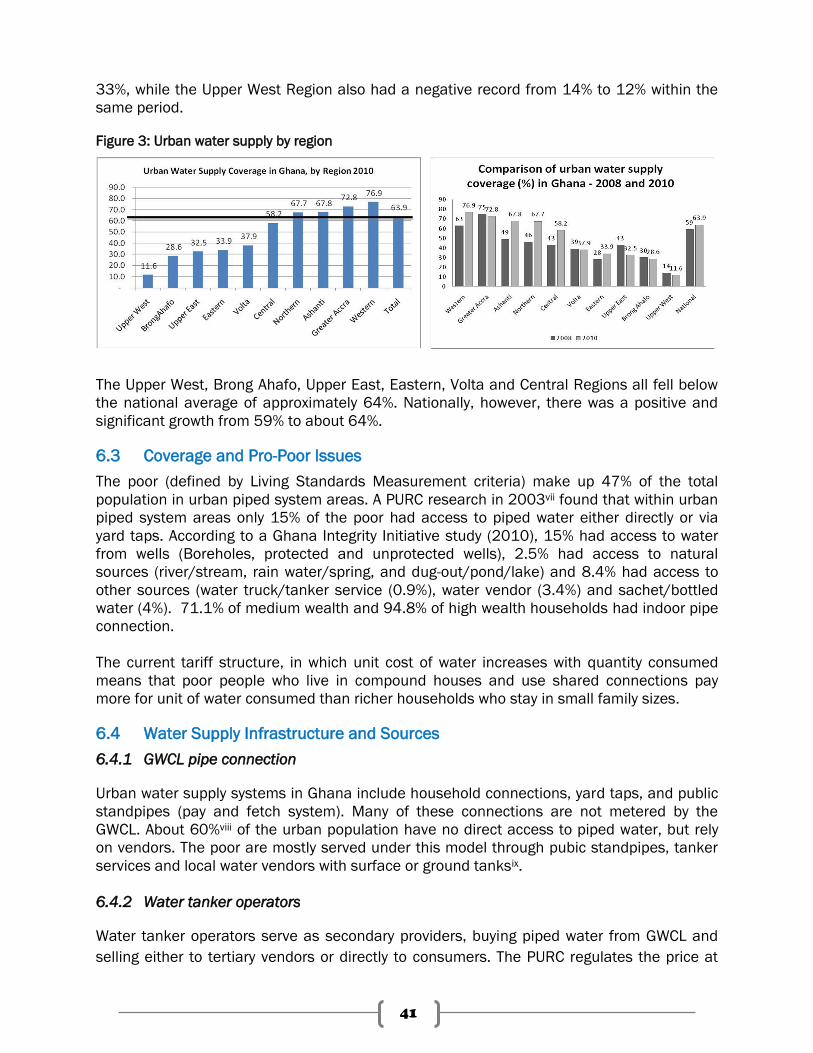
41
33%, while the Upper West Region also had a negative record from 14% to 12% within the
same period.
Figure 3: Urban water supply by region
The Upper West, Brong Ahafo, Upper East, Eastern, Volta and Central Regions all fell below
the national average of approximately 64%. Nationally, however, there was a positive and
significant growth from 59% to about 64%.
6.3 Coverage and Pro-Poor Issues
The poor (defined by Living Standards Measurement criteria) make up 47% of the total
population in urban piped system areas. A PURC research in 2003vii found that within urban
piped system areas only 15% of the poor had access to piped water either directly or via
yard taps. According to a Ghana Integrity Initiative study (2010), 15% had access to water
from wells (Boreholes, protected and unprotected wells), 2.5% had access to natural
sources (river/stream, rain water/spring, and dug-out/pond/lake) and 8.4% had access to
other sources (water truck/tanker service (0.9%), water vendor (3.4%) and sachet/bottled
water (4%). 71.1% of medium wealth and 94.8% of high wealth households had indoor pipe
connection.
The current tariff structure, in which unit cost of water increases with quantity consumed
means that poor people who live in compound houses and use shared connections pay
more for unit of water consumed than richer households who stay in small family sizes.
6.4 Water Supply Infrastructure and Sources
6.4.1 GWCL pipe connection
Urban water supply systems in Ghana include household connections, yard taps, and public
standpipes (pay and fetch system). Many of these connections are not metered by the
GWCL. About 60%viii of the urban population have no direct access to piped water, but rely
on vendors. The poor are mostly served under this model through pubic standpipes, tanker
services and local water vendors with surface or ground tanksix.
6.4.2 Water tanker operators
Water tanker operators serve as secondary providers, buying piped water from GWCL and
selling either to tertiary vendors or directly to consumers. The PURC regulates the price at
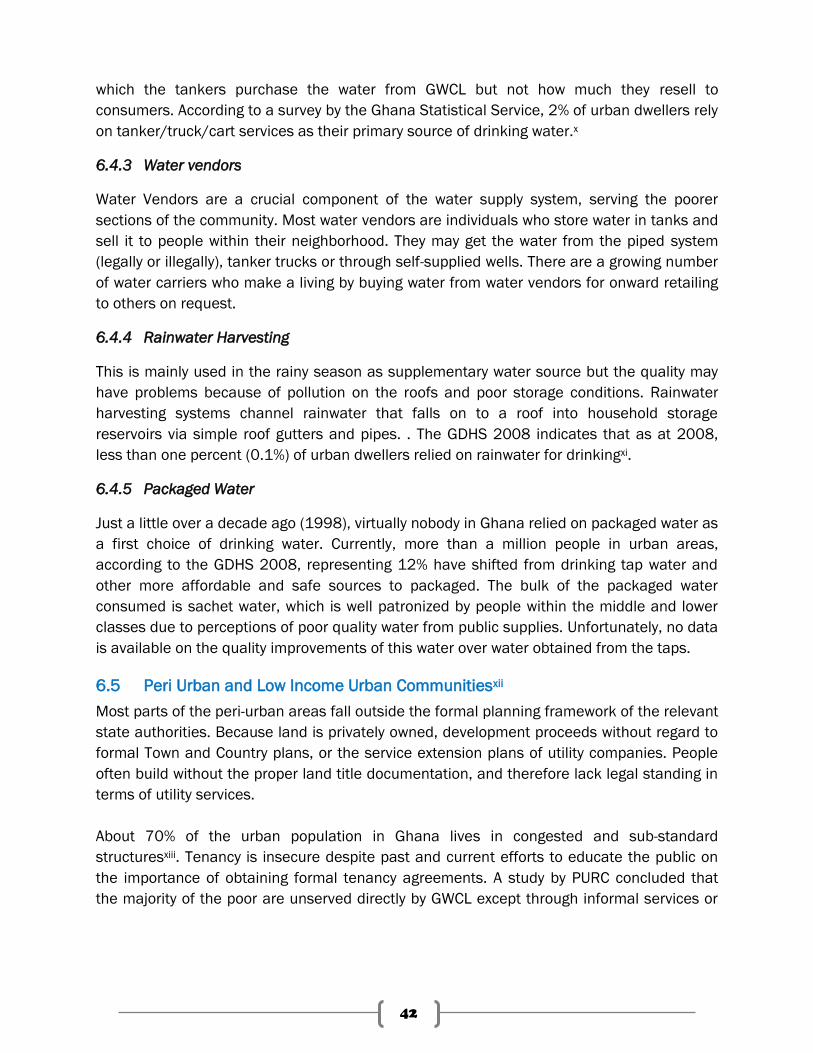
42
which the tankers purchase the water from GWCL but not how much they resell to
consumers. According to a survey by the Ghana Statistical Service, 2% of urban dwellers rely
on tanker/truck/cart services as their primary source of drinking water.x
6.4.3 Water vendors
Water Vendors are a crucial component of the water supply system, serving the poorer
sections of the community. Most water vendors are individuals who store water in tanks and
sell it to people within their neighborhood. They may get the water from the piped system
(legally or illegally), tanker trucks or through self-supplied wells. There are a growing number
of water carriers who make a living by buying water from water vendors for onward retailing
to others on request.
6.4.4 Rainwater Harvesting
This is mainly used in the rainy season as supplementary water source but the quality may
have problems because of pollution on the roofs and poor storage conditions. Rainwater
harvesting systems channel rainwater that falls on to a roof into household storage
reservoirs via simple roof gutters and pipes. . The GDHS 2008 indicates that as at 2008,
less than one percent (0.1%) of urban dwellers relied on rainwater for drinkingxi.
6.4.5 Packaged Water
Just a little over a decade ago (1998), virtually nobody in Ghana relied on packaged water as
a first choice of drinking water. Currently, more than a million people in urban areas,
according to the GDHS 2008, representing 12% have shifted from drinking tap water and
other more affordable and safe sources to packaged. The bulk of the packaged water
consumed is sachet water, which is well patronized by people within the middle and lower
classes due to perceptions of poor quality water from public supplies. Unfortunately, no data
is available on the quality improvements of this water over water obtained from the taps.
6.5 Peri Urban and Low Income Urban Communitiesxii
Most parts of the peri-urban areas fall outside the formal planning framework of the relevant
state authorities. Because land is privately owned, development proceeds without regard to
formal Town and Country plans, or the service extension plans of utility companies. People
often build without the proper land title documentation, and therefore lack legal standing in
terms of utility services.
About 70% of the urban population in Ghana lives in congested and sub-standard
structuresxiii. Tenancy is insecure despite past and current efforts to educate the public on
the importance of obtaining formal tenancy agreements. A study by PURC concluded that
the majority of the poor are unserved directly by GWCL except through informal services or
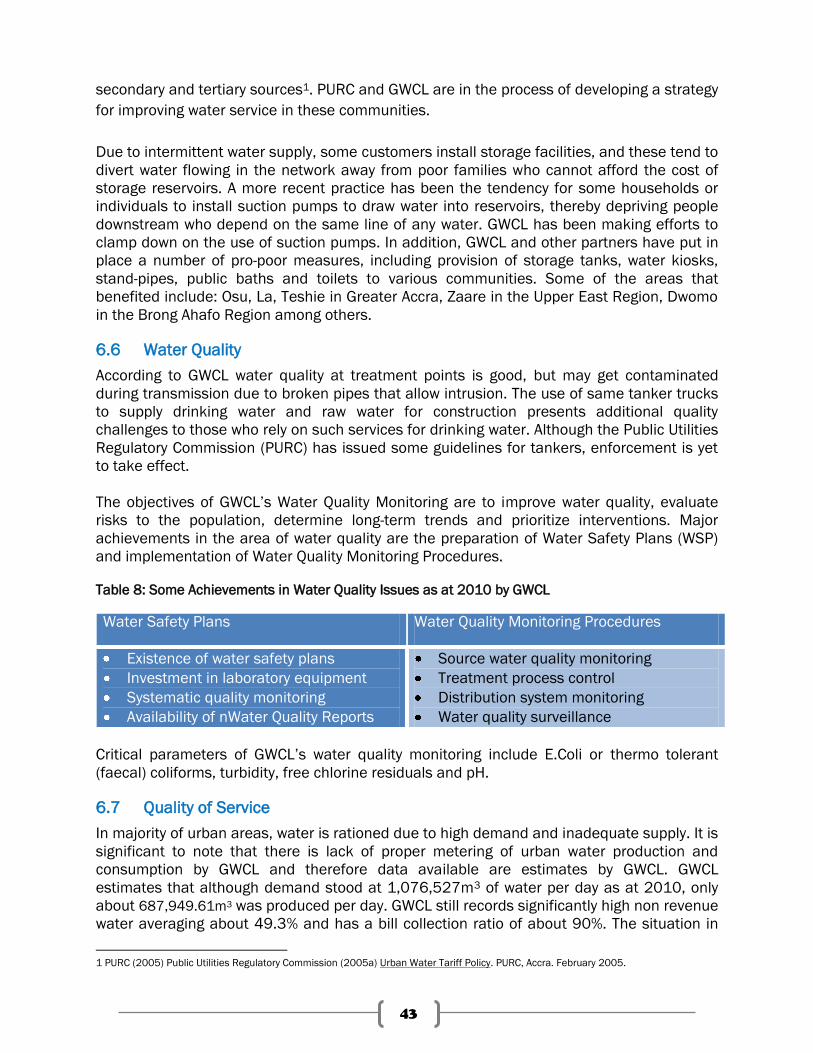
43
secondary and tertiary sources1. PURC and GWCL are in the process of developing a strategy
for improving water service in these communities.
Due to intermittent water supply, some customers install storage facilities, and these tend to
divert water flowing in the network away from poor families who cannot afford the cost of
storage reservoirs. A more recent practice has been the tendency for some households or
individuals to install suction pumps to draw water into reservoirs, thereby depriving people
downstream who depend on the same line of any water. GWCL has been making efforts to
clamp down on the use of suction pumps. In addition, GWCL and other partners have put in
place a number of pro-poor measures, including provision of storage tanks, water kiosks,
stand-pipes, public baths and toilets to various communities. Some of the areas that
benefited include: Osu, La, Teshie in Greater Accra, Zaare in the Upper East Region, Dwomo
in the Brong Ahafo Region among others.
6.6 Water Quality
According to GWCL water quality at treatment points is good, but may get contaminated
during transmission due to broken pipes that allow intrusion. The use of same tanker trucks
to supply drinking water and raw water for construction presents additional quality
challenges to those who rely on such services for drinking water. Although the Public Utilities
Regulatory Commission (PURC) has issued some guidelines for tankers, enforcement is yet
to take effect.
The objectives of GWCL‟s Water Quality Monitoring are to improve water quality, evaluate
risks to the population, determine long-term trends and prioritize interventions. Major
achievements in the area of water quality are the preparation of Water Safety Plans (WSP)
and implementation of Water Quality Monitoring Procedures.
Table 8: Some Achievements in Water Quality Issues as at 2010 by GWCL
Water Safety Plans Water Quality Monitoring Procedures
Existence of water safety plans
Investment in laboratory equipment
Systematic quality monitoring
Availability of nWater Quality Reports
Source water quality monitoring
Treatment process control
Distribution system monitoring
Water quality surveillance
Critical parameters of GWCL‟s water quality monitoring include E.Coli or thermo tolerant
(faecal) coliforms, turbidity, free chlorine residuals and pH.
6.7 Quality of Service
In majority of urban areas, water is rationed due to high demand and inadequate supply. It is
significant to note that there is lack of proper metering of urban water production and
consumption by GWCL and therefore data available are estimates by GWCL. GWCL
estimates that although demand stood at 1,076,527m3 of water per day as at 2010, only
about 687,949.61m3 was produced per day. GWCL still records significantly high non revenue
water averaging about 49.3% and has a bill collection ratio of about 90%. The situation in
1 PURC (2005) Public Utilities Regulatory Commission (2005a) Urban Water Tariff Policy. PURC, Accra. February 2005.
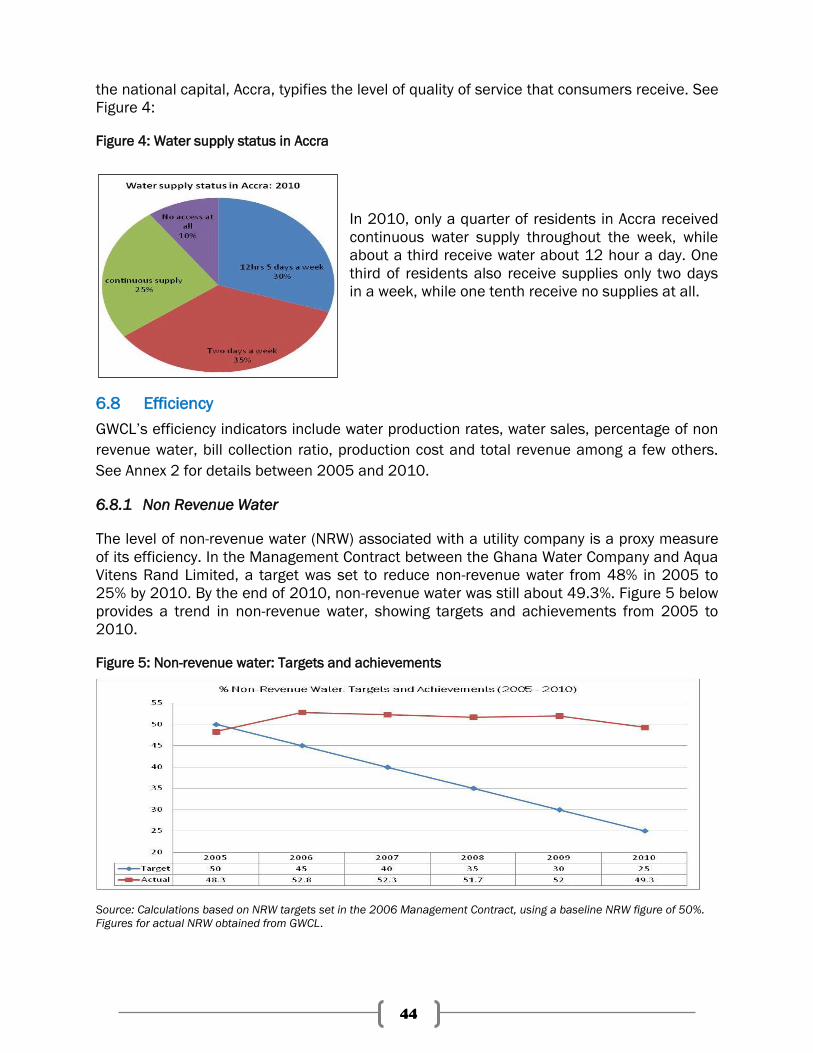
44
the national capital, Accra, typifies the level of quality of service that consumers receive. See
Figure 4:
Figure 4: Water supply status in Accra
In 2010, only a quarter of residents in Accra received
continuous water supply throughout the week, while
about a third receive water about 12 hour a day. One
third of residents also receive supplies only two days
in a week, while one tenth receive no supplies at all.
6.8 Efficiency
GWCL‟s efficiency indicators include water production rates, water sales, percentage of non
revenue water, bill collection ratio, production cost and total revenue among a few others.
See Annex 2 for details between 2005 and 2010.
6.8.1 Non Revenue Water
The level of non-revenue water (NRW) associated with a utility company is a proxy measure
of its efficiency. In the Management Contract between the Ghana Water Company and Aqua
Vitens Rand Limited, a target was set to reduce non-revenue water from 48% in 2005 to
25% by 2010. By the end of 2010, non-revenue water was still about 49.3%. Figure 5 below
provides a trend in non-revenue water, showing targets and achievements from 2005 to
2010.
Figure 5: Non-revenue water: Targets and achievements
Source: Calculations based on NRW targets set in the 2006 Management Contract, using a baseline NRW figure of 50%.
Figures for actual NRW obtained from GWCL.
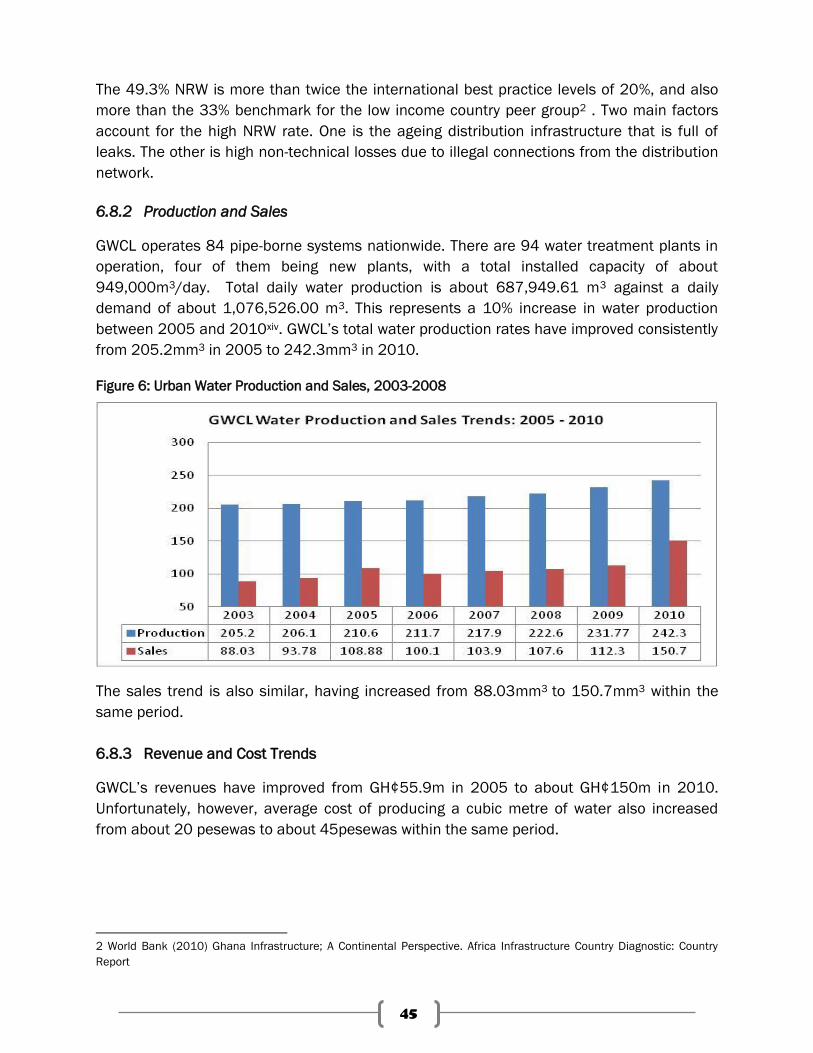
45
The 49.3% NRW is more than twice the international best practice levels of 20%, and also
more than the 33% benchmark for the low income country peer group2 . Two main factors
account for the high NRW rate. One is the ageing distribution infrastructure that is full of
leaks. The other is high non-technical losses due to illegal connections from the distribution
network.
6.8.2 Production and Sales
GWCL operates 84 pipe-borne systems nationwide. There are 94 water treatment plants in
operation, four of them being new plants, with a total installed capacity of about
949,000m3/day. Total daily water production is about 687,949.61 m3 against a daily
demand of about 1,076,526.00 m3. This represents a 10% increase in water production
between 2005 and 2010xiv. GWCL‟s total water production rates have improved consistently
from 205.2mm3 in 2005 to 242.3mm3 in 2010.
Figure 6: Urban Water Production and Sales, 2003-2008
The sales trend is also similar, having increased from 88.03mm3 to 150.7mm3 within the
same period.
6.8.3 Revenue and Cost Trends
GWCL‟s revenues have improved from GH¢55.9m in 2005 to about GH¢150m in 2010.
Unfortunately, however, average cost of producing a cubic metre of water also increased
from about 20 pesewas to about 45pesewas within the same period.
2 World Bank (2010) Ghana Infrastructure; A Continental Perspective. Africa Infrastructure Country Diagnostic: Country
Report
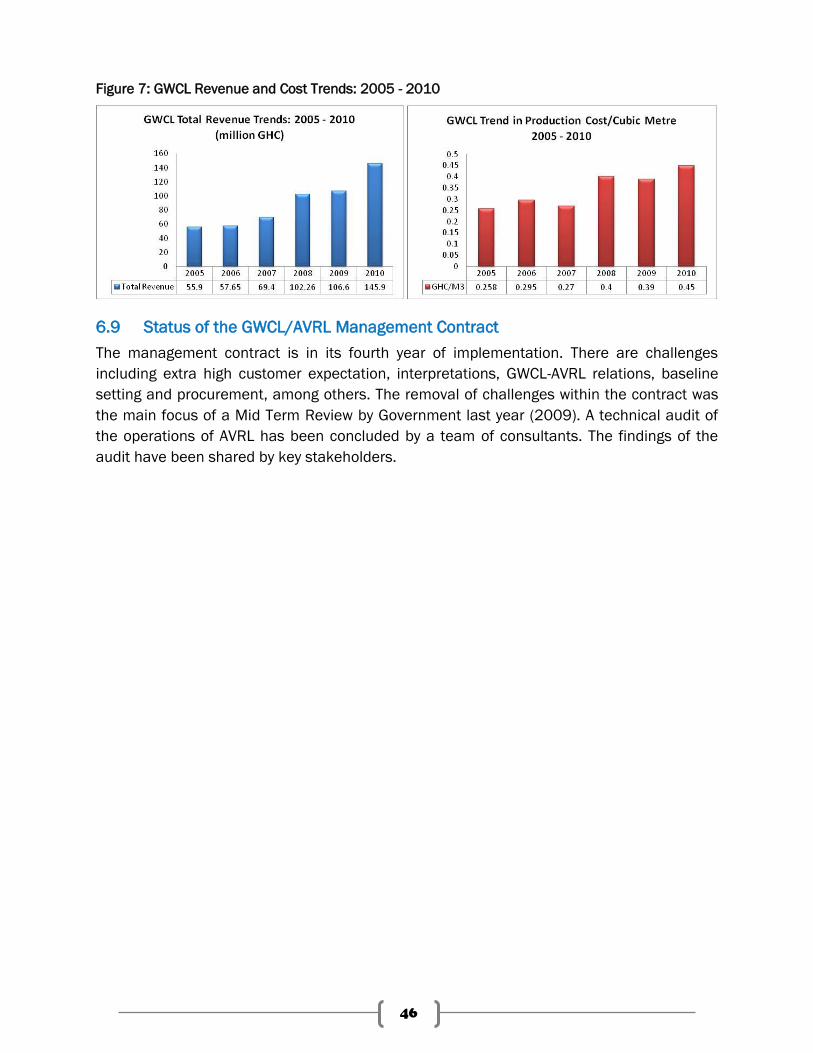
46
Figure 7: GWCL Revenue and Cost Trends: 2005 - 2010
6.9 Status of the GWCL/AVRL Management Contract
The management contract is in its fourth year of implementation. There are challenges
including extra high customer expectation, interpretations, GWCL-AVRL relations, baseline
setting and procurement, among others. The removal of challenges within the contract was
the main focus of a Mid Term Review by Government last year (2009). A technical audit of
the operations of AVRL has been concluded by a team of consultants. The findings of the
audit have been shared by key stakeholders.
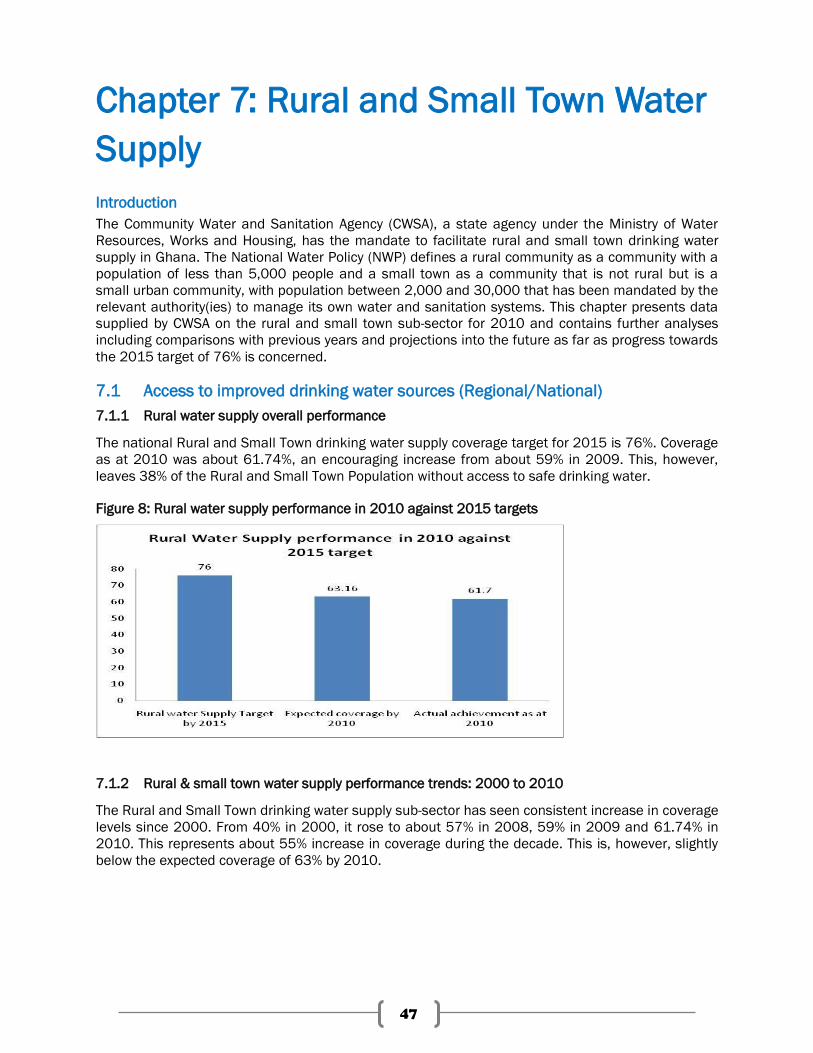
47
Chapter 7: Rural and Small Town Water
Supply
Introduction
The Community Water and Sanitation Agency (CWSA), a state agency under the Ministry of Water
Resources, Works and Housing, has the mandate to facilitate rural and small town drinking water
supply in Ghana. The National Water Policy (NWP) defines a rural community as a community with a
population of less than 5,000 people and a small town as a community that is not rural but is a
small urban community, with population between 2,000 and 30,000 that has been mandated by the
relevant authority(ies) to manage its own water and sanitation systems. This chapter presents data
supplied by CWSA on the rural and small town sub-sector for 2010 and contains further analyses
including comparisons with previous years and projections into the future as far as progress towards
the 2015 target of 76% is concerned.
7.1 Access to improved drinking water sources (Regional/National)
7.1.1 Rural water supply overall performance
The national Rural and Small Town drinking water supply coverage target for 2015 is 76%. Coverage
as at 2010 was about 61.74%, an encouraging increase from about 59% in 2009. This, however,
leaves 38% of the Rural and Small Town Population without access to safe drinking water.
Figure 8: Rural water supply performance in 2010 against 2015 targets
7.1.2 Rural & small town water supply performance trends: 2000 to 2010
The Rural and Small Town drinking water supply sub-sector has seen consistent increase in coverage
levels since 2000. From 40% in 2000, it rose to about 57% in 2008, 59% in 2009 and 61.74% in
2010. This represents about 55% increase in coverage during the decade. This is, however, slightly
below the expected coverage of 63% by 2010.
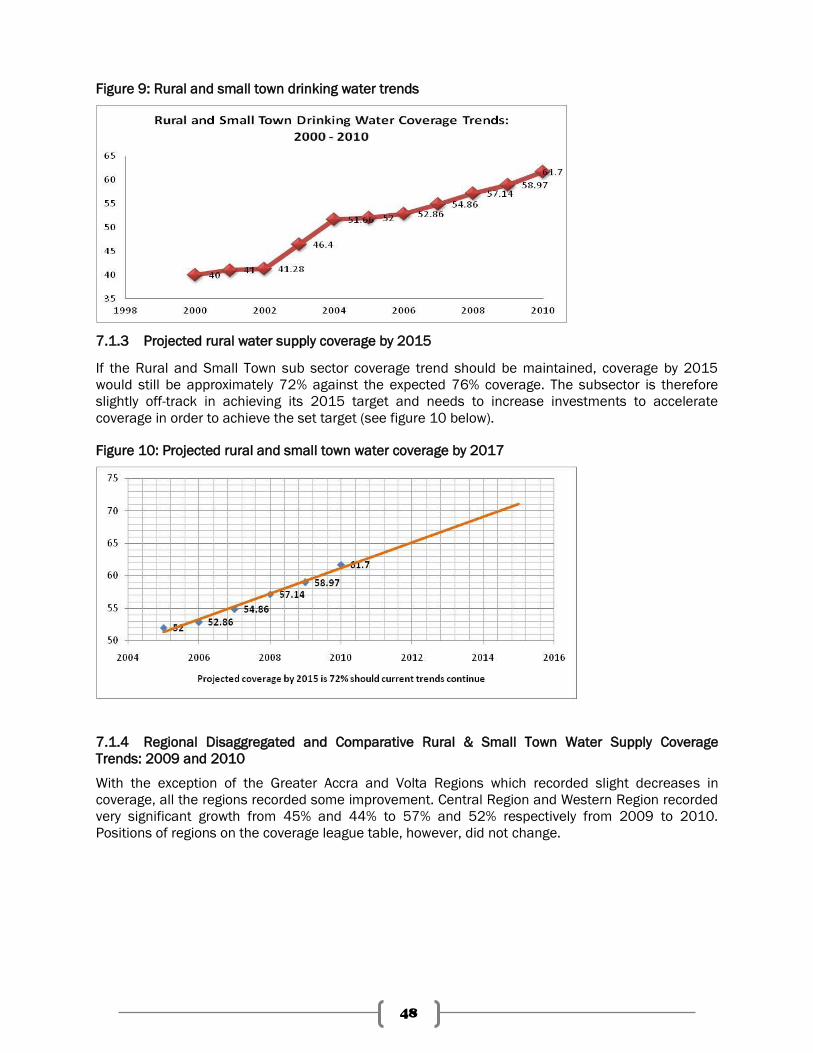
48
Figure 9: Rural and small town drinking water trends
7.1.3 Projected rural water supply coverage by 2015
If the Rural and Small Town sub sector coverage trend should be maintained, coverage by 2015
would still be approximately 72% against the expected 76% coverage. The subsector is therefore
slightly off-track in achieving its 2015 target and needs to increase investments to accelerate
coverage in order to achieve the set target (see figure 10 below).
Figure 10: Projected rural and small town water coverage by 2017
7.1.4 Regional Disaggregated and Comparative Rural & Small Town Water Supply Coverage
Trends: 2009 and 2010
With the exception of the Greater Accra and Volta Regions which recorded slight decreases in
coverage, all the regions recorded some improvement. Central Region and Western Region recorded
very significant growth from 45% and 44% to 57% and 52% respectively from 2009 to 2010.
Positions of regions on the coverage league table, however, did not change.
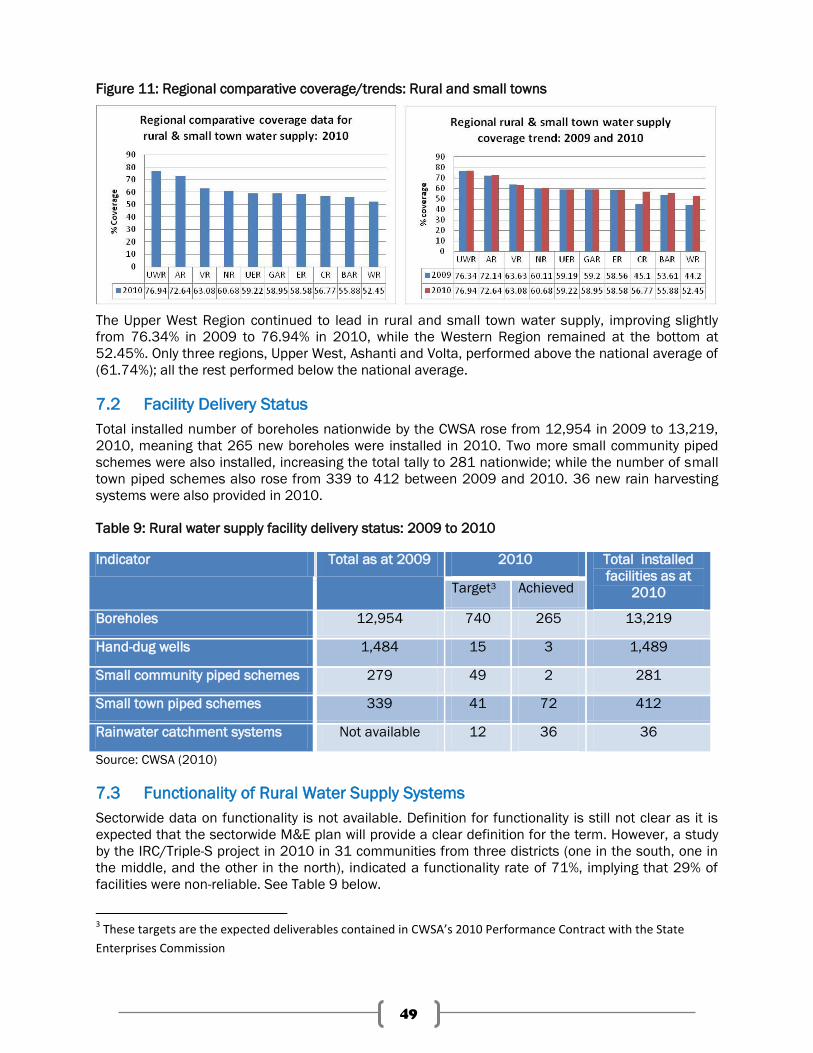
49
Figure 11: Regional comparative coverage/trends: Rural and small towns
The Upper West Region continued to lead in rural and small town water supply, improving slightly
from 76.34% in 2009 to 76.94% in 2010, while the Western Region remained at the bottom at
52.45%. Only three regions, Upper West, Ashanti and Volta, performed above the national average of
(61.74%); all the rest performed below the national average.
7.2 Facility Delivery Status
Total installed number of boreholes nationwide by the CWSA rose from 12,954 in 2009 to 13,219,
2010, meaning that 265 new boreholes were installed in 2010. Two more small community piped
schemes were also installed, increasing the total tally to 281 nationwide; while the number of small
town piped schemes also rose from 339 to 412 between 2009 and 2010. 36 new rain harvesting
systems were also provided in 2010.
Table 9: Rural water supply facility delivery status: 2009 to 2010
Indicator Total as at 2009 2010 Total installed
facilities as at
2010 Target3 Achieved
Boreholes 12,954 740 265 13,219
Hand-dug wells 1,484 15 3 1,489
Small community piped schemes 279 49 2 281
Small town piped schemes 339 41 72 412
Rainwater catchment systems Not available 12 36 36
Source: CWSA (2010)
7.3 Functionality of Rural Water Supply Systems
Sectorwide data on functionality is not available. Definition for functionality is still not clear as it is
expected that the sectorwide M&E plan will provide a clear definition for the term. However, a study
by the IRC/Triple-S project in 2010 in 31 communities from three districts (one in the south, one in
the middle, and the other in the north), indicated a functionality rate of 71%, implying that 29% of
facilities were non-reliable. See Table 9 below.
3 These targets are the expected deliverables contained in CWSA’s 2010 Performance Contract with the State
Enterprises Commission
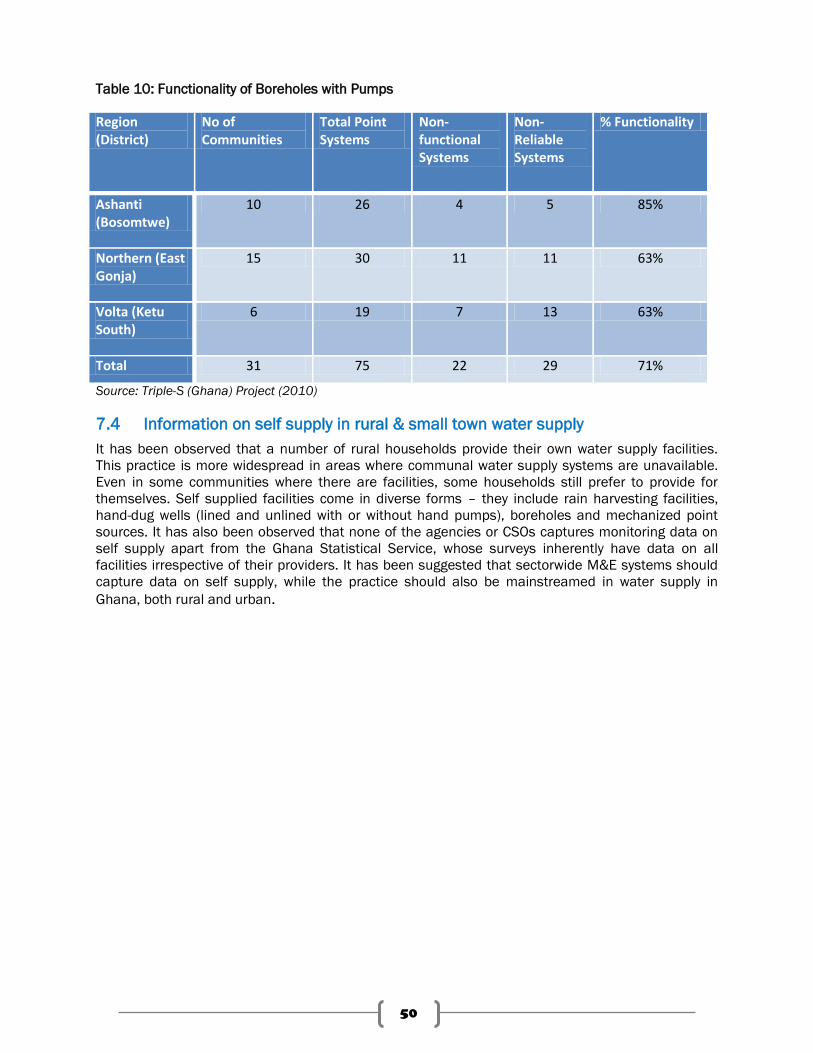
50
Table 10: Functionality of Boreholes with Pumps
Region (District)
No of Communities
Total Point Systems
Non-functional Systems
Non-Reliable Systems
% Functionality
Ashanti (Bosomtwe)
10 26 4 5 85%
Northern (East Gonja)
15 30 11 11 63%
Volta (Ketu South)
6 19 7 13 63%
Total 31 75 22 29 71%
Source: Triple-S (Ghana) Project (2010)
7.4 Information on self supply in rural & small town water supply
It has been observed that a number of rural households provide their own water supply facilities.
This practice is more widespread in areas where communal water supply systems are unavailable.
Even in some communities where there are facilities, some households still prefer to provide for
themselves. Self supplied facilities come in diverse forms – they include rain harvesting facilities,
hand-dug wells (lined and unlined with or without hand pumps), boreholes and mechanized point
sources. It has also been observed that none of the agencies or CSOs captures monitoring data on
self supply apart from the Ghana Statistical Service, whose surveys inherently have data on all
facilities irrespective of their providers. It has been suggested that sectorwide M&E systems should
capture data on self supply, while the practice should also be mainstreamed in water supply in
Ghana, both rural and urban.
51
Chapter 8: Sanitation
Introduction
The scope of sanitation for the purpose of this report is limited to the provision of, access to
and use of household toilet facilities. This chapter provides some available information on
sanitation as at 2010.
8.1 Access to Improved Household Toilet Facilities – provider-based data
No provider agency in Ghana had a nationwide coverage data on access to basic sanitation
as at 2010. The only provider-based nationwide data on access to household toilet facilities
was a baseline survey compiled in 2007/2008 by the District Environmental Health Units
(DEHU) and Waste Management Departments countrywide to facilitate the development of
their District Environmental Sanitation Strategy and Action Plans (DESSAPs). It must be
noted that this data is skewed towards urban human settlements and captured 'improved
but shared' household facilities as improved. According to the surveys, the proportion of
households relying on an improved household sanitation facility was estimated at 76%,
while 7% of the population relied on pan latrinesxv.
It must be emphasized here that Ghana is yet to find a clear definition for an improved toilet
facility as the country is still debating whether some household toilet facilities that are
shared by two or more households should be considered improved or not. The United
Nations does not currently classify shared toilet facilities as improved even though there are
perceptions that some shared facilities might possess all the indicators of an improved toilet
facility.
The Ministry of Local Government and Rural Development (MLGRD), through the
Environmental Health and Sanitation Directorate (EHSD) is planning a nationwide research,
in collaboration with the Water and Sanitation Monitoring Platform (WSMP) of the Ministry of
Water Resources Works and Housing (MWRWH), to determine the extent to which shared
toilet facilities could be classified as improved or unimproved and it is hoped that an answer
will be found by the end of 2011.
8.2 Access to Improved Household Toilet Facilities – user-based data
In the absence of adequate provider-based4 data, WASH stakeholders have mostly used the
Ghana Statistical Service generated Demographic and Health Survey (2008) data in various
presentations in recent years.
4 This is partly because the baseline data by the DEHUs have not yet been updated since 2008, neither has there
been sectorwide adoption of how the indicators were defined.
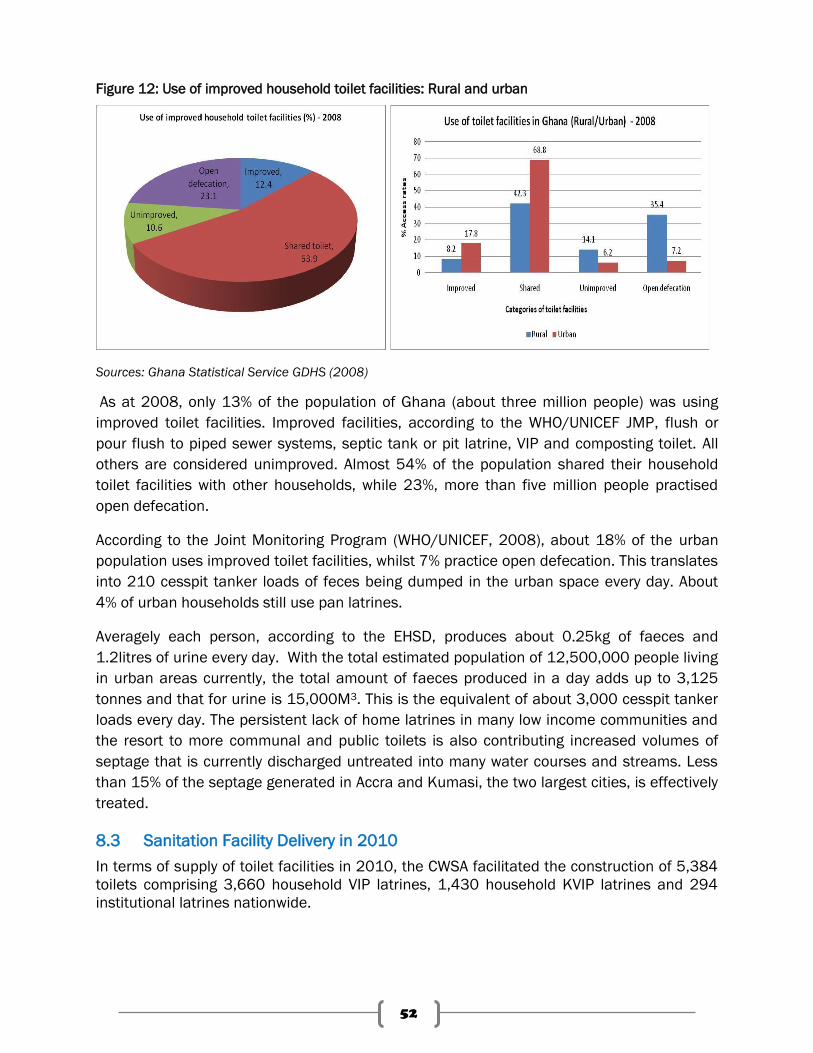
52
Figure 12: Use of improved household toilet facilities: Rural and urban
Sources: Ghana Statistical Service GDHS (2008)
As at 2008, only 13% of the population of Ghana (about three million people) was using
improved toilet facilities. Improved facilities, according to the WHO/UNICEF JMP, flush or
pour flush to piped sewer systems, septic tank or pit latrine, VIP and composting toilet. All
others are considered unimproved. Almost 54% of the population shared their household
toilet facilities with other households, while 23%, more than five million people practised
open defecation.
According to the Joint Monitoring Program (WHO/UNICEF, 2008), about 18% of the urban
population uses improved toilet facilities, whilst 7% practice open defecation. This translates
into 210 cesspit tanker loads of feces being dumped in the urban space every day. About
4% of urban households still use pan latrines.
Averagely each person, according to the EHSD, produces about 0.25kg of faeces and
1.2litres of urine every day. With the total estimated population of 12,500,000 people living
in urban areas currently, the total amount of faeces produced in a day adds up to 3,125
tonnes and that for urine is 15,000M3. This is the equivalent of about 3,000 cesspit tanker
loads every day. The persistent lack of home latrines in many low income communities and
the resort to more communal and public toilets is also contributing increased volumes of
septage that is currently discharged untreated into many water courses and streams. Less
than 15% of the septage generated in Accra and Kumasi, the two largest cities, is effectively
treated.
8.3 Sanitation Facility Delivery in 2010
In terms of supply of toilet facilities in 2010, the CWSA facilitated the construction of 5,384
toilets comprising 3,660 household VIP latrines, 1,430 household KVIP latrines and 294
institutional latrines nationwide.
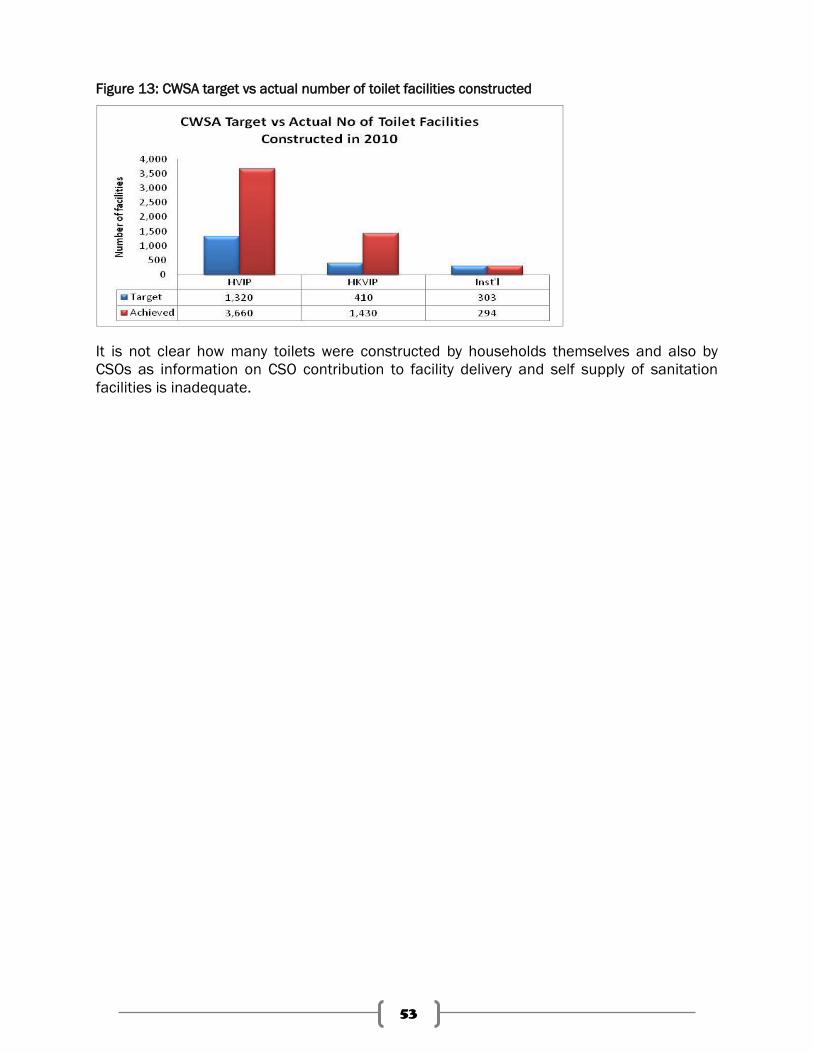
53
Figure 13: CWSA target vs actual number of toilet facilities constructed
It is not clear how many toilets were constructed by households themselves and also by
CSOs as information on CSO contribution to facility delivery and self supply of sanitation
facilities is inadequate.
54
Chapter 9: Hygiene
Introduction
Information in this chapter includes access to household handwashing facilities, household
water treatment and storage and hygiene-related events including world toilet day. There is
also information on the Community-led Total Sanitation (CLTS) as the new rural sanitation
model adopted by the Ministry of Local Government and Rural Development, as well as
hygiene-related capacity development efforts.
9.1 Access to Household Handwashing Facilities
The Community Water and Sanitation Agency, (CWSA) in collaboration with other public,
development agencies and private partners has developed a Public Private Partnership for
Handwashing with Soap Programme with the overall objective of improving the health of
ordinary Ghanaians through the tripling of rates of handwashing with soap via the public-
private partnership. Community Water and Sanitation Agency (CWSA) provided the anchor
and catalyst for this partnership under its mandate for water and sanitation delivery and
hygiene promotion. A communications campaign „Truly CLEAN Hands‟ to motivate
handwashing with soap, particularly among mothers and care-givers of children under 5
years, and school children, has been in place since December 2003.
There was no data on the number of households with access to handwashing facilities as at
2010. Stakeholders are currently working on sectorwide indicators, including indicators for
measuring hygiene. It is hoped that by the end of 2011, a set of harmonized WASH sector
indicators will be available and included in the Sector M&E Plan.
9.2 Handwashing Promotion Activities
With active facilitation by the CWSA, a number of handwashing promotion activities were
undertaken throughout 2010:
Publicity: Use of Mass media namely Internet websites, FM Stations, Newspaper Articles and
features.
Orientation: A number of sector stakeholders in sanitation, hygiene and food industry have been
trained and oriented on the importance of Handwashing with soap
Media/Children Encounter: Over 200 school children and teachers had encounter with close to 22
press men from 18 media houses on the Role of the media in promoting handwashing, Children as
change agents, importance of Global Handwashing Day and critical times for handwashing
Procession: 300 children from basic schools in volta Region went through the principal streets of Ho
to support the awareness creation efforts of Global Handwashing Day which was launched in the
Volta Region
Market Splash: Market women were educated on the need to wash hands with soap at Ashiaman
and Agbogbloshie Markets.
55
Schools Activities
The schools activities were carried out in Kabore cluster of schools in Ho, Corpus Christi
School in Tema and Mobole Distrct Assembly Basic School in Afienya, and Humjibere in
Western Region. There were about 10,000 pupils involved. One hundred teachers from the
schools were also given orientation. The Glo Germ kit was used to make contamination and
ways hands transmit germs visible. The school children were also engaged in discussions on
importance of handwashing with soap, critical times and ways of promoting handwashing at
schools, homes, communities.
Lorry Station Activity
This activity was done in collaboration Global Neighbourhood, where drivers and their mates,
regional and local executives of La Ghana Private Road Transport Union were given
orientation and also engaged 50 vehicles in a road show. The passengers at the Lorry
stations were sensitized about handwashing with soap. Posters and stickers were
distributed and pasted on vehicles to create awareness. Handwashing stations were
mounted for mass handwashing with soap.
9.3 Household Water Treatment and Storage (HWTS)
According to the 2008 Demographic and Health Survey (GDHS) conducted by the Ghana
Statistical Service report, about 8.7% of the population practised appropriate household
water treatment methods. Appropriate treatment methods, according to the GDHS, include
boiling, straining, filtering and solar disinfection.
In 2010, a Household Water Treatment and Safe Storage (HWTS) strategy was developed by
sector agencies under the leadership of the Ministry of Local Government and Rural
Development/ Environmental Health and Sanitation Directorate. The strategy gives direction
to how water can be kept safe throughout the water chain of fetching-transportation-storage-
usage. The strategy will be piloted in selected districts in central region after which the final
strategy will be implemented across the country. It is expected that the implementation of
the HWTS strategy will be done in tangent with the two other sector behaviour change focus
areas namely Handwashing with soap and safe disposal of human faeces including CLTS.
9.4 Capacity Development for Hygiene Promotion
The focus of the hygiene and sanitation promotion is to create awareness for sustained
behavioral change to ensure:
Safe confinement and disposal of excreta and other wastes
Safe handling and use of water
Personal, domestic and environmental hygiene
Regular handwashing with soap particularly at critical times.
The CWSA, as part of capacity development for hygiene promotion and sanitation in
communities, trained a number of committees to support the agenda. Table 10 below
provides information on 2010 capacity development activities nationwide for hygiene and
sanitation:
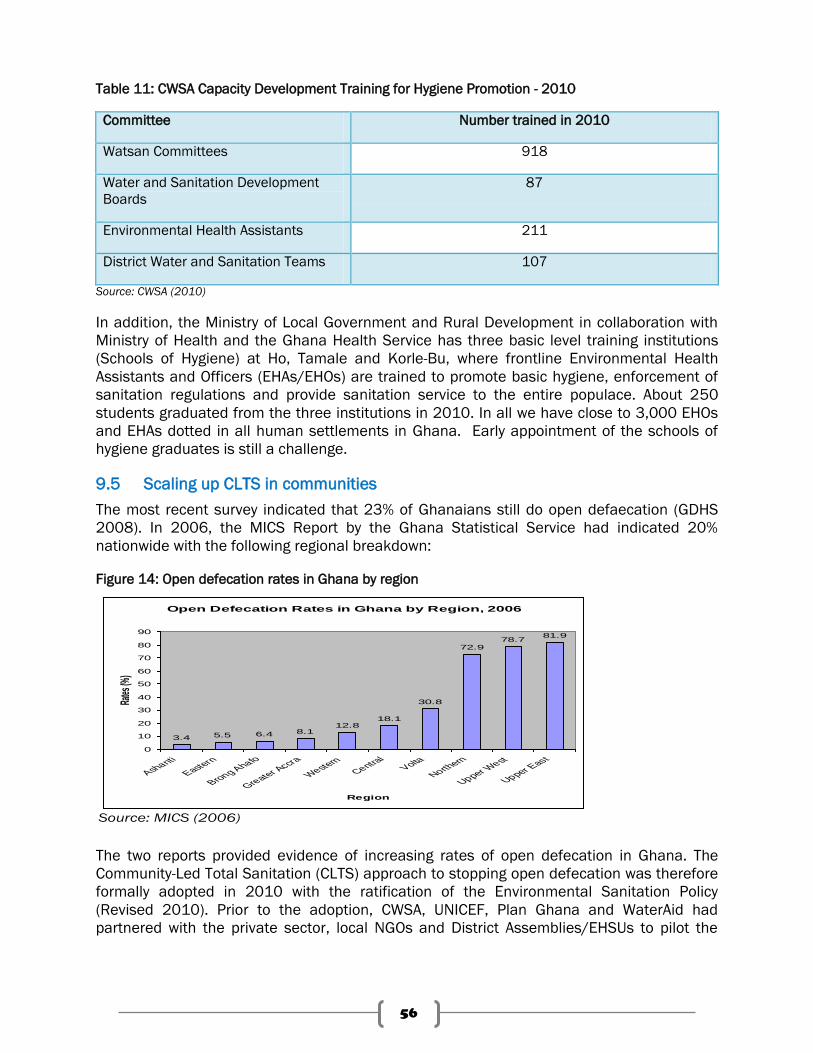
56
Table 11: CWSA Capacity Development Training for Hygiene Promotion - 2010
Committee Number trained in 2010
Watsan Committees 918
Water and Sanitation Development
Boards
87
Environmental Health Assistants 211
District Water and Sanitation Teams 107
Source: CWSA (2010)
In addition, the Ministry of Local Government and Rural Development in collaboration with
Ministry of Health and the Ghana Health Service has three basic level training institutions
(Schools of Hygiene) at Ho, Tamale and Korle-Bu, where frontline Environmental Health
Assistants and Officers (EHAs/EHOs) are trained to promote basic hygiene, enforcement of
sanitation regulations and provide sanitation service to the entire populace. About 250
students graduated from the three institutions in 2010. In all we have close to 3,000 EHOs
and EHAs dotted in all human settlements in Ghana. Early appointment of the schools of
hygiene graduates is still a challenge.
9.5 Scaling up CLTS in communities
The most recent survey indicated that 23% of Ghanaians still do open defaecation (GDHS
2008). In 2006, the MICS Report by the Ghana Statistical Service had indicated 20%
nationwide with the following regional breakdown:
Figure 14: Open defecation rates in Ghana by region
Open Defecation Rates in Ghana by Region, 2006
3.4 5.5 6.4 8.112.8
18.1
30.8
72.978.7
81.9
0
10
20
30
40
50
60
70
80
90
Ashanti
Eastern
Brong Ahafo
Greater Accra
Western
Central
Volta
Northern
Upper West
Upper East
Region
Rates
(%)
Source: MICS (2006)
The two reports provided evidence of increasing rates of open defecation in Ghana. The
Community-Led Total Sanitation (CLTS) approach to stopping open defecation was therefore
formally adopted in 2010 with the ratification of the Environmental Sanitation Policy
(Revised 2010). Prior to the adoption, CWSA, UNICEF, Plan Ghana and WaterAid had
partnered with the private sector, local NGOs and District Assemblies/EHSUs to pilot the
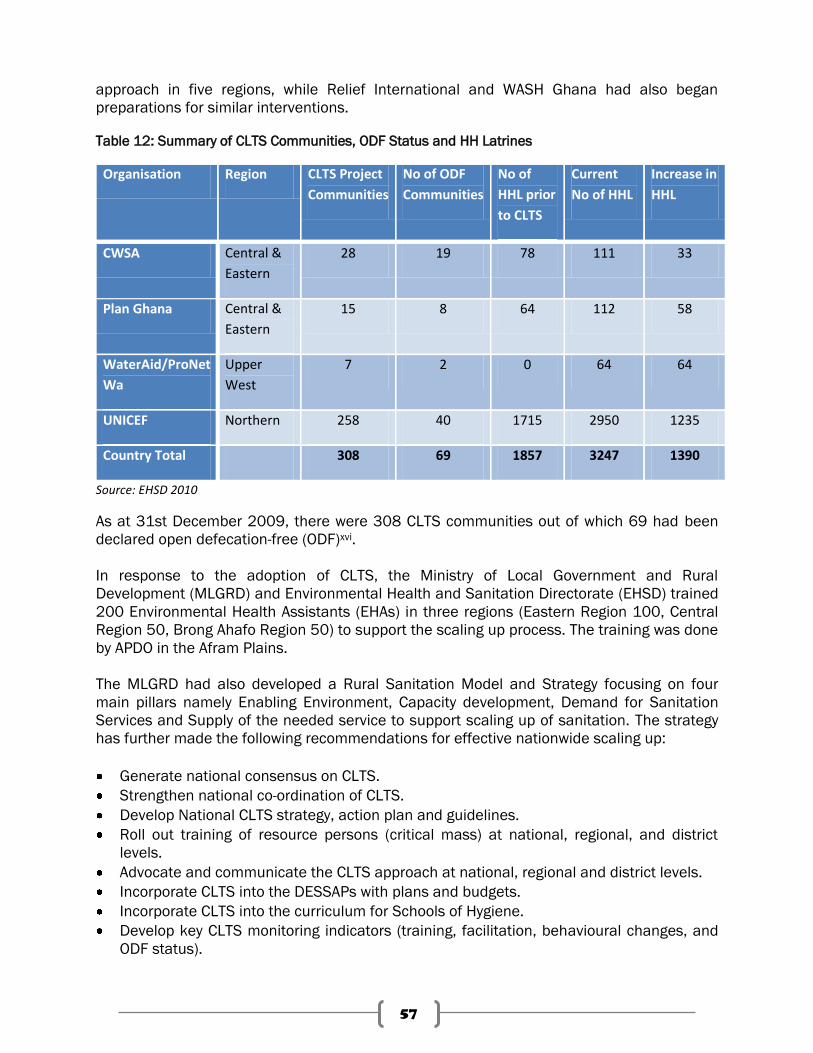
57
approach in five regions, while Relief International and WASH Ghana had also began
preparations for similar interventions.
Table 12: Summary of CLTS Communities, ODF Status and HH Latrines
Organisation Region CLTS Project
Communities
No of ODF
Communities
No of
HHL prior
to CLTS
Current
No of HHL
Increase in
HHL
CWSA Central &
Eastern
28 19 78 111 33
Plan Ghana Central &
Eastern
15 8 64 112 58
WaterAid/ProNet
Wa
Upper
West
7 2 0 64 64
UNICEF Northern 258 40 1715 2950 1235
Country Total 308 69 1857 3247 1390
Source: EHSD 2010
As at 31st December 2009, there were 308 CLTS communities out of which 69 had been
declared open defecation-free (ODF)xvi.
In response to the adoption of CLTS, the Ministry of Local Government and Rural
Development (MLGRD) and Environmental Health and Sanitation Directorate (EHSD) trained
200 Environmental Health Assistants (EHAs) in three regions (Eastern Region 100, Central
Region 50, Brong Ahafo Region 50) to support the scaling up process. The training was done
by APDO in the Afram Plains.
The MLGRD had also developed a Rural Sanitation Model and Strategy focusing on four
main pillars namely Enabling Environment, Capacity development, Demand for Sanitation
Services and Supply of the needed service to support scaling up of sanitation. The strategy
has further made the following recommendations for effective nationwide scaling up:
Generate national consensus on CLTS.
Strengthen national co-ordination of CLTS.
Develop National CLTS strategy, action plan and guidelines.
Roll out training of resource persons (critical mass) at national, regional, and district
levels.
Advocate and communicate the CLTS approach at national, regional and district levels.
Incorporate CLTS into the DESSAPs with plans and budgets.
Incorporate CLTS into the curriculum for Schools of Hygiene.
Develop key CLTS monitoring indicators (training, facilitation, behavioural changes, and
ODF status).
58
Research into suitable low-cost technology options for the various unique conditions.
Identify and strengthen centres for CLTS knowledge processing, management and
dissemination.
9.6 ODF Community Awards
As part of the world toilet day celebration, 20 cleanest Open Defaecation Free (ODF)
communities from Northern, Central, Upper West and Eastern Regions were given awards
for their efforts in ensuring open defaecation free communities.
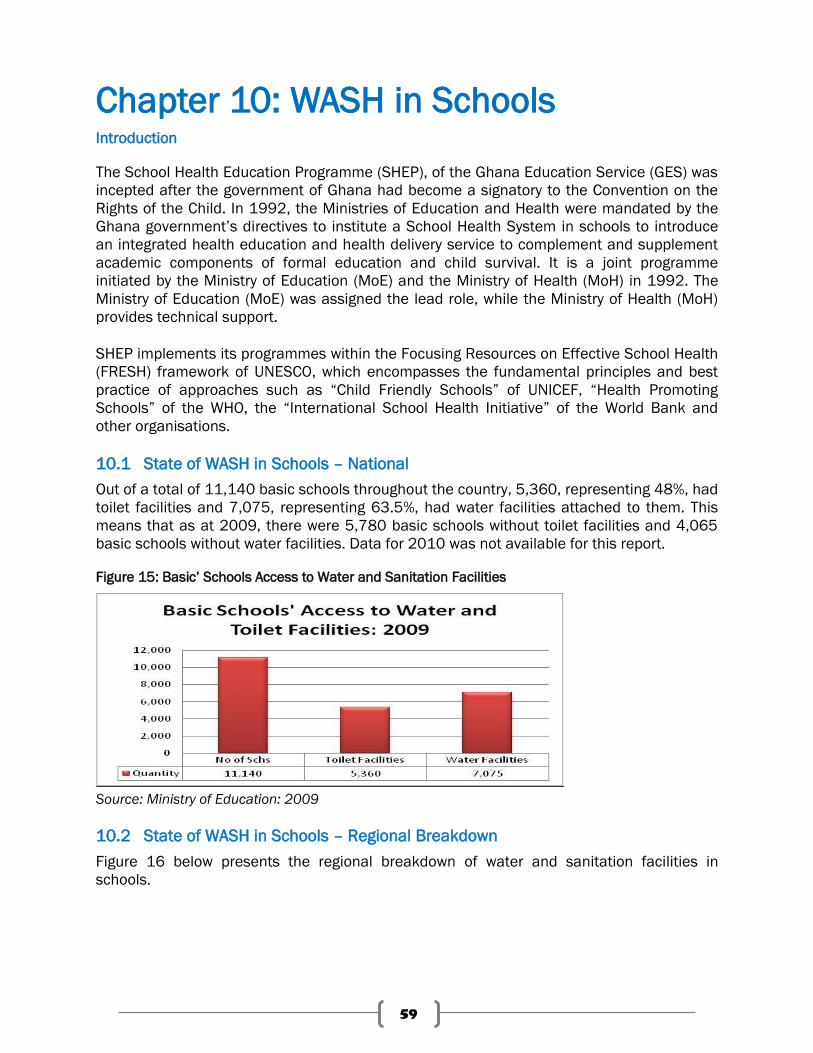
59
Chapter 10: WASH in Schools
Introduction
The School Health Education Programme (SHEP), of the Ghana Education Service (GES) was
incepted after the government of Ghana had become a signatory to the Convention on the
Rights of the Child. In 1992, the Ministries of Education and Health were mandated by the
Ghana government‟s directives to institute a School Health System in schools to introduce
an integrated health education and health delivery service to complement and supplement
academic components of formal education and child survival. It is a joint programme
initiated by the Ministry of Education (MoE) and the Ministry of Health (MoH) in 1992. The
Ministry of Education (MoE) was assigned the lead role, while the Ministry of Health (MoH)
provides technical support.
SHEP implements its programmes within the Focusing Resources on Effective School Health
(FRESH) framework of UNESCO, which encompasses the fundamental principles and best
practice of approaches such as “Child Friendly Schools” of UNICEF, “Health Promoting
Schools” of the WHO, the “International School Health Initiative” of the World Bank and
other organisations.
10.1 State of WASH in Schools – National
Out of a total of 11,140 basic schools throughout the country, 5,360, representing 48%, had
toilet facilities and 7,075, representing 63.5%, had water facilities attached to them. This
means that as at 2009, there were 5,780 basic schools without toilet facilities and 4,065
basic schools without water facilities. Data for 2010 was not available for this report.
Figure 15: Basic‟ Schools Access to Water and Sanitation Facilities
Source: Ministry of Education: 2009
10.2 State of WASH in Schools – Regional Breakdown
Figure 16 below presents the regional breakdown of water and sanitation facilities in
schools.
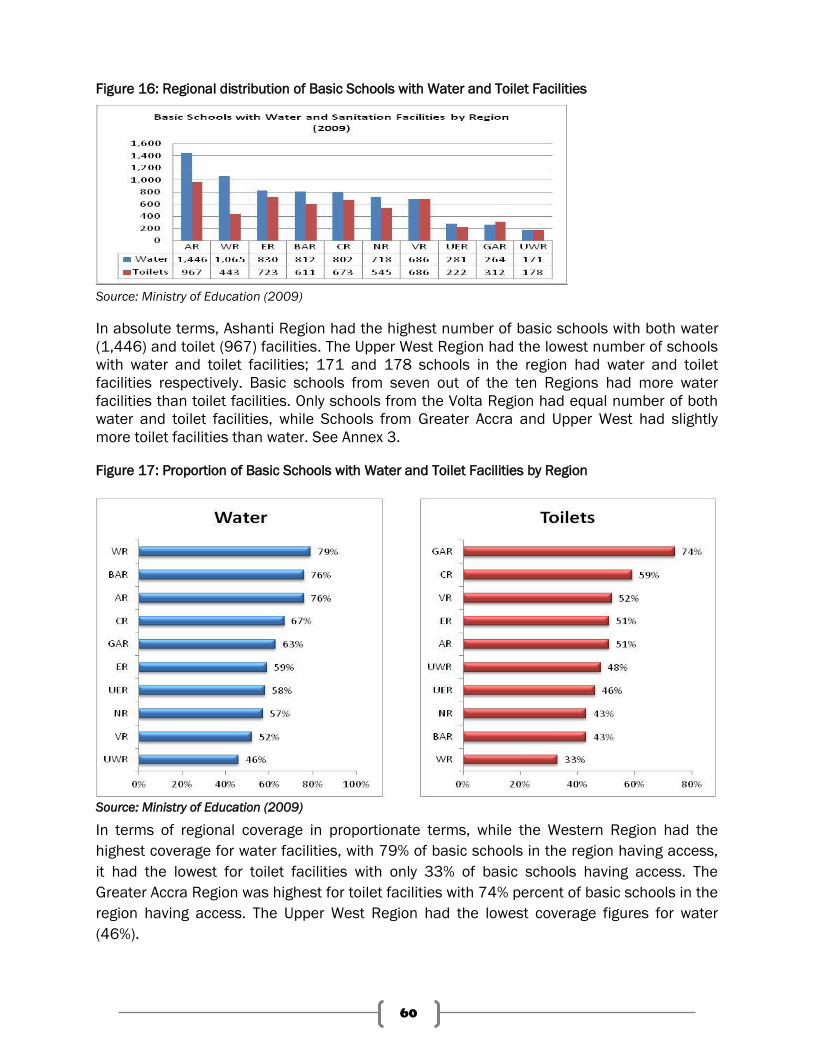
60
Figure 16: Regional distribution of Basic Schools with Water and Toilet Facilities
Source: Ministry of Education (2009)
In absolute terms, Ashanti Region had the highest number of basic schools with both water
(1,446) and toilet (967) facilities. The Upper West Region had the lowest number of schools
with water and toilet facilities; 171 and 178 schools in the region had water and toilet
facilities respectively. Basic schools from seven out of the ten Regions had more water
facilities than toilet facilities. Only schools from the Volta Region had equal number of both
water and toilet facilities, while Schools from Greater Accra and Upper West had slightly
more toilet facilities than water. See Annex 3.
Figure 17: Proportion of Basic Schools with Water and Toilet Facilities by Region
Source: Ministry of Education (2009)
In terms of regional coverage in proportionate terms, while the Western Region had the
highest coverage for water facilities, with 79% of basic schools in the region having access,
it had the lowest for toilet facilities with only 33% of basic schools having access. The
Greater Accra Region was highest for toilet facilities with 74% percent of basic schools in the
region having access. The Upper West Region had the lowest coverage figures for water
(46%).
61
10.3 School WASH Activities Implemented in 2010
In 2010, the Ministry of Education revised the Education Strategic Plan (ESP) 2010-2020
which clearly emphasized the importance of water and sanitation in schools. The ESP sets
targets of ensuring that all basic education schools are rehabilitated in terms of safety,
sanitation and health by 2015 and 75% of schools would have access to water by 2020.
Other major activities undertaken by SHEP in 2010 include the following:
SHEP conducted routine monitoring of schools to assess the level of WASH in Schools
(WinS) implementation. Activities centred around inspection of School WASH facilities,
sensitization of teachers and food vendors in selected schools across the country.
For policy direction, well coordinated and harmonized Health Education delivery in
schools in Ghana, the SHEP with technical and financial support from UNICEF has
developed a National SHEP Policy and Strategic Framework awaiting approval from the
Ministry of Education.
With support from Zoomlion and other collaborators, the SHEP conducted an award
ceremony for schools which exhibited high standards of sanitation and hygiene at the
Healthy Schools Environment Competition in 2009.
Orientation on handwashing with soap was conducted for School Food Vendors and
Caterers of Ghana School Feeding Programme to create awareness on the need for
handwashing at critical times. This activity was conducted in collaboration with the
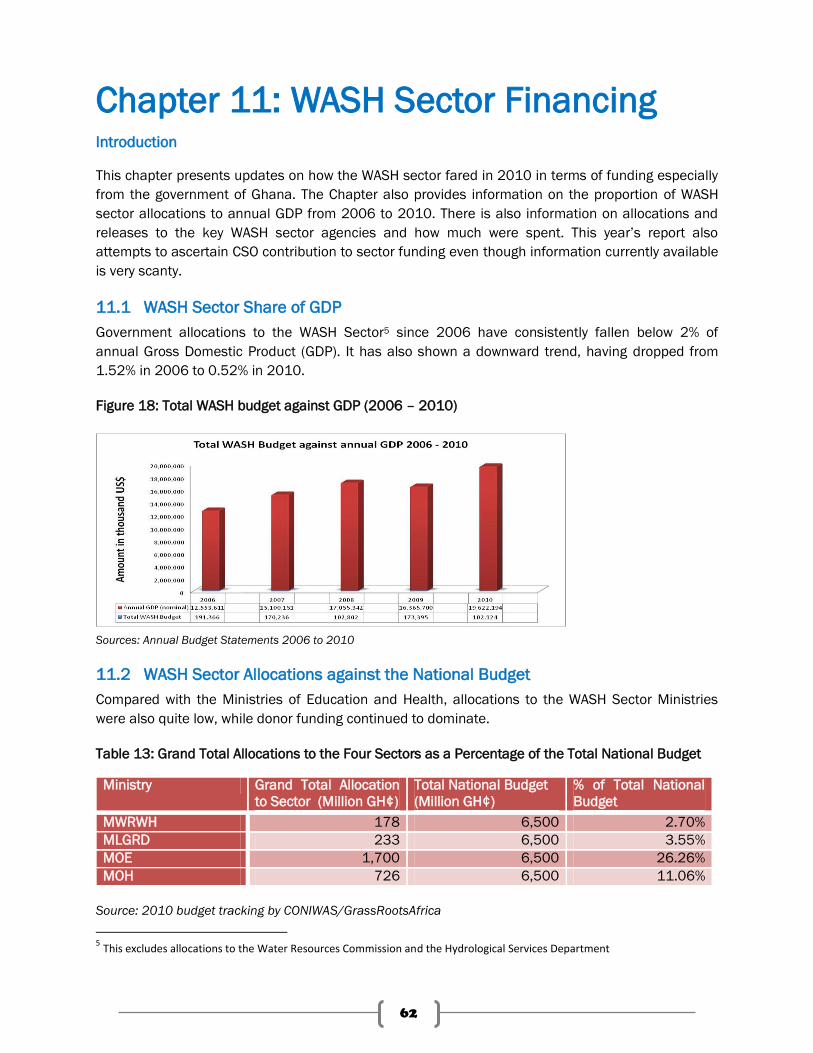
62
Chapter 11: WASH Sector Financing Introduction
This chapter presents updates on how the WASH sector fared in 2010 in terms of funding especially
from the government of Ghana. The Chapter also provides information on the proportion of WASH
sector allocations to annual GDP from 2006 to 2010. There is also information on allocations and
releases to the key WASH sector agencies and how much were spent. This year‟s report also
attempts to ascertain CSO contribution to sector funding even though information currently available
is very scanty.
11.1 WASH Sector Share of GDP
Government allocations to the WASH Sector5 since 2006 have consistently fallen below 2% of
annual Gross Domestic Product (GDP). It has also shown a downward trend, having dropped from
1.52% in 2006 to 0.52% in 2010.
Figure 18: Total WASH budget against GDP (2006 – 2010)
Sources: Annual Budget Statements 2006 to 2010
11.2 WASH Sector Allocations against the National Budget
Compared with the Ministries of Education and Health, allocations to the WASH Sector Ministries
were also quite low, while donor funding continued to dominate.
Table 13: Grand Total Allocations to the Four Sectors as a Percentage of the Total National Budget
Ministry Grand Total Allocation
to Sector (Million GH¢)
Total National Budget
(Million GH¢)
% of Total National
Budget
MWRWH 178 6,500 2.70%
MLGRD 233 6,500 3.55%
MOE 1,700 6,500 26.26%
MOH 726 6,500 11.06%
Source: 2010 budget tracking by CONIWAS/GrassRootsAfrica
5 This excludes allocations to the Water Resources Commission and the Hydrological Services Department
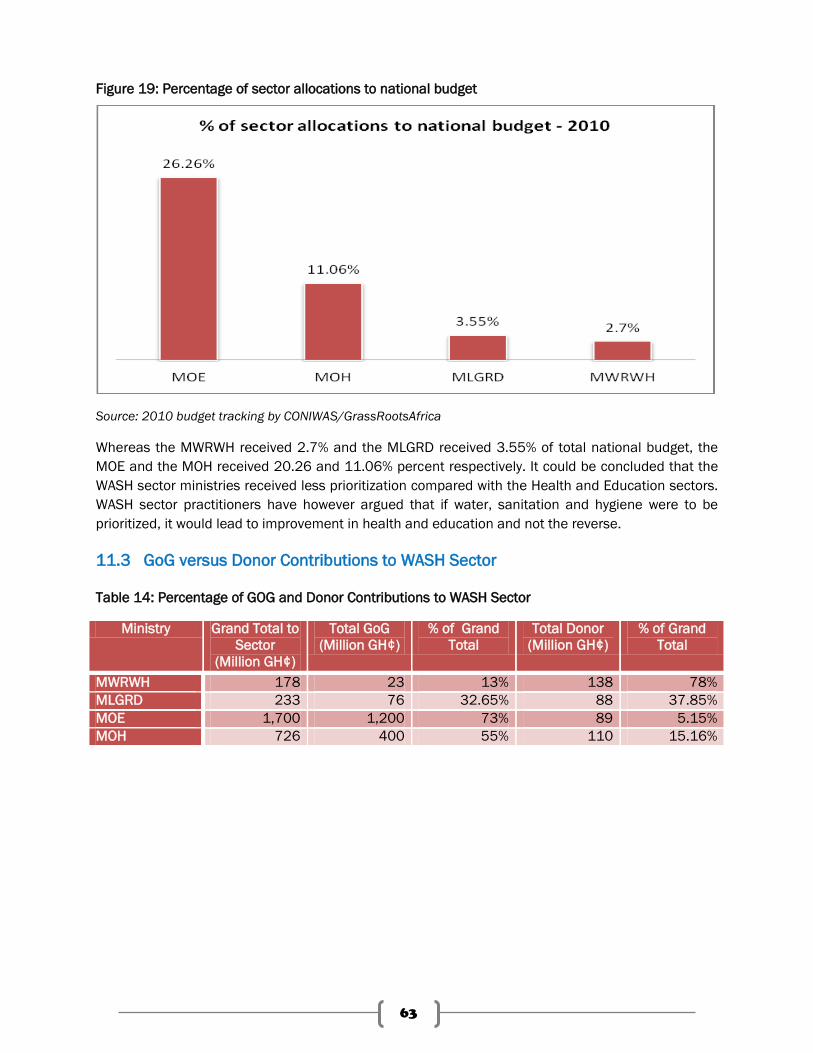
63
Figure 19: Percentage of sector allocations to national budget
Source: 2010 budget tracking by CONIWAS/GrassRootsAfrica
Whereas the MWRWH received 2.7% and the MLGRD received 3.55% of total national budget, the
MOE and the MOH received 20.26 and 11.06% percent respectively. It could be concluded that the
WASH sector ministries received less prioritization compared with the Health and Education sectors.
WASH sector practitioners have however argued that if water, sanitation and hygiene were to be
prioritized, it would lead to improvement in health and education and not the reverse.
11.3 GoG versus Donor Contributions to WASH Sector
Table 14: Percentage of GOG and Donor Contributions to WASH Sector
Ministry Grand Total to
Sector
(Million GH¢)
Total GoG
(Million GH¢)
% of Grand
Total
Total Donor
(Million GH¢)
% of Grand
Total
MWRWH 178 23 13% 138 78%
MLGRD 233 76 32.65% 88 37.85%
MOE 1,700 1,200 73% 89 5.15%
MOH 726 400 55% 110 15.16%
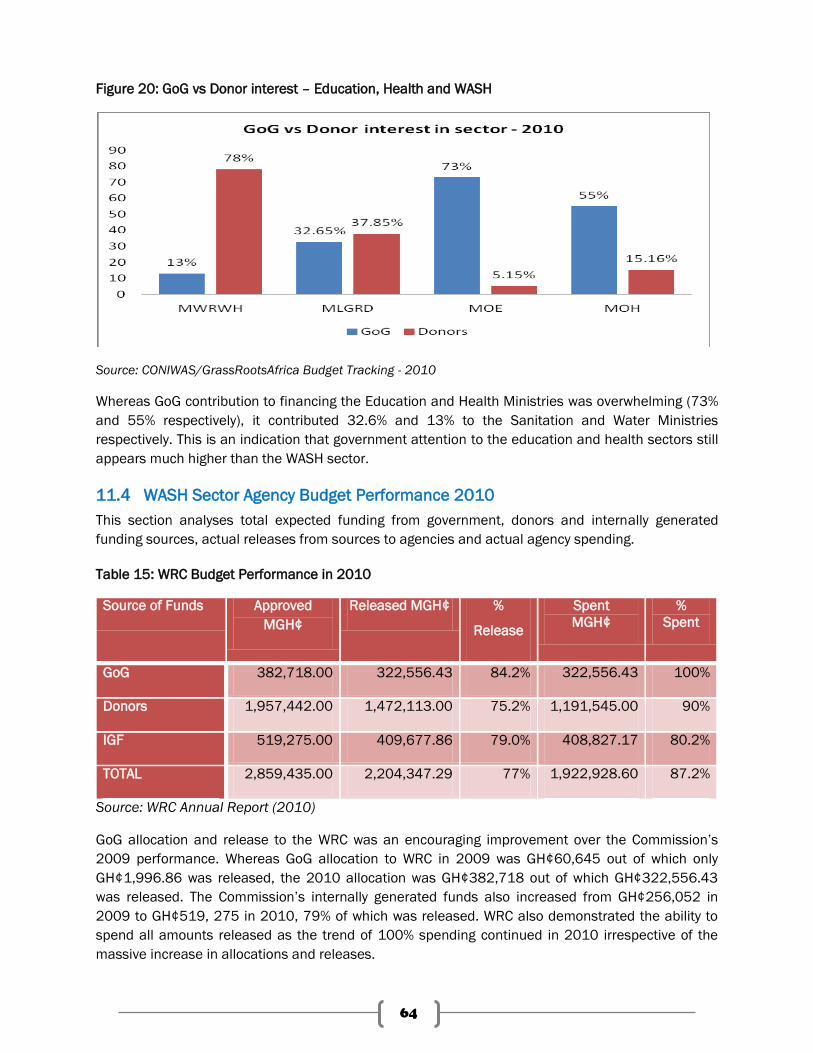
64
Figure 20: GoG vs Donor interest – Education, Health and WASH
Source: CONIWAS/GrassRootsAfrica Budget Tracking - 2010
Whereas GoG contribution to financing the Education and Health Ministries was overwhelming (73%
and 55% respectively), it contributed 32.6% and 13% to the Sanitation and Water Ministries
respectively. This is an indication that government attention to the education and health sectors still
appears much higher than the WASH sector.
11.4 WASH Sector Agency Budget Performance 2010
This section analyses total expected funding from government, donors and internally generated
funding sources, actual releases from sources to agencies and actual agency spending.
Table 15: WRC Budget Performance in 2010
Source of Funds Approved
MGH¢
Released MGH¢ %
Release
Spent
MGH¢
%
Spent
GoG 382,718.00 322,556.43 84.2% 322,556.43 100%
Donors 1,957,442.00 1,472,113.00 75.2% 1,191,545.00 90%
IGF 519,275.00 409,677.86 79.0% 408,827.17 80.2%
TOTAL 2,859,435.00 2,204,347.29 77% 1,922,928.60 87.2%
Source: WRC Annual Report (2010)
GoG allocation and release to the WRC was an encouraging improvement over the Commission‟s
2009 performance. Whereas GoG allocation to WRC in 2009 was GH¢60,645 out of which only
GH¢1,996.86 was released, the 2010 allocation was GH¢382,718 out of which GH¢322,556.43
was released. The Commission‟s internally generated funds also increased from GH¢256,052 in
2009 to GH¢519, 275 in 2010, 79% of which was released. WRC also demonstrated the ability to
spend all amounts released as the trend of 100% spending continued in 2010 irrespective of the
massive increase in allocations and releases.
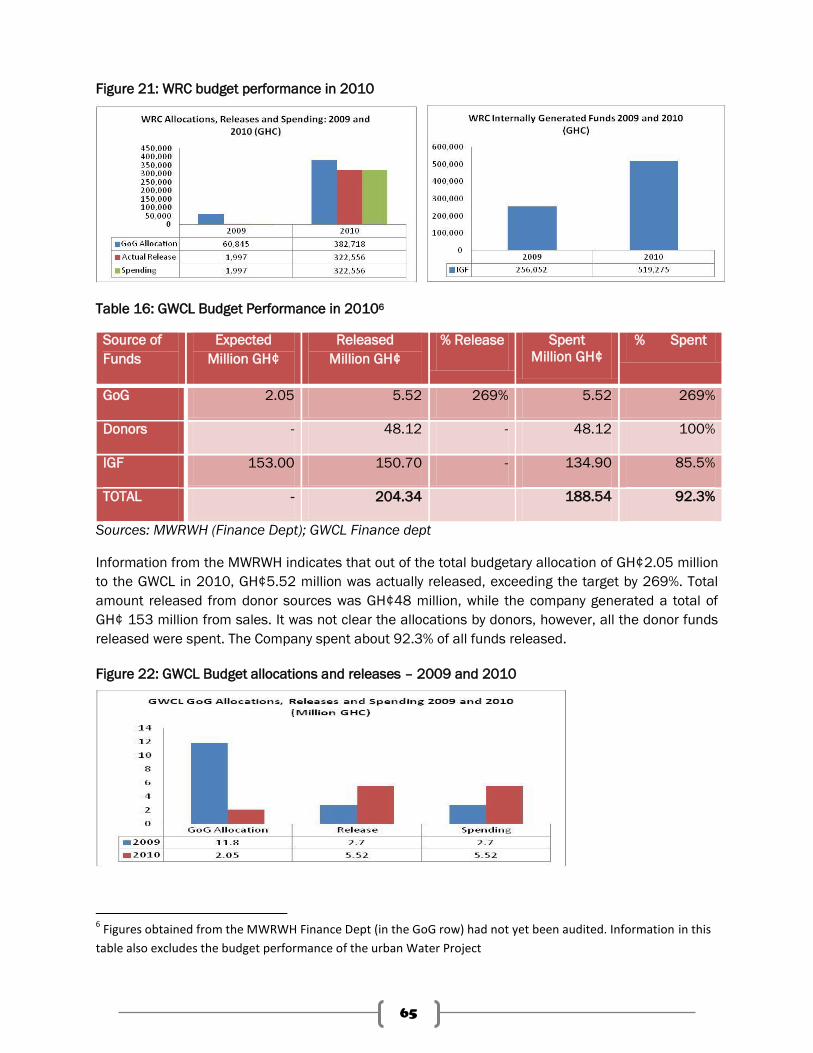
65
Figure 21: WRC budget performance in 2010
Table 16: GWCL Budget Performance in 20106
Source of
Funds
Expected
Million GH¢
Released
Million GH¢
% Release Spent
Million GH¢
% Spent
GoG 2.05 5.52 269% 5.52 269%
Donors - 48.12 - 48.12 100%
IGF 153.00 150.70 - 134.90 85.5%
TOTAL - 204.34 188.54 92.3%
Sources: MWRWH (Finance Dept); GWCL Finance dept
Information from the MWRWH indicates that out of the total budgetary allocation of GH¢2.05 million
to the GWCL in 2010, GH¢5.52 million was actually released, exceeding the target by 269%. Total
amount released from donor sources was GH¢48 million, while the company generated a total of
GH¢ 153 million from sales. It was not clear the allocations by donors, however, all the donor funds
released were spent. The Company spent about 92.3% of all funds released.
Figure 22: GWCL Budget allocations and releases – 2009 and 2010
6 Figures obtained from the MWRWH Finance Dept (in the GoG row) had not yet been audited. Information in this
table also excludes the budget performance of the urban Water Project
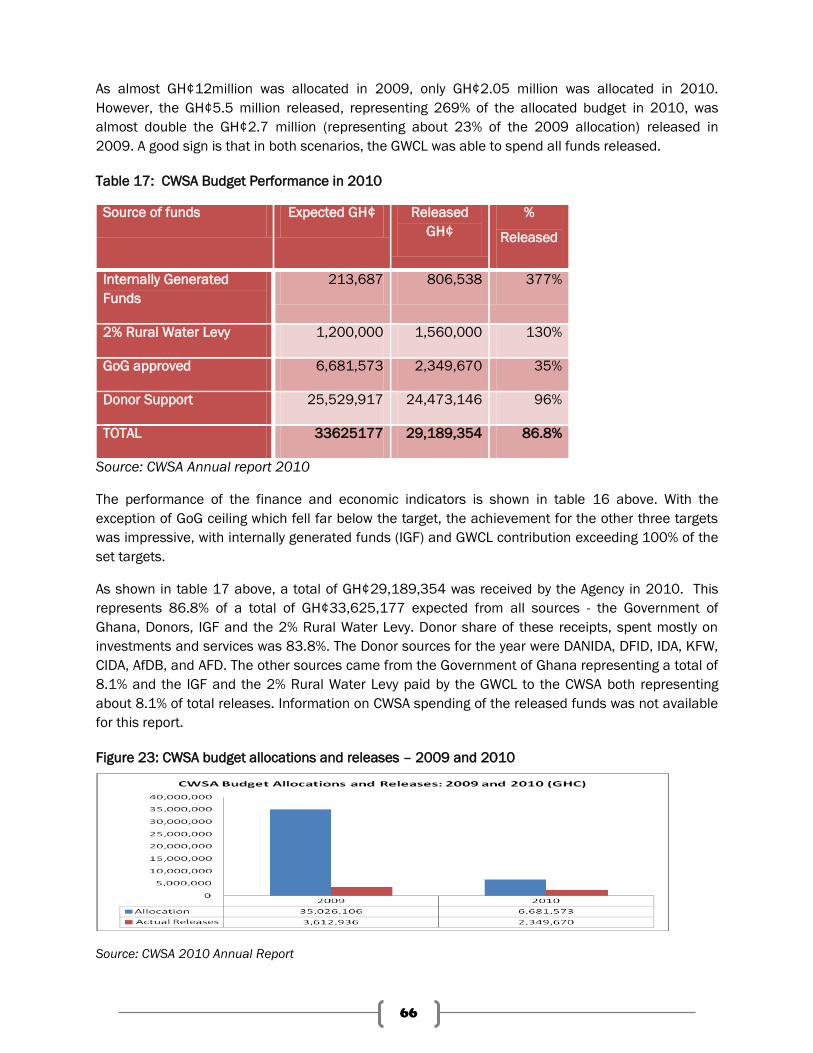
66
As almost GH¢12million was allocated in 2009, only GH¢2.05 million was allocated in 2010.
However, the GH¢5.5 million released, representing 269% of the allocated budget in 2010, was
almost double the GH¢2.7 million (representing about 23% of the 2009 allocation) released in
2009. A good sign is that in both scenarios, the GWCL was able to spend all funds released.
Table 17: CWSA Budget Performance in 2010
Source of funds Expected GH¢ Released
GH¢
%
Released
Internally Generated
Funds
213,687 806,538 377%
2% Rural Water Levy 1,200,000 1,560,000 130%
GoG approved 6,681,573 2,349,670 35%
Donor Support 25,529,917 24,473,146 96%
TOTAL 33625177 29,189,354 86.8%
Source: CWSA Annual report 2010
The performance of the finance and economic indicators is shown in table 16 above. With the
exception of GoG ceiling which fell far below the target, the achievement for the other three targets
was impressive, with internally generated funds (IGF) and GWCL contribution exceeding 100% of the
set targets.
As shown in table 17 above, a total of GH¢29,189,354 was received by the Agency in 2010. This
represents 86.8% of a total of GH¢33,625,177 expected from all sources - the Government of
Ghana, Donors, IGF and the 2% Rural Water Levy. Donor share of these receipts, spent mostly on
investments and services was 83.8%. The Donor sources for the year were DANIDA, DFID, IDA, KFW,
CIDA, AfDB, and AFD. The other sources came from the Government of Ghana representing a total of
8.1% and the IGF and the 2% Rural Water Levy paid by the GWCL to the CWSA both representing
about 8.1% of total releases. Information on CWSA spending of the released funds was not available
for this report.
Figure 23: CWSA budget allocations and releases – 2009 and 2010
Source: CWSA 2010 Annual Report
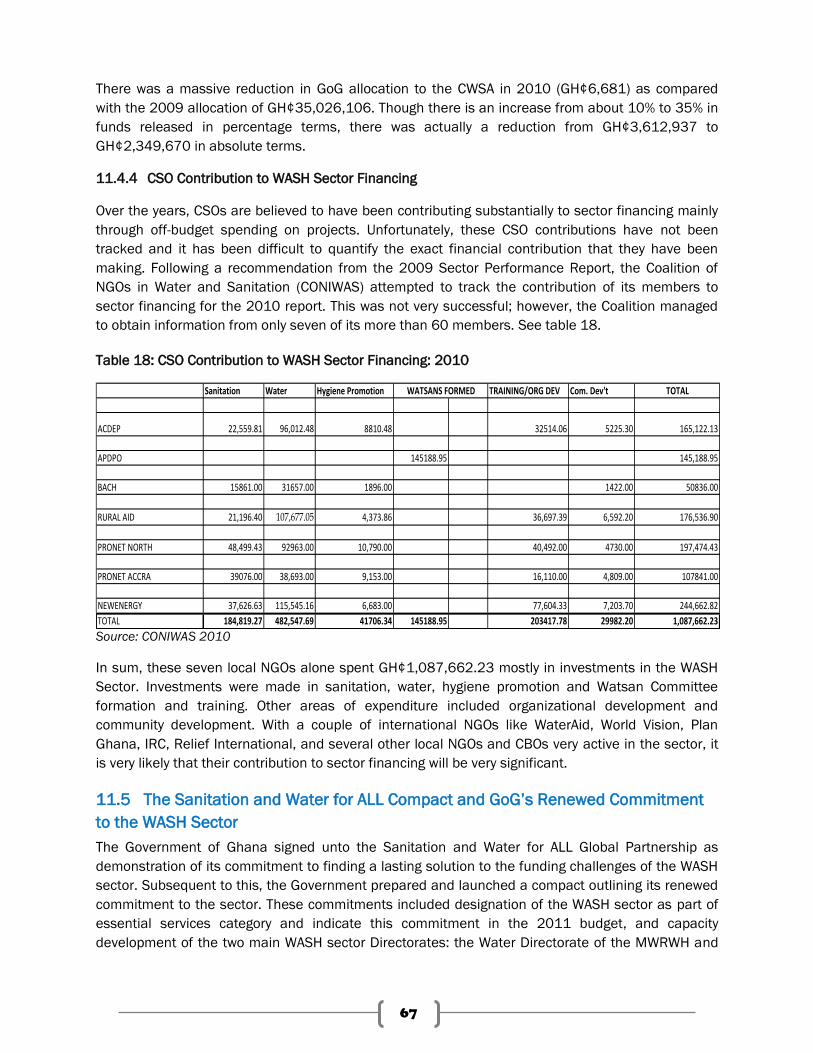
67
There was a massive reduction in GoG allocation to the CWSA in 2010 (GH¢6,681) as compared
with the 2009 allocation of GH¢35,026,106. Though there is an increase from about 10% to 35% in
funds released in percentage terms, there was actually a reduction from GH¢3,612,937 to
GH¢2,349,670 in absolute terms.
11.4.4 CSO Contribution to WASH Sector Financing
Over the years, CSOs are believed to have been contributing substantially to sector financing mainly
through off-budget spending on projects. Unfortunately, these CSO contributions have not been
tracked and it has been difficult to quantify the exact financial contribution that they have been
making. Following a recommendation from the 2009 Sector Performance Report, the Coalition of
NGOs in Water and Sanitation (CONIWAS) attempted to track the contribution of its members to
sector financing for the 2010 report. This was not very successful; however, the Coalition managed
to obtain information from only seven of its more than 60 members. See table 18.
Table 18: CSO Contribution to WASH Sector Financing: 2010
Sanitation Water Hygiene Promotion TRAINING/ORG DEV Com. Dev't TOTAL
ACDEP 22,559.81 96,012.48 8810.48 32514.06 5225.30 165,122.13
APDPO 145188.95 145,188.95
BACH 15861.00 31657.00 1896.00 1422.00 50836.00
RURAL AID 21,196.40 107,677.05 4,373.86 36,697.39 6,592.20 176,536.90
PRONET NORTH 48,499.43 92963.00 10,790.00 40,492.00 4730.00 197,474.43
PRONET ACCRA 39076.00 38,693.00 9,153.00 16,110.00 4,809.00 107841.00
NEWENERGY 37,626.63 115,545.16 6,683.00 77,604.33 7,203.70 244,662.82
TOTAL 184,819.27 482,547.69 41706.34 145188.95 203417.78 29982.20 1,087,662.23
WATSANS FORMED
Source: CONIWAS 2010
In sum, these seven local NGOs alone spent GH¢1,087,662.23 mostly in investments in the WASH
Sector. Investments were made in sanitation, water, hygiene promotion and Watsan Committee
formation and training. Other areas of expenditure included organizational development and
community development. With a couple of international NGOs like WaterAid, World Vision, Plan
Ghana, IRC, Relief International, and several other local NGOs and CBOs very active in the sector, it
is very likely that their contribution to sector financing will be very significant.
11.5 The Sanitation and Water for ALL Compact and GoG‟s Renewed Commitment
to the WASH Sector
The Government of Ghana signed unto the Sanitation and Water for ALL Global Partnership as
demonstration of its commitment to finding a lasting solution to the funding challenges of the WASH
sector. Subsequent to this, the Government prepared and launched a compact outlining its renewed
commitment to the sector. These commitments included designation of the WASH sector as part of
essential services category and indicate this commitment in the 2011 budget, and capacity
development of the two main WASH sector Directorates: the Water Directorate of the MWRWH and
68
the Environmental Health and Sanitation Directorate of the MLGRD with increased allocations in the
2011 budget. In terms of funding, the government specifically promised the following:
Increase allocations in budget statements for sanitation and water, and work with development
partners and the private sector to ensure that allocations reach US$200 million annually towards
sanitation and water improvements to meet MDG targets and sustain improvements beyond
2015.
Make additional allocations of US$150 million annually towards hygienic treatment and disposal
of septage and faecal sludge as well as sullage and storm water management;
Make further allocations up to the minimum threshold of 0.5% of GDP to cover capacity building
for hygiene education including proper hand-washing methods, countrywide outreach of
Community-led Total Sanitation (CLTS) and general enhancement of enabling elements.
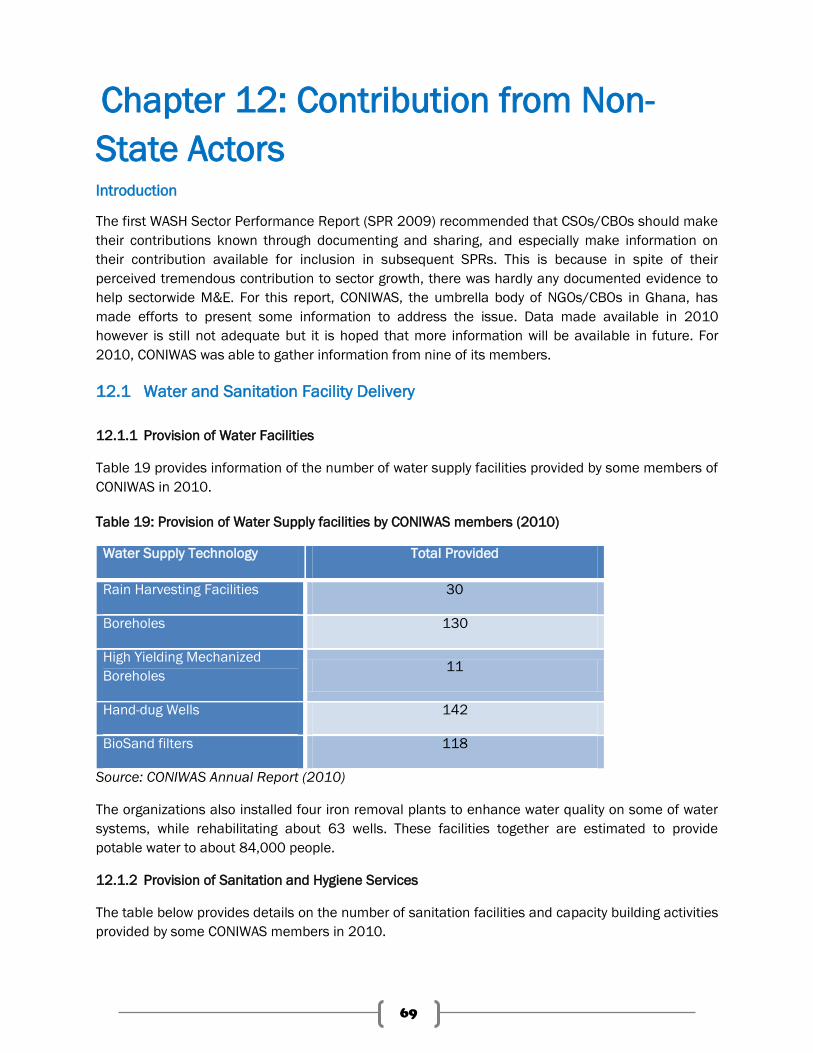
69
Chapter 12: Contribution from Non-
State Actors Introduction
The first WASH Sector Performance Report (SPR 2009) recommended that CSOs/CBOs should make
their contributions known through documenting and sharing, and especially make information on
their contribution available for inclusion in subsequent SPRs. This is because in spite of their
perceived tremendous contribution to sector growth, there was hardly any documented evidence to
help sectorwide M&E. For this report, CONIWAS, the umbrella body of NGOs/CBOs in Ghana, has
made efforts to present some information to address the issue. Data made available in 2010
however is still not adequate but it is hoped that more information will be available in future. For
2010, CONIWAS was able to gather information from nine of its members.
12.1 Water and Sanitation Facility Delivery
12.1.1 Provision of Water Facilities
Table 19 provides information of the number of water supply facilities provided by some members of
CONIWAS in 2010.
Table 19: Provision of Water Supply facilities by CONIWAS members (2010)
Water Supply Technology Total Provided
Rain Harvesting Facilities 30
Boreholes 130
High Yielding Mechanized
Boreholes 11
Hand-dug Wells 142
BioSand filters 118
Source: CONIWAS Annual Report (2010)
The organizations also installed four iron removal plants to enhance water quality on some of water
systems, while rehabilitating about 63 wells. These facilities together are estimated to provide
potable water to about 84,000 people.
12.1.2 Provision of Sanitation and Hygiene Services
The table below provides details on the number of sanitation facilities and capacity building activities
provided by some CONIWAS members in 2010.
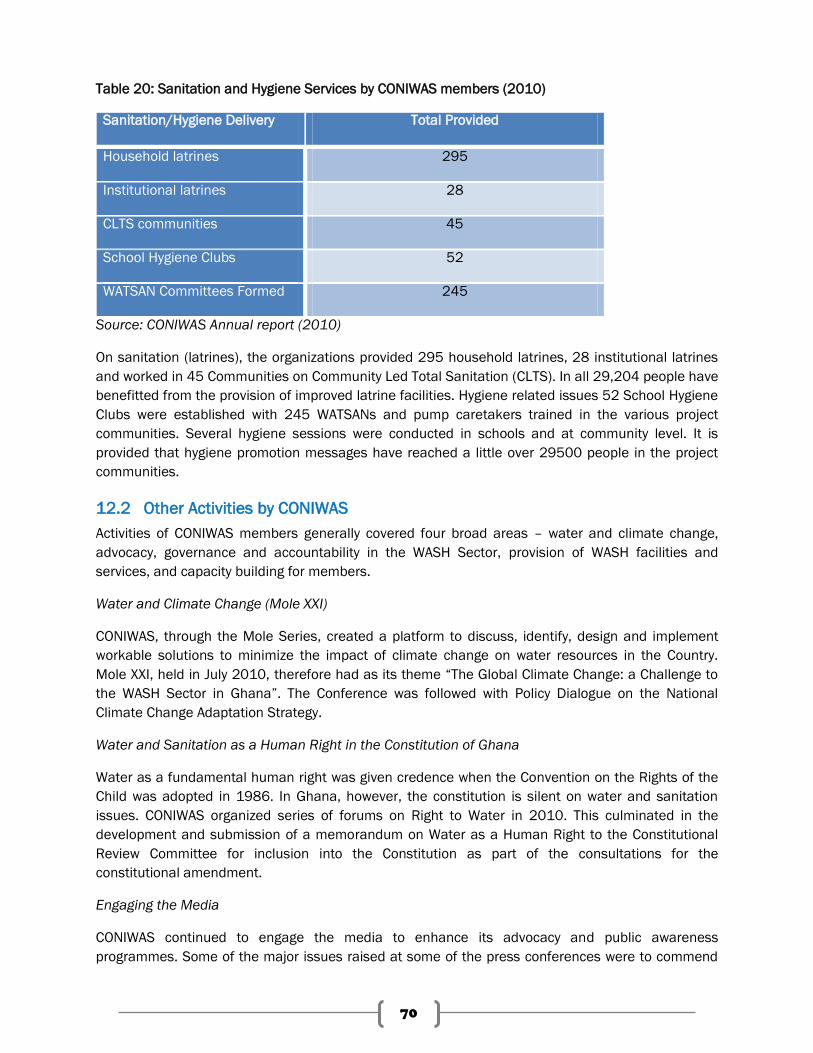
70
Table 20: Sanitation and Hygiene Services by CONIWAS members (2010)
Sanitation/Hygiene Delivery Total Provided
Household latrines 295
Institutional latrines 28
CLTS communities 45
School Hygiene Clubs 52
WATSAN Committees Formed 245
Source: CONIWAS Annual report (2010)
On sanitation (latrines), the organizations provided 295 household latrines, 28 institutional latrines
and worked in 45 Communities on Community Led Total Sanitation (CLTS). In all 29,204 people have
benefitted from the provision of improved latrine facilities. Hygiene related issues 52 School Hygiene
Clubs were established with 245 WATSANs and pump caretakers trained in the various project
communities. Several hygiene sessions were conducted in schools and at community level. It is
provided that hygiene promotion messages have reached a little over 29500 people in the project
communities.
12.2 Other Activities by CONIWAS
Activities of CONIWAS members generally covered four broad areas – water and climate change,
advocacy, governance and accountability in the WASH Sector, provision of WASH facilities and
services, and capacity building for members.
Water and Climate Change (Mole XXI)
CONIWAS, through the Mole Series, created a platform to discuss, identify, design and implement
workable solutions to minimize the impact of climate change on water resources in the Country.
Mole XXI, held in July 2010, therefore had as its theme “The Global Climate Change: a Challenge to
the WASH Sector in Ghana”. The Conference was followed with Policy Dialogue on the National
Climate Change Adaptation Strategy.
Water and Sanitation as a Human Right in the Constitution of Ghana
Water as a fundamental human right was given credence when the Convention on the Rights of the
Child was adopted in 1986. In Ghana, however, the constitution is silent on water and sanitation
issues. CONIWAS organized series of forums on Right to Water in 2010. This culminated in the
development and submission of a memorandum on Water as a Human Right to the Constitutional
Review Committee for inclusion into the Constitution as part of the consultations for the
constitutional amendment.
Engaging the Media
CONIWAS continued to engage the media to enhance its advocacy and public awareness
programmes. Some of the major issues raised at some of the press conferences were to commend
71
government for developing the Sanitation and Water for ALL Compact and especially the
commitments made in the compact. The event was also to sensitize the media and invite them to
support in monitoring the implementation of the commitments.
Another engagement with the media was in relation with the “Stand up and take Action Campaign.
CONIWAS, in conjunction with the Ghana National Campaign Coalition on MDGs, joined the Global
Celebration to mark the 10th year anniversary of the declaration of MDGs. The campaign was meant
to remind government and development partners of their commitment to the achievement of the
MDGs target and raise awareness among citizens on the need to demand accountability from the
government with respect to meeting the commitment to the MDGs.
Citizen Engagement
Under its Governance and Accountability Project, CONIWAS, together with selected members,
implemented a project with the aim of ensuring transparency and efficiency in the delivery of WASH
Services to the poor, underserved and unserved communities in the urban sector. The project
involved strengthening the capacity of community members to demand accountability from service
providers. In this project, the Ghana Water Company Limited (GWCL) and Aqua Vitens Rand Limited
(AVRL) were the target service providers. Communities assessed the performance of the service
providers against agreed set of criteria using the social accountability tool of Community Score Card.
In some of the communities, the end result was the establishment of a joint committee to monitor
the flow of water and also to report „illegal connections.” In some instances, action plans were
developed by the service provider towards solving identified problems with the services in the
community.
12.3 Private Contribution
In addition to NGO/CSOs, several corporate institutions, churches and voluntary associations
(including citizen associations) and individuals sometimes donate water supply facilities to
communities. It is believed that information on these facilities is inherent in nationwide survey data
generated by the Ghana Statistical Service. However, sources of water supply systems are not
reported. This makes it difficult to ascertain how much contribution comes from these private
sources.
72
Chapter 13: Sector M&E and Reporting Introduction
This chapter discusses current M&E practices in the WASH Sector, the issue with harmonization of
M&E processes for national decision-making, data storage and retrieval, making effective use of
existing survey data and efforts under way towards coordinated M&E practices at the national level.
13.1 Current M&E practices
M&E practices in the WASH Sector of Ghana are currently not harmonized. According to a study
conducted by TREND, a Ghanaian NGO, in 2006, the Water Directorate at the Ministry of Water
Resources, Works and Housing recognized the need to collaborate with data gathering institutions
such as the Ghana Statistical Service, CWSA, GWCL, databases of the various projects in the sector
to harmonize various M&E systems into a comprehensive national system to be managed by the
Water Directorate of the Ministry to serve as one stop centre for information on water and
sanitation7. A similar study conducted by the Water Directorate in 20108 still discovered lack of
harmonized definitions and systems as a major M&E issue in the sector.
According to these reports, M&E in the sector have been handled mainly at the agency level with
different focuses, definitions, standards, and methodologies. The Ghana Water Company Limited
(GWCL) has handled monitoring and reporting for urban water supply; the Community Water and
Sanitation Agency (CWSA) has handled monitoring and reporting for rural and small town water
supply and basic sanitation; the National Development Planning Commission (NDPC) has handled
monitoring on Ghana‟s MDGs and has been relying mainly on data from the CWSA, while the Ghana
Statistical Service has been undertaking user-based surveys, which provide some data on WASH,
and which the WHO/UNICEF JMP has mostly used as Ghana‟s MDG progress data.
Another publication by the Water and Sanitation Monitoring Platform (WSMP) also identified two
major types of data circulating in the sector, which, according to the publication, are sometimes used
interchangeably and wrongly by some stakeholders9. These are User-based data, which are
generated through household surveys and mostly generated by the Ghana Statistical Service (GSS),
and the Provider-based data, which are generated by service providers. Provider-based data are
usually based on the number of installed facilities and their projected water supply capacities
according to standards set by the agencies themselves. According to the publication, the
methodologies that are applied to generate these types of data are very different and cannot be
compared or even harmonized.
The 2009 Sector Performance Report (SPR) also highlighted lack of agreed set of sectorwide
indicators for sector reporting, while it cited a wish by a section of stakeholders for the Ghana
Statistical Service to conduct a WASH-specific survey with indicators and methodologies agreeable to
the sector.
7 Akanbang, B and Larbi, E, (2006): Monitoring of Water Supply Coverage 8 Water Directorate - MWRWH (2010):Towards Harmonized Water Sector Definitions, Common terminology
and Monitoring Systems
9 WSMP (2009): The Data Puzzle in Ghana’s Water and Sanitation Sector.
73
13.2 Data storage and Retrieval
Since each agency/institution creates and manages its own data, there is no centralized data
storage and retrieval system for easier access. The NDPC developed the GhanaInfo a couple of years
ago for as a national database but it has not been successful enough to the WASH sector as there is
virtually no WASH data in the system. The CWSA has developed the District Monitoring and
Evaluation System (DiMES), which is currently in use and believed to be capable of serving the whole
WASH sector if indicators are clearly defined for that purpose. It is yet to be scaled up nationwide as
there is currently no consensus or decision on scaling up.
13.3 Towards a Coordinated M&E Approach
The WASH Sector is working feverishly towards a sectorwide service delivery approach (SWAp). Since
in a SWAp environment all processes are done in a centrally coordinated manner, M&E will also have
to be centrally coordinated to give real meaning to the SWAp. The Ministry of Water Resources,
Works and Housing, through the Water Directorate, has planned to develop a Sector Strategic
Development Plan (SSDP), which will serve as the master plan which will guide all interventions in
the WASH Sector. Included in this SSDP will be a Sector M&E Plan and Framework.
The M&E Plan, which will be based on the objectives outlined in the SSDP, will profile all the
necessary M&E processes, definitions, identification of indicators and their definitions. It will define
how M&E shall be done at the central level with inputs from the district or lower levels and who will
be involved in the process from data generation, analyses, processing, storage to dissemination. The
M&E plan will also identify a sectorwide M&E data storage and retrieval system and possibly make
available on-line to facilitate easy access to data and decision-making. The framework will present a
matrix containing all agreed set of harmonized sectorwide indicators, their definitions, sources of
data, and frequency of updating data. These activities have all been planned for 2011, and it is
hoped that by the end of 2011, M&E systems in Ghana‟s WASH sector will be harmonized.
13.4 Use of WASH Sector Survey Reports
Household user-based survey data continues to be the type used by the UN to monitor progress
towards achieving the Millennium Development Goals (MDGs) on water and sanitation and this is
likely to continue even after 2015.
A number of survey reports on WASH exist in Ghana, courtesy the Ghana Statistical Service. It was
recommended in the 2009 SPR, that survey data could be improved upon with WASH stakeholder
inputs. This is because none of the current surveys by the GSS is deliberately intended for the WASH
sector. The Demographic and Health Survey (DHS) for example, is intended for the health sector; the
Ghana Living Standard Survey (GLSS) is also intended to measure poverty levels and living standards
of Ghanaians, while the Population and Housing Censuses cover the entire population and their
demographic characteristics etc. This explains why the methodologies do not generally satisfy WASH
Sector practitioners especially for planning and effective decision-making purposes. The few
questionnaires related to water and sanitation is usually reported under household characteristics
and is not necessarily focused on monitoring WASH Sector performance.
The second Multiple Indicator Cluster Survey (MICS) will be conducted in 2011 and it has been
suggested to the GSS to take inputs from the WASH Sector in order to improve its usefulness to
WASH stakeholders.
It has also been suggested that harmonized survey data should be used to report on access to water
and sanitation in the sectorwide M&E plan yet to be developed. This is because it is based on user
perceptions and satisfaction, captures data on all existing facilities (including self-supplied facilities)
irrespective of who the provider is. It is believed that once the definition of „access‟ is harmonized,
the GSS could serve as the best source of data on access for the M&E framework.
74
In the meantime, the sector continues to resort to existing data and updates from the agencies as
efforts are made towards a harmonized M&E plan in the near future.
75
Chapter 14: Conclusions and
Recommendations Introduction
This chapter highlights major conclusions of the report and gaps identified in the performance of the
WASH Sector in 2010; it also and makes some recommendations for strategic attention.
14.1 Institutional and policy developments
The current institutional arrangements for the WASH Sector have been tested for some time now. It
might be useful to undertake thorough assessments on these arrangements and make some
reviews where necessary. For instance it was suggested at the 2010 National Environmental
Sanitation Conference (NESCON) that an Environmental Sanitation Agency should be created to
oversee the implementation of environmental sanitation programmes in the country. This may help
accelerate sanitation delivery in the country especially as the MMDAs have not been very successful
in solving the country‟s sanitation problems.
Institutional capacity development for effective sector coordination was envisaged in the Ghana
(SWA) Compact. In this direction GoG undertook to “strengthen and enhance the capacity of the
Water Directorate and the Environmental Health and Sanitation Directorate with increased budget
allocations…”10 This commitment must be fulfilled as a matter of urgency since the Directorates are
woefully understaffed and ill-equipped to take on the huge task of coordinating all WASH Sector
strategic directions for government ownership in a SWAp environment.
Progress made towards a Sector Wide Approach is commendable. All WASH Sector stakeholders,
including the government and development partners, should demonstrate full support to this
process. It is also recommended that, as the Ministry of Local Government and Rural Development
has revised and launched the Environmental Sanitation Policy and the Strategic Plan (NESSAP), the
Sector Environmental Sanitation Investment Plan (SESIP) should be approved to ensure early
implementation of the plan.
14.2 Water Resources Management
Since ground water sources are so vital and are a preferred choice especially for rural water supply,
it would be useful for the country to know how much of it is available. Knowledge of the amount of
groundwater will also help in monitoring and planning for its use. National efforts at promoting IWRM
and creating a buffer zone are commendable. It is therefore recommended that these efforts are
sustained, accelerated and even intensified.
14.3 Access to Urban Water Supply
Though it is refreshing that access to urban water supply increased from 59% in 2009 to about 64%,
more than four million urban dwellers still lack access. If current trends in progress are not
improved, the GWCL will not meet its 85% target by 2015. It is therefore recommended that
government demonstrates more commitment by increasing investment in the water sector.
Urban water management is also still a major issue since evaluation of AVRL‟s performance has
indicated failures in many areas. It is therefore recommended that the value addition of the AVRL
10
The Ghana Compact: Sanitation and Water for ALL (2010); commitment No 7.1
76
Management Contract be critically evaluated so that a more efficient model may be found. The issue
of non-revenue water in particular has shown no sign of improvement since 2005 and this needs
more serious attention and radical action to reverse the situation.
Since the rural water supply sector reports only on domestic water supply, it is recommended that
the GWCL should publish separate data on domestic from industrial water supply so that real access
to domestic water supply could be measured.
14.4 Access to Rural and Small Town Water Supply
The 62% access to rural and small town water supply leaves more than four million people without
access. There is therefore the need for increased investment in this sub-sector. It has been observed
that many communities are unable to manage and sustain their facilities and to benefit from its full
lifespan. It is therefore suggested that for the sake of sustainability of rural and small town water
supply facilities, the current Community Ownership and Management model should be reviewed. The
CWSA Water Quality Framework is also a very laudable project that must attract the needed funding.
14.5 Sanitation and Hygiene
The Ministry of Local Government and Rural Development should strengthen coordination among
sector players especially at the regional and district levels. It is believed that it will be possible to
scale up the Community-led Total Sanitation, which is now the rural sanitation model only when all
the sub-national sanitation institutions are appropriately coordinated. All stakeholders are therefore
encouraged to embrace the concept and support its implementation.
14.6 Sector Financing
The percentage of allocated funds released to the WASH Sector agencies improved in 2010 over the
2009 performance. However, total allocations were still not adequate to meet the financial
requirements of the SIPs. In comparison with the Health and Education ministries, financing of the
WASH sector receives less priority from government. Since improvement in water and sanitation
impact positively on the health of the economy, it is recommended that government should accord
the needed priorities for the sector. A critical step is for the government to fulfill the commitments in
the Ghana Compact in 2011 and beyond.
14.7 Harmonization of M&E processes
This report has again been produced without a harmonized M&E framework. It has been suggested
that the development of a Strategic Sector Development Plan (SSDP) should include a sectorwide
M&E plan and framework. It is therefore expected that by the time the SSDP is ready, the sector
would have harmonized M&E processes.
As much as possible, the M&E framework should fill the following identified gaps:
Indicators and data on sanitation
Sanitation has mostly been associated with safe excreta disposal. The use of improved toilet
facilities has been a global proxy to measure progress in sanitation for the MDGs. Within the broader
context, sanitation also covers other aspects such as solid wastes, storm drainage, industrial waste
etc. This has often created difficulties in getting a consensus on a common definition for sanitation.
Apart from periodic surveys by the Ghana Statistical Service, there is currently no clear source of
nationwide data on sanitation. The M&E Plan should therefore clearly define monitoring indicators,
and identify sources of data on these indicators.
Indicators and data on hygiene
77
Hygiene is one of the three main components of WASH. However, it was not possible to obtain
enough data on it with the exception of 2008 survey data on disposal of child faeces and household
water treatment and storage. There is currently no data on handwashing practice and access to
handwashing facilities. This shall not be overlooked during the development of the sectorwide M&E
framework. It is recommended that the MLGRD should lead in selecting monitoring indicators on
hygiene for the sectorwide M&E framework.
Disaggregation of domestic and industrial/commercial water supply figures
Coverage data on rural and small town water supply have always been limited to domestic water
supply. However, data provided for urban water supply includes domestic, commercial and other
uses. Comparing urban water supply coverage with rural water supply coverage is therefore
inappropriate. It will be best if the GWCL could provide disaggregated data on domestic and other
purposes.
Definition of urban and rural
The 2009 Sector Performance Report (SPR) recommended that data disaggregation should be
based on common definitions for the terms „urban‟ and „rural‟ due to overlaps in operational areas of
the GWCL and the CWSA. To avoid the imminent complexities it is recommended that reporting
should be based on CWSA and GWCL Operational Areas instead of rural and urban. This is because
none of the two agencies base their operations strictly within the national definition of rural and
urban, where a rural community is defined as a community with population less than 5,000
inhabitants and urban is any community with population 5,000 or more. CWSA for instance operates
in some communities with populations more than 30,000, whereas the GWCL also provides water to
some communities with populations less than 5,000. These recommendations should be further
analyzed when developing the sector M&E framework.
Self-supply
It is evident that many Ghanaians in both urban and rural communities provide their own water
supply facilities for various reasons. These include hand-dug wells, boreholes, mechanized wells and
rain harvesting systems. It is recommended that since self-supply can help accelerate coverage and
promote sustainability, it should be an indicator for sectorwide monitoring, while the practice is also
mainstreamed in order for the country to provide self-suppliers with the needed support for the
benefits expected from the practice to be fully harnessed. To start the process, it is recommended
that the MWRWH should, as a matter of urgency, conduct an assessment on self-supply in Ghana.
Contribution by non state actors
It is good that CONIWAS responded to the call on its members to document and disseminate their
contribution (financial, advocacy and facilities) to the WASH sector by submitting some information
for this report. They are however encouraged to expand and sustain the information by getting all
their members on board. Data collection should also extend to other non-state actors including
private and corporate contributions so that national monitoring may not leave out any contribution
no matter where it is coming from. In this respect, the call for a WASH Specific Periodic Survey is
being re-echoed since that appears the only data collection strategy that can capture data on all
sources of water supply.
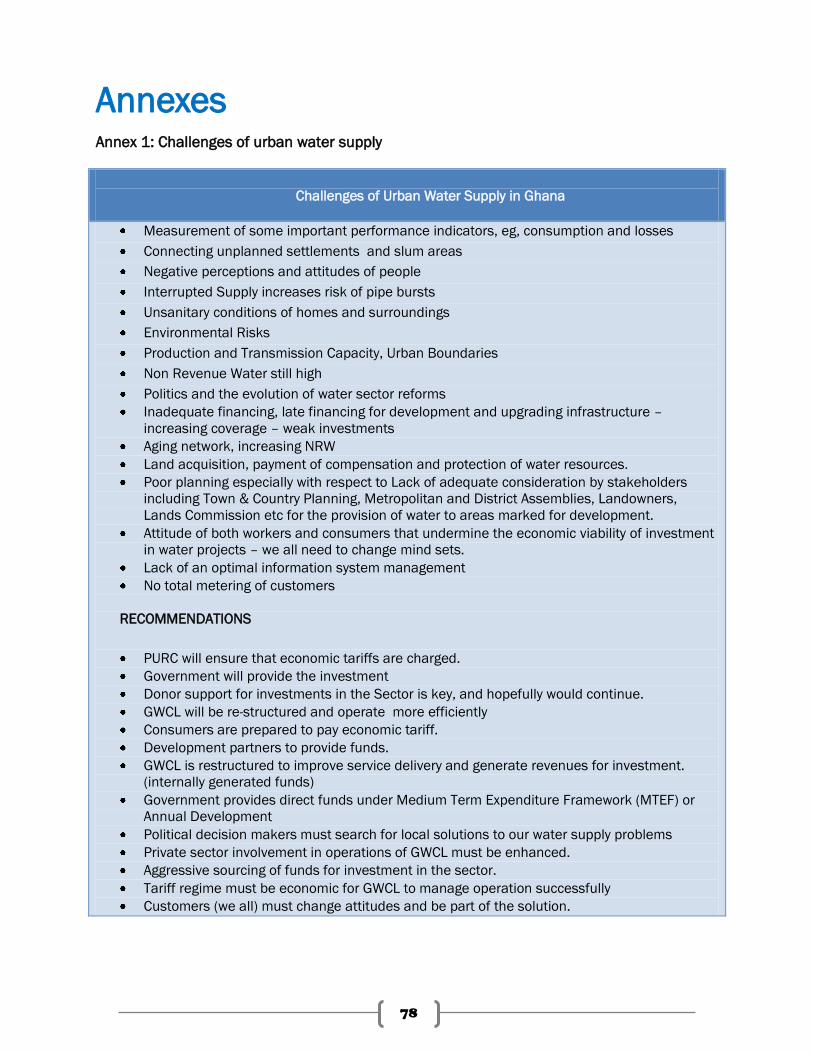
78
Annexes Annex 1: Challenges of urban water supply
Challenges of Urban Water Supply in Ghana
Measurement of some important performance indicators, eg, consumption and losses
Connecting unplanned settlements and slum areas
Negative perceptions and attitudes of people
Interrupted Supply increases risk of pipe bursts
Unsanitary conditions of homes and surroundings
Environmental Risks
Production and Transmission Capacity, Urban Boundaries
Non Revenue Water still high
Politics and the evolution of water sector reforms
Inadequate financing, late financing for development and upgrading infrastructure –
increasing coverage – weak investments
Aging network, increasing NRW
Land acquisition, payment of compensation and protection of water resources.
Poor planning especially with respect to Lack of adequate consideration by stakeholders
including Town & Country Planning, Metropolitan and District Assemblies, Landowners,
Lands Commission etc for the provision of water to areas marked for development.
Attitude of both workers and consumers that undermine the economic viability of investment
in water projects – we all need to change mind sets.
Lack of an optimal information system management
No total metering of customers
RECOMMENDATIONS
PURC will ensure that economic tariffs are charged.
Government will provide the investment
Donor support for investments in the Sector is key, and hopefully would continue.
GWCL will be re-structured and operate more efficiently
Consumers are prepared to pay economic tariff.
Development partners to provide funds.
GWCL is restructured to improve service delivery and generate revenues for investment.
(internally generated funds)
Government provides direct funds under Medium Term Expenditure Framework (MTEF) or
Annual Development
Political decision makers must search for local solutions to our water supply problems
Private sector involvement in operations of GWCL must be enhanced.
Aggressive sourcing of funds for investment in the sector.
Tariff regime must be economic for GWCL to manage operation successfully
Customers (we all) must change attitudes and be part of the solution.
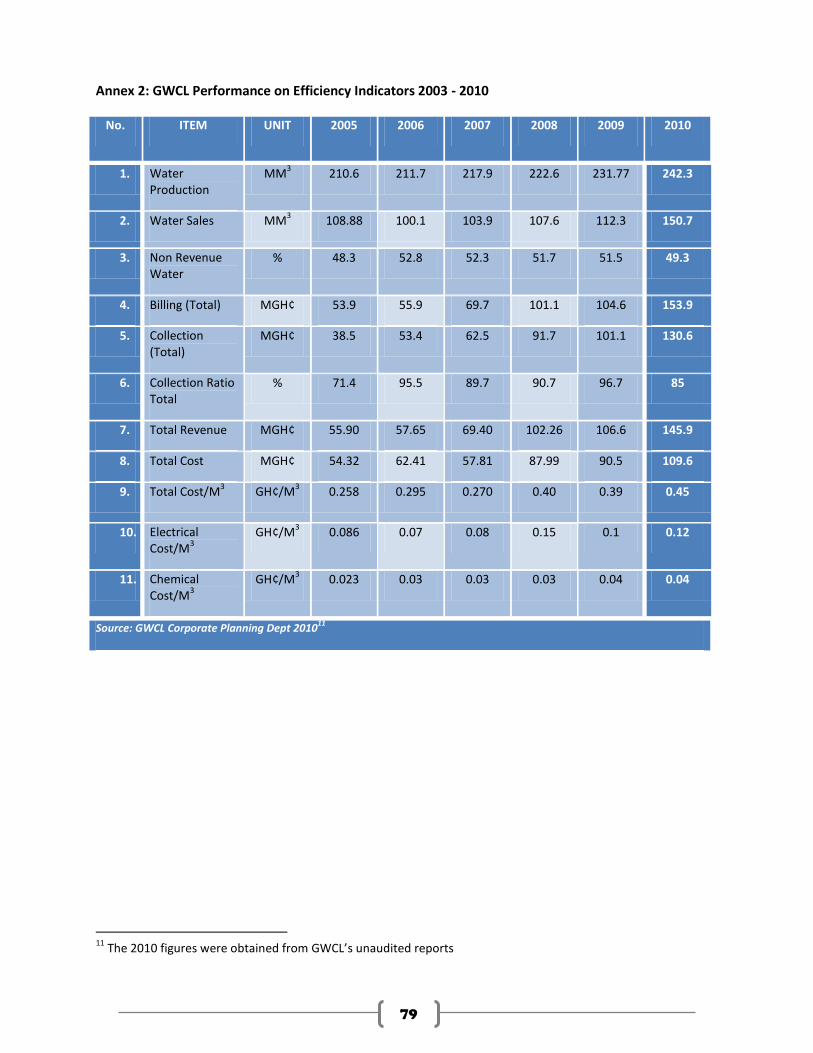
79
Annex 2: GWCL Performance on Efficiency Indicators 2003 - 2010
No. ITEM UNIT 2005 2006 2007 2008 2009 2010
1. Water Production
MM3 210.6 211.7 217.9 222.6 231.77 242.3
2. Water Sales MM3 108.88 100.1 103.9 107.6 112.3 150.7
3. Non Revenue Water
% 48.3 52.8 52.3 51.7 51.5 49.3
4. Billing (Total) MGH¢ 53.9 55.9 69.7 101.1 104.6 153.9
5. Collection (Total)
MGH¢ 38.5 53.4 62.5 91.7 101.1 130.6
6. Collection Ratio Total
% 71.4 95.5 89.7 90.7 96.7 85
7. Total Revenue MGH¢ 55.90 57.65 69.40 102.26 106.6 145.9
8. Total Cost MGH¢ 54.32 62.41 57.81 87.99 90.5 109.6
9. Total Cost/M3 GH¢/M
3 0.258 0.295 0.270 0.40 0.39 0.45
10. Electrical Cost/M
3
GH¢/M3 0.086 0.07 0.08 0.15 0.1 0.12
11. Chemical Cost/M
3
GH¢/M3 0.023 0.03 0.03 0.03 0.04 0.04
Source: GWCL Corporate Planning Dept 201011
11
The 2010 figures were obtained from GWCL’s unaudited reports
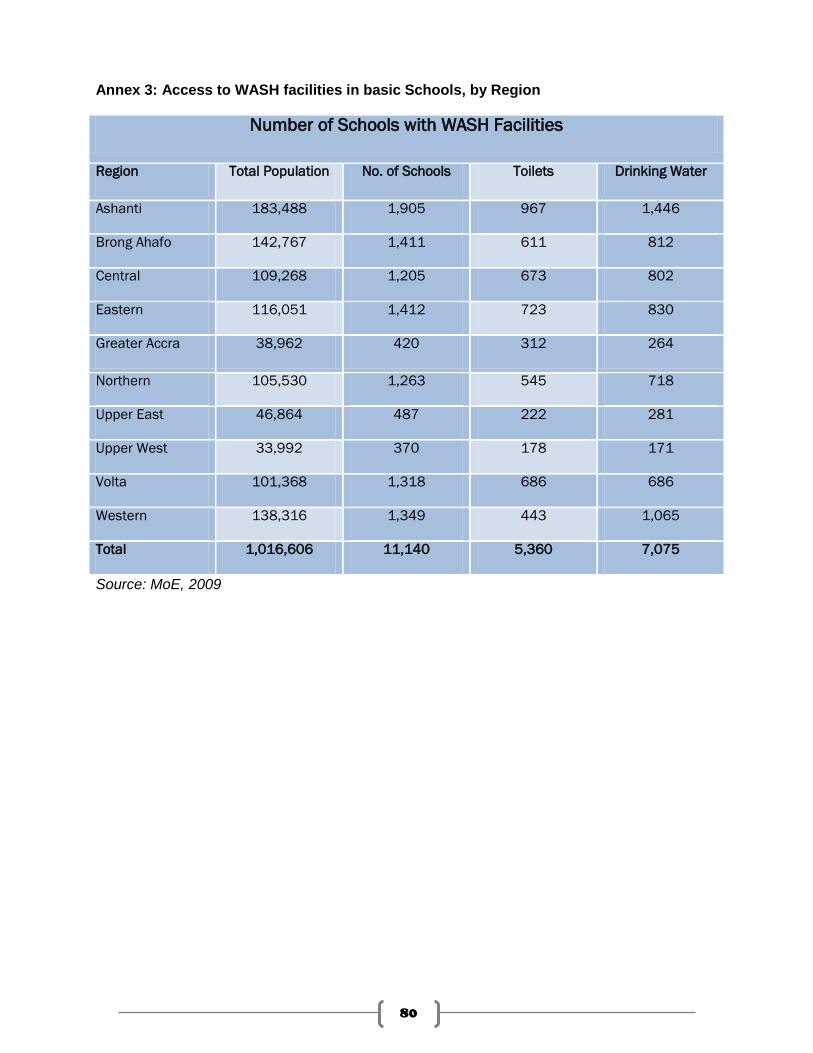
80
Annex 3: Access to WASH facilities in basic Schools, by Region
Number of Schools with WASH Facilities
Region Total Population No. of Schools Toilets Drinking Water
Ashanti 183,488 1,905 967 1,446
Brong Ahafo 142,767 1,411 611 812
Central 109,268 1,205 673 802
Eastern 116,051 1,412 723 830
Greater Accra 38,962 420 312 264
Northern 105,530 1,263 545 718
Upper East 46,864 487 222 281
Upper West 33,992 370 178 171
Volta 101,368 1,318 686 686
Western 138,316 1,349 443 1,065
Total 1,016,606 11,140 5,360 7,075
Source: MoE, 2009
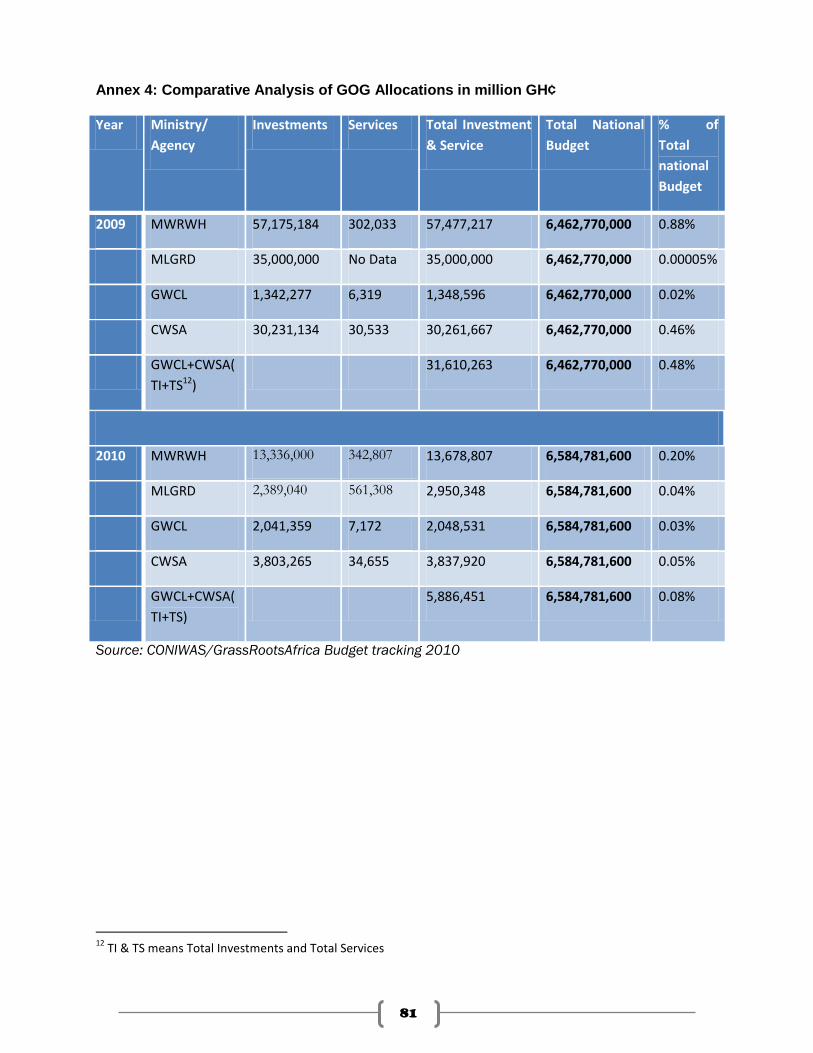
81
Annex 4: Comparative Analysis of GOG Allocations in million GH¢
Year Ministry/
Agency
Investments Services Total Investment
& Service
Total National
Budget
% of
Total
national
Budget
2009 MWRWH 57,175,184 302,033 57,477,217 6,462,770,000 0.88%
MLGRD 35,000,000 No Data 35,000,000 6,462,770,000 0.00005%
GWCL 1,342,277 6,319 1,348,596 6,462,770,000 0.02%
CWSA 30,231,134 30,533 30,261,667 6,462,770,000 0.46%
GWCL+CWSA(
TI+TS12)
31,610,263 6,462,770,000 0.48%
2010 MWRWH 13,336,000 342,807 13,678,807 6,584,781,600 0.20%
MLGRD 2,389,040 561,308 2,950,348 6,584,781,600 0.04%
GWCL 2,041,359 7,172 2,048,531 6,584,781,600 0.03%
CWSA 3,803,265 34,655 3,837,920 6,584,781,600 0.05%
GWCL+CWSA(
TI+TS)
5,886,451 6,584,781,600 0.08%
Source: CONIWAS/GrassRootsAfrica Budget tracking 2010
12
TI & TS means Total Investments and Total Services
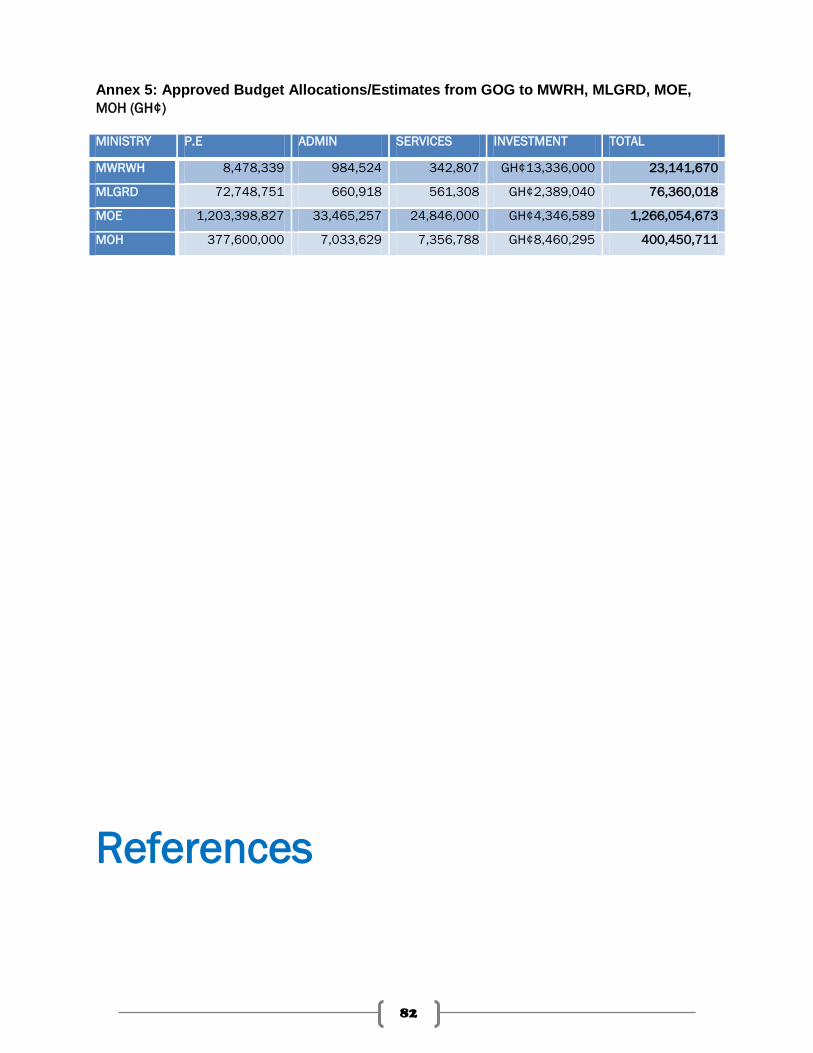
82
Annex 5: Approved Budget Allocations/Estimates from GOG to MWRH, MLGRD, MOE,
MOH (GH¢)
MINISTRY P.E ADMIN SERVICES INVESTMENT TOTAL
MWRWH 8,478,339 984,524 342,807 GH¢13,336,000 23,141,670
MLGRD 72,748,751 660,918 561,308 GH¢2,389,040 76,360,018
MOE 1,203,398,827 33,465,257 24,846,000 GH¢4,346,589 1,266,054,673
MOH 377,600,000 7,033,629 7,356,788 GH¢8,460,295 400,450,711
References
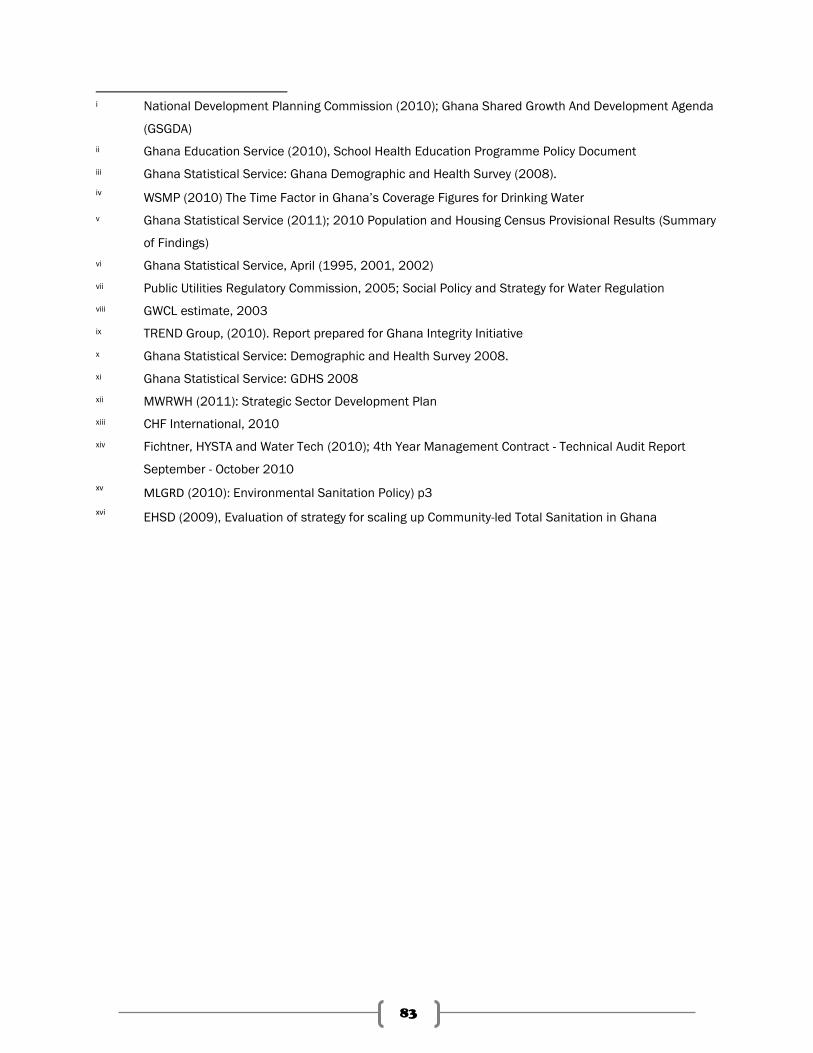
83
i National Development Planning Commission (2010); Ghana Shared Growth And Development Agenda
(GSGDA)
ii Ghana Education Service (2010), School Health Education Programme Policy Document
iii Ghana Statistical Service: Ghana Demographic and Health Survey (2008).
iv WSMP (2010) The Time Factor in Ghana‟s Coverage Figures for Drinking Water
v Ghana Statistical Service (2011); 2010 Population and Housing Census Provisional Results (Summary
of Findings)
vi Ghana Statistical Service, April (1995, 2001, 2002)
vii Public Utilities Regulatory Commission, 2005; Social Policy and Strategy for Water Regulation
viii GWCL estimate, 2003
ix TREND Group, (2010). Report prepared for Ghana Integrity Initiative
x Ghana Statistical Service: Demographic and Health Survey 2008.
xi Ghana Statistical Service: GDHS 2008
xii MWRWH (2011): Strategic Sector Development Plan
xiii CHF International, 2010
xiv Fichtner, HYSTA and Water Tech (2010); 4th Year Management Contract - Technical Audit Report
September - October 2010
xv MLGRD (2010): Environmental Sanitation Policy) p3
xvi EHSD (2009), Evaluation of strategy for scaling up Community-led Total Sanitation in Ghana