Embed Size (px)
Citation preview

Investor Presentation
March 10, 2015
Why Vulcan

Notes
What we aim to offer investors
2
A domestic ‘pure play’ aggregates business with several years of double-digit revenue growth potential
Shipment growth with recovery in construction activity to long-term trend levels
Pricing growth as seen in past recovery cycles
Earnings leverage at each stage in the P&L
Gross profit margins expanding
SAG leverage
Significant return of capital
A progressive dividend growing with earnings
Excess cash focused on share repurchase
An investment-grade balance sheet
Debt amount and structure appropriate to the asset base and point in the cycle
Adequate cushion against external shocks
1
2
3
4
March 10, 2015

Notes
What we aim to offer investors, continued
3
An advantaged aggregates asset base and franchise of lasting value
A compelling portfolio of market positions
– Most profitable market mix (as evidenced by margins per ton shipped)
– Higher growth rate in recovery; today still > 30% below normal demand
– Higher long-term growth rate; serving nearly all key growth corridors and most rapidly growing population centers
– Excellent multi-modal logistics capabilities, plus the inherent advantages of our Yucatan quarry and port facilities
– Complementary downstream operations, where they matter
– Over 85% of revenues from markets where we hold a #1 or # 2 position
A sector with a decades-long record of real-price gains; a natural inflation hedge
Over 15.8 billion tons of owned and leased permitted reserves
119,000 acres of owned land, with significant unrecognized value
5
March 10, 2015

Notes
What we aim to offer investors, continued
4
Disciplined portfolio management to improve capital returns and longer-term growth expectations
Accretive bolt-on acquisitions, appropriately financed
Swaps, divestitures, and excess land sales to enhance cash flows and returns
A recognized industry leader with strong front-line management and execution advantages tied to scale and collective know-how
Industry-leading safety and environmental performance
Fair dealing with employees, communities, customers, suppliers and competitors
Commercial and operational excellence
Financial and capital disciplines
Aligned management incentives
6
7
March 10, 2015

Notes
What we aim to offer investors, continued
5
Significant upside exposure to eventual growth in US infrastructure investment
Well positioned vs. nearer-term improvements in funding (local/state level, federal level, P3s)
Well positioned vs. specific intermediate term investment trends (e.g., port expansions, petrochemical facilities, inter-modal transport facilities, water treatment, etc.)
Well positioned vs. necessary longer-term ‘catch-up’ on overall US infrastructure capacity and quality
Potential for further reductions in cost of capital
Longer-dated debt, consistent with long-lived assets
Prudent management of debt through the cycle
8
9
March 10, 2015

Notes
Industry Position and Recent Performance

Notes
Other Segments Aggregates
93%
7%
Gross profit (% of total)
Vulcan’s strategic focus is aggregates
7
Source: 2014 company financials
Only pure play in U.S. aggregates
March 10, 2015

Notes
8
80 90
100 110 120 130 140 150 160 170 180
2004 05 06 07 08 09 10 11 12 13 2014
PPI VMC
Vulcan +5.1%/yr PPI +4.4%/yr
Long history of price increases
Price leader in the aggregates industry
March 10, 2015

Notes
9
Vulcan’s uniquely valuable asset base …
7 out of 10 people live within 25 miles of a Vulcan operation
March 10, 2015

Notes
… and logistics network
10
Barge Rail
Ship
Geologic “Fall Line”
Most extensive and advantaged remote distribution network in the aggregates industry
Below the Fall Line, little or no quality aggregates reserves exist that are suitable for mining
March 10, 2015

Notes
Vulcan’s aggregates gross profit per ton
11
$3.35
$2.83$2.50
2014 13 12
162 M tons
146 M tons
141 M tons
2005
$2.50
260 M tons
Industry-leading unit profitability with room to grow
March 10, 2015

Notes
Strong momentum with early recovery
12
Adjusted EBITDA, $M
600
468411
14 13 2012 2015P
775-825
141 M tons
~180M tons
162 M tons
146 M tons
See Appendix for reconciliation Non-GAAP measures
March 10, 2015
Notes
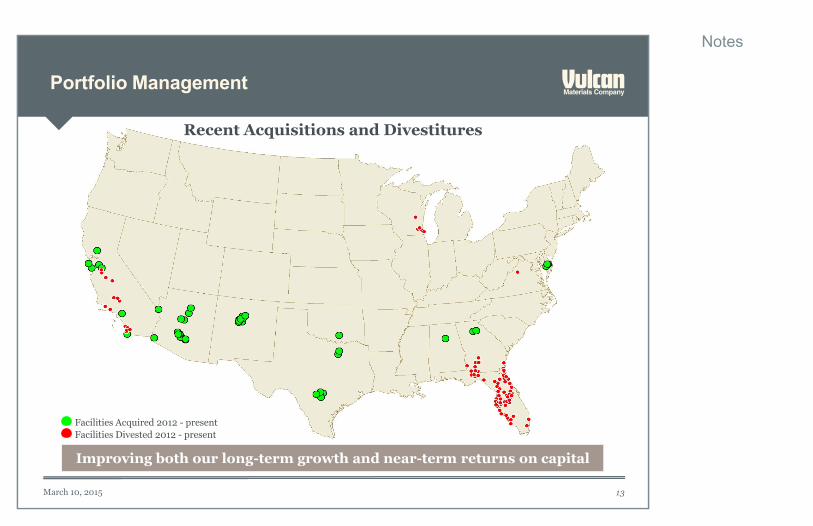
Portfolio Management
13
Facilities Acquired 2012 - present Facilities Divested 2012 - present
Improving both our long-term growth and near-term returns on capital
Recent Acquisitions and Divestitures
March 10, 2015

Notes
Where we are headed

Notes
Vulcan in the recovery phase
15
146
255
165
0
40
80
120
160
200
240
280
320
360
300
Normal Demand
Pro forma Sales Volume
Illustrative Shipment Growth
Peak Trough Normal Demand
Tons in millions
2014
300
146 165
~255
EBITDA > $2 Billion at Normal Demand
March 10, 2015

Notes
Drivers of EBITDA growth during recovery
16
SAG/ Other Cost Increases
EBITDA Goal at Normal Demand
> $2 Billion
Other Segments Volume
and Margin Expansion
Aggregates Volume
and Margin Expansion
2014 Adjusted EBITDA
$600 million
$1,300 million $175 million -$60 million
See Appendix for reconciliation Non-GAAP measures
March 10, 2015

Notes
2014 Year-over-Year Improvement
Effective Management
Drives Growth in
Unit Profitability
Gross Profit $3.35 / Ton
+18%
Drivers of aggregates gross profit expansion
Sales and Production
Mix
Operating Efficiency
and Leverage
Price for Service
Recovery serves as a tailwind for all 3 drivers
17 March 10, 2015
Notes
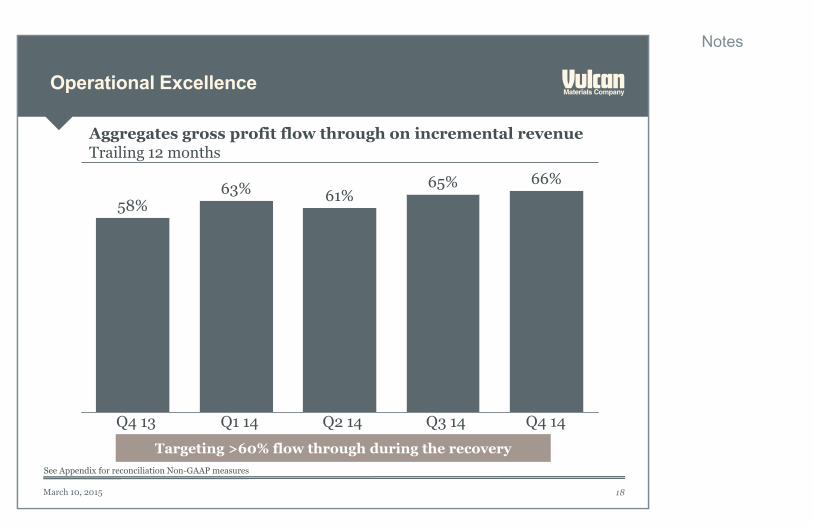
Operational Excellence
18
58% 61% 63%
Q4 13 Q1 14 Q2 14 Q4 14
66%
Q3 14
65%
Aggregates gross profit flow through on incremental revenue Trailing 12 months
Targeting >60% flow through during the recovery See Appendix for reconciliation Non-GAAP measures
March 10, 2015

Notes
Five core disciplines we focus on every day
19
Grow shipments and revenues faster than the market as a whole
Sales and marketing excellence
Achieve 60% flow through of incremental aggregates revenue
Operational excellence
Drive SAG expenses to 6% of sales
SAG productivity
Significantly increase capital turnover while enhancing the efficiency of our operations
Capital productivity
Improve both longer-term growth and returns on capital already in place
Portfolio management
1 2 3 4 5
March 10, 2015

Notes
Rapidly improving credit metrics
20
1.62.02.5
3.44.3
6.8
2015P 2016P 13 14 2017P 2012
Debt/Adjusted EBITDA
Notes: FYE 13 is pro forma for the $506 million debt purchase completed Q1 14. Figures for 2015-17 assume ~$2 billion of debt outstanding and consensus EBITDA estimates. See Appendix for reconciliation Non-GAAP measures.
Credit metrics should reach investment grade levels during 2015
March 10, 2015

Notes
Capital allocation priorities during recovery phase
21
Operating CAPEX
Financial strength and flexibility
Progressive dividend growth with earnings
Bolt-on acquisitions
Current intent: Return remaining excess cash to shareholders, primarily via share repurchases
March 10, 2015

Notes
Capital allocation through the cycle Illustrative approach
22
Maintain investment grade metrics/ratings and access to capital markets at all points in the cycle.
Recovery Phase
Expansion Phase
Accelerate dividend growth consistent with earnings
Return excess cash with preference for share repurchases
Fund growth preferably with debt
Maintain dividend
Strengthen balance sheet; prudently manage financial leverage
Return excess cash with preference for regular or special dividends
Fund growth preferably with equity
March 10, 2015

Notes
Why Vulcan - Summary
23
‘Pure play’ U.S. aggregates business with double-digit growth potential
Earnings leverage at each stage in the P&L
Significant return of capital
An investment-grade balance sheet
An advantaged aggregates asset base and franchise of lasting value
Disciplined portfolio management
Recognized industry leader
Significant upside to eventual growth in US infrastructure investment
Potential for further reductions in cost of capital
1
2
3
4
5
6
7
8
9
March 10, 2015

Notes
Other Information Please visit our website at vulcanmaterials.com for additional information about our company
Investor Relations: [email protected]; (205) 298-3191
Media Relations: [email protected]; (205) 298-3220

Notes
Safe harbor
25
This document contains forward-looking statements. Statements that are not historical fact, including statements about Vulcan's beliefs and expectations, are forward-looking statements. Generally, these statements relate to future financial performance, results of operations, business plans or strategies, projected or anticipated revenues, expenses, earnings (including EBITDA and other measures), dividend policy, shipment volumes, pricing, levels of capital expenditures, intended cost reductions and cost savings, anticipated profit improvements and/or planned divestitures and asset sales. These forward-looking statements are sometimes identified by the use of terms and phrases such as "believe," "should," "would," "expect," "project," "estimate," "anticipate," "intend," "plan," "will," "can," "may" or similar expressions elsewhere in this document. These statements are subject to numerous risks, uncertainties, and assumptions, including but not limited to general business conditions, competitive factors, pricing, energy costs, and other risks and uncertainties discussed in the reports Vulcan periodically files with the SEC. Forward-looking statements are not guarantees of future performance and actual results, developments, and business decisions may vary significantly from those expressed in or implied by the forward-looking statements. The following risks related to Vulcan's business, among others, could cause actual results to differ materially from those described in the forward-looking statements: those associated with general economic and business conditions; the timing and amount of federal, state and local funding for infrastructure; changes in Vulcan’s effective tax rate that can adversely impact results; the increasing reliance on information technology infrastructure for Vulcan’s ticketing, procurement, financial statements and other processes could adversely affect operations in the event such infrastructure does not work as intended or experiences technical difficulties or is subjected to cyber attacks; the impact of the state of the global economy on Vulcan’s businesses and financial condition and access to capital markets; changes in the level of spending for private residential and private nonresidential construction; the highly competitive nature of the construction materials industry; the impact of future regulatory or legislative actions; the outcome of pending legal proceedings; pricing of Vulcan's products; weather and other natural phenomena; energy costs; costs of hydrocarbon-based raw materials; healthcare costs; the amount of long-term debt and interest expense incurred by Vulcan; changes in interest rates; the impact of Vulcan's below investment grade debt rating on Vulcan's cost of capital; volatility in pension plan asset values and liabilities which may require cash contributions to the pension plans; the impact of environmental clean-up costs and other liabilities relating to previously divested businesses; Vulcan's ability to secure and permit aggregates reserves in strategically located areas; changes in our management team and our new divisional structure; Vulcan's ability to manage and successfully integrate acquisitions; the potential of goodwill or long-lived asset impairment; the potential impact of future legislation or regulations relating to climate change or greenhouse gas emissions or the definition of minerals; and other assumptions, risks and uncertainties detailed from time to time in the reports filed by Vulcan with the SEC. All forward-looking statements in this communication are qualified in their entirety by this cautionary statement. Vulcan disclaims and does not undertake any obligation to update or revise any forward-looking statement in this document except as required by law.
March 10, 2015

Notes
Appendix Reconciliation of Non-GAAP Financial Measures
26
EBITDA
EBITDA and Adjusted EBITDA(in millions) 2014 2013 2012 2006Net earnings $205 $24 ($53) $470Provision for (benefit from) income taxes 92 (24) (67) 223Interest expense, net 242 202 212 20Discontinued operations, net of tax 2 (4) (1) 10
EBIT $541 $198 $91 $723Depreciation, depletion, accretion and amortization 280 307 332 225
EBITDA $821 $505 $423 $948Gain on sale of real estate and businesses (238) (37) (65) (25)Charges/gains associated with acquisitions and divestitures 21 0 0 (28)Amortization of deferred revenue (5) (2) 0 0Exchange offer costs 0 0 43 0Restructuring charges 1 2 10 0
Adjusted EBITDA $600 $468 $411 $895
Other Segments (Asphalt Mix, Concrete, Calcium) Cash Gross Profit 2014Other segments gross profit $43.5Depr., depl., accretion and amort. 32.2
Other segments cash gross profit $75.7
EBITDA is an acronym for Earnings Before Interest, Taxes, Depreciation and Amortization and excludes discontinued operations. GAAP does not define EBITDA. Thus, it should not be considered as an alternative to any earnings measure defined by GAAP. We present this metric for the convenience of investment professionals who use this metric in their analysis, and for shareholders who need to understand the metrics we use to assess performance. The investment community often uses this metric to assess the operating performance of a company's business. We use EBITDA to assess the operating performance of our various business units and the consolidated company. Additionally, we adjust EBITDA for certain items to provide a more consistent comparison of performance from period to period. Reconciliations of this metric to its nearest GAAP measure is presented below:
March 10, 2015

Notes
27
Appendix Reconciliation of Non-GAAP Financial Measures
Aggregates segment gross profit margin as a percentage of freight-adjusted revenues
Aggregates Q1 Q2 Q3 Q4 Q1 Q2 Q3 Q4 Q1 Q2(in millions) 2012 2012 2012 2012 2013 2013 2013 2013 2014 2014Gross profit $ 34.0 $111.8 $124.9 $ 81.3 $ 24.8 $127.1 $149.8 $111.6 $ 38.5 $161.7 Volume 29.5 38.7 39.4 33.4 27.9 39.6 42.8 35.7 29.6 43.6Freight-adjusted sales price $10.25 $10.38 $10.63 $10.45 $10.72 $10.75 $10.89 $10.82 $10.94 $11.08 Freight-adjusted revenues $301.9 $402.0 $418.6 $349.1 $298.6 $425.3 $465.7 $386.7 $324.1 $483.6
Aggregates Q3 Q4(in millions) 2014 2014Gross profit $188.0 $156.0
(0.8) (0.2) $188.8 $156.2
Volume 47.8 41.3Freight-adjusted sales price $11.12 $11.03 Freight-adjusted revenues $531.6 $455.1
6.2 11.7Freight-adjusted revenues excluding 2014 acquisitions $525.4 $443.4
Trailing 12 Months Q4 Q1 Q2 Q3 Q4Aggregates Incremental Margins (Excl. Acq.) 2013 2014 2014 2014 2014(in millions)Change in gross profit $ 61.2 $ 84.2 $103.5 $117.5 $131.8 Change in freight-adjusted revenues 104.8 133.5 168.5 181.1 200.5
58% 63% 61% 65% 66%
Aggregates segment gross profit margin as a percentage of freight-adjusted revenues is not a GAAP measure. We present Aggregates segment gross profit margin as a percentage of freight-adjusted revenues as it is consistent with the basis by which we review our operating results. We believe that this presentation is more meaningful to our investors as it excludes related transportation revenues (a pass-through activity) and other service-related revenues, such as landfill tipping fees. Reconciliation of this metric to its nearest GAAP measure is presented below:
Change in gross profit margin as a percentage of freight-adjusted revenues
Gross profit for 2014 acquisitionsGross profit excluding 2014 acquisitions
Freight-adjusted revenues for 2014 acquisitions
March 10, 2015


![PM 2014 investor day 2014-06-26-LAC Region Investor Day Slides [WEBSITE FINAL]](https://img.pdfslide.us/doc/110x75/577cbc651a28aba7118da312/pm-2014-investor-day-2014-06-26-lac-region-investor-day-slides-website-final.jpg)