Embed Size (px)
Citation preview
CONFIDENTIAL – AUTHORIZED USE ONLY
D E L I V E R I N G Q U A L I T Y O F L I F E
Investor Presentation
John Timberlake, President & CEO
July 2016
ART-923 Rev: A
Actual V-Go® Patient
2
Forward Looking Statements
This presentation shall not be deemed an offer to sell securities nor a solicitation of an offer to purchase securities. Any sale by the company shall be made pursuant to a definitive purchase agreement. Unless otherwise stated in this presentation, references to “Valeritas,” “we,” “us,” “our” or “our company” refer to Valeritas Holdings, Inc. and its subsidiaries.
This presentation contains estimates, projections and forward-looking statements. Our estimates, projections and forward-looking statements are based on our management’s current assumptions and expectations of future events and trends, which affect or may affect our business, strategy, operations or financial performance. Although we believe that these estimates, projections and forward-looking statements are based upon reasonable assumptions and expectations, they are subject to numerous known and unknown risks and uncertainties and are made in light of information currently available to us. Many important factors may adversely and materially affect our results as indicated in forward-looking statements. All statements other than statements of historical fact are forward-looking statements. The words “believe,” “may,” “might,” “could, “would”, ” “will,” “aim,” “estimate,” “continue,” “anticipate,” “intend,” “expect,” “plan” and similar words are intended to identify estimates, projections and forward-looking statements. Estimates, projections and forward-looking statements speak only as of the date they are made, and, except to the extent required by law, we undertake no obligation to update or review any estimate, projection or forward-looking statement because of new information, future events or other factors.Our estimates, projections and forward-looking statements may be influenced by one or more of the following factors: ▫ our history of operating losses and uncertainty regarding our ability to achieve profitability; ▫ our reliance on V-Go® Disposable Insulin Delivery Device, or V-Go, to generate all of our revenue; ▫ our inability to retain a high percentage of our patient customer base or our significant wholesale customers; ▫ the failure of V-Go to achieve and maintain market acceptance; ▫ our inability to operate in a highly competitive industry and to compete successfully against competitors with greater resources; ▫ competitive products and other technological breakthroughs that may render V-Go obsolete or less desirable; ▫ our inability to maintain or expand our sales and marketing infrastructure; ▫ any inaccuracies in our assumptions about the insulin-dependent diabetes market; ▫ manufacturing risks, including risks related to manufacturing in Southern China, damage to facilities or equipment and failure to
efficiently increase production to meet demand; ▫ our dependence on limited source suppliers and our inability to obtain components for our product; ▫ our failure to secure or retain adequate coverage or reimbursement for V-Go by third-party payers; ▫ our inability to enhance and broaden our product offering, including through the successful commercialization of the pre-fill V-Go; ▫ our inability to protect our intellectual property and proprietary technology;▫ our failure to comply with the applicable governmental regulations to which our product and operations are subject; ▫ our ability to operate as a going concern; and▫ our liquidity.
3
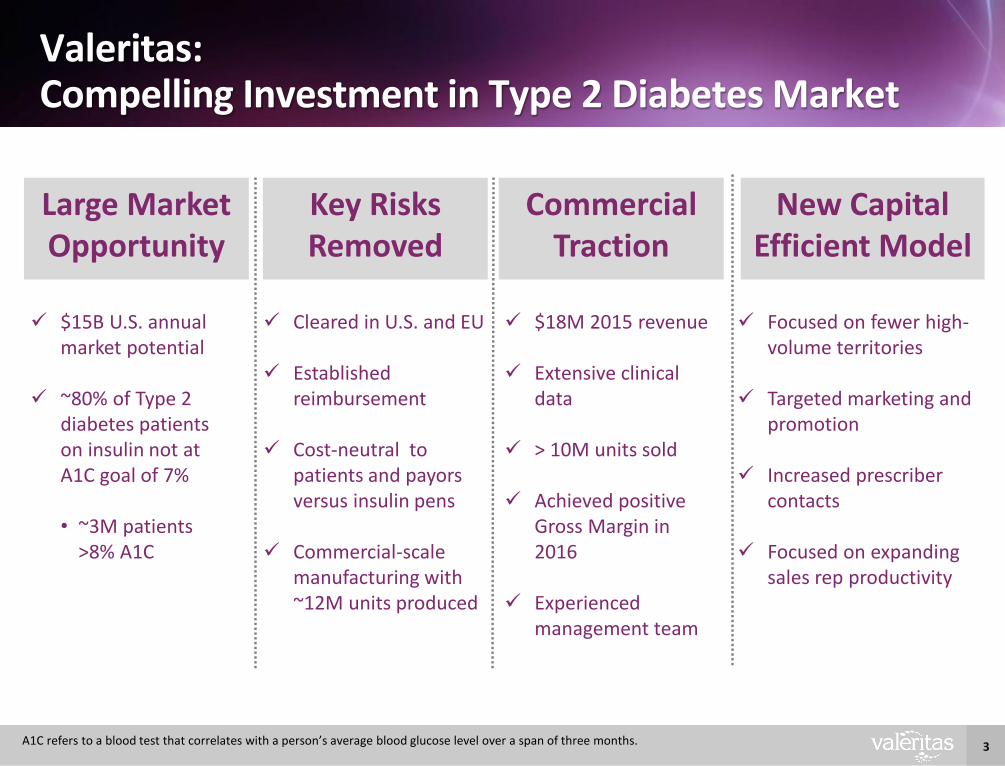
Valeritas: Compelling Investment in Type 2 Diabetes Market
Large MarketOpportunity
Key Risks Removed
Commercial Traction
New Capital Efficient Model
$15B U.S. annual market potential
~80% of Type 2 diabetes patients on insulin not at A1C goal of 7%
• ~3M patients >8% A1C
Cleared in U.S. and EU
Established reimbursement
Cost-neutral to patients and payorsversus insulin pens
Commercial-scale manufacturing with ~12M units produced
$18M 2015 revenue
Extensive clinical data
> 10M units sold
Achieved positive Gross Margin in 2016
Experienced management team
Focused on fewer high-volume territories
Targeted marketing and promotion
Increased prescriber contacts
Focused on expanding sales rep productivity
A1C refers to a blood test that correlates with a person’s average blood glucose level over a span of three months.
4
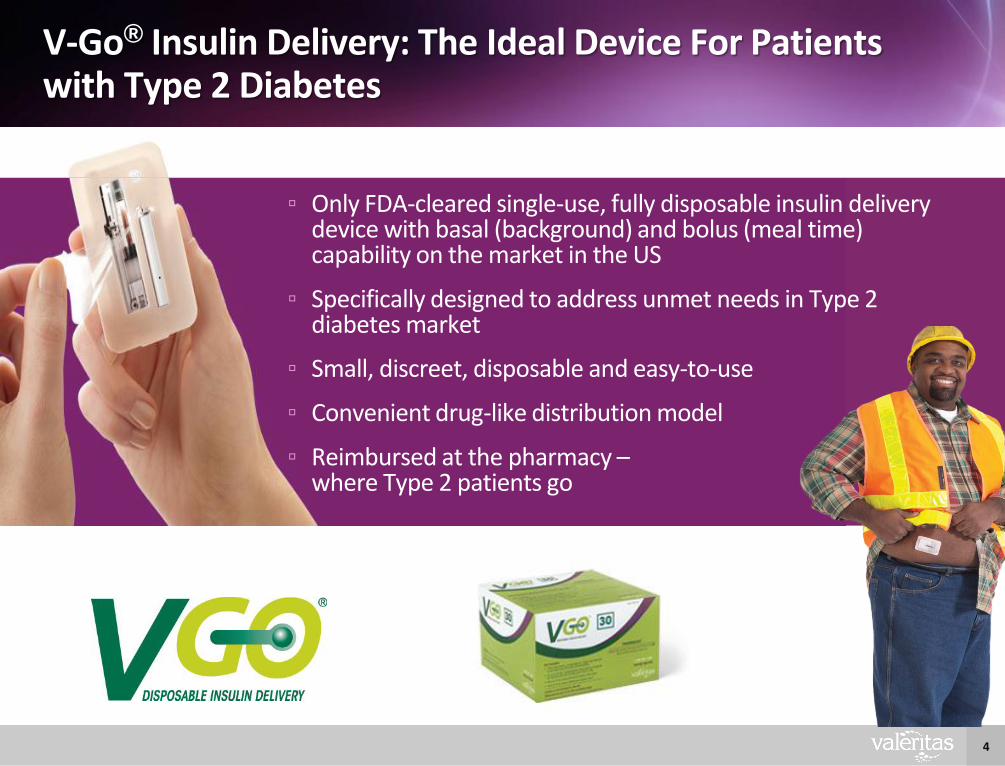
V-Go® Insulin Delivery: The Ideal Device For Patients with Type 2 Diabetes
▫ Only FDA-cleared single-use, fully disposable insulin delivery device with basal (background) and bolus (meal time) capability on the market in the US
▫ Specifically designed to address unmet needs in Type 2 diabetes market
▫ Small, discreet, disposable and easy-to-use
▫ Convenient drug-like distribution model
▫ Reimbursed at the pharmacy –where Type 2 patients go
5
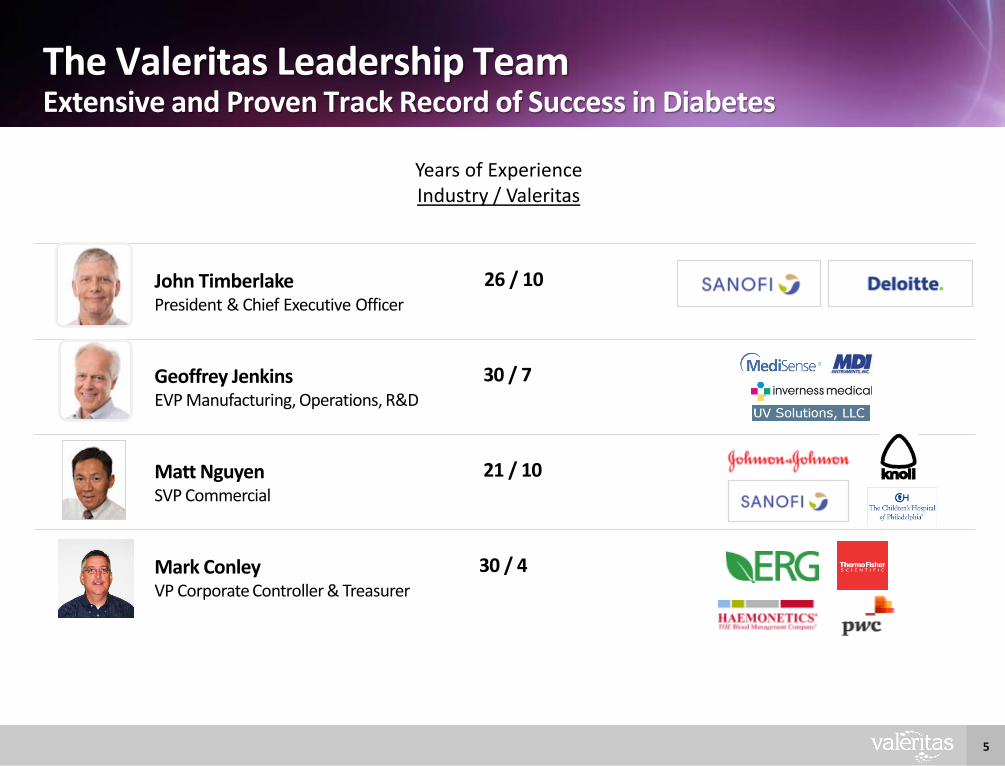
John TimberlakePresident & Chief Executive Officer
26 / 10
Geoffrey JenkinsEVP Manufacturing, Operations, R&D
30 / 7
Matt NguyenSVP Commercial
21 / 10
Mark ConleyVP Corporate Controller & Treasurer
30 / 4
The Valeritas Leadership TeamExtensive and Proven Track Record of Success in Diabetes
Years of ExperienceIndustry / Valeritas
6
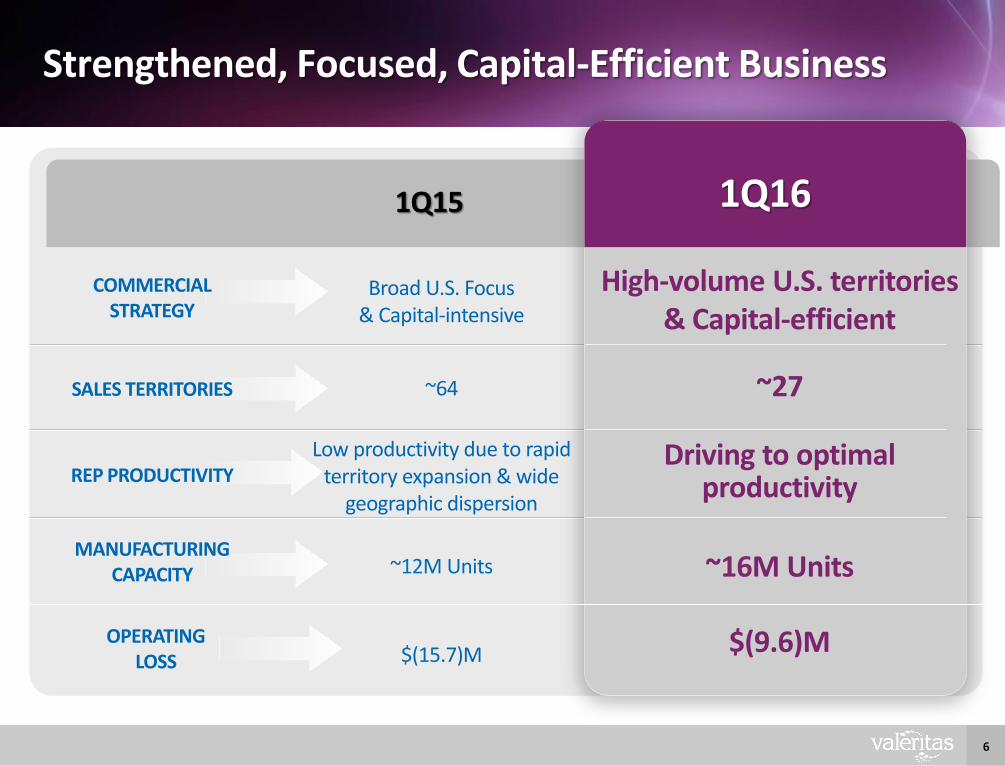
Strengthened, Focused, Capital-Efficient Business
Broad U.S. Focus & Capital-intensive
~64
Low productivity due to rapid territory expansion & wide
geographic dispersion
~12M Units
$(15.7)M
1Q16
COMMERCIAL STRATEGY
SALES TERRITORIES
REP PRODUCTIVITY
MANUFACTURING CAPACITY
High-volume U.S. territories& Capital-efficient
~27
Driving to optimal productivity
~16M Units
$(9.6)M
1Q15
OPERATINGLOSS
7
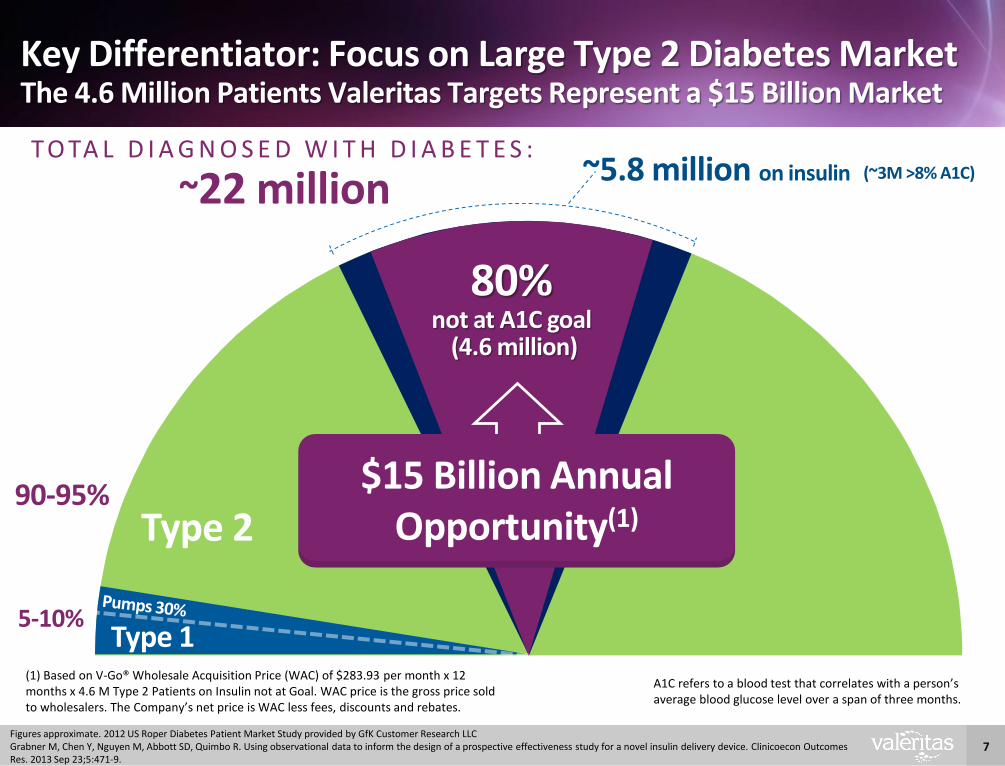
Key Differentiator: Focus on Large Type 2 Diabetes MarketThe 4.6 Million Patients Valeritas Targets Represent a $15 Billion Market
Figures approximate. 2012 US Roper Diabetes Patient Market Study provided by GfK Customer Research LLCGrabner M, Chen Y, Nguyen M, Abbott SD, Quimbo R. Using observational data to inform the design of a prospective effectiveness study for a novel insulin delivery device. Clinicoecon Outcomes Res. 2013 Sep 23;5:471-9.
Type 1
Type 2
T O TA L D I A G N O S E D W I T H D I A B E T E S :
~22 million
5-10%
90-95%
~5.8 million on insulin
80% not at A1C goal
(4.6 million)
A1C refers to a blood test that correlates with a person’s average blood glucose level over a span of three months.
$15 Billion AnnualOpportunity(1)
(1) Based on V-Go® Wholesale Acquisition Price (WAC) of $283.93 per month x 12 months x 4.6 M Type 2 Patients on Insulin not at Goal. WAC price is the gross price sold to wholesalers. The Company’s net price is WAC less fees, discounts and rebates.
(~3M >8% A1C)
8
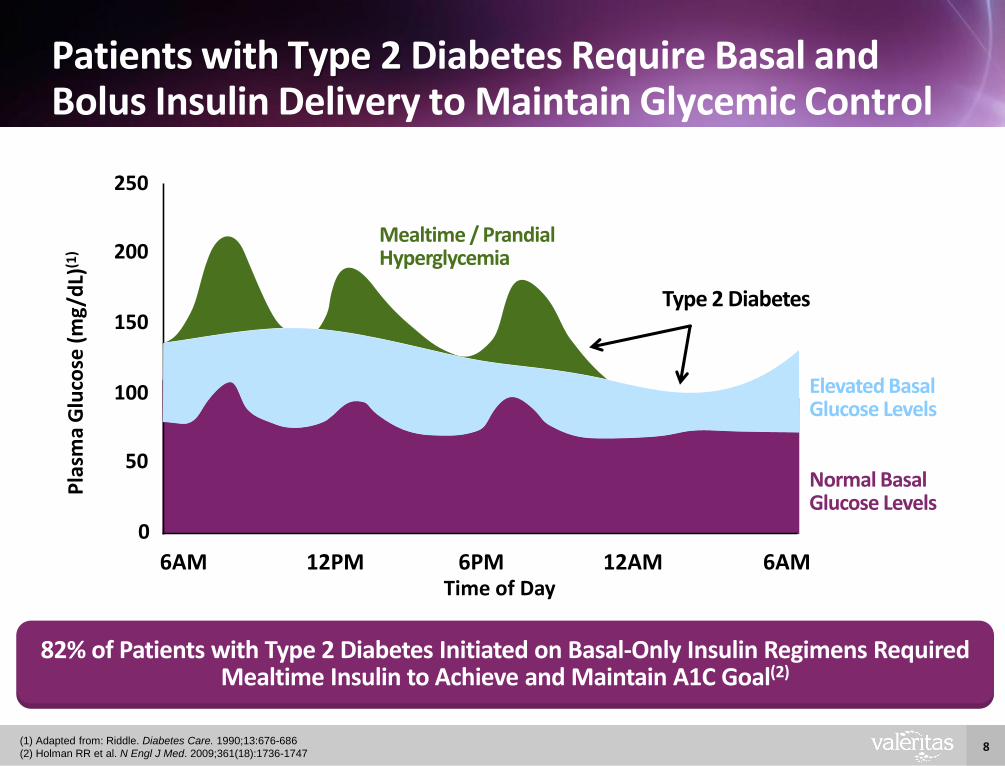
Patients with Type 2 Diabetes Require Basal and Bolus Insulin Delivery to Maintain Glycemic Control
(1) Adapted from: Riddle. Diabetes Care. 1990;13:676-686
(2) Holman RR et al. N Engl J Med. 2009;361(18):1736-1747
82% of Patients with Type 2 Diabetes Initiated on Basal-Only Insulin Regimens Required Mealtime Insulin to Achieve and Maintain A1C Goal(2)
Pla
sma
Glu
cose
(m
g/d
L)(1
) 200
100
0
6AM 12PM 6PM 12AM
Type 2 Diabetes
6AM
150
250
50
Mealtime / Prandial Hyperglycemia
Normal Basal Glucose Levels
Elevated Basal Glucose Levels
Time of Day
9
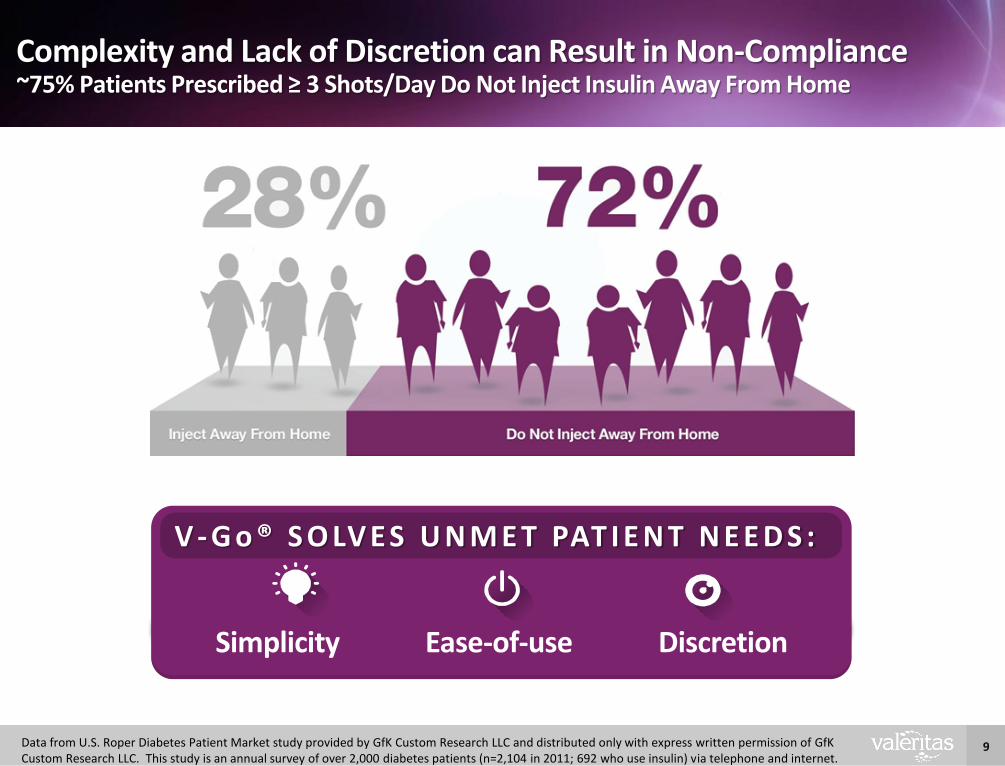
Complexity and Lack of Discretion can Result in Non-Compliance~75% Patients Prescribed ≥ 3 Shots/Day Do Not Inject Insulin Away From Home
Simplicity Ease-of-use Discretion
V - G o ® S O LV E S U N M E T PAT I E N T N E E D S :
Data from U.S. Roper Diabetes Patient Market study provided by GfK Custom Research LLC and distributed only with express written permission of GfKCustom Research LLC. This study is an annual survey of over 2,000 diabetes patients (n=2,104 in 2011; 692 who use insulin) via telephone and internet.
10
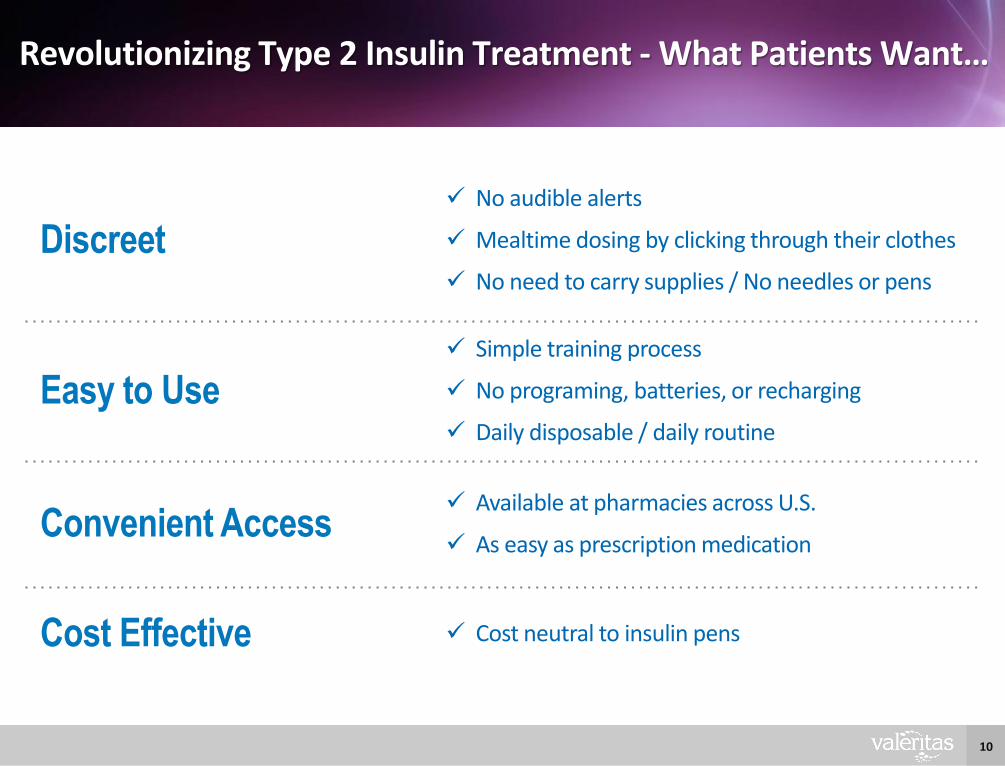
Revolutionizing Type 2 Insulin Treatment - What Patients Want…
Discreet
No audible alerts
Mealtime dosing by clicking through their clothes
No need to carry supplies / No needles or pens
Easy to Use
Simple training process
No programing, batteries, or recharging
Daily disposable / daily routine
Convenient Access Available at pharmacies across U.S.
As easy as prescription medication
Cost Effective Cost neutral to insulin pens
11
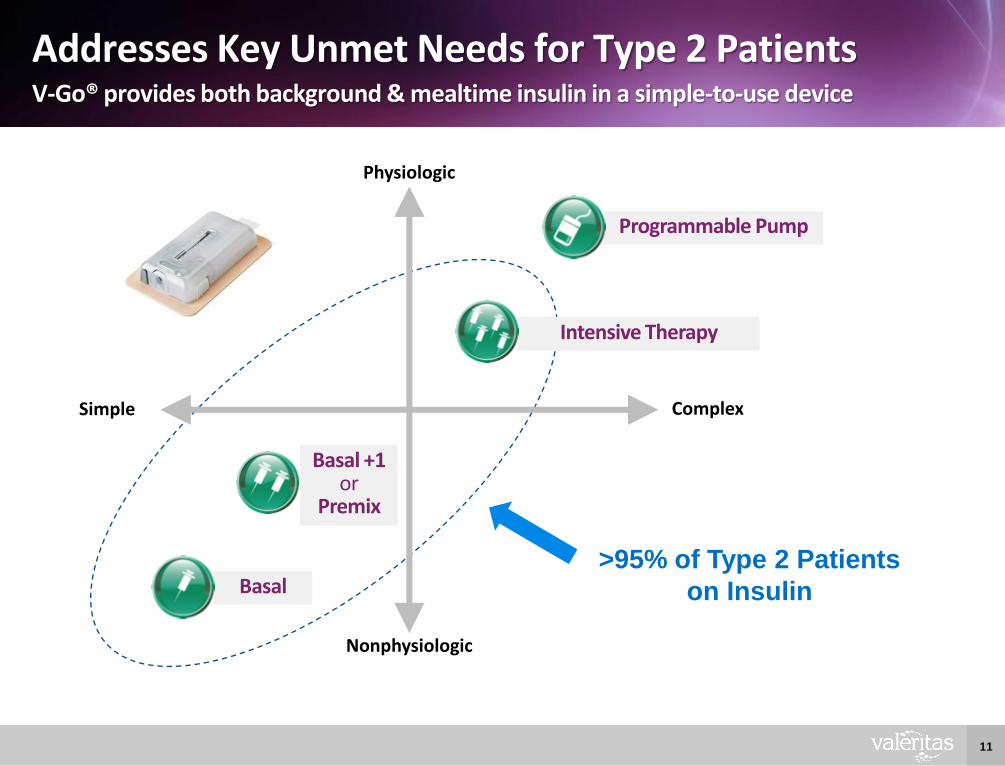
Addresses Key Unmet Needs for Type 2 PatientsV-Go® provides both background & mealtime insulin in a simple-to-use device
Complex
Physiologic
Nonphysiologic
Programmable Pump
Basal
Simple
Basal +1or
Premix
>95% of Type 2 Patients
on Insulin
Intensive Therapy
12
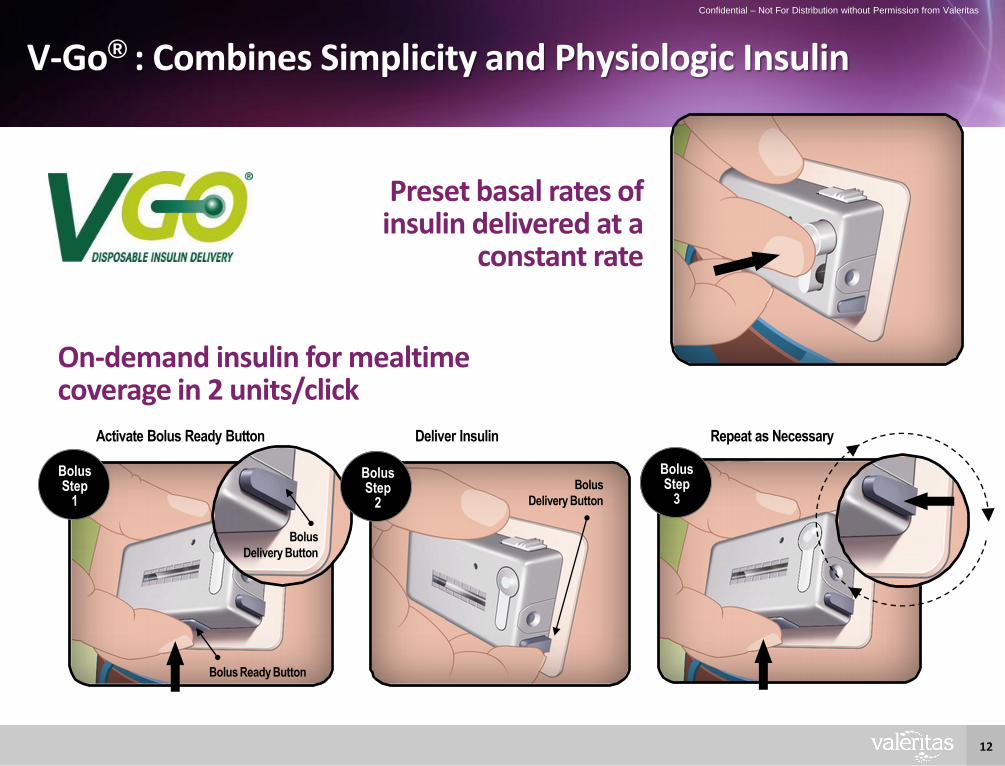
V-Go® : Combines Simplicity and Physiologic Insulin
Preset basal rates of insulin delivered at a
constant rate
On-demand insulin for mealtime coverage in 2 units/click
Bolus
Delivery Button
Activate Bolus Ready Button Deliver Insulin Repeat as Necessary
Bolus Ready Button
Bolus
Delivery Button
Bolus Step
1
Bolus Step
2
Bolus Step
3
Confidential – Not For Distribution without Permission from Valeritas
13(1) Rosenfeld CR, et al. Endocr Pract. 2012; 18 (5):660-667; (2) Grunberger, G, et al. Poster presented at 73rd Scientific Sessions of the ADA; 2013 June 21-25; Chicago, IL. 985-P; (3) Omer, A. et al. Poster presented at 73rd Scientific Sessions of the ADA; 2013 June 21-25; Chicago, IL. 980-P; (4) Lajara, et al. Drugs-Real World Outcomes [First online 02 June 2016]; (5) Lajara R, et al. Diabetes Ther. 2015;6 (4):531-545 ; (6) Lajara R et al. Endocr Pract. 2016 June; 22 (6): 726-725.
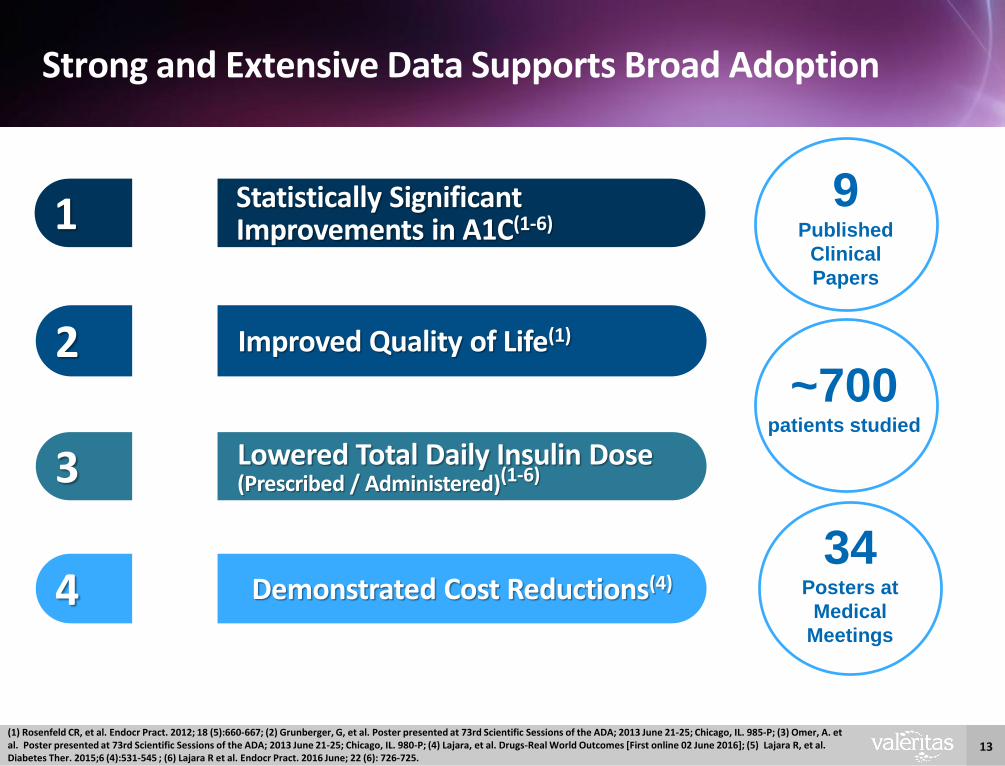
Strong and Extensive Data Supports Broad Adoption
Statistically Significant Improvements in A1C(1-6)1
Improved Quality of Life(1)2
Lowered Total Daily Insulin Dose (Prescribed / Administered)(1-6)3
Demonstrated Cost Reductions(4)4
9 Published
Clinical
Papers
34 Posters at
Medical
Meetings
~700 patients studied
14
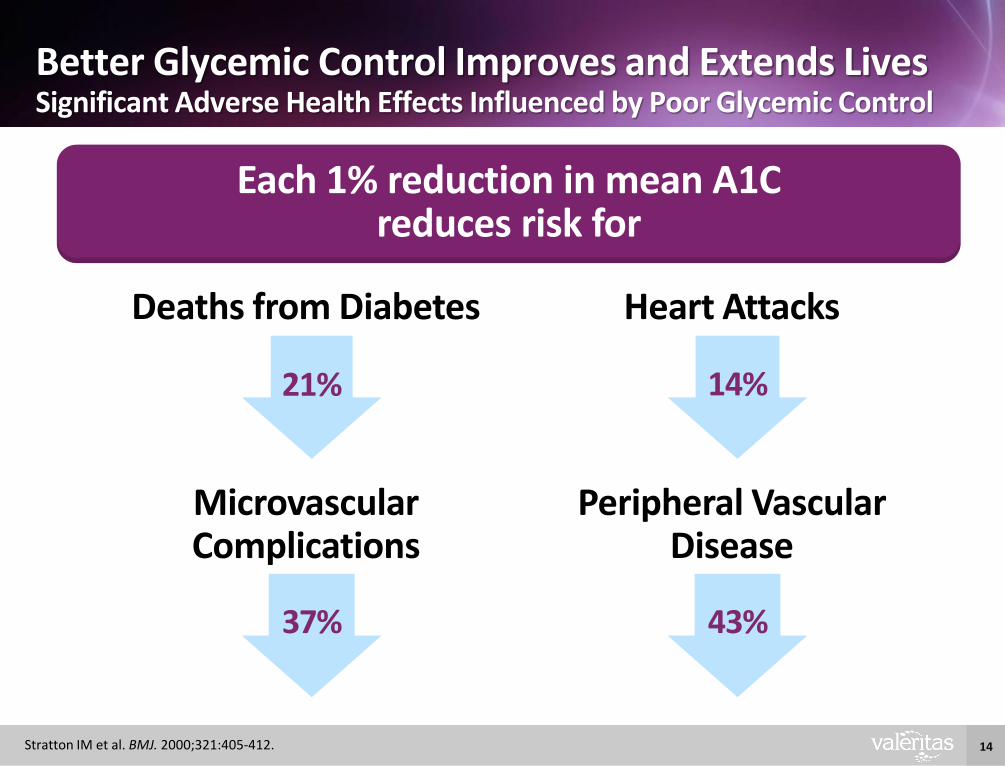
Better Glycemic Control Improves and Extends LivesSignificant Adverse Health Effects Influenced by Poor Glycemic Control
Stratton IM et al. BMJ. 2000;321:405-412.
21%
Deaths from Diabetes
14%
Heart Attacks
37%
Microvascular Complications
43%
Peripheral Vascular Disease
Each 1% reduction in mean A1C reduces risk for
15
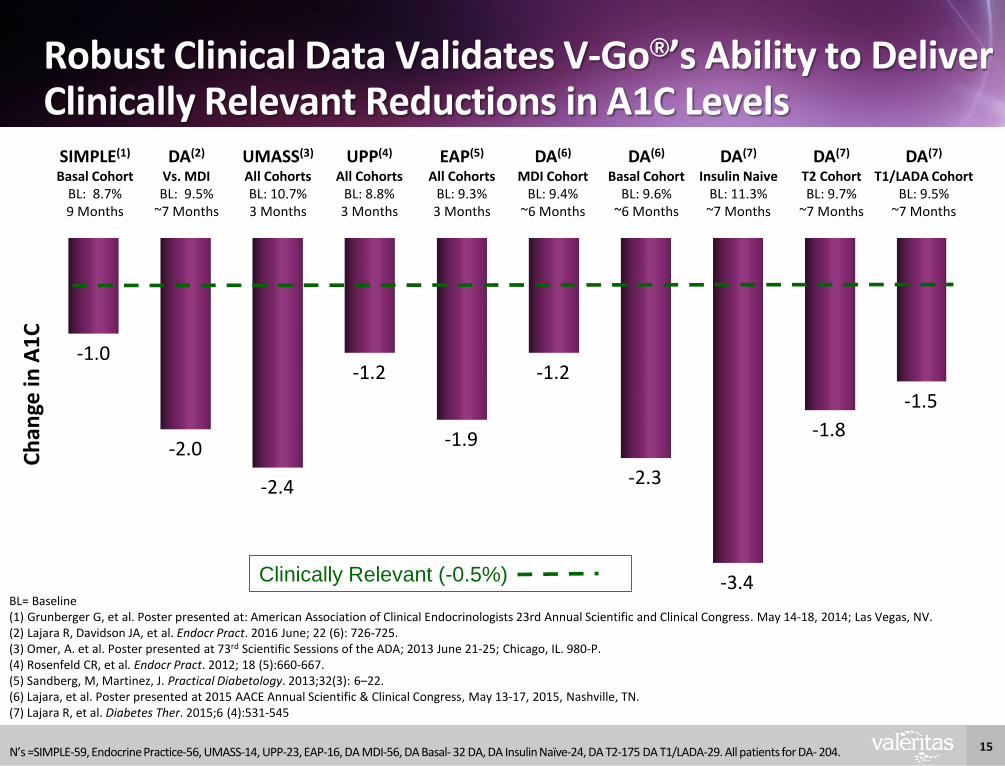
Robust Clinical Data Validates V-Go®’s Ability to Deliver Clinically Relevant Reductions in A1C Levels
-1.0
-2.0
-2.4
-1.2
-1.9
-1.2
-2.3
-3.4
-1.8
-1.5
Ch
ange
in A
1C
BL= Baseline(1) Grunberger G, et al. Poster presented at: American Association of Clinical Endocrinologists 23rd Annual Scientific and Clinical Congress. May 14-18, 2014; Las Vegas, NV. (2) Lajara R, Davidson JA, et al. Endocr Pract. 2016 June; 22 (6): 726-725.(3) Omer, A. et al. Poster presented at 73rd Scientific Sessions of the ADA; 2013 June 21-25; Chicago, IL. 980-P. (4) Rosenfeld CR, et al. Endocr Pract. 2012; 18 (5):660-667. (5) Sandberg, M, Martinez, J. Practical Diabetology. 2013;32(3): 6–22.(6) Lajara, et al. Poster presented at 2015 AACE Annual Scientific & Clinical Congress, May 13-17, 2015, Nashville, TN.(7) Lajara R, et al. Diabetes Ther. 2015;6 (4):531-545
N’s =SIMPLE-59, Endocrine Practice-56, UMASS-14, UPP-23, EAP-16, DA MDI-56, DA Basal- 32 DA, DA Insulin Naïve-24, DA T2-175 DA T1/LADA-29. All patients for DA- 204.
Clinically Relevant (-0.5%)
SIMPLE(1)
Basal CohortBL: 8.7%9 Months
DA(2)
Vs. MDIBL: 9.5%
~7 Months
UMASS(3)
All CohortsBL: 10.7%3 Months
UPP(4)
All CohortsBL: 8.8%3 Months
EAP(5)
All CohortsBL: 9.3%3 Months
DA(6)
MDI CohortBL: 9.4%
~6 Months
DA(6)
Basal CohortBL: 9.6%
~6 Months
DA(7)
Insulin NaiveBL: 11.3%~7 Months
DA(7)
T1/LADA CohortBL: 9.5%
~7 Months
DA(7)
T2 CohortBL: 9.7%
~7 Months
16
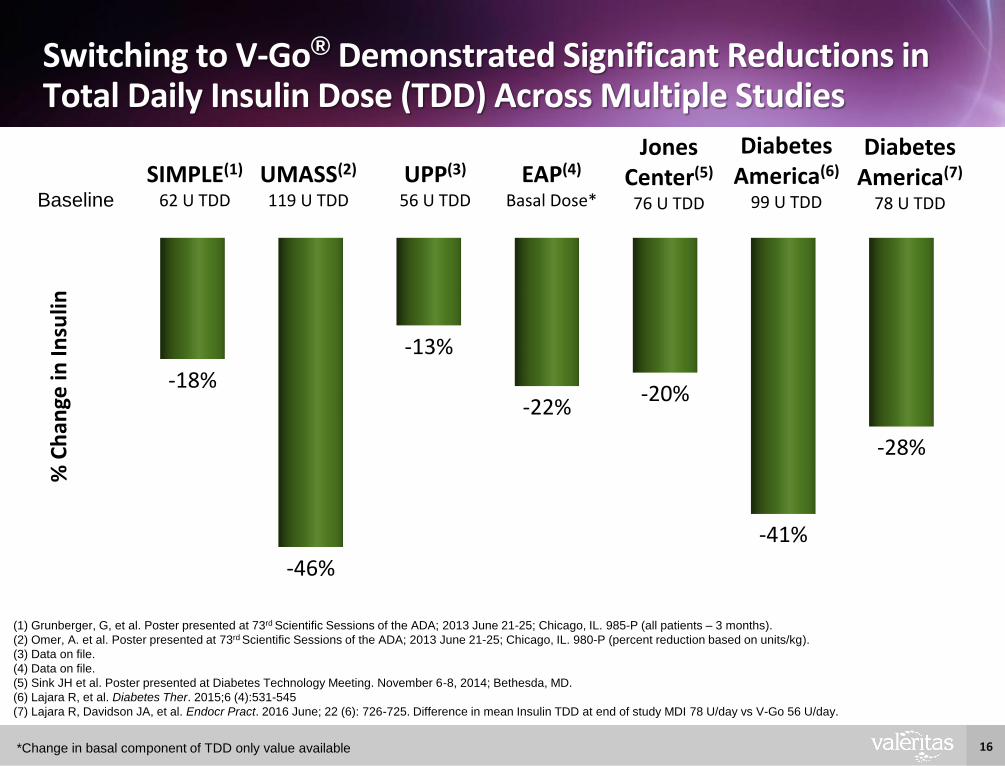
Switching to V-Go® Demonstrated Significant Reductions in Total Daily Insulin Dose (TDD) Across Multiple Studies
-18%
-46%
-13%
-22%-20%
-41%
-28%
% C
han
ge in
Insu
lin
(1) Grunberger, G, et al. Poster presented at 73rd Scientific Sessions of the ADA; 2013 June 21-25; Chicago, IL. 985-P (all patients – 3 months).
(2) Omer, A. et al. Poster presented at 73rd Scientific Sessions of the ADA; 2013 June 21-25; Chicago, IL. 980-P (percent reduction based on units/kg).
(3) Data on file.
(4) Data on file.
(5) Sink JH et al. Poster presented at Diabetes Technology Meeting. November 6-8, 2014; Bethesda, MD.
(6) Lajara R, et al. Diabetes Ther. 2015;6 (4):531-545
(7) Lajara R, Davidson JA, et al. Endocr Pract. 2016 June; 22 (6): 726-725. Difference in mean Insulin TDD at end of study MDI 78 U/day vs V-Go 56 U/day.
*Change in basal component of TDD only value available
Diabetes America(6)
99 U TDDBaseline
UPP(3)
56 U TDD
EAP(4)
Basal Dose*
UMASS(2)
119 U TDD
SIMPLE(1)
62 U TDD
Jones Center(5)
76 U TDD
Diabetes America(7)
78 U TDD
17
6.0
7.0
8.0
9.0
10.0
11.0
Pre V-Go On V-Go
10.7
8.3*
A1
C (
%)
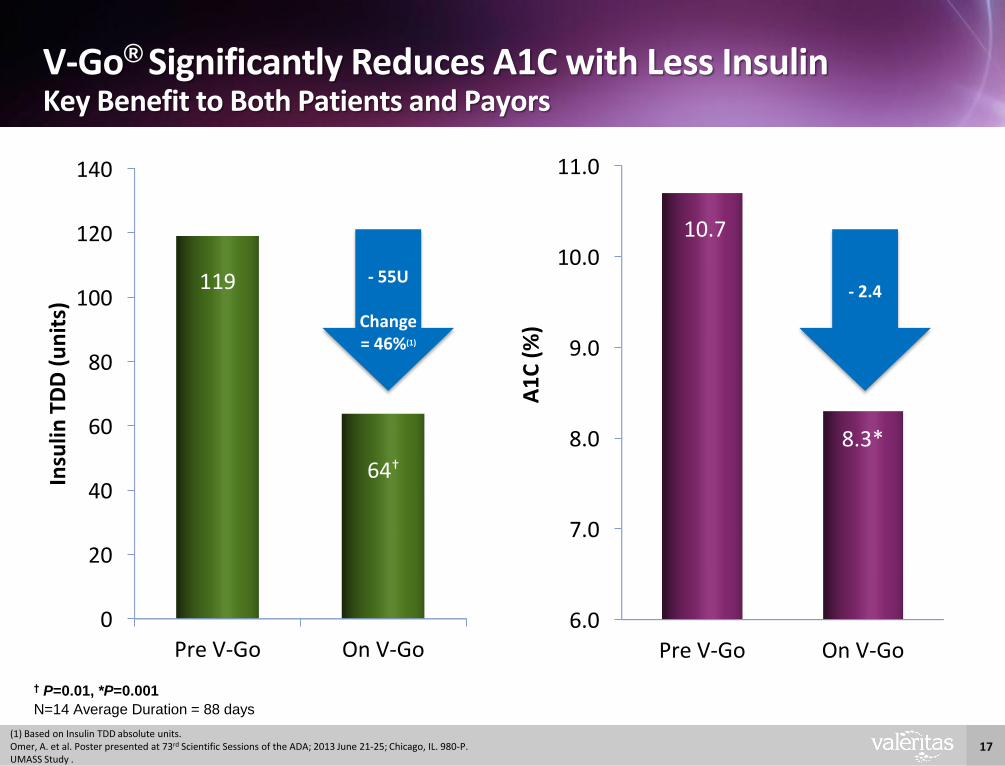
N=14 Average Duration = 88 days
0
20
40
60
80
100
120
140
Pre V-Go On V-Go
119
64†
Insu
lin T
DD
(u
nit
s)
† P=0.01, *P=0.001
Change
-2.4Change-55 U
V-Go® Significantly Reduces A1C with Less InsulinKey Benefit to Both Patients and Payors
(1) Based on Insulin TDD absolute units.Omer, A. et al. Poster presented at 73rd Scientific Sessions of the ADA; 2013 June 21-25; Chicago, IL. 980-P. UMASS Study .
Change-2.4
- 55U
Change = 46%(1)
- 2.4
18
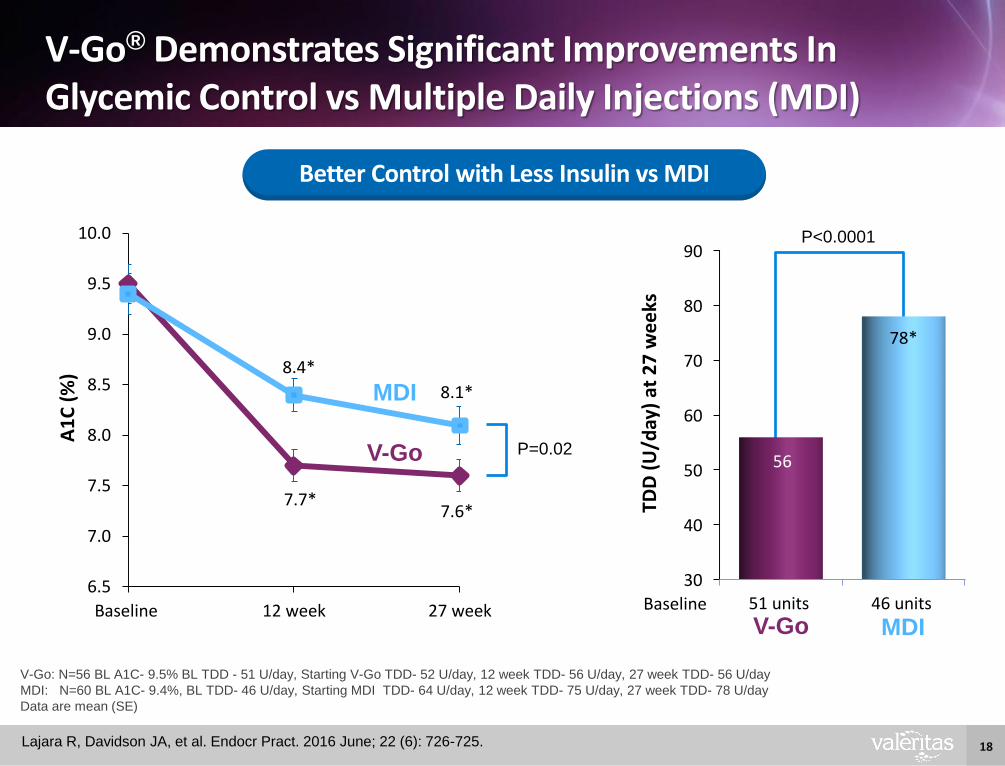
7.7*7.6*
8.4*
8.1*
6.5
7.0
7.5
8.0
8.5
9.0
9.5
10.0
Baseline 12 week 27 week
A1
C (
%)
V-Go: N=56 BL A1C- 9.5% BL TDD - 51 U/day, Starting V-Go TDD- 52 U/day, 12 week TDD- 56 U/day, 27 week TDD- 56 U/day
MDI: N=60 BL A1C- 9.4%, BL TDD- 46 U/day, Starting MDI TDD- 64 U/day, 12 week TDD- 75 U/day, 27 week TDD- 78 U/day
Data are mean (SE)
P=0.02
30
40
50
60
70
80
90
51 units 46 units
56
78*
TDD
(U
/day
) at
27
we
eks
Baseline
P<0.0001
V-Go® Demonstrates Significant Improvements In Glycemic Control vs Multiple Daily Injections (MDI)
Lajara R, Davidson JA, et al. Endocr Pract. 2016 June; 22 (6): 726-725.
Better Control with Less Insulin vs MDI
MDI
V-Go
MDIV-Go
19
$0
$50
$100
$150
$200
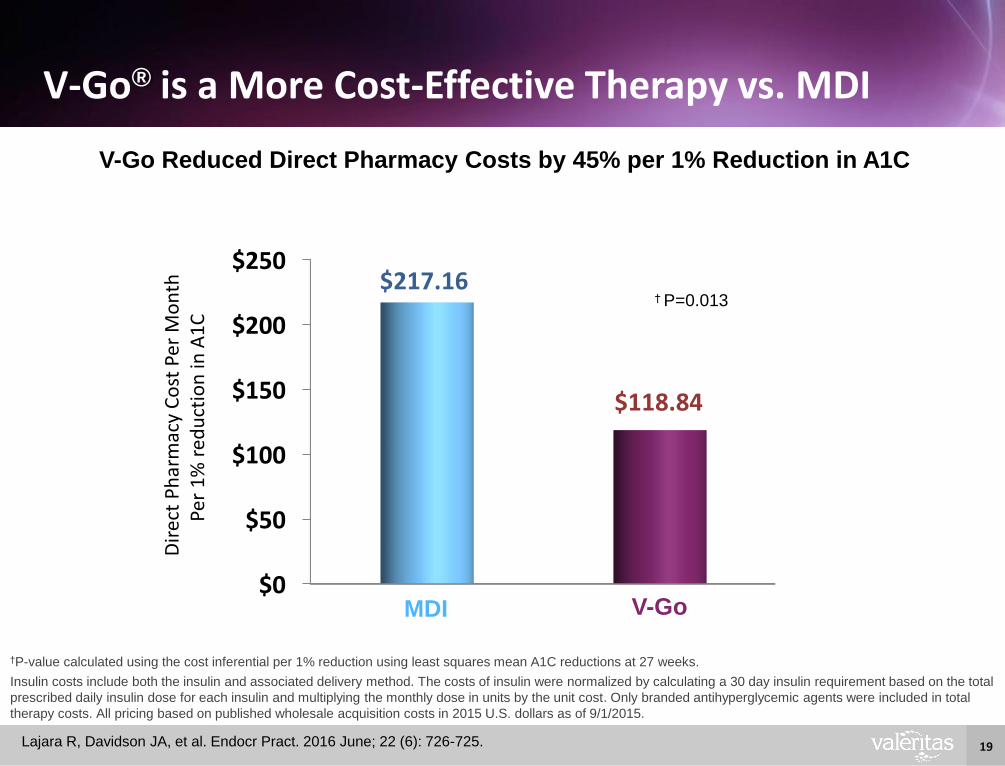
$250$217.16
$118.84
Insulin costs include both the insulin and associated delivery method. The costs of insulin were normalized by calculating a 30 day insulin requirement based on the total
prescribed daily insulin dose for each insulin and multiplying the monthly dose in units by the unit cost. Only branded antihyperglycemic agents were included in total
therapy costs. All pricing based on published wholesale acquisition costs in 2015 U.S. dollars as of 9/1/2015.
†P-value calculated using the cost inferential per 1% reduction using least squares mean A1C reductions at 27 weeks.
V-Go® is a More Cost-Effective Therapy vs. MDI
Lajara R, Davidson JA, et al. Endocr Pract. 2016 June; 22 (6): 726-725.
V-Go Reduced Direct Pharmacy Costs by 45% per 1% Reduction in A1C
† P=0.013
MDI V-Go
Dir
ect
Ph
arm
acy
Co
st P
er M
on
thPe
r 1
% r
edu
ctio
n in
A1
C
20
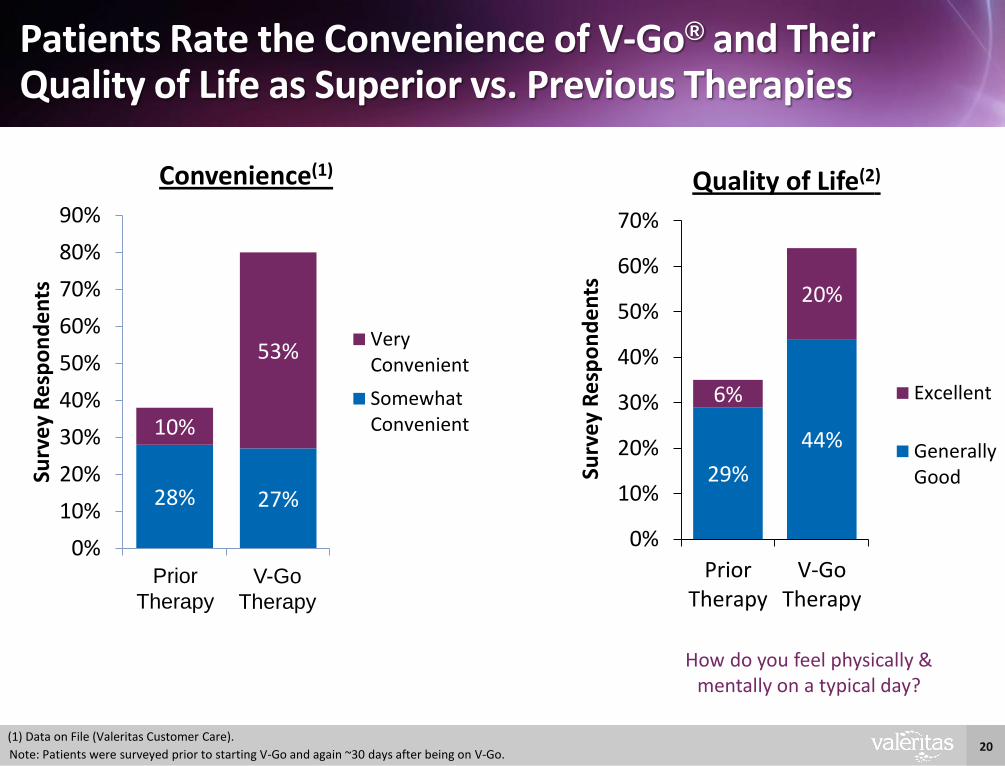
28% 27%
10%
53%
0%
10%
20%
30%
40%
50%
60%
70%
80%
90%
Surv
ey R
esp
on
de
nts
Convenience(1)
VeryConvenient
SomewhatConvenient
Note: Patients were surveyed prior to starting V-Go and again ~30 days after being on V-Go.
Patients Rate the Convenience of V-Go® and Their Quality of Life as Superior vs. Previous Therapies
Prior
Therapy
V-Go
Therapy
(1) Data on File (Valeritas Customer Care).
29%
44%
6%
20%
0%
10%
20%
30%
40%
50%
60%
70%
PriorTherapy
V-GoTherapy
Surv
ey
Re
spo
nd
en
ts
Quality of Life(2)
Excellent
GenerallyGood
How do you feel physically & mentally on a typical day?
21
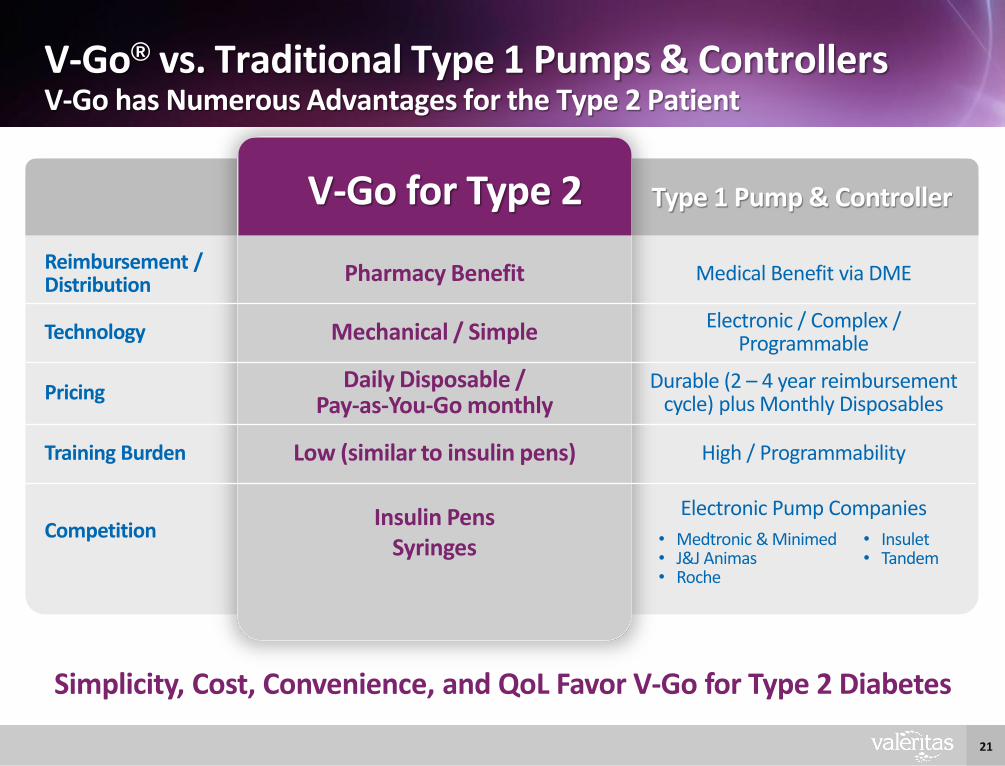
V-Go® vs. Traditional Type 1 Pumps & ControllersV-Go has Numerous Advantages for the Type 2 Patient
Simplicity, Cost, Convenience, and QoL Favor V-Go for Type 2 Diabetes
Type 1 Pump & Controller
Reimbursement / Distribution Pharmacy Benefit Medical Benefit via DME
Technology Mechanical / Simple Electronic / Complex / Programmable
PricingDaily Disposable /
Pay-as-You-Go monthlyDurable (2 – 4 year reimbursement
cycle) plus Monthly Disposables
Training Burden Low (similar to insulin pens) High / Programmability
CompetitionInsulin Pens
Syringes
Electronic Pump Companies
V-Go for Type 2
• Medtronic & Minimed• J&J Animas• Roche
• Insulet• Tandem
22
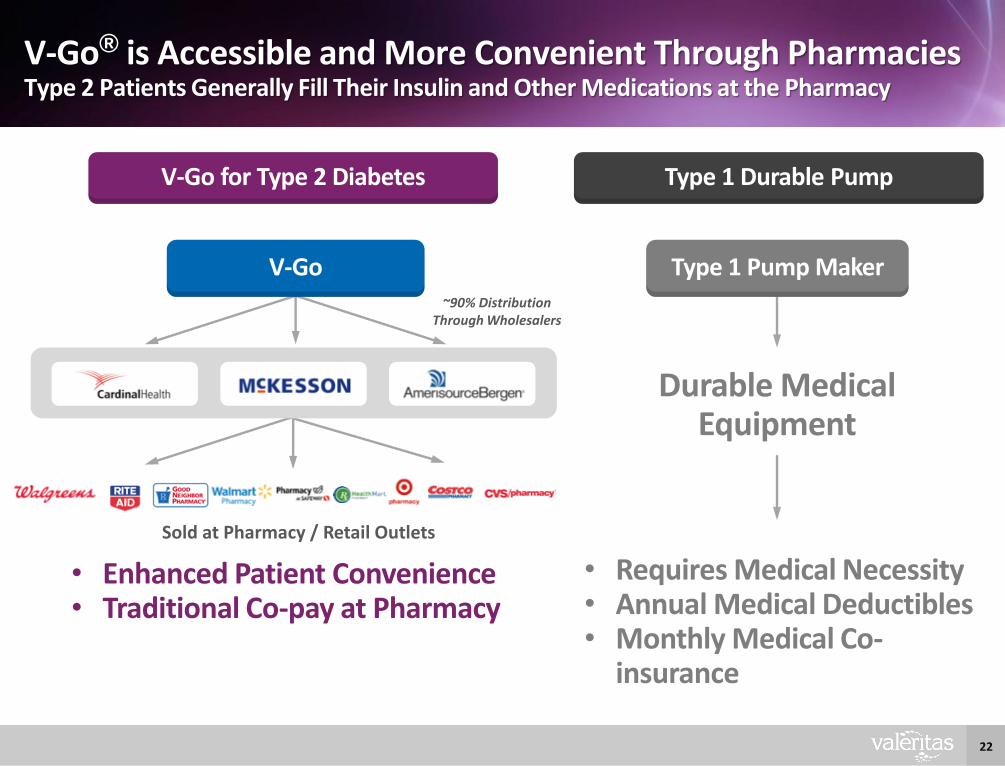
V-Go® is Accessible and More Convenient Through PharmaciesType 2 Patients Generally Fill Their Insulin and Other Medications at the Pharmacy
• Enhanced Patient Convenience• Traditional Co-pay at Pharmacy
~90% Distribution Through Wholesalers
Sold at Pharmacy / Retail Outlets
V-Go for Type 2 Diabetes
V-Go
Durable Medical Equipment
Type 1 Durable Pump
Type 1 Pump Maker
• Requires Medical Necessity• Annual Medical Deductibles• Monthly Medical Co-
insurance
23
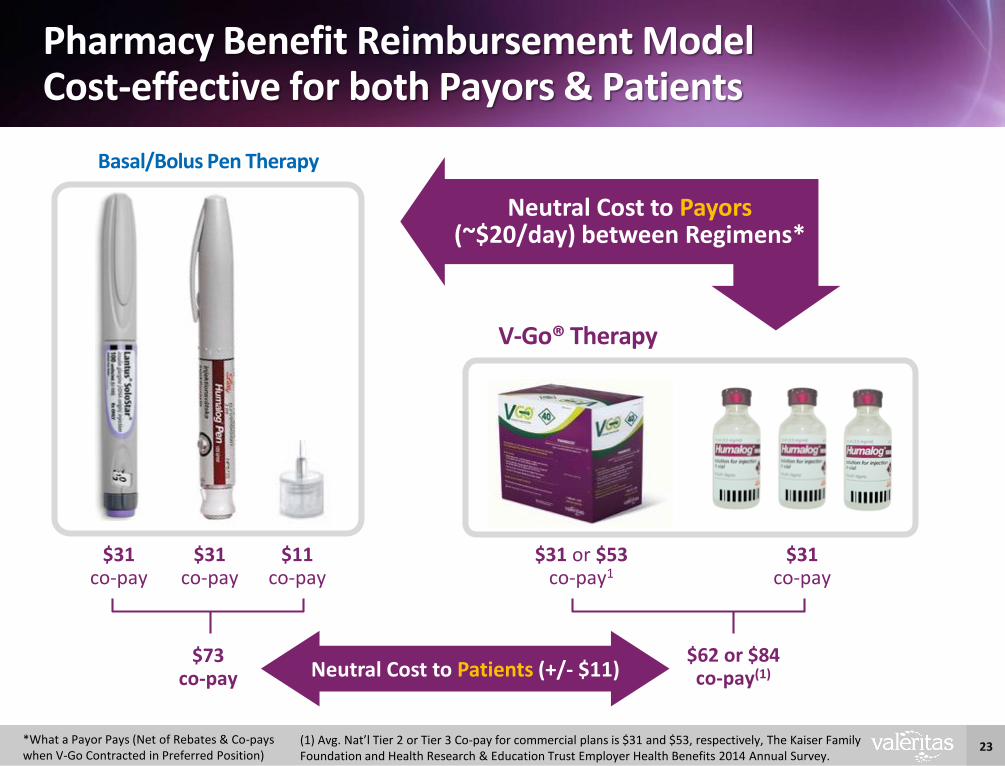
Pharmacy Benefit Reimbursement ModelCost-effective for both Payors & Patients
V-Go® Therapy
Basal/Bolus Pen Therapy
Neutral Cost to Payors(~$20/day) between Regimens*
*What a Payor Pays (Net of Rebates & Co-pays when V-Go Contracted in Preferred Position)
$31co-pay
$31co-pay
$11co-pay
$31co-pay
$31 or $53co-pay1
$73co-pay
$62 or $84co-pay(1)
(1) Avg. Nat’l Tier 2 or Tier 3 Co-pay for commercial plans is $31 and $53, respectively, The Kaiser Family Foundation and Health Research & Education Trust Employer Health Benefits 2014 Annual Survey.
Neutral Cost to Patients (+/- $11)
24
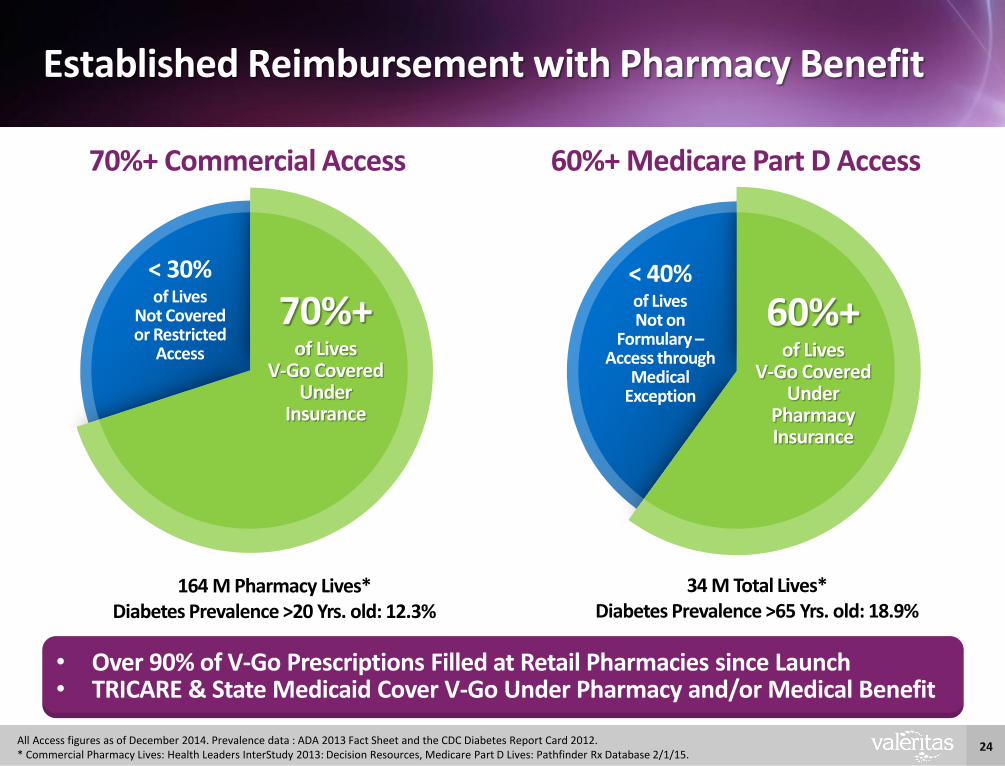
Established Reimbursement with Pharmacy Benefit
164 M Pharmacy Lives*Diabetes Prevalence >20 Yrs. old: 12.3%
34 M Total Lives*Diabetes Prevalence >65 Yrs. old: 18.9%
• Over 90% of V-Go Prescriptions Filled at Retail Pharmacies since Launch• TRICARE & State Medicaid Cover V-Go Under Pharmacy and/or Medical Benefit
All Access figures as of December 2014. Prevalence data : ADA 2013 Fact Sheet and the CDC Diabetes Report Card 2012.* Commercial Pharmacy Lives: Health Leaders InterStudy 2013: Decision Resources, Medicare Part D Lives: Pathfinder Rx Database 2/1/15.
60%+ Medicare Part D Access70%+ Commercial Access
< 30% of Lives
Not Covered or Restricted
Access
70%+of Lives
V-Go Covered Under
Insurance
< 40%of Lives Not on
Formulary –Access through
Medical Exception
60%+of Lives
V-Go Covered Under
Pharmacy Insurance
25
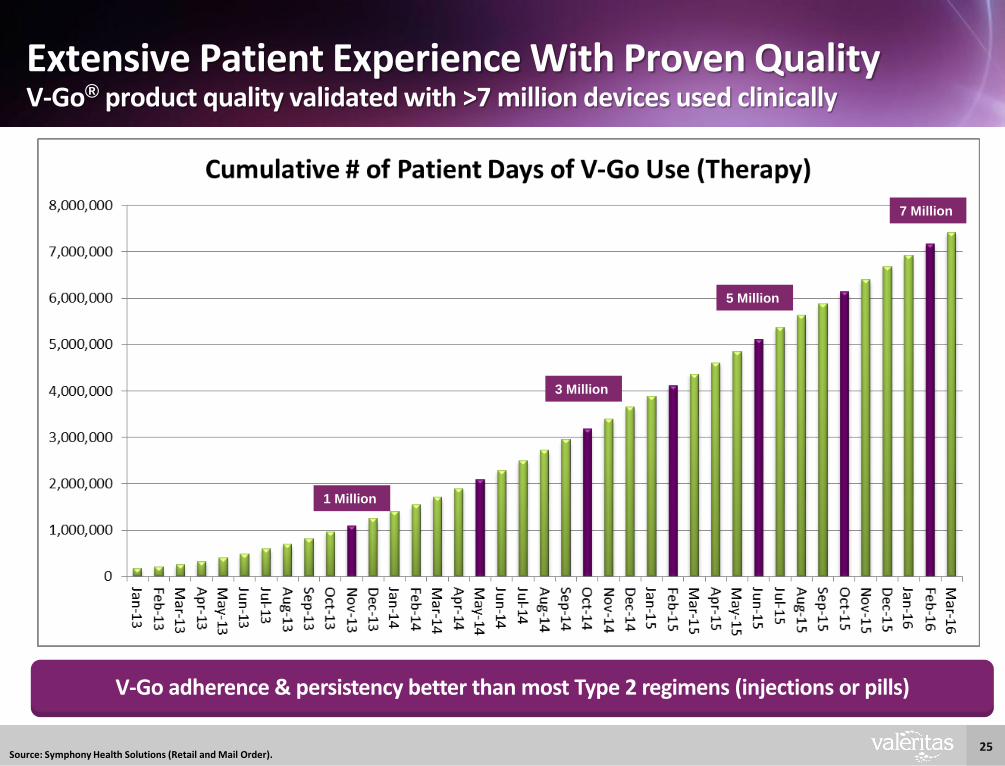
Extensive Patient Experience With Proven QualityV-Go® product quality validated with >7 million devices used clinically
Source: Symphony Health Solutions (Retail and Mail Order).
V-Go adherence & persistency better than most Type 2 regimens (injections or pills)
5 Million
3 Million
1 Million
7 Million
26
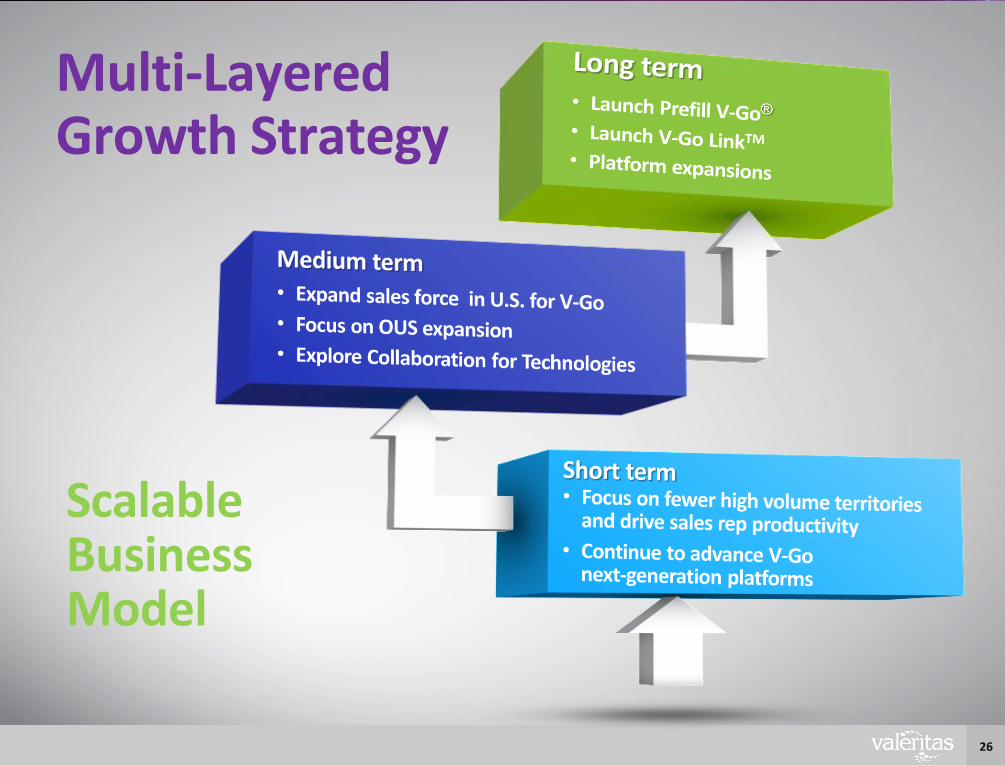
Scalable Business Model
Multi-Layered Growth Strategy
27
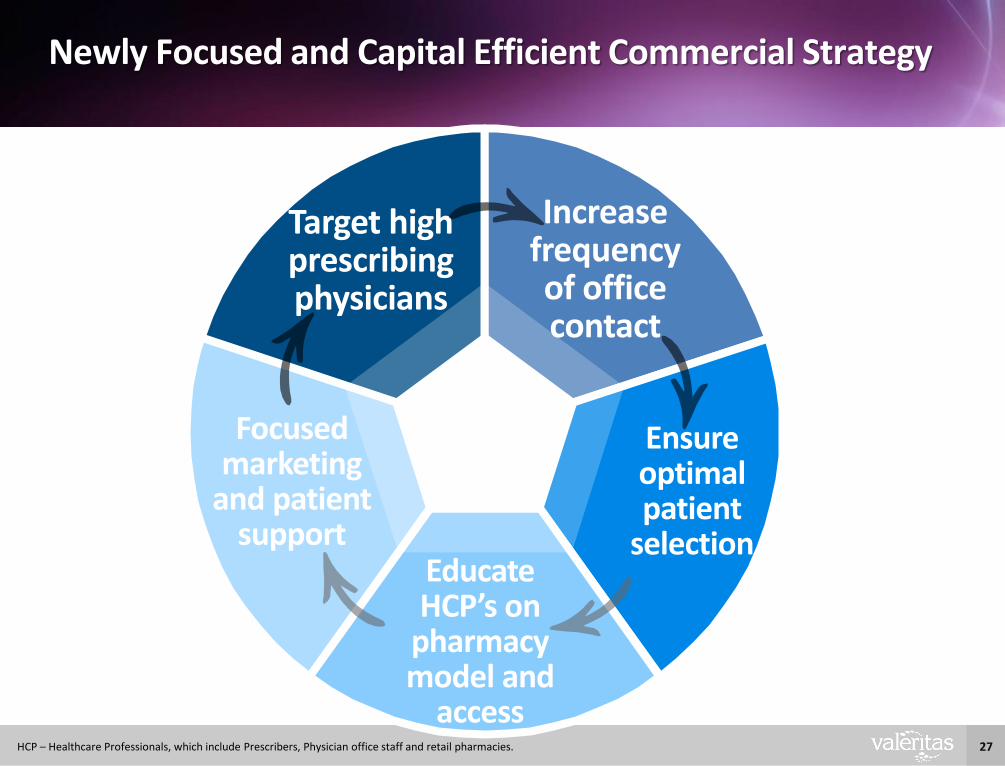
Newly Focused and Capital Efficient Commercial Strategy
Target high prescribing physicians
Increase frequency of office contact
Educate HCP’s on
pharmacy model and
access
Ensure optimal patient
selection
Focused marketing
and patient support
HCP – Healthcare Professionals, which include Prescribers, Physician office staff and retail pharmacies.
28
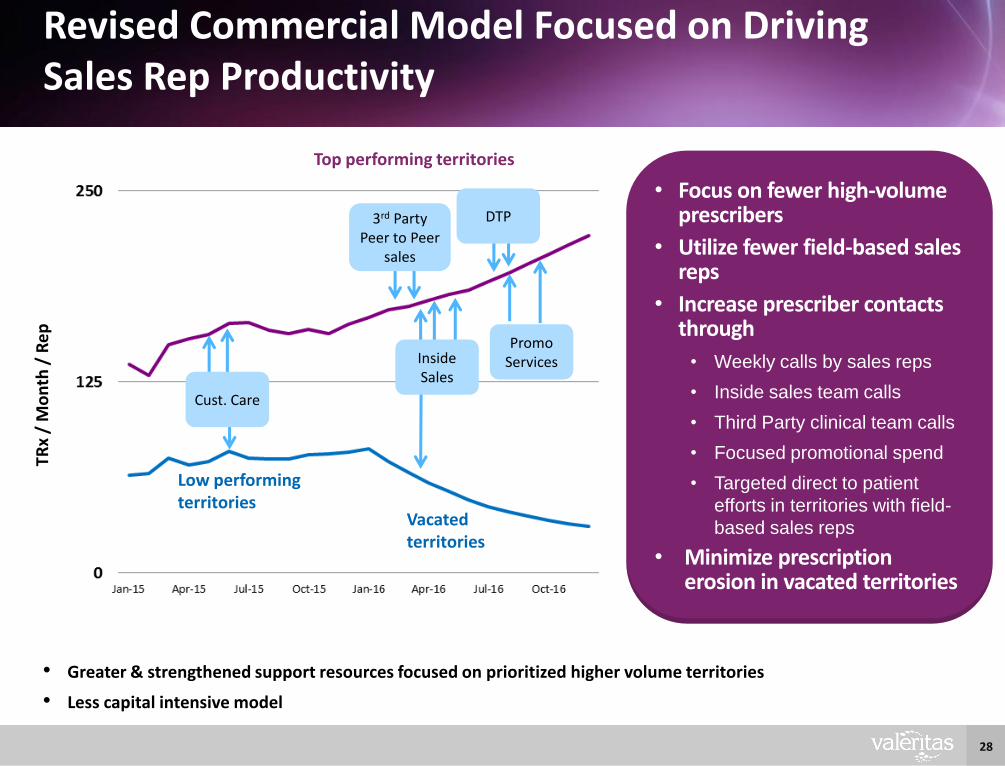
Revised Commercial Model Focused on Driving Sales Rep Productivity
Cust. Care
Promo Services
3rd Party Peer to Peer
sales
DTP
TRx
/ M
on
th /
Re
p
Inside Sales
Top performing territories
Low performing territories
Vacated territories
• Greater & strengthened support resources focused on prioritized higher volume territories
• Less capital intensive model
• Focus on fewer high-volume prescribers
• Utilize fewer field-based sales reps
• Increase prescriber contacts through
• Weekly calls by sales reps
• Inside sales team calls
• Third Party clinical team calls
• Focused promotional spend
• Targeted direct to patient
efforts in territories with field-
based sales reps
• Minimize prescription erosion in vacated territories
29
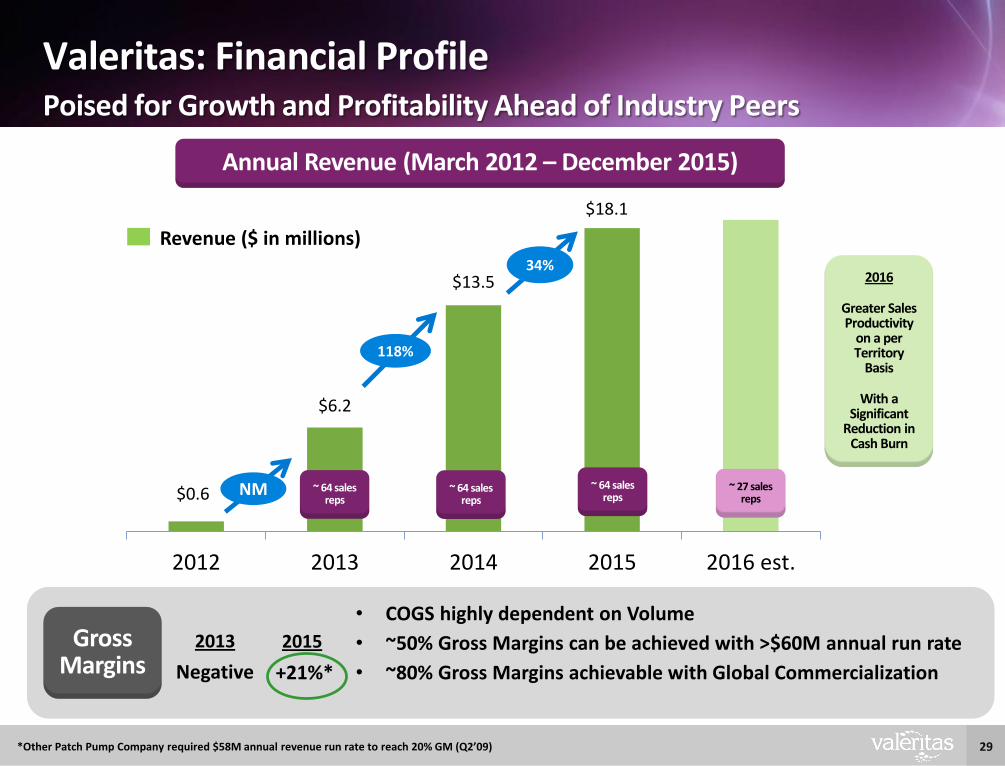
$0.6
$6.2
$13.5
$18.1
2012 2013 2014 2015 2016 est.
Valeritas: Financial ProfilePoised for Growth and Profitability Ahead of Industry Peers
Gross Margins
Revenue ($ in millions)
• COGS highly dependent on Volume
• ~50% Gross Margins can be achieved with >$60M annual run rate
• ~80% Gross Margins achievable with Global Commercialization
2013
Negative
2015
+21%*
Annual Revenue (March 2012 – December 2015)
34%
118%
NM ~ 64 sales reps
~ 27 sales reps
~ 64 sales reps
~ 64 sales reps
2016
Greater Sales Productivity
on a per Territory
Basis
With a Significant
Reduction in Cash Burn
*Other Patch Pump Company required $58M annual revenue run rate to reach 20% GM (Q2’09)
30
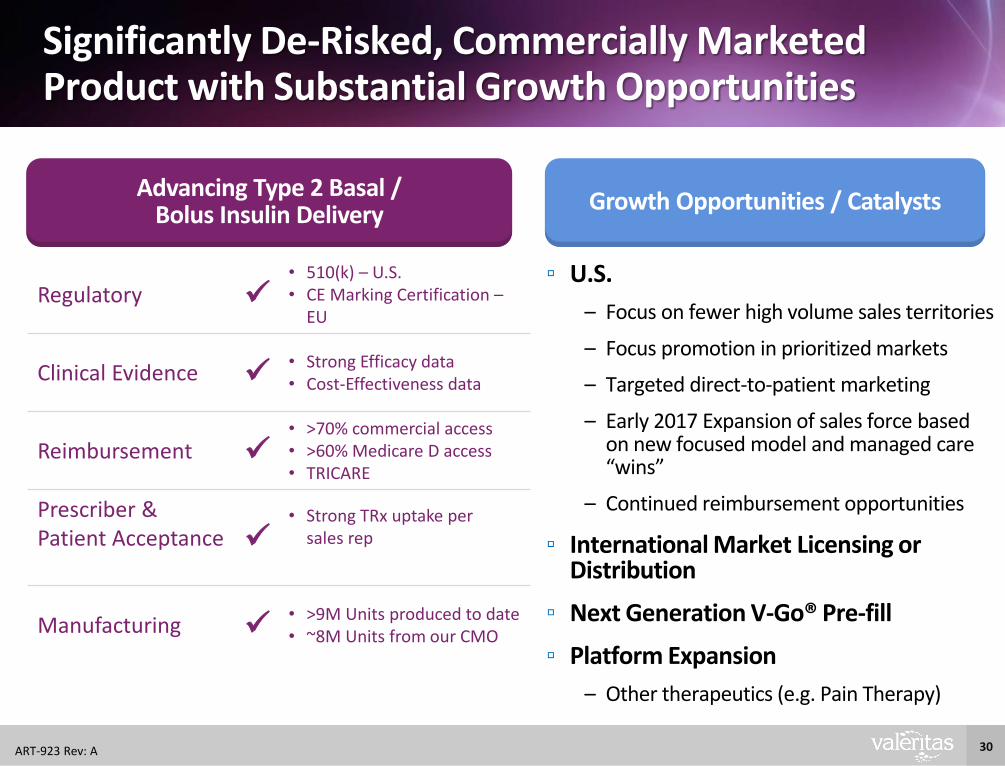
Significantly De-Risked, Commercially Marketed Product with Substantial Growth Opportunities
Regulatory
• 510(k) – U.S.• CE Marking Certification –
EU
Clinical Evidence • Strong Efficacy data• Cost-Effectiveness data
Reimbursement
• >70% commercial access • >60% Medicare D access• TRICARE
Prescriber & Patient Acceptance
• Strong TRx uptake per sales rep
Manufacturing • >9M Units produced to date• ~8M Units from our CMO
Advancing Type 2 Basal / Bolus Insulin Delivery
Growth Opportunities / Catalysts
▫ U.S.
– Focus on fewer high volume sales territories
– Focus promotion in prioritized markets
– Targeted direct-to-patient marketing
– Early 2017 Expansion of sales force based on new focused model and managed care “wins”
– Continued reimbursement opportunities
▫ International Market Licensing or Distribution
▫ Next Generation V-Go® Pre-fill
▫ Platform Expansion
– Other therapeutics (e.g. Pain Therapy)
ART-923 Rev: A