Embed Size (px)
Citation preview
Investor Presentation
Second Quarter 2015
Forward-looking Information
2
Certain matters contained in this presentation include "forward-looking statements" within the meaning of Section 27A of the Securities Act of 1933, as
amended, and Section 21E of the Securities Exchange Act of 1934, as amended. We make these forward-looking statements in reliance on the safe harbor
protections provided under the Private Securities Litigation Reform Act of 1995.
All statements, other than statements of historical fact, included in this presentation including the prospects of our industry, our anticipated financial
performance, our anticipated annual dividend growth rate, management's plans and objectives for future operations, planned capital expenditures, business
prospects, outcome of regulatory proceedings, market conditions and other matters, may constitute forward-looking statements. Although we believe that the
expectations reflected in these forward-looking statements are reasonable, we cannot assure you that these expectations will prove to be correct. These
forward-looking statements are subject to certain known and unknown risks and uncertainties, as well as assumptions that could cause actual results to differ
materially from those reflected in these forward-looking statements. Factors that might cause actual results to differ include, but are not limited to, our ability to
generate sufficient cash flow from operations to enable us to pay our debt obligations or to fund our other liquidity needs; our ability to comply with the
covenants contained in the instruments governing our indebtedness and to maintain certain financial ratios required by our credit facilities; the effect of our debt
level on our future financial and operating flexibility, including our ability to obtain additional capital; the ability of our subsidiary, Rose Rock Midstream L.P.
(NYSE: RRMS), to make minimum quarterly distributions; the operations of NGL Energy Partners LP (NYSE: NGL), which we do not control; any sustained
reduction in demand for the petroleum products we gather, transport, process and store; our ability to obtain new sources of supply of petroleum products; our
failure to comply with new or existing environmental laws or regulations or cross border laws or regulations; the possibility that the construction or acquisition of
new assets may not result in the corresponding anticipated revenue increases; changes in currency exchange rates; cyber attacks involving our information
systems and related infrastructure; the risks and uncertainties of doing business outside of the U.S., including political and economic instability and changes in
local governmental laws, regulations and policies; and the possibility that our hedging activities may result in losses or may have a negative impact on our
financial results; as well as other risk factors discussed from time to time in each of our documents and reports filed with the SEC.
Readers are cautioned not to place undue reliance on any forward-looking statements contained in this presentation which reflect management's opinions only
as of the date hereof. Except as required by law, we undertake no obligation to revise or publicly release the results of any revision to any forward-looking
statements.
SemGroup and Rose Rock Midstream use their Investor Relations website and social media outlets as channels of distribution of material company
information. Such information is routinely posted and accessible on our Investor Relations websites at ir.semgroupcorp.com and ir.rrmidstream.com.
Both companies are present on Twitter and LinkedIn, follow us at the links below:
SemGroup Twitter and LinkedIn Rose Rock Midstream Twitter and LinkedIn
Non-GAAP Financial Measures
3
SemGroup
Adjusted EBITDA is presented in this presentation for certain periods. Adjusted EBITDA is not a U.S. generally accepted accounting principles (“GAAP”)
measure and is not intended to be used in lieu of a GAAP presentation of net income (loss). Adjusted EBITDA is presented in this presentation because
SemGroup believes it provides additional information with respect to its performance. Adjusted EBITDA represents earnings before interest, taxes, depreciation
and amortization, adjusted for selected items that SemGroup believes impact the comparability of financial results between reporting periods. Although
SemGroup presents selected items that it considers in evaluating its performance, you should also be aware that the items presented do not represent all items
that affect comparability between the periods presented. Variations in SemGroup’s operating results are also caused by changes in volumes, prices, exchange
rates, mechanical interruptions and numerous other factors. These types of variances are not separately identified in this presentation. Because all companies
do not use identical calculations, SemGroup’s presentation of Adjusted EBITDA may be different from similarly titled measures of other companies, thereby
diminishing its utility. Reconciliations of net income (loss) to Adjusted EBITDA for the periods presented are included in the appendix of this presentation.
Rose Rock Midstream
This presentation includes the non-GAAP financial measures of Adjusted gross margin, Adjusted EBITDA and distributable cash flow, which may be used
periodically by management when discussing our financial results with investors and analysts. The appendix of this presentation provides reconciliations of
these non-GAAP financial measures to their most directly comparable financial measures calculated and presented in accordance with GAAP. Adjusted gross
margin, Adjusted EBITDA and distributable cash flow are presented as management believes they provide additional information and metrics relative to the
performance of our business.
Operating income (loss) is the GAAP measure most directly comparable to Adjusted gross margin, net income (loss) and cash provided by (used in) operating
activities are the GAAP measures most directly comparable to Adjusted EBITDA, and net income (loss) is the GAAP measure most directly comparable to
distributable cash flow. Our non-GAAP financial measures should not be considered as alternatives to the most directly comparable GAAP financial measures.
These non-GAAP financial measures have important limitations as analytical tools because they exclude some, but not all, items that affect the most directly
comparable GAAP financial measures. You should not consider Adjusted gross margin, Adjusted EBITDA or distributable cash flow in isolation or as
substitutes for analysis of our results as reported under GAAP. Because Adjusted gross margin, Adjusted EBITDA and distributable cash flow may be defined
differently by other companies in our industry, our definitions of these non-GAAP financial measures may not be comparable to similarly titled measures of
other companies, thereby diminishing their utility.
Management compensates for the limitation of Adjusted gross margin, Adjusted EBITDA and distributable cash flow as analytical tools by reviewing the
comparable GAAP measures, understanding the differences between Adjusted gross margin, Adjusted EBITDA and distributable cash flow, on the one hand,
and operating income (loss), net income (loss) and net cash provided by (used in) operating activities, on the other hand, and incorporating this knowledge into
its decision-making processes. We believe that investors benefit from having access to the same financial measures that our management uses in evaluating
our operating results.
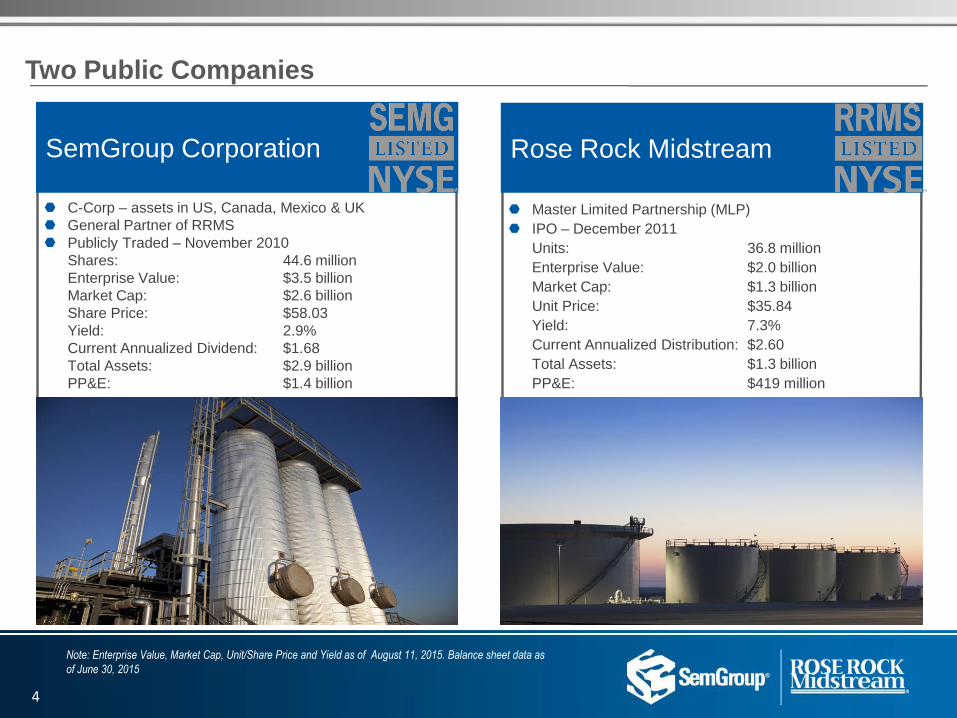
Two Public Companies
Note: Enterprise Value, Market Cap, Unit/Share Price and Yield as of August 11, 2015. Balance sheet data as
of June 30, 2015
C-Corp – assets in US, Canada, Mexico & UK
General Partner of RRMS
Publicly Traded – November 2010
Shares: 44.6 million
Enterprise Value: $3.5 billion
Market Cap: $2.6 billion
Share Price: $58.03
Yield: 2.9%
Current Annualized Dividend: $1.68
Total Assets: $2.9 billion
PP&E: $1.4 billion
Master Limited Partnership (MLP)
IPO – December 2011
Units: 36.8 million
Enterprise Value: $2.0 billion
Market Cap: $1.3 billion
Unit Price: $35.84
Yield: 7.3%
Current Annualized Distribution: $2.60
Total Assets: $1.3 billion
PP&E: $419 million
SemGroup Corporation Rose Rock Midstream
4
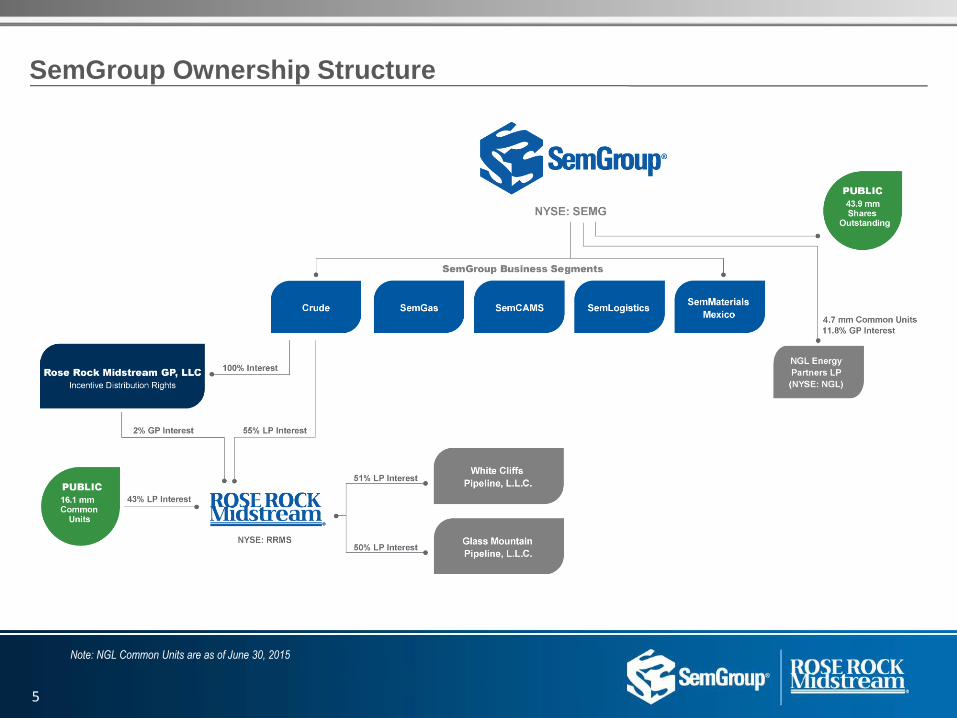
SemGroup Ownership Structure
Note: NGL Common Units are as of June 30, 2015
5
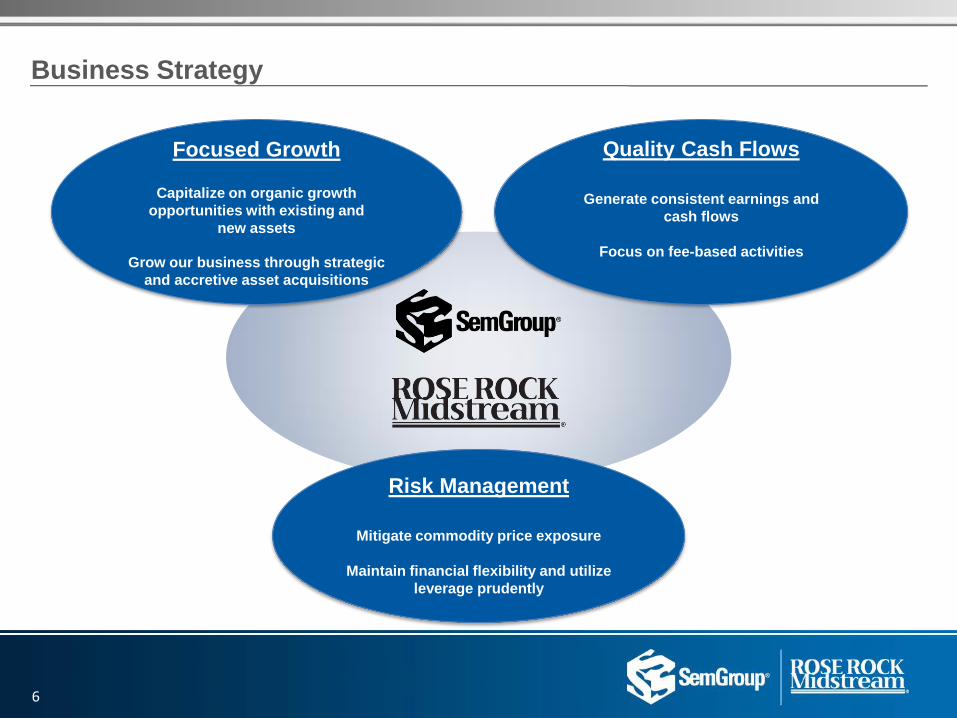
Business Strategy
Risk Management
Mitigate commodity price exposure
Maintain financial flexibility and utilize
leverage prudently
Quality Cash Flows
Generate consistent earnings and
cash flows
Focus on fee-based activities
Focused Growth
Capitalize on organic growth
opportunities with existing and
new assets
Grow our business through strategic
and accretive asset acquisitions
6
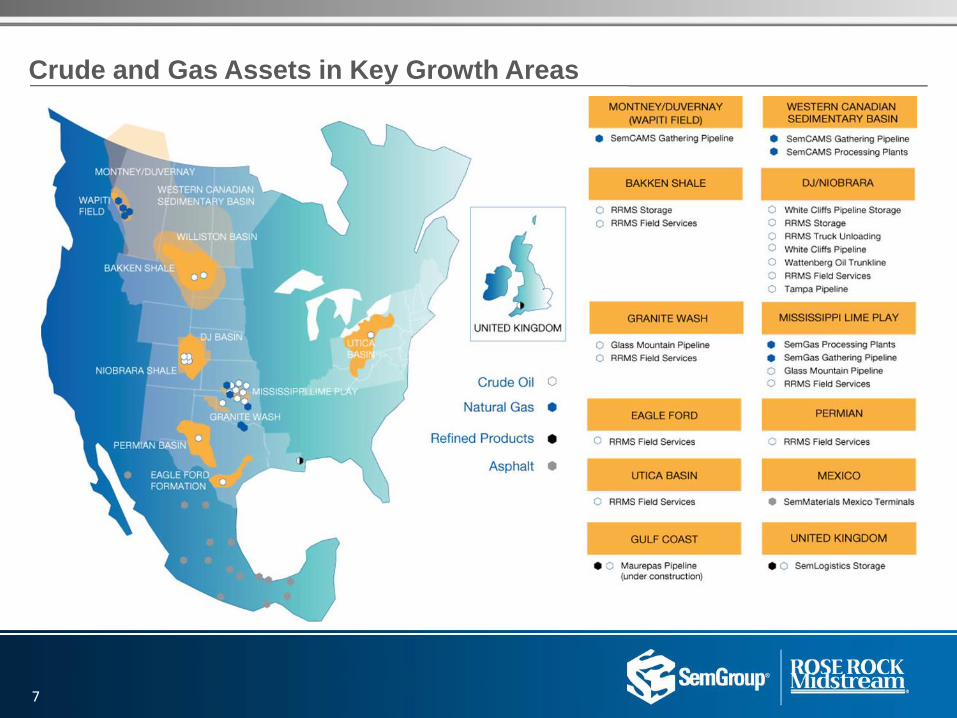
Crude and Gas Assets in Key Growth Areas
7
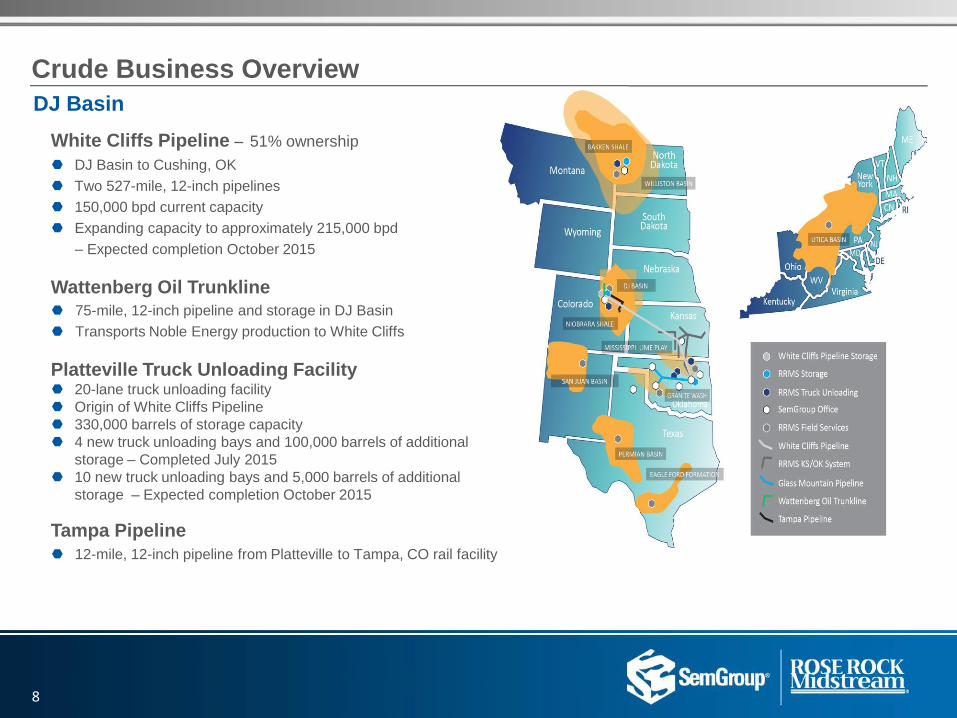
Crude Business Overview
White Cliffs Pipeline – 51% ownership
DJ Basin to Cushing, OK
Two 527-mile, 12-inch pipelines
150,000 bpd current capacity
Expanding capacity to approximately 215,000 bpd
– Expected completion October 2015
Wattenberg Oil Trunkline
75-mile, 12-inch pipeline and storage in DJ Basin
Transports Noble Energy production to White Cliffs
Platteville Truck Unloading Facility 20-lane truck unloading facility
Origin of White Cliffs Pipeline
330,000 barrels of storage capacity
4 new truck unloading bays and 100,000 barrels of additional
storage – Completed July 2015
10 new truck unloading bays and 5,000 barrels of additional
storage – Expected completion October 2015
Tampa Pipeline
12-mile, 12-inch pipeline from Platteville to Tampa, CO rail facility
DJ Basin
8
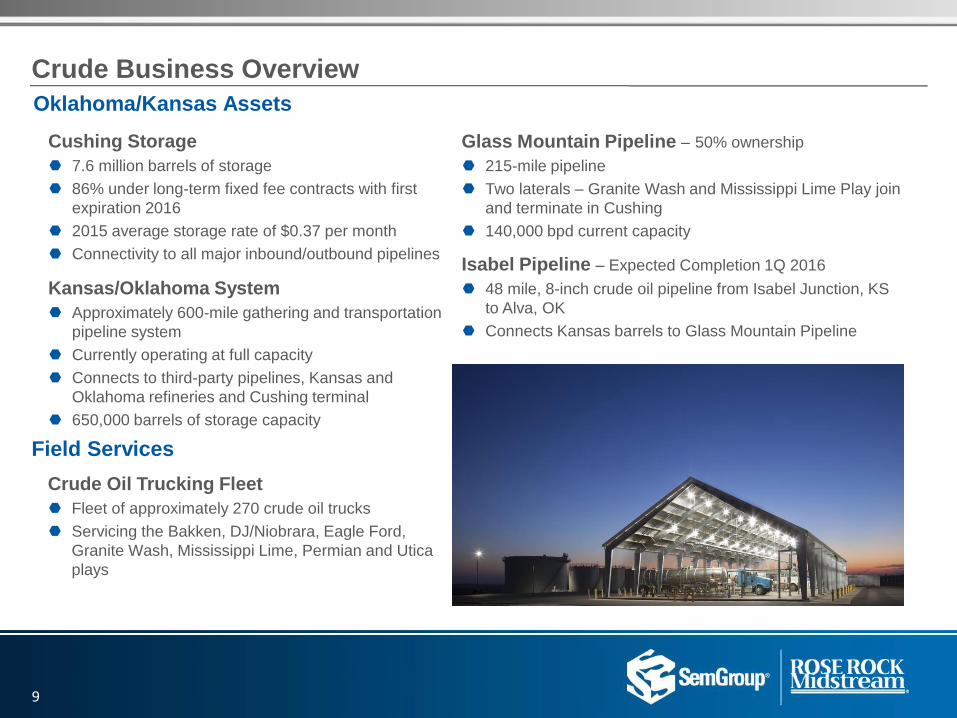
Crude Business Overview
Cushing Storage
7.6 million barrels of storage
86% under long-term fixed fee contracts with first
expiration 2016
2015 average storage rate of $0.37 per month
Connectivity to all major inbound/outbound pipelines
Kansas/Oklahoma System
Approximately 600-mile gathering and transportation
pipeline system
Currently operating at full capacity
Connects to third-party pipelines, Kansas and
Oklahoma refineries and Cushing terminal
650,000 barrels of storage capacity
Oklahoma/Kansas Assets
Field Services
Crude Oil Trucking Fleet
Fleet of approximately 270 crude oil trucks
Servicing the Bakken, DJ/Niobrara, Eagle Ford,
Granite Wash, Mississippi Lime, Permian and Utica
plays
9
Glass Mountain Pipeline – 50% ownership
215-mile pipeline
Two laterals – Granite Wash and Mississippi Lime Play join
and terminate in Cushing
140,000 bpd current capacity
Isabel Pipeline – Expected Completion 1Q 2016
48 mile, 8-inch crude oil pipeline from Isabel Junction, KS
to Alva, OK
Connects Kansas barrels to Glass Mountain Pipeline
2013 2014 2015
2013 2014 2015 2013 2014 2015
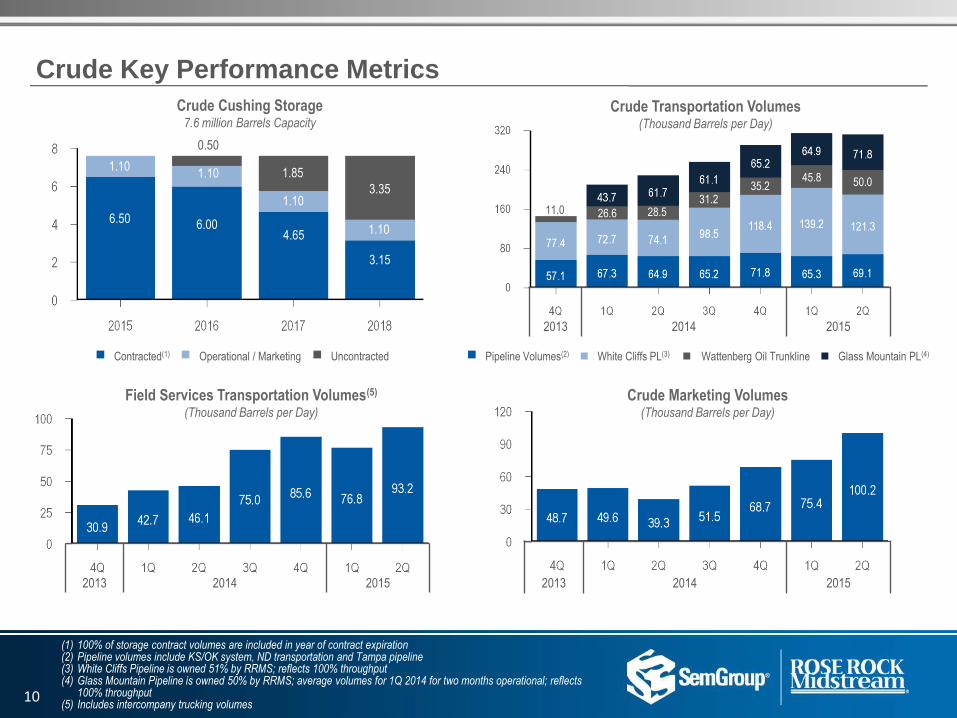
Crude Key Performance Metrics
(1) 100% of storage contract volumes are included in year of contract expiration (2) Pipeline volumes include KS/OK system, ND transportation and Tampa pipeline (3) White Cliffs Pipeline is owned 51% by RRMS; reflects 100% throughput (4) Glass Mountain Pipeline is owned 50% by RRMS; average volumes for 1Q 2014 for two months operational; reflects
100% throughput (5) Includes intercompany trucking volumes
Crude Transportation Volumes (Thousand Barrels per Day)
Crude Marketing Volumes (Thousand Barrels per Day)
n Pipeline Volumes(2) n White Cliffs PL(3)
n Wattenberg Oil Trunkline n Glass Mountain PL(4)
Crude Cushing Storage 7.6 million Barrels Capacity
6.50 6.00 4.65
3.15
Field Services Transportation Volumes(5)
(Thousand Barrels per Day)
n Contracted(1) n Operational / Marketing n Uncontracted
1.10
1.10 1.10
1.10 3.35
1.85
0.50
28.5 26.6 11.0 31.2
35.2 45.8 50.0
10
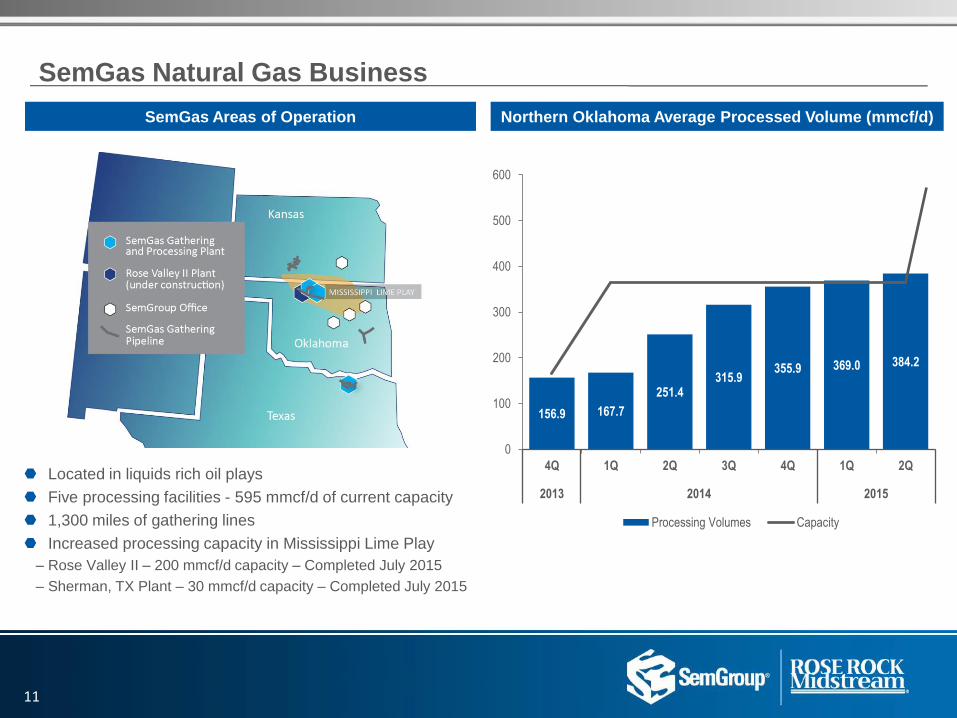
156.9 167.7
251.4 315.9
355.9 369.0 384.2
0
100
200
300
400
500
600
4Q 1Q 2Q 3Q 4Q 1Q 2Q
Processing Volumes Capacity
2013 2014 2015
SemGas Areas of Operation Northern Oklahoma Average Processed Volume (mmcf/d)
Located in liquids rich oil plays
Five processing facilities - 595 mmcf/d of current capacity
1,300 miles of gathering lines
Increased processing capacity in Mississippi Lime Play
– Rose Valley II – 200 mmcf/d capacity – Completed July 2015
– Sherman, TX Plant – 30 mmcf/d capacity – Completed July 2015
SemGas Natural Gas Business
11
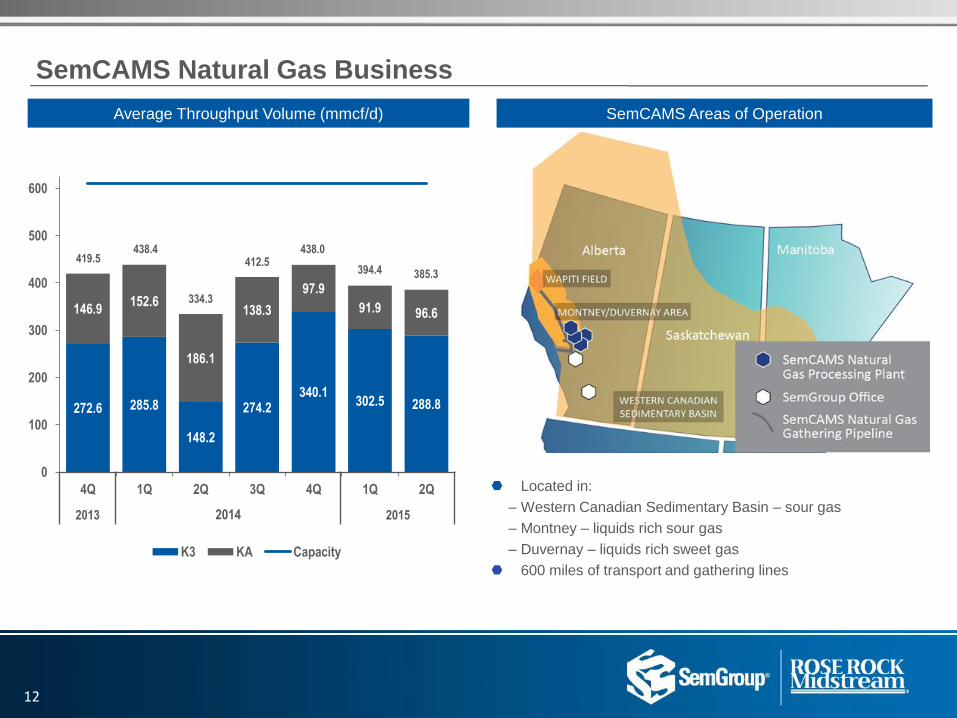
272.6 285.8
148.2
274.2 340.1
302.5 288.8
146.9 152.6
186.1
138.3
97.9
91.9 96.6
0
100
200
300
400
500
600
4Q 1Q 2Q 3Q 4Q 1Q 2Q
K3 KA Capacity
2013 2014 2015
SemCAMS Natural Gas Business
SemCAMS Areas of Operation Average Throughput Volume (mmcf/d)
Located in:
– Western Canadian Sedimentary Basin – sour gas
– Montney – liquids rich sour gas
– Duvernay – liquids rich sweet gas
600 miles of transport and gathering lines
12
419.5
385.3
438.4
334.3
412.5 438.0
394.4
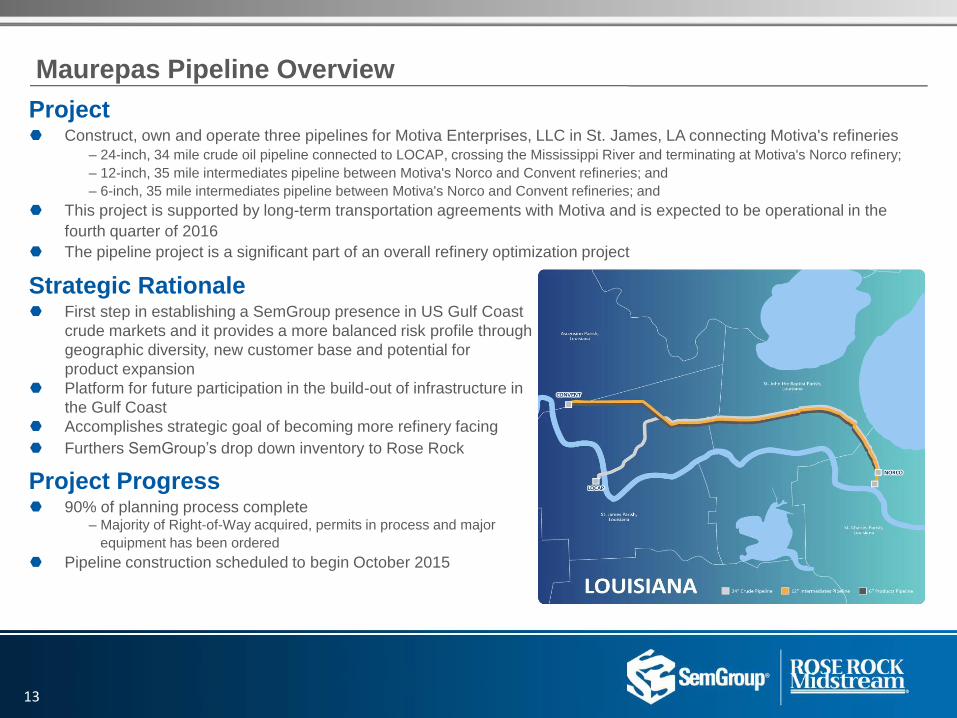
Maurepas Pipeline Overview
Project Construct, own and operate three pipelines for Motiva Enterprises, LLC in St. James, LA connecting Motiva's refineries
– 24-inch, 34 mile crude oil pipeline connected to LOCAP, crossing the Mississippi River and terminating at Motiva's Norco refinery;
– 12-inch, 35 mile intermediates pipeline between Motiva's Norco and Convent refineries; and
– 6-inch, 35 mile intermediates pipeline between Motiva's Norco and Convent refineries; and
This project is supported by long-term transportation agreements with Motiva and is expected to be operational in the
fourth quarter of 2016
The pipeline project is a significant part of an overall refinery optimization project
Strategic Rationale First step in establishing a SemGroup presence in US Gulf Coast
crude markets and it provides a more balanced risk profile through
geographic diversity, new customer base and potential for
product expansion
Platform for future participation in the build-out of infrastructure in
the Gulf Coast
Accomplishes strategic goal of becoming more refinery facing
Furthers SemGroup’s drop down inventory to Rose Rock
Project Progress 90% of planning process complete
– Majority of Right-of-Way acquired, permits in process and major
equipment has been ordered
Pipeline construction scheduled to begin October 2015
13
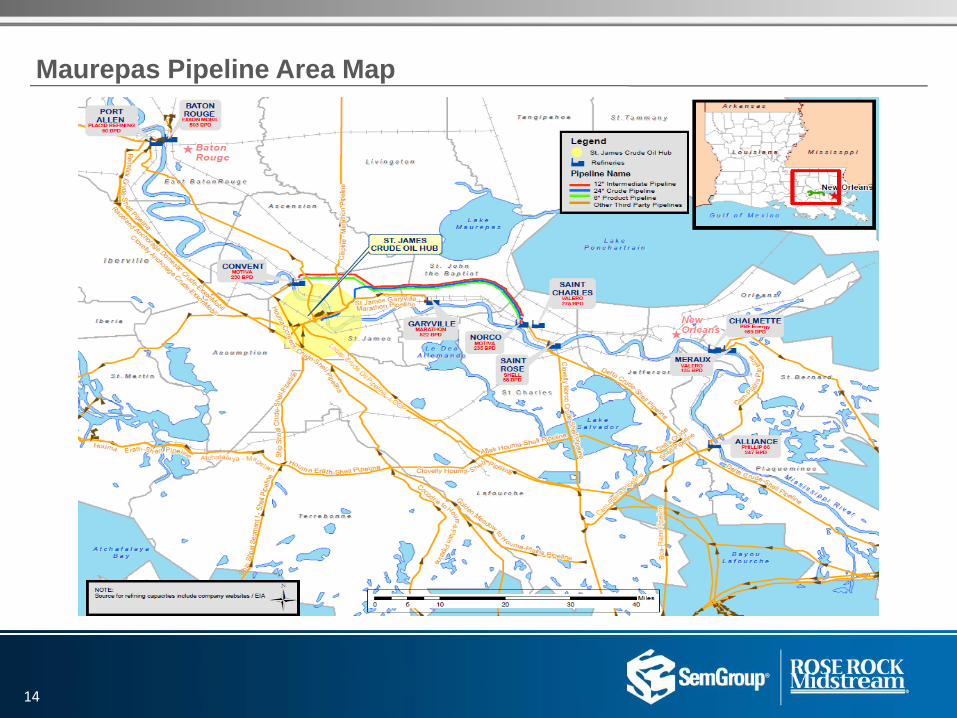
Maurepas Pipeline Area Map
14
$265
$450
$55
58%
34%
7%
SemGroup Corporation 2015 Capital Expenditure Guidance
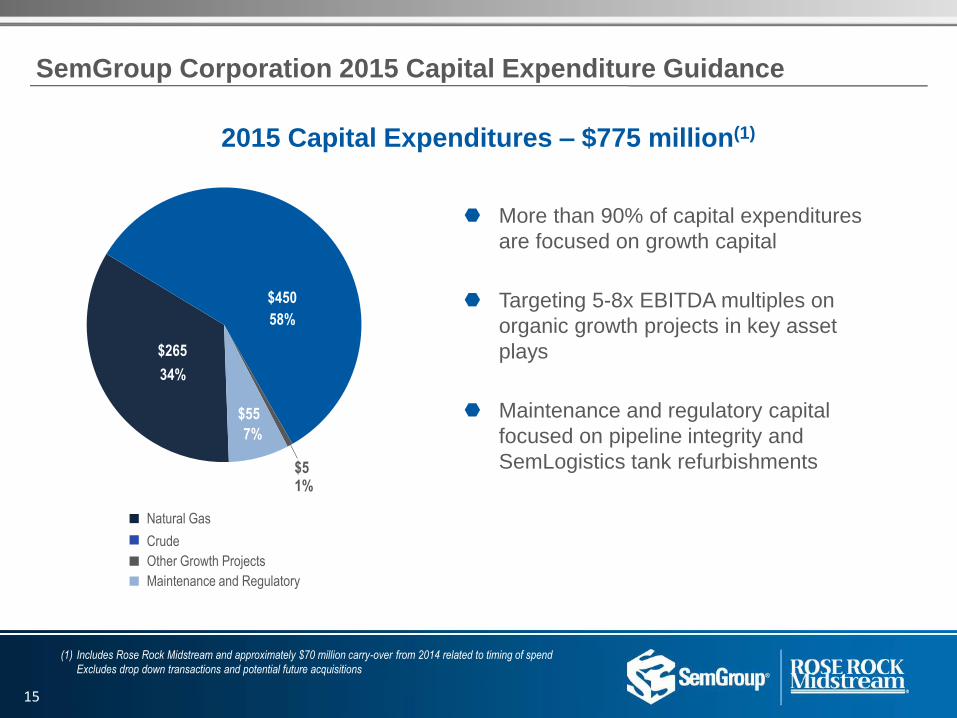
2015 Capital Expenditures – $775 million(1)
More than 90% of capital expenditures
are focused on growth capital
Targeting 5-8x EBITDA multiples on
organic growth projects in key asset
plays
Maintenance and regulatory capital
focused on pipeline integrity and
SemLogistics tank refurbishments
n Natural Gas
n Crude
n Other Growth Projects
n Maintenance and Regulatory
1% $5
(1) Includes Rose Rock Midstream and approximately $70 million carry-over from 2014 related to timing of spend
Excludes drop down transactions and potential future acquisitions
15
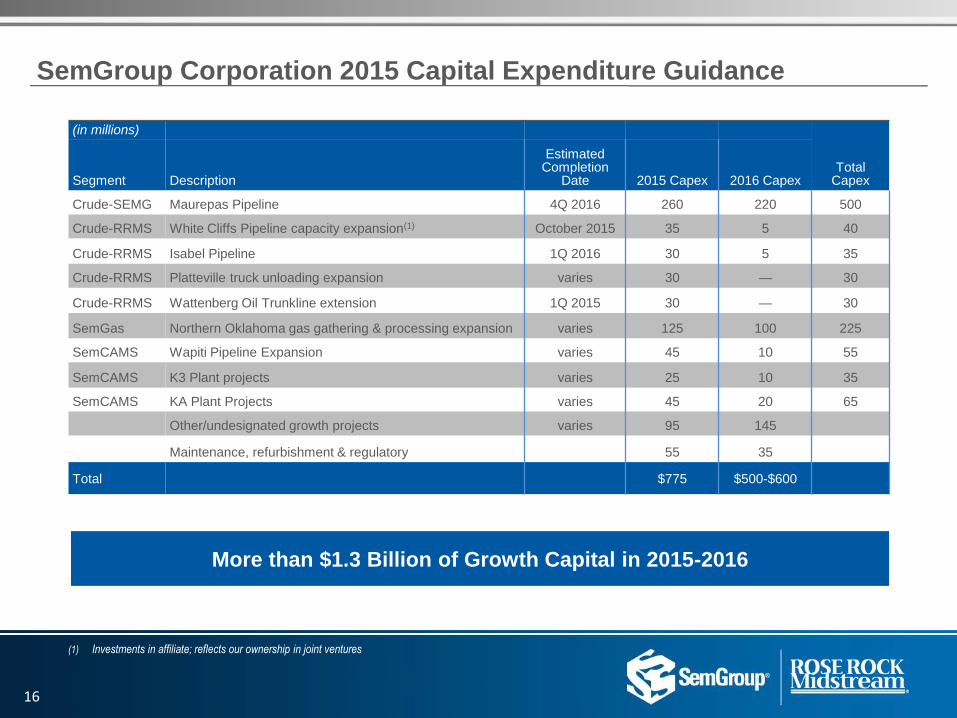
SemGroup Corporation 2015 Capital Expenditure Guidance
(1) Investments in affiliate; reflects our ownership in joint ventures
More than $1.3 Billion of Growth Capital in 2015-2016
(in millions)
Total Capex Segment Description
Estimated Completion
Date 2015 Capex 2016 Capex
Crude-SEMG Maurepas Pipeline 4Q 2016 260 220 500
Crude-RRMS White Cliffs Pipeline capacity expansion(1) October 2015 35 5 40
Crude-RRMS Isabel Pipeline 1Q 2016 30 5 35
Crude-RRMS Platteville truck unloading expansion varies 30 — 30
Crude-RRMS Wattenberg Oil Trunkline extension 1Q 2015 30 — 30
SemGas Northern Oklahoma gas gathering & processing expansion varies 125 100 225
SemCAMS Wapiti Pipeline Expansion varies 45 10 55
SemCAMS K3 Plant projects varies 25 10 35
SemCAMS KA Plant Projects varies 45 20 65
Other/undesignated growth projects varies 95 145
Maintenance, refurbishment & regulatory 55 35
Total $775 $500-$600
16
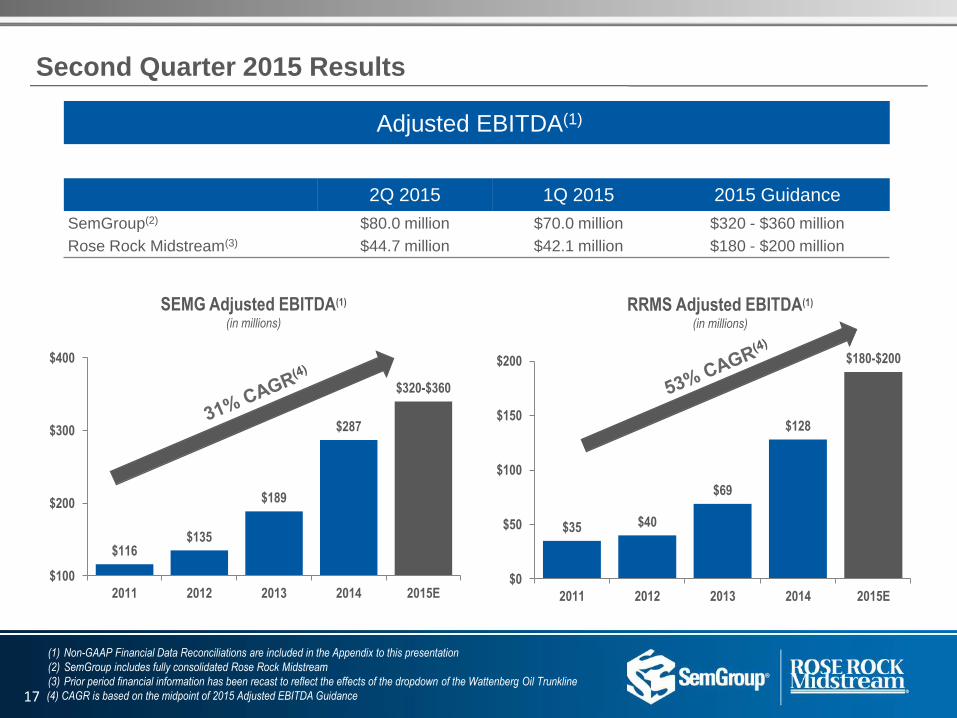
RRMS Adjusted EBITDA(1)
(in millions)
$116 $135
$189
$287
$320-$360
$100
$200
$300
$400
2011 2012 2013 2014 2015E
$35 $40
$69
$128
$180-$200
$0
$50
$100
$150
$200
2011 2012 2013 2014 2015E
Adjusted EBITDA(1)
2Q 2015 1Q 2015 2015 Guidance
SemGroup(2) $80.0 million $70.0 million $320 - $360 million
Rose Rock Midstream(3) $44.7 million $42.1 million $180 - $200 million
Second Quarter 2015 Results
(1) Non-GAAP Financial Data Reconciliations are included in the Appendix to this presentation
(2) SemGroup includes fully consolidated Rose Rock Midstream
(3) Prior period financial information has been recast to reflect the effects of the dropdown of the Wattenberg Oil Trunkline
(4) CAGR is based on the midpoint of 2015 Adjusted EBITDA Guidance
SEMG Adjusted EBITDA(1)
(in millions)
17
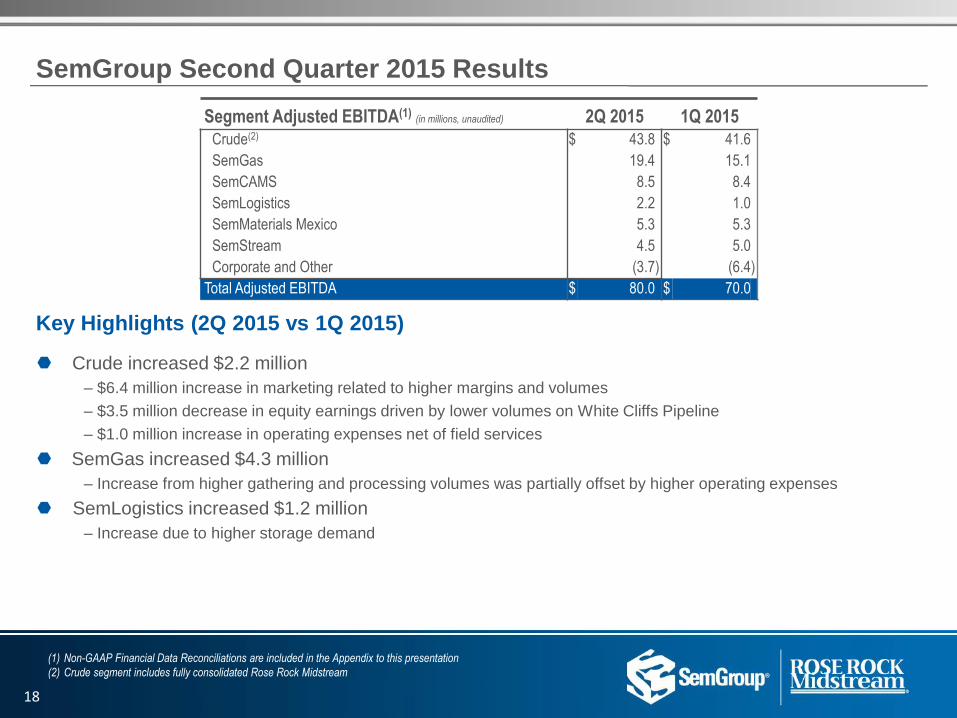
SemGroup Second Quarter 2015 Results
(1) Non-GAAP Financial Data Reconciliations are included in the Appendix to this presentation
(2) Crude segment includes fully consolidated Rose Rock Midstream
Key Highlights (2Q 2015 vs 1Q 2015)
Crude increased $2.2 million
– $6.4 million increase in marketing related to higher margins and volumes
– $3.5 million decrease in equity earnings driven by lower volumes on White Cliffs Pipeline
– $1.0 million increase in operating expenses net of field services
SemGas increased $4.3 million
– Increase from higher gathering and processing volumes was partially offset by higher operating expenses
SemLogistics increased $1.2 million
– Increase due to higher storage demand
Segment Adjusted EBITDA(1) (in millions, unaudited) 2Q 2015 1Q 2015 Crude(2) $ 43.8 $ 41.6
SemGas 19.4 15.1
SemCAMS 8.5 8.4
SemLogistics 2.2 1.0
SemMaterials Mexico 5.3 5.3
SemStream 4.5 5.0
Corporate and Other (3.7 ) (6.4 )
Total Adjusted EBITDA $ 80.0 $ 70.0
18
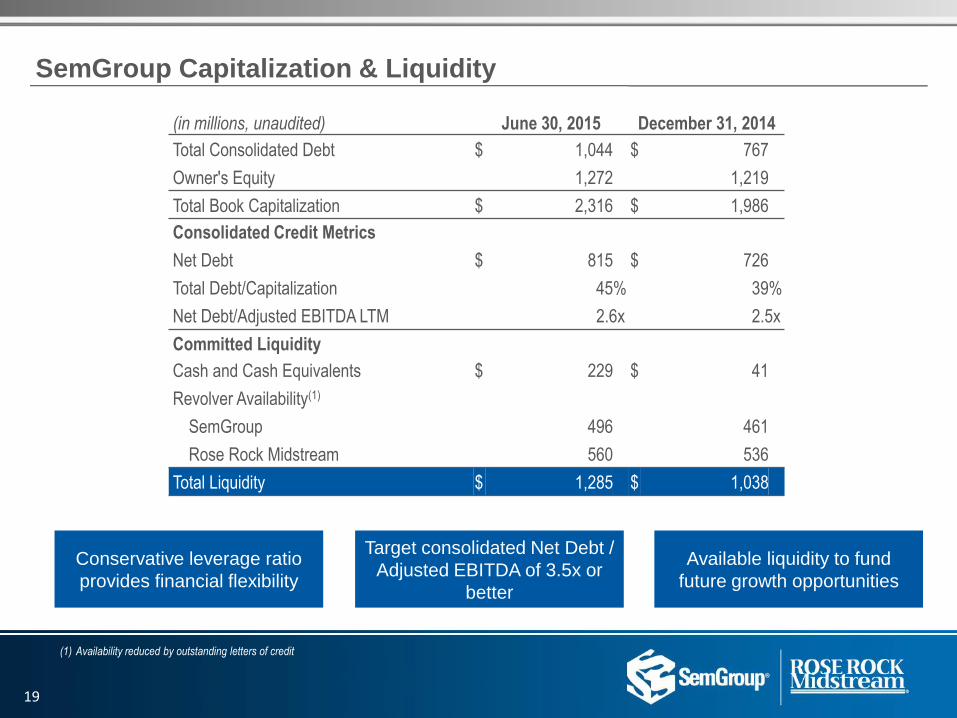
SemGroup Capitalization & Liquidity
Conservative leverage ratio
provides financial flexibility
Target consolidated Net Debt /
Adjusted EBITDA of 3.5x or
better
Available liquidity to fund
future growth opportunities
(in millions, unaudited) June 30, 2015 December 31, 2014
Total Consolidated Debt $ 1,044 $ 767
Owner's Equity 1,272 1,219
Total Book Capitalization $ 2,316 $ 1,986
Consolidated Credit Metrics
Net Debt $ 815 $ 726
Total Debt/Capitalization 45 % 39 %
Net Debt/Adjusted EBITDA LTM 2.6x 2.5x
Committed Liquidity
Cash and Cash Equivalents $ 229 $ 41
Revolver Availability(1)
SemGroup 496 461
Rose Rock Midstream 560 536
Total Liquidity $ 1,285 $ 1,038
(1) Availability reduced by outstanding letters of credit
19
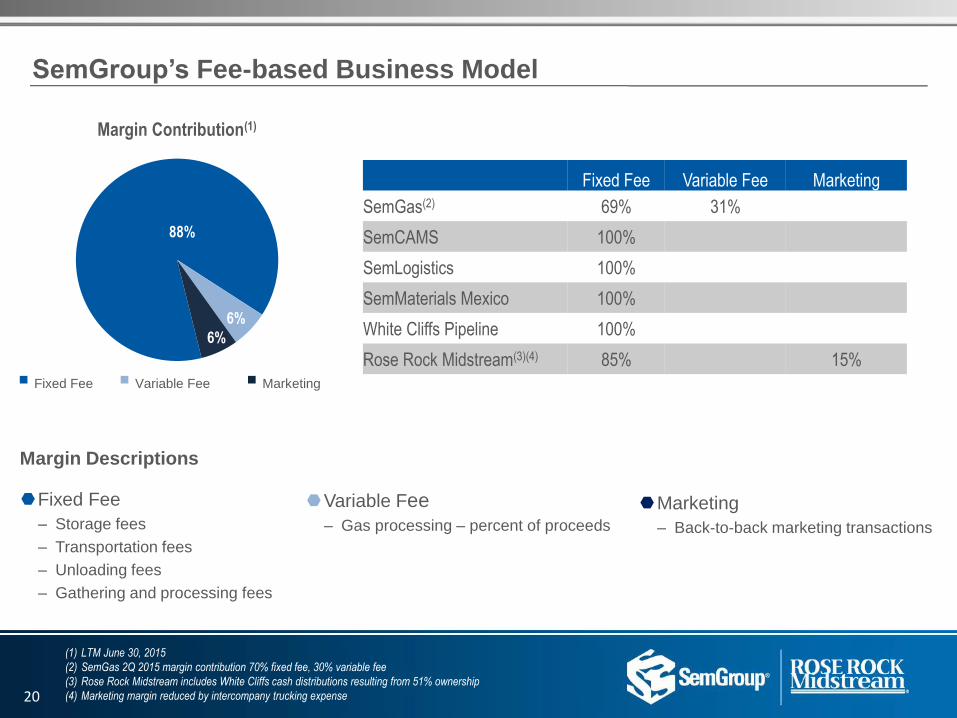
88%
6%
6%
SemGroup’s Fee-based Business Model
Margin Contribution(1)
n Fixed Fee n Variable Fee n Marketing
Margin Descriptions
Fixed Fee
– Storage fees
– Transportation fees
– Unloading fees
– Gathering and processing fees
Variable Fee
– Gas processing – percent of proceeds
Marketing
– Back-to-back marketing transactions
Fixed Fee Variable Fee Marketing
SemGas(2) 69% 31%
SemCAMS 100%
SemLogistics 100%
SemMaterials Mexico 100%
White Cliffs Pipeline 100%
Rose Rock Midstream(3)(4) 85% 15%
20
(1) LTM June 30, 2015
(2) SemGas 2Q 2015 margin contribution 70% fixed fee, 30% variable fee
(3) Rose Rock Midstream includes White Cliffs cash distributions resulting from 51% ownership
(4) Marketing margin reduced by intercompany trucking expense
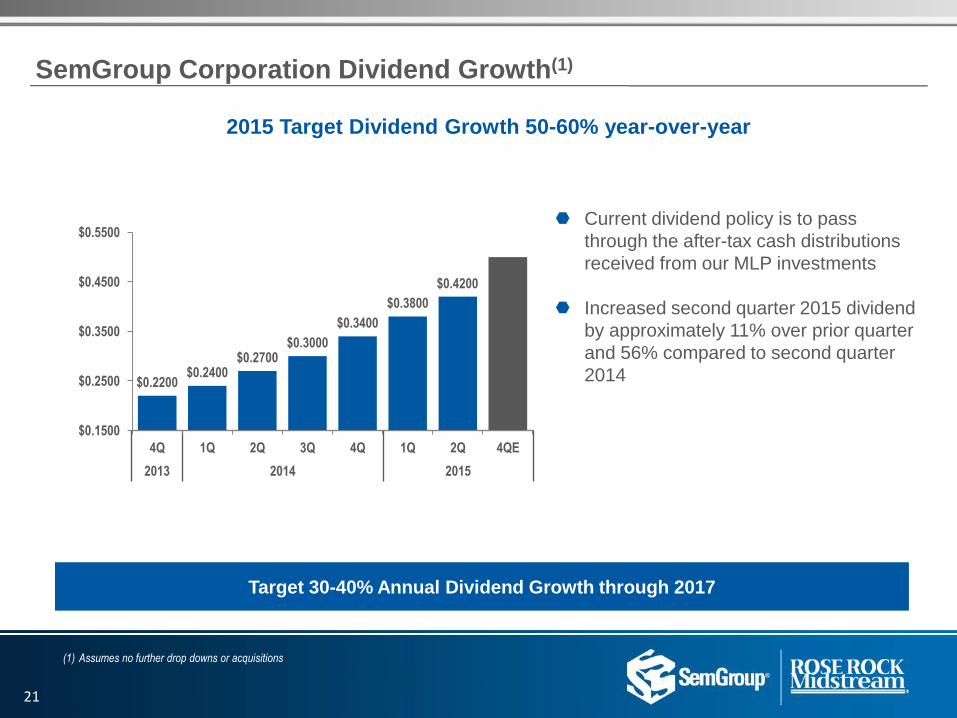
SemGroup Corporation Dividend Growth(1)
Target 30-40% Annual Dividend Growth through 2017
Current dividend policy is to pass
through the after-tax cash distributions
received from our MLP investments
Increased second quarter 2015 dividend
by approximately 11% over prior quarter
and 56% compared to second quarter
2014
2013 2014 2015
2015 Target Dividend Growth 50-60% year-over-year
(1) Assumes no further drop downs or acquisitions
21
$0.2200 $0.2400
$0.2700 $0.3000
$0.3400
$0.3800
$0.4200
$0.1500
$0.2500
$0.3500
$0.4500
$0.5500
4Q 1Q 2Q 3Q 4Q 1Q 2Q 4QE
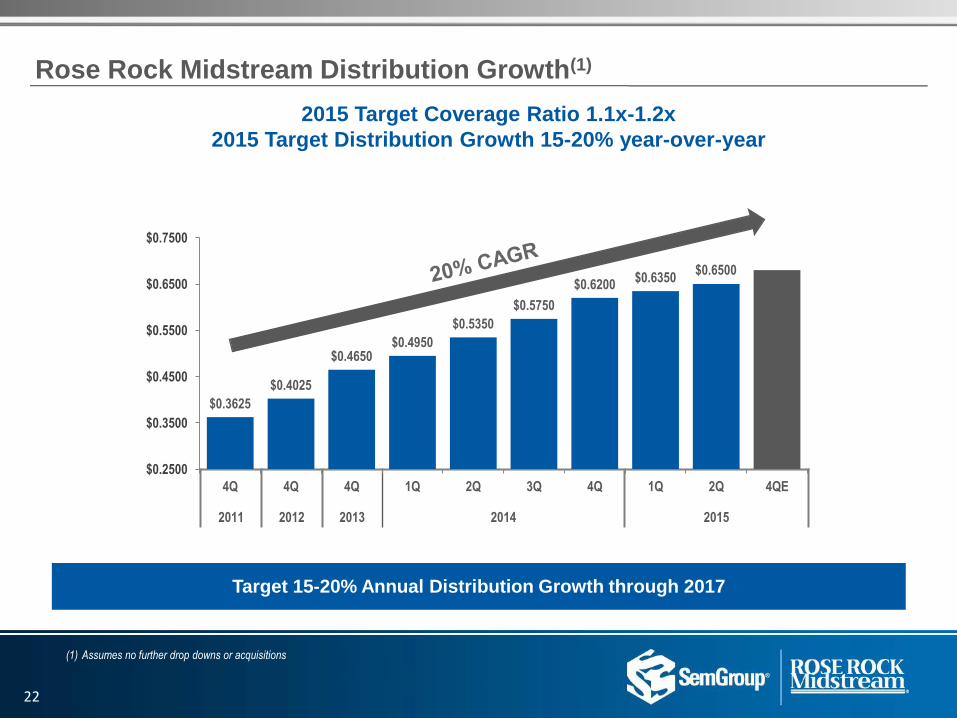
2015 Target Coverage Ratio 1.1x-1.2x
2015 Target Distribution Growth 15-20% year-over-year
Rose Rock Midstream Distribution Growth(1)
Target 15-20% Annual Distribution Growth through 2017
(1) Assumes no further drop downs or acquisitions
2011 2012 2013 2014 2015
22
$0.3625
$0.4025
$0.4650 $0.4950
$0.5350
$0.5750
$0.6200 $0.6350
$0.6500
$0.2500
$0.3500
$0.4500
$0.5500
$0.6500
$0.7500
4Q 4Q 4Q 1Q 2Q 3Q 4Q 1Q 2Q 4QE
APPENDIX
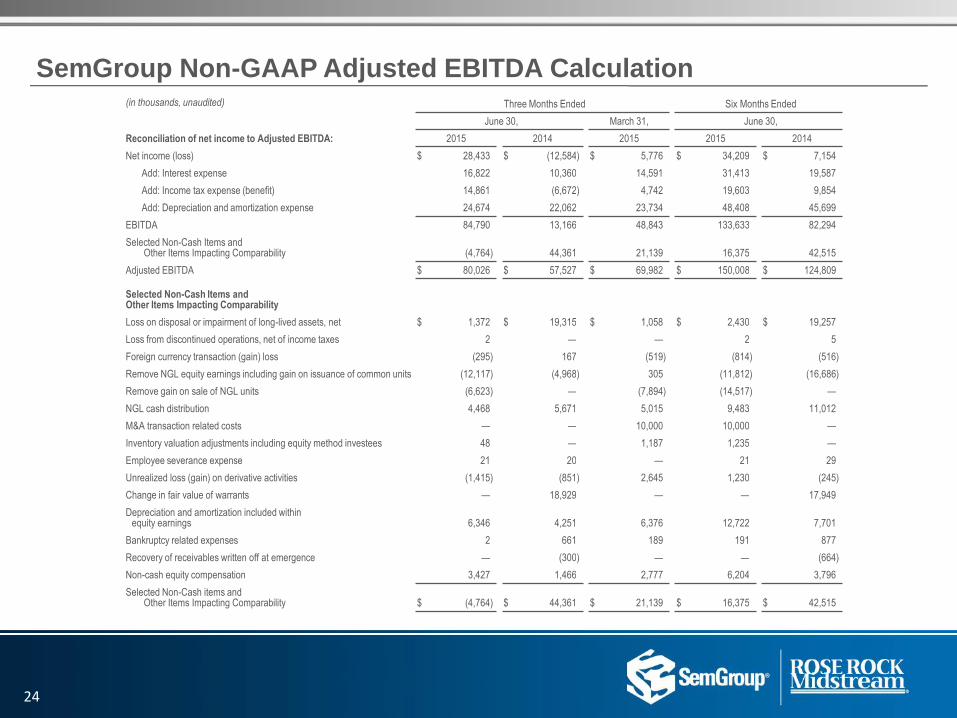
SemGroup Non-GAAP Adjusted EBITDA Calculation (in thousands, unaudited) Three Months Ended Six Months Ended
June 30, March 31, June 30,
Reconciliation of net income to Adjusted EBITDA: 2015 2014 2015 2015 2014
Net income (loss) $ 28,433 $ (12,584 ) $ 5,776 $ 34,209 $ 7,154
Add: Interest expense 16,822 10,360 14,591 31,413 19,587
Add: Income tax expense (benefit) 14,861 (6,672 ) 4,742 19,603 9,854
Add: Depreciation and amortization expense 24,674 22,062 23,734 48,408 45,699
EBITDA 84,790 13,166 48,843 133,633 82,294
Selected Non-Cash Items and Other Items Impacting Comparability (4,764 ) 44,361 21,139 16,375 42,515
Adjusted EBITDA $ 80,026 $ 57,527 $ 69,982 $ 150,008 $ 124,809
Selected Non-Cash Items and Other Items Impacting Comparability
Loss on disposal or impairment of long-lived assets, net $ 1,372 $ 19,315 $ 1,058 $ 2,430 $ 19,257
Loss from discontinued operations, net of income taxes 2 — — 2 5
Foreign currency transaction (gain) loss (295 ) 167 (519 ) (814 ) (516 )
Remove NGL equity earnings including gain on issuance of common units (12,117 ) (4,968 ) 305 (11,812 ) (16,686 )
Remove gain on sale of NGL units (6,623 ) — (7,894 ) (14,517 ) —
NGL cash distribution 4,468 5,671 5,015 9,483 11,012
M&A transaction related costs — — 10,000 10,000 —
Inventory valuation adjustments including equity method investees 48 — 1,187 1,235 —
Employee severance expense 21 20 — 21 29
Unrealized loss (gain) on derivative activities (1,415 ) (851 ) 2,645 1,230 (245 )
Change in fair value of warrants — 18,929 — — 17,949
Depreciation and amortization included within equity earnings 6,346 4,251 6,376 12,722 7,701
Bankruptcy related expenses 2 661 189 191 877
Recovery of receivables written off at emergence — (300 ) — — (664 )
Non-cash equity compensation 3,427 1,466 2,777 6,204 3,796
Selected Non-Cash items and Other Items Impacting Comparability $ (4,764 ) $ 44,361 $ 21,139 $ 16,375 $ 42,515
24
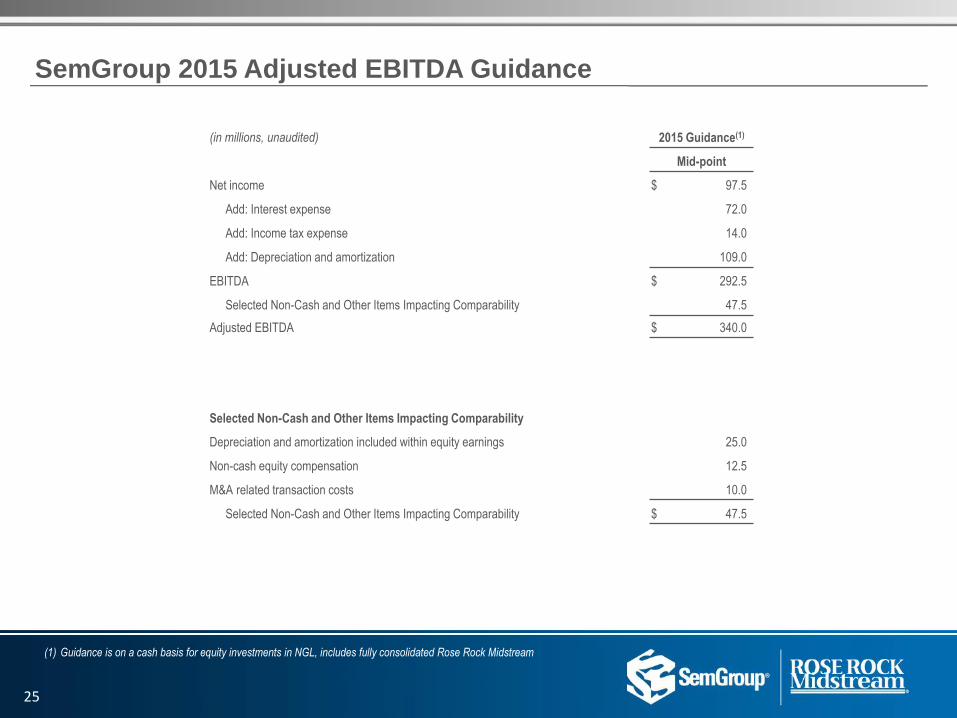
SemGroup 2015 Adjusted EBITDA Guidance
(1) Guidance is on a cash basis for equity investments in NGL, includes fully consolidated Rose Rock Midstream
(in millions, unaudited) 2015 Guidance(1)
Mid-point
Net income $ 97.5
Add: Interest expense 72.0
Add: Income tax expense 14.0
Add: Depreciation and amortization 109.0
EBITDA $ 292.5
Selected Non-Cash and Other Items Impacting Comparability 47.5
Adjusted EBITDA $ 340.0
Selected Non-Cash and Other Items Impacting Comparability
Depreciation and amortization included within equity earnings 25.0
Non-cash equity compensation 12.5
M&A related transaction costs 10.0
Selected Non-Cash and Other Items Impacting Comparability $ 47.5
25
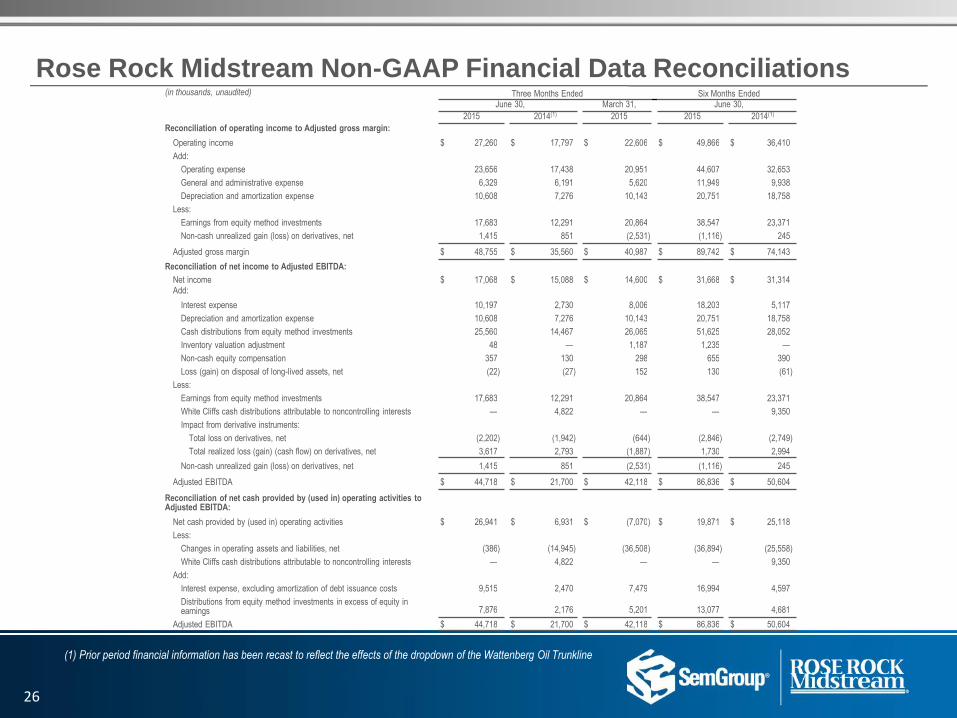
Rose Rock Midstream Non-GAAP Financial Data Reconciliations (in thousands, unaudited) Three Months Ended Six Months Ended
June 30, March 31, June 30,
2015 2014(1) 2015 2015 2014(1)
Reconciliation of operating income to Adjusted gross margin:
Operating income $ 27,260 $ 17,797 $ 22,606 $ 49,866 $ 36,410
Add:
Operating expense 23,656 17,438 20,951 44,607 32,653
General and administrative expense 6,329 6,191 5,620 11,949 9,938
Depreciation and amortization expense 10,608 7,276 10,143 20,751 18,758
Less:
Earnings from equity method investments 17,683 12,291 20,864 38,547 23,371
Non-cash unrealized gain (loss) on derivatives, net 1,415 851 (2,531 ) (1,116 ) 245
Adjusted gross margin $ 48,755 $ 35,560 $ 40,987 $ 89,742 $ 74,143
Reconciliation of net income to Adjusted EBITDA:
Net income $ 17,068 $ 15,088 $ 14,600 $ 31,668 $ 31,314 Add:
Interest expense 10,197 2,730 8,006 18,203 5,117
Depreciation and amortization expense 10,608 7,276 10,143 20,751 18,758
Cash distributions from equity method investments 25,560 14,467 26,065 51,625 28,052
Inventory valuation adjustment 48 — 1,187 1,235 —
Non-cash equity compensation 357 130 298 655 390
Loss (gain) on disposal of long-lived assets, net (22 ) (27 ) 152 130 (61 )
Less:
Earnings from equity method investments 17,683 12,291 20,864 38,547 23,371
White Cliffs cash distributions attributable to noncontrolling interests — 4,822 — — 9,350
Impact from derivative instruments:
Total loss on derivatives, net (2,202 ) (1,942 ) (644 ) (2,846 ) (2,749 )
Total realized loss (gain) (cash flow) on derivatives, net 3,617 2,793 (1,887 ) 1,730 2,994
Non-cash unrealized gain (loss) on derivatives, net 1,415 851 (2,531 ) (1,116 ) 245
Adjusted EBITDA $ 44,718 $ 21,700 $ 42,118 $ 86,836 $ 50,604
Reconciliation of net cash provided by (used in) operating activities to Adjusted EBITDA:
Net cash provided by (used in) operating activities $ 26,941 $ 6,931 $ (7,070 ) $ 19,871 $ 25,118
Less:
Changes in operating assets and liabilities, net (386 ) (14,945 ) (36,508 ) (36,894 ) (25,558 )
White Cliffs cash distributions attributable to noncontrolling interests — 4,822 — — 9,350
Add:
Interest expense, excluding amortization of debt issuance costs 9,515 2,470 7,479 16,994 4,597
Distributions from equity method investments in excess of equity in earnings 7,876 2,176 5,201 13,077 4,681
Adjusted EBITDA $ 44,718 $ 21,700 $ 42,118 $ 86,836 $ 50,604
(1) Prior period financial information has been recast to reflect the effects of the dropdown of the Wattenberg Oil Trunkline
26
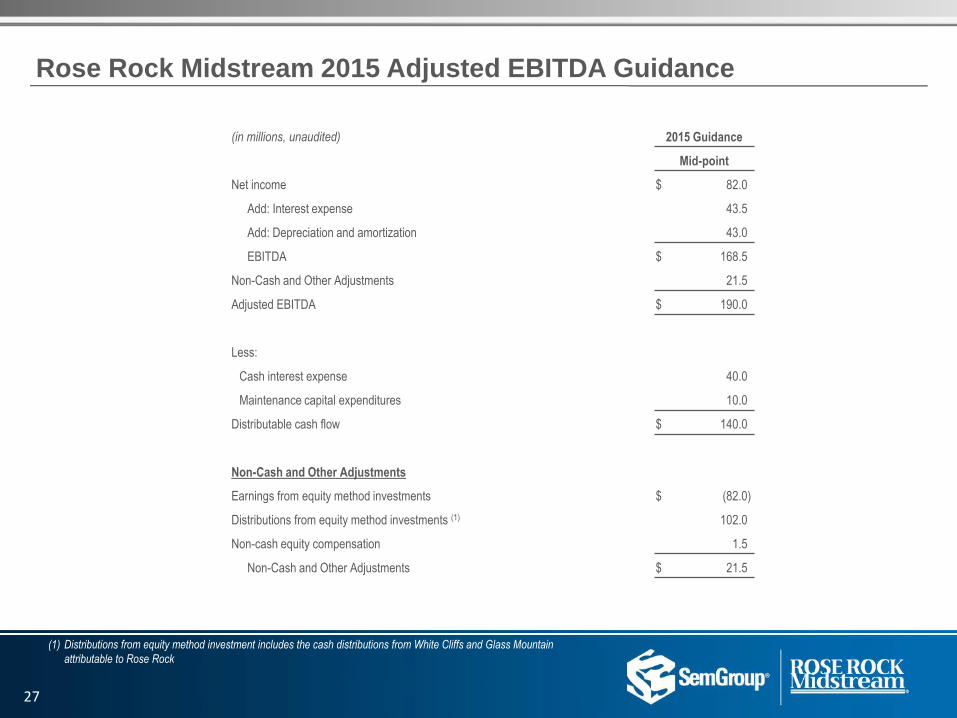
Rose Rock Midstream 2015 Adjusted EBITDA Guidance
(in millions, unaudited) 2015 Guidance
Mid-point
Net income $ 82.0
Add: Interest expense 43.5
Add: Depreciation and amortization 43.0
EBITDA $ 168.5
Non-Cash and Other Adjustments 21.5
Adjusted EBITDA $ 190.0
Less:
Cash interest expense 40.0
Maintenance capital expenditures 10.0
Distributable cash flow $ 140.0
Non-Cash and Other Adjustments
Earnings from equity method investments $ (82.0 )
Distributions from equity method investments (1) 102.0
Non-cash equity compensation 1.5
Non-Cash and Other Adjustments $ 21.5
(1) Distributions from equity method investment includes the cash distributions from White Cliffs and Glass Mountain
attributable to Rose Rock
27
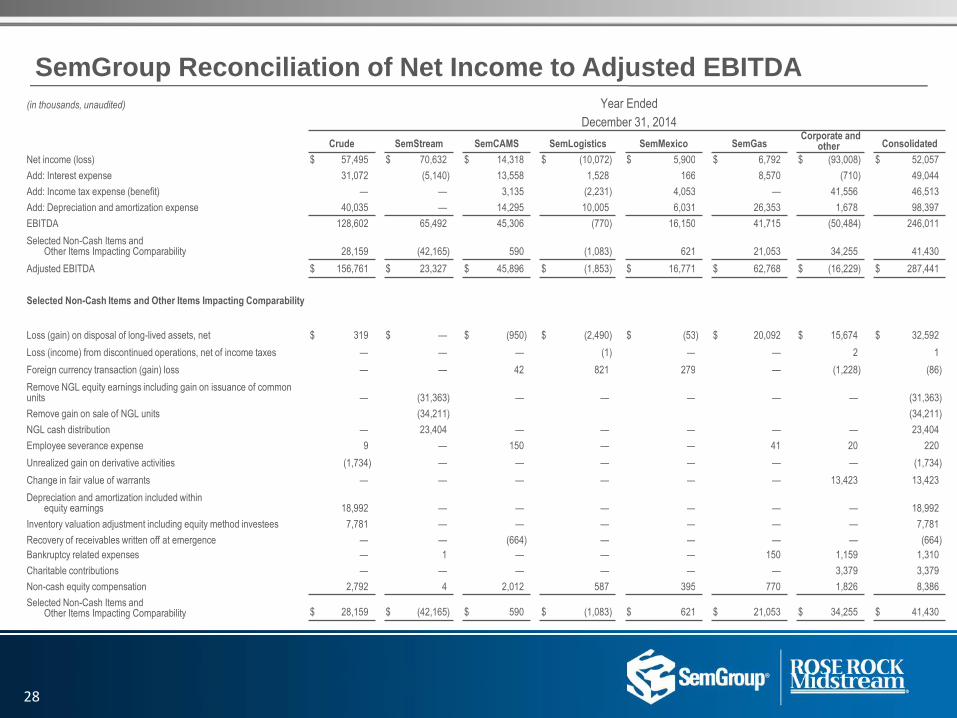
(in thousands, unaudited) Year Ended
December 31, 2014
Crude SemStream SemCAMS SemLogistics SemMexico SemGas Corporate and
other Consolidated
Net income (loss) $ 57,495 $ 70,632 $ 14,318 $ (10,072 ) $ 5,900 $ 6,792 $ (93,008 ) $ 52,057
Add: Interest expense 31,072 (5,140 ) 13,558 1,528 166 8,570 (710 ) 49,044
Add: Income tax expense (benefit) — — 3,135 (2,231 ) 4,053 — 41,556 46,513
Add: Depreciation and amortization expense 40,035 — 14,295 10,005 6,031 26,353 1,678 98,397
EBITDA 128,602 65,492 45,306 (770 ) 16,150 41,715 (50,484 ) 246,011
Selected Non-Cash Items and Other Items Impacting Comparability 28,159 (42,165 ) 590 (1,083 ) 621 21,053 34,255 41,430
Adjusted EBITDA $ 156,761 $ 23,327 $ 45,896 $ (1,853 ) $ 16,771 $ 62,768 $ (16,229 ) $ 287,441
Selected Non-Cash Items and Other Items Impacting Comparability
Loss (gain) on disposal of long-lived assets, net $ 319 $ — $ (950 ) $ (2,490 ) $ (53 ) $ 20,092 $ 15,674 $ 32,592
Loss (income) from discontinued operations, net of income taxes — — — (1 ) — — 2 1
Foreign currency transaction (gain) loss — — 42 821 279 — (1,228 ) (86 )
Remove NGL equity earnings including gain on issuance of common units — (31,363 ) — — — — — (31,363 )
Remove gain on sale of NGL units (34,211 ) (34,211 )
NGL cash distribution — 23,404 — — — — — 23,404
Employee severance expense 9 — 150 — — 41 20 220
Unrealized gain on derivative activities (1,734 ) — — — — — — (1,734 )
Change in fair value of warrants — — — — — — 13,423 13,423
Depreciation and amortization included within equity earnings 18,992 — — — — — — 18,992
Inventory valuation adjustment including equity method investees 7,781 — — — — — — 7,781
Recovery of receivables written off at emergence — — (664 ) — — — — (664 )
Bankruptcy related expenses — 1 — — — 150 1,159 1,310
Charitable contributions — — — — — — 3,379 3,379
Non-cash equity compensation 2,792 4 2,012 587 395 770 1,826 8,386
Selected Non-Cash Items and Other Items Impacting Comparability $ 28,159 $ (42,165 ) $ 590 $ (1,083 ) $ 621 $ 21,053 $ 34,255 $ 41,430
SemGroup Reconciliation of Net Income to Adjusted EBITDA
28
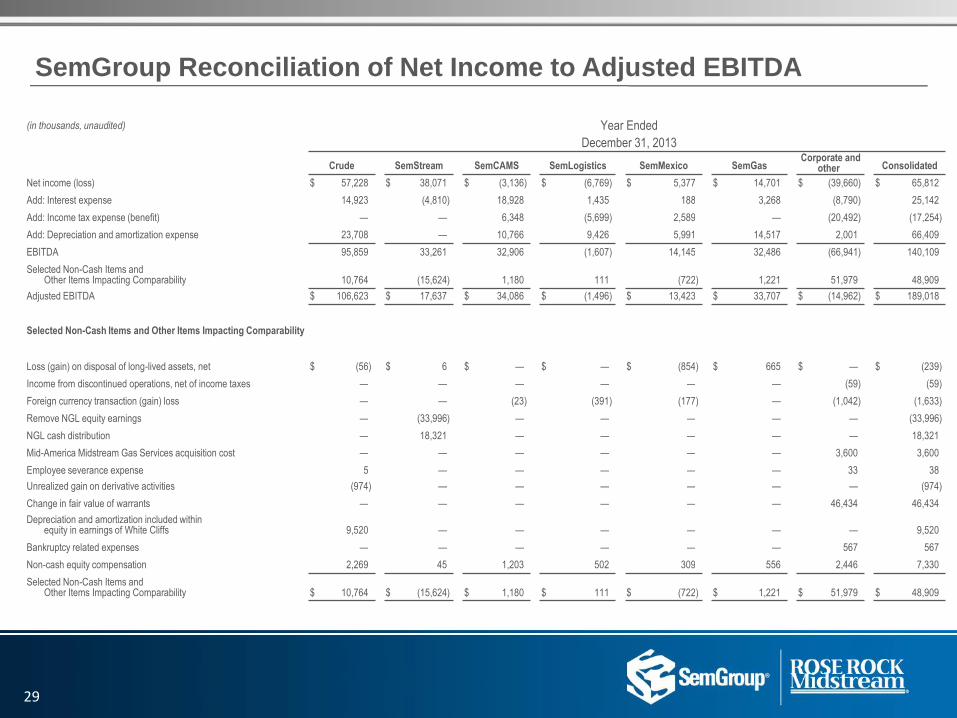
(in thousands, unaudited) Year Ended
December 31, 2013
Crude SemStream SemCAMS SemLogistics SemMexico SemGas Corporate and
other Consolidated
Net income (loss) $ 57,228 $ 38,071 $ (3,136 ) $ (6,769 ) $ 5,377 $ 14,701 $ (39,660 ) $ 65,812
Add: Interest expense 14,923 (4,810 ) 18,928 1,435 188 3,268 (8,790 ) 25,142
Add: Income tax expense (benefit) — — 6,348 (5,699 ) 2,589 — (20,492 ) (17,254 )
Add: Depreciation and amortization expense 23,708 — 10,766 9,426 5,991 14,517 2,001 66,409
EBITDA 95,859 33,261 32,906 (1,607 ) 14,145 32,486 (66,941 ) 140,109
Selected Non-Cash Items and Other Items Impacting Comparability 10,764 (15,624 ) 1,180 111 (722 ) 1,221 51,979 48,909
Adjusted EBITDA $ 106,623 $ 17,637 $ 34,086 $ (1,496 ) $ 13,423 $ 33,707 $ (14,962 ) $ 189,018
Selected Non-Cash Items and Other Items Impacting Comparability
Loss (gain) on disposal of long-lived assets, net $ (56 ) $ 6 $ — $ — $ (854 ) $ 665 $ — $ (239 )
Income from discontinued operations, net of income taxes — — — — — — (59 ) (59 )
Foreign currency transaction (gain) loss — — (23 ) (391 ) (177 ) — (1,042 ) (1,633 )
Remove NGL equity earnings — (33,996 ) — — — — — (33,996 )
NGL cash distribution — 18,321 — — — — — 18,321
Mid-America Midstream Gas Services acquisition cost — — — — — — 3,600 3,600
Employee severance expense 5 — — — — — 33 38
Unrealized gain on derivative activities (974 ) — — — — — — (974 )
Change in fair value of warrants — — — — — — 46,434 46,434
Depreciation and amortization included within equity in earnings of White Cliffs 9,520 — — — — — — 9,520
Bankruptcy related expenses — — — — — — 567 567
Non-cash equity compensation 2,269 45 1,203 502 309 556 2,446 7,330
Selected Non-Cash Items and Other Items Impacting Comparability $ 10,764 $ (15,624 ) $ 1,180 $ 111 $ (722 ) $ 1,221 $ 51,979 $ 48,909
SemGroup Reconciliation of Net Income to Adjusted EBITDA
29
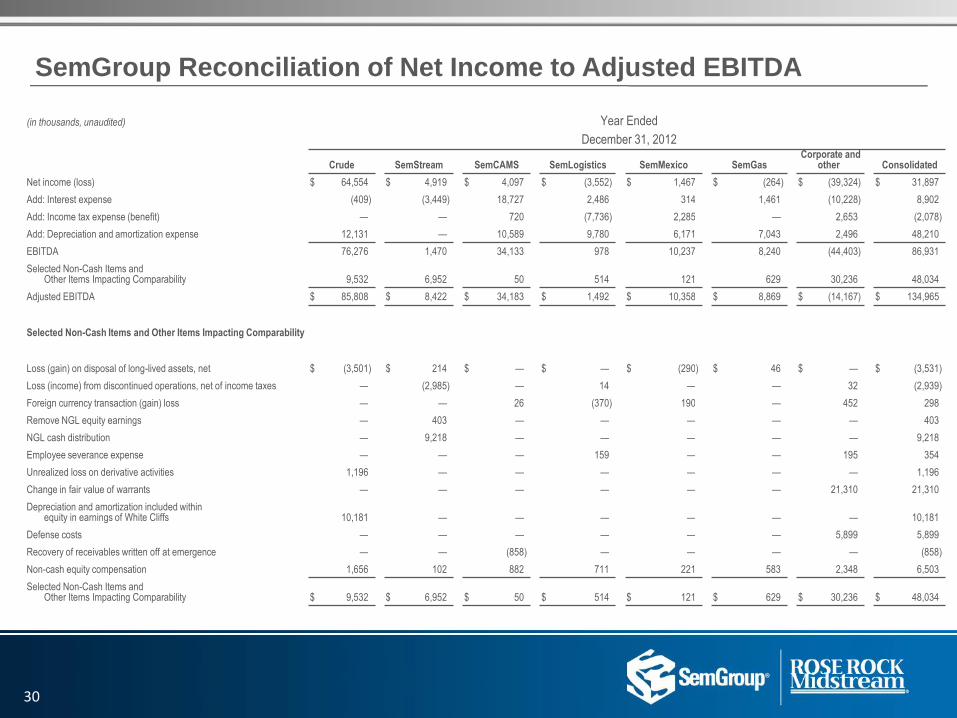
(in thousands, unaudited) Year Ended
December 31, 2012
Crude SemStream SemCAMS SemLogistics SemMexico SemGas Corporate and
other Consolidated
Net income (loss) $ 64,554 $ 4,919 $ 4,097 $ (3,552 ) $ 1,467 $ (264 ) $ (39,324 ) $ 31,897
Add: Interest expense (409 ) (3,449 ) 18,727 2,486 314 1,461 (10,228 ) 8,902
Add: Income tax expense (benefit) — — 720 (7,736 ) 2,285 — 2,653 (2,078 )
Add: Depreciation and amortization expense 12,131 — 10,589 9,780 6,171 7,043 2,496 48,210
EBITDA 76,276 1,470 34,133 978 10,237 8,240 (44,403 ) 86,931
Selected Non-Cash Items and Other Items Impacting Comparability 9,532 6,952 50 514 121 629 30,236 48,034
Adjusted EBITDA $ 85,808 $ 8,422 $ 34,183 $ 1,492 $ 10,358 $ 8,869 $ (14,167 ) $ 134,965
Selected Non-Cash Items and Other Items Impacting Comparability
Loss (gain) on disposal of long-lived assets, net $ (3,501 ) $ 214 $ — $ — $ (290 ) $ 46 $ — $ (3,531 )
Loss (income) from discontinued operations, net of income taxes — (2,985 ) — 14 — — 32 (2,939 )
Foreign currency transaction (gain) loss — — 26 (370 ) 190 — 452 298
Remove NGL equity earnings — 403 — — — — — 403
NGL cash distribution — 9,218 — — — — — 9,218
Employee severance expense — — — 159 — — 195 354
Unrealized loss on derivative activities 1,196 — — — — — — 1,196
Change in fair value of warrants — — — — — — 21,310 21,310
Depreciation and amortization included within equity in earnings of White Cliffs 10,181 — — — — — — 10,181
Defense costs — — — — — — 5,899 5,899
Recovery of receivables written off at emergence — — (858 ) — — — — (858 )
Non-cash equity compensation 1,656 102 882 711 221 583 2,348 6,503
Selected Non-Cash Items and Other Items Impacting Comparability $ 9,532 $ 6,952 $ 50 $ 514 $ 121 $ 629 $ 30,236 $ 48,034
SemGroup Reconciliation of Net Income to Adjusted EBITDA
30
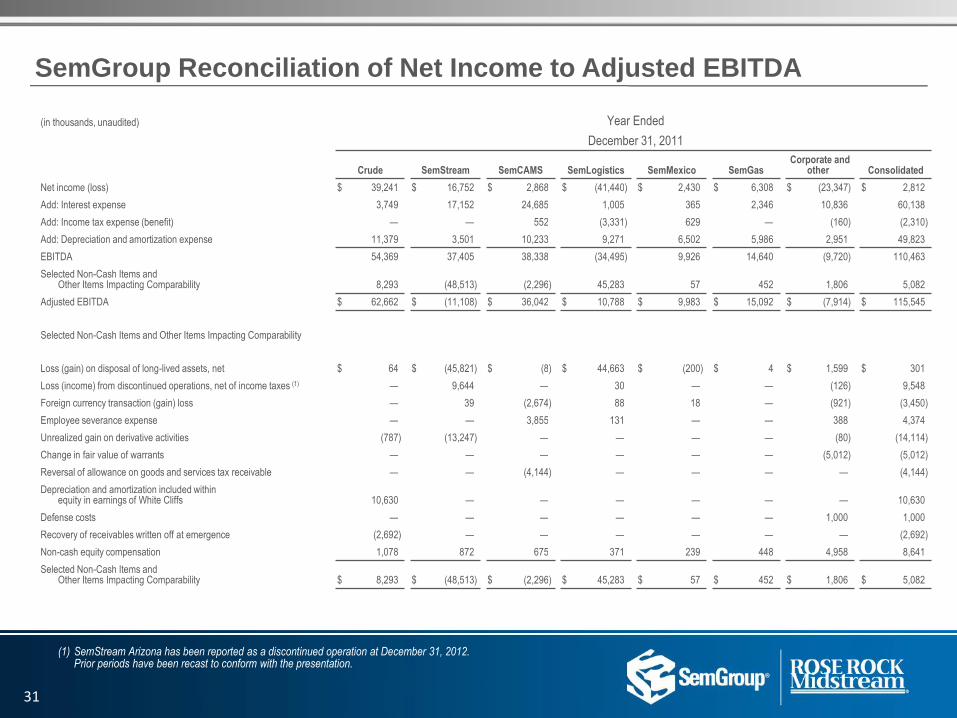
(in thousands, unaudited) Year Ended
December 31, 2011
Crude SemStream SemCAMS SemLogistics SemMexico SemGas Corporate and
other Consolidated
Net income (loss) $ 39,241 $ 16,752 $ 2,868 $ (41,440 ) $ 2,430 $ 6,308 $ (23,347 ) $ 2,812
Add: Interest expense 3,749 17,152 24,685 1,005 365 2,346 10,836 60,138
Add: Income tax expense (benefit) — — 552 (3,331 ) 629 — (160 ) (2,310 )
Add: Depreciation and amortization expense 11,379 3,501 10,233 9,271 6,502 5,986 2,951 49,823
EBITDA 54,369 37,405 38,338 (34,495 ) 9,926 14,640 (9,720 ) 110,463
Selected Non-Cash Items and Other Items Impacting Comparability 8,293 (48,513 ) (2,296 ) 45,283 57 452 1,806 5,082
Adjusted EBITDA $ 62,662 $ (11,108 ) $ 36,042 $ 10,788 $ 9,983 $ 15,092 $ (7,914 ) $ 115,545
Selected Non-Cash Items and Other Items Impacting Comparability
Loss (gain) on disposal of long-lived assets, net $ 64 $ (45,821 ) $ (8 ) $ 44,663 $ (200 ) $ 4 $ 1,599 $ 301
Loss (income) from discontinued operations, net of income taxes (1) — 9,644 — 30 — — (126 ) 9,548
Foreign currency transaction (gain) loss — 39 (2,674 ) 88 18 — (921 ) (3,450 )
Employee severance expense — — 3,855 131 — — 388 4,374
Unrealized gain on derivative activities (787 ) (13,247 ) — — — — (80 ) (14,114 )
Change in fair value of warrants — — — — — — (5,012 ) (5,012 )
Reversal of allowance on goods and services tax receivable — — (4,144 ) — — — — (4,144 )
Depreciation and amortization included within equity in earnings of White Cliffs 10,630 — — — — — — 10,630
Defense costs — — — — — — 1,000 1,000
Recovery of receivables written off at emergence (2,692 ) — — — — — — (2,692 )
Non-cash equity compensation 1,078 872 675 371 239 448 4,958 8,641
Selected Non-Cash Items and Other Items Impacting Comparability $ 8,293 $ (48,513 ) $ (2,296 ) $ 45,283 $ 57 $ 452 $ 1,806 $ 5,082
SemGroup Reconciliation of Net Income to Adjusted EBITDA
(1) SemStream Arizona has been reported as a discontinued operation at December 31, 2012. Prior periods have been recast to conform with the presentation.
31
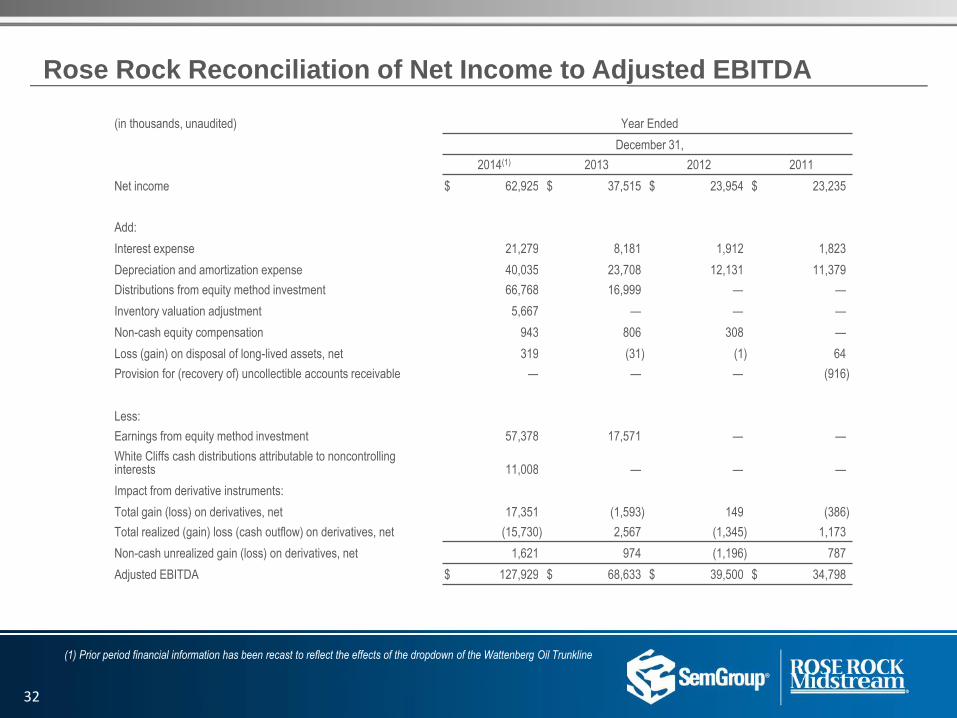
(in thousands, unaudited) Year Ended
December 31,
2014(1) 2013 2012 2011
Net income $ 62,925 $ 37,515 $ 23,954 $ 23,235
Add:
Interest expense 21,279 8,181 1,912 1,823
Depreciation and amortization expense 40,035 23,708 12,131 11,379
Distributions from equity method investment 66,768 16,999 — —
Inventory valuation adjustment 5,667 — — —
Non-cash equity compensation 943 806 308 —
Loss (gain) on disposal of long-lived assets, net 319 (31 ) (1 ) 64
Provision for (recovery of) uncollectible accounts receivable — — — (916 )
Less:
Earnings from equity method investment 57,378 17,571 — —
White Cliffs cash distributions attributable to noncontrolling interests 11,008 — — —
Impact from derivative instruments:
Total gain (loss) on derivatives, net 17,351 (1,593 ) 149 (386 )
Total realized (gain) loss (cash outflow) on derivatives, net (15,730 ) 2,567 (1,345 ) 1,173
Non-cash unrealized gain (loss) on derivatives, net 1,621 974 (1,196 ) 787
Adjusted EBITDA $ 127,929 $ 68,633 $ 39,500 $ 34,798
Rose Rock Reconciliation of Net Income to Adjusted EBITDA
(1) Prior period financial information has been recast to reflect the effects of the dropdown of the Wattenberg Oil Trunkline
32
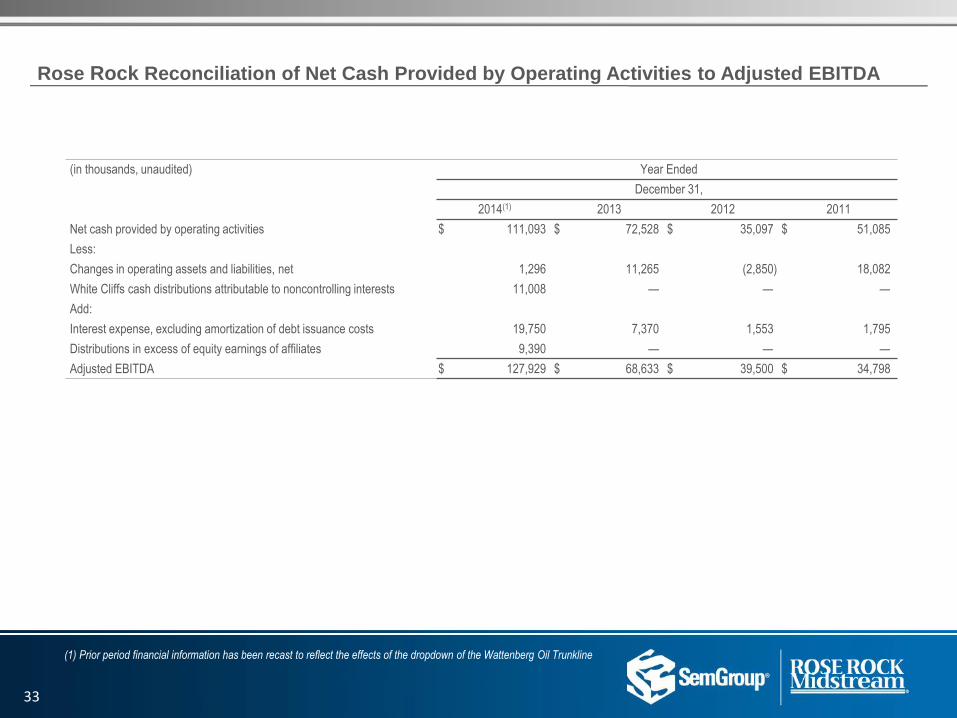
Rose Rock Reconciliation of Net Cash Provided by Operating Activities to Adjusted EBITDA
(in thousands, unaudited) Year Ended
December 31,
2014(1) 2013 2012 2011
Net cash provided by operating activities $ 111,093 $ 72,528 $ 35,097 $ 51,085
Less:
Changes in operating assets and liabilities, net 1,296 11,265 (2,850 ) 18,082
White Cliffs cash distributions attributable to noncontrolling interests 11,008 — — —
Add:
Interest expense, excluding amortization of debt issuance costs 19,750 7,370 1,553 1,795
Distributions in excess of equity earnings of affiliates 9,390 — — —
Adjusted EBITDA $ 127,929 $ 68,633 $ 39,500 $ 34,798
(1) Prior period financial information has been recast to reflect the effects of the dropdown of the Wattenberg Oil Trunkline
33