Embed Size (px)
Citation preview

Security Analysis and
Portfolio Management
Presenting By:
Himanshu Jain
913003
International School of Business & Media

INTRODUCTION
• Live Project is all about studying the company’s financial health through the movement of their stock price.
• It discusses various aspects of portfolio management, ranging from analysis, selection, and revision to evaluation of portfolio, securities market and risk evaluation.
• This live project helped to understand how the stock prices vary. It also helped to know and calculate several technical terms.
• Stocks that assigned are:
1. Ambuja Cement (AMBUJACEM)
2. Cipla
3. Hero Motors (HEROMOTOCO)
4. Kotak Mahindra Bank (KOTAKBANK)
5. Ranbaxy

OBJECTIVE
• The main objective of this live assignment is to give the optimum returns to
the investor by considering risk and return, portfolio risk, portfolio return and
several other factors which helps to determine where to invest for an investor.
PROCESS
UPDATE DAILY CLOSING
PRICE,OPENING PRICE,HIGH,LOW,
PREV.CLOSE
Data Analysis of each through NSE per day
CALCULATE %CHANGE
Finding the reason for percentage change for every change of above
+5 and -5.
calculate correlation,variance,B
of all stocks
CALCULATE PORTFOLIO OF B
EVALUATION OF PORTFOLIO(RISK AND RETURN OF
ALL)
PERFORM EQUITY ANALYSIS
ANALYSE THE DATA WITH THE HELP OF
TECHNICAL ANALYSIS
ALSO PERFORM COMPANY ANALYSIS
DECISION TO BE TAKEN

EQUITY VALUATION
• Finding the Intrinsic Value of the Different stocks by finding the Return on
Equity, Dividend, Earning per share, Retention Ratio, Growth, Future
Dividend and Expected Return by taking the Closing Price of the stocks.
• Growth= ROE * Retention Ratio
• Expected Return(Ke), Intrinsic value(Po)
• Po= D1/(Ke-g)

AMBUJA CEMENT
Year ROE Divd. EPS Retention Ratio
2008-09 -41% 2.2 9.21 72%
2009-10 67% 2.4 8.00 65%
2010-11 25% 2.6 8.28 63%
2011-12 17% 3.2 8.02 54%
2012-13 1% 3.6 8.43 50%
14% 61%
Growth 0.08
Future Div. 3.901772
Expected Return 0.11
Ke-g 0.03
Expected price 149.07

CIPLA
Year ROE Divd. Profit Retained Retained %
2007-08 -2.48% 2 701.43 519.55 74.07
2008-09 -0.11% 2 776.81 594.93 76.59
2009-10 54.60% 2 1081.49 894.24 82.69
2010-11 -5.12% 2.8 960.39 698.86 72.77
2011-12 -4.61% 2 1123.96 937.32 83.39
2012-13 22.84% 2 1507.11 1319.24 87.53
11% 79.51
Growth 0.09
Future Div. 2.17
Expected Return 0.11
Ke-G 0.02
Expected M.P 217.00

HERO MOTORS
Year ROE Div. EPS Retention Ratio
2006-07 38.30% 17 43 60.47%
2007-08 35.50% 19 48.5 60.82%
2008-09 37.80% 20 64.2 68.85%
2009-10 61.40% 110 111.8 1.61%
2010-11 65.20% 105 96.5 -8.81%
2011-12 55.40% 45 119.1 62.22%
2012-13 42.30% 60 106.1 43.45%
47.99% 41.23%
Growth 0.1978
Future Div. 71.87
Expected Return 0.24
Ke-g 0.04
Expected Price 1704.78

KOTAK MAHINDRA BANK
Year ROE Dividend EPS Retention Ratio
2006-07 68% 0.70 4.33 83.83%
2007-08 36% 0.75 8.53 91.21%
2008-09 -56% 0.75 7.99 90.61%
2009-10 150% 0.85 16.12 94.73%
2010-11 -39% 0.50 11.1 95.50%
2011-12 21% 0.60 14.65 95.90%
2012-13 17% 0.70 18.23 96.16%
28.32% 92.56%
Growth 0.2622
Future Div. 0.884
Expected Return 0.29
Ke-g 0.0278
Expected M.P 31.80

RANBAXYYear ROE Dividend EPS Retention Ratio
2006-07 -20.09% 8.5 9.87 13.88%
2007-08 28.35% 8.5 11.31 24.85%
2008-09 -62.85% 0 -27.29 0%
2009-10 166.33% 0 10.74 100.00%
2010-11 -6.43% 2 23.75 91.58%
2011-12 4.18% 0 -72.42 0%
2012-13 -4.40% 0 -3.85 0%
15.01% 32.90%
Growth 0.0494
Future Div. 0
Expected Return 0.10
Ke-g 0.0506
Expected Price 0

BETA
• Beta is a Sensitivity of an individual stock or portfolio’s return to the return
on the market index.
• Beta measures the SENSITIVITY of the stocks responsiveness to the market
factors.
• Beta measures how much a stock would rise or fall if market raises/falls
Beta(B)=Cov.( x, y)/ Var.x

Beta of Stocks(13 Jan-07 March)
SI.NO. STOCKS COV. VAR. BETA(B)
1 AMBUJACEM 1.27 0.72 1.76
2 CIPLA 0.42 0.72 0.58
3 HEROMOTOCO 0.37 0.72 0.51
4 KOTAKBANK 1.13 0.72 1.58
5 RANBAXY 1.51 0.72 2.11

Beta of Portfolio
SI. No. Stock Price Quantity Beta(B) Value Weightage WiBi
1 Ambujacem 162.00 4999 1.76 ₹ 8,09,838.00 0.16 0.29
2 Cipla 369.20 3000 0.58 ₹ 11,07,600.00 0.22 0.13
3 Heromotoco 1919.15 570 0.51 ₹ 10,93,915.50 0.22 0.11
4 Kotakbank 672.05 1905 1.58 ₹ 12,80,255.25 0.26 0.40
5 Ranbaxy 354.15 2000 2.11 ₹ 7,08,300.00 0.14 0.30
Total ₹ 49,99,908.75 1.23
Portfolio Beta(B) 1.23

EXPECTED RETURN
• The amount one would anticipate receiving on an investment that has various
known or expected rates of return.
• The expected return is a tool used to determine whether or not an investment
has a positive or negative average net outcome - it is not a hard and fast figure
of profit or loss.
• E(R)=Avg. of returns from stock
• E(Rp)=Ʃ Wi * E(Ri) Where W is weight of a security in portfolio

Expected Return(13 Jan- 07 March)
SI.NO. STOCKS E[R]
1 NIFTY 0.11%
2 AMBUJACEM 0.20%
3 CIPLA -0.13%
4 HEROMOTOCO -0.03%
5 KOTAKBANK -0.01%
6 RANBAXY -0.36%

Expected Return of Portfolio
SI.NO. STOCKS
1 AMBUJACEM
2 CIPLA
3 HEROMOTCOP
4 KOTAKBANK
5 RANBAXY
Expected Return of
Portfolio
E(R)(1 &2) 0.04
E(R)(1 &3) 0.09
E(R)(1 &4) 0.10
E(R)(1 &5) -0.08
E(R)(2 &3) -0.08
E(R)(2 &4) -0.07
E(R)(2 &5) -0.24
E(R)(3 &4) -0.02
E(R)(3 &5) -0.20
E(R)(4 &5) -0.18

Risk
• Risk refers to the possibility that the actual outcome of an investment will
differ from its expected outcomes.
• Most investors are concerned about the actual outcomes being less then the
expected outcome.
• The wider the range of possible outcomes, the greater the risk.
• Risk for individual stocks
σ=√Ʃ((Ri-E(R))^2)/(n-1)
• Risk for Portfolio(1 & 2)
σp=√((W1*σ1)^2) + ((W2*σ2)^2) + (2* W1*σ1* W2*σ2*ρ)
Where ρ= Correlation cofficent

Individual Risk
SI.NO. STOCKS RISK
1 AMBUJACEM 2.11%
2 CIPLA 1.73%
3 HEROMOTCOP 1.23%
4 KOTAKBANK 1.72%
5 RANBAXY 3.91%

Portfolio Risk
Co variance Coff. Of Correlation Risk of Portfolio
COV.(1 &2) 0.01 Coff. Of Corr.(1 &2) 31.94 Risk(1 & 2) 7.75%
COV.(1 &3) 0.01 Coff. Of Corr.(1 &3) 25.12 Risk(1 & 3) 5.83%
COV.(1 &4) 0.02 Coff. Of Corr.(1 &4) 51.26 Risk(1 & 4) 9.74%
COV.(1 &5) 0.03 Coff. Of Corr.(1 &5) 42.07 Risk(1 & 5) 13.36%
COV.(2 &3) 0.00 Coff. Of Corr.(2 &3) 20.93 Risk(2 & 3) 4.83%
COV.(2 &4) 0.01 Coff. Of Corr.(2 &4) 23.45 Risk(2 & 4) 6.03%
COV.(2 &5) 0.01 Coff. Of Corr.(2&5) 7.88 Risk(2 & 5) 5.59%
COV.(3 &4) 0.01 Coff. Of Corr.(3 &4) 40.28 Risk(3 & 4) 6.60%
COV.(3 &5) 0.01 Coff. Of Corr.(3 &5) 19.55 Risk(3 & 5) 7.15%
COV.(4 &5) 0.03 Coff. Of Corr.(4 &5) 42.87 Risk(4 & 5) 12.20%
SI.NO. STOCKS
1 AMBUJACEM
2 CIPLA
3 HEROMOTCOP
4 KOTAKBANK
5 RANBAXY

Portfolio Evaluation
Three Tools to calculate :
1. Sharpe Ratio= (E(R)-Rf)/σp
2. Treynor Ratio=(E(R)-Rf)/βp
3. Jenson’s Alpha= E(R)-RR

Portfolio Evaluation
Sharp Ratio Beta(B) Treynors Ratio Jensens Alpha
-0.29 24.75 -0.09 -1.86
0.45 14.64 0.18 -1.31
0.39 49.92 0.08 -3.06
-1.05 56.22 -0.25 -3.55
-2.85 10.10 -1.36 -1.24
-2.09 14.14 -0.89 -1.43
-5.46 4.40 -6.92 -1.12
-1.17 26.59 -0.29 -2.01
-3.58 13.98 -1.83 -1.56
-2.00 52.32 -0.47 -3.46

Technical Analysis
NIFTY

AMBUJA CEMENT

CIPLA

HERO MOTORS

KOTAK MAHINDRA BANK

RANBAXY
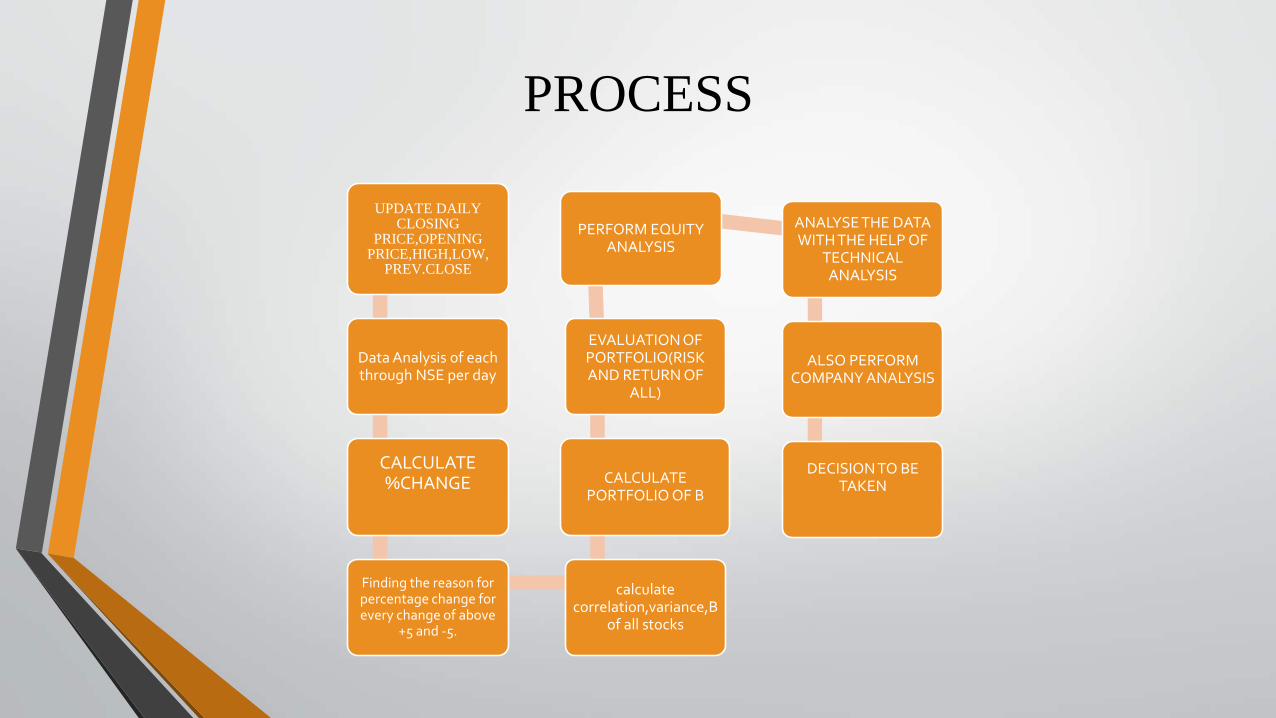
Company Analysis
Financial analysis of Ambuja Cement (FOR THE YEAR 2012-13)
1. Return on equity =1 %
2. Book Value per share = 57.24
3. Earnings per share = 8.43
4. Dividend payout ratio = 50 %
5. Dividend per share = 3.60

Company Analysis
Growth Performance
• CAGR of sales = (sales for 2008/sales for 2012)1/5 - 1
= (6220/9675)1/5-1
= -0.08
• CAGR of E.P.S = (E.P.S of 2008/E.P.S of 2012)1/5 -1
= (9.21/8.43)1/5-1
= 0.02
• CAGR of dividend = (D.P.S of 2008/ D.P.S of 2012)1/5-1
= (2.2/3.6)1/5-1
= -0.09
Sustainable growth Rate
• SGR = Retention ratio * Return on equity
= 0.50 * 0.01
=0.0050
=0.50%

LARNINGS & CONCLUSION
• This live project helped me to understand the following things:
• Different approaches of Evaluation of expected return and risk for each stock.
• Under this project, I got to know about portfolio management including the evaluation of portfolio with the objectiveof maximising returns and minimising risk.
• Diversification of investment in order to reduce the risk of loss by not putting all the eggs into one basket.
• Analysis of market condition and forecasting future changes.
• To know how to reduce the risk and get more return in the portfolio.
• Understanding the volatility of the stocks and their returns.
• To know the company credibility in the stock market.
• Calculate of deviation, correlation of the stocks.
• How technical analysis is done.
• Fundamental analysis of a company.
Conclusion:
• Live project had enabled to perform analysis and then to decide the best portfolio for investment to get higherreturn