Embed Size (px)
Citation preview

Renishaw plc 1
2015 Interim results29th January 2015

Renishaw plc 2
Interim management report
• Record first half revenue and profit.
• Revenue up 36% over last year, 40% at constant
exchange rates.
• Profit before tax of £56.6m (2014: £25.6m).
• Strong balance sheet, with cash of £38.8m at the end
of the period.
• Capital expenditure of £18.8m.
• Increased dividend of 12.5 pence per share.
2015 Interim results

Renishaw plc 3
Financial highlights
132.2147.1
174.2 164.0
223.8
2011 2012 2013 2014 2015
Revenue £m2015
£m
2014
£m
Change
%
Revenue 223.8 164.0 +36%
Operating profit 56.6 25.5 +122%
Profit before tax 56.6 25.6 +121%
pence pence
Earnings per share 64.2 29.5 +118%
Dividend per share 12.5 11.33 +10%
35.231.2
42.2
25.6
56.6
2011 2012 2013 2014 2015
Adjusted profit before tax £m
2015 Interim results
Renishaw plc 4
2015
£m %
2014
£m % Change
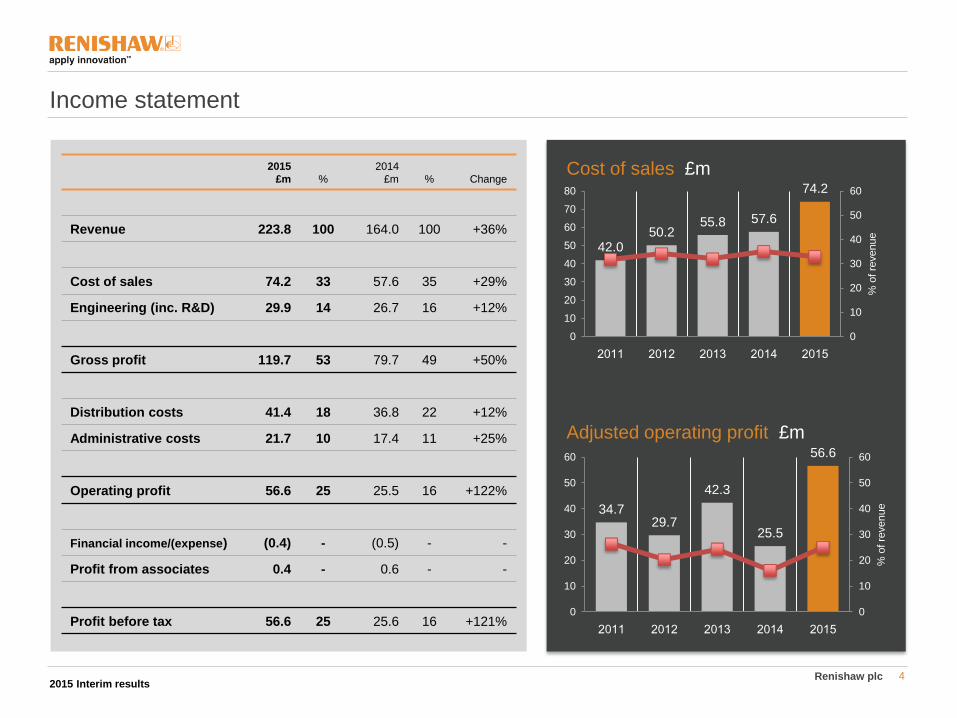
Revenue 223.8 100 164.0 100 +36%
Cost of sales 74.2 33 57.6 35 +29%
Engineering (inc. R&D) 29.9 14 26.7 16 +12%
Gross profit 119.7 53 79.7 49 +50%
Distribution costs 41.4 18 36.8 22 +12%
Administrative costs 21.7 10 17.4 11 +25%
Operating profit 56.6 25 25.5 16 +122%
Financial income/(expense) (0.4) - (0.5) - -
Profit from associates 0.4 - 0.6 - -
Profit before tax 56.6 25 25.6 16 +121%
Income statement
42.050.2
55.8 57.6
74.2
0
10
20
30
40
50
60
0
10
20
30
40
50
60
70
80
2011 2012 2013 2014 2015
% o
f re
venue
Cost of sales £m
34.729.7
42.3
25.5
56.6
0
10
20
30
40
50
60
0
10
20
30
40
50
60
2011 2012 2013 2014 2015
% o
f re
venue
Adjusted operating profit £m
2015 Interim results
Renishaw plc 5
Income statement
17.0
22.424.1
26.729.9
0
10
20
30
40
50
0
5
10
15
20
25
30
35
2011 2012 2013 2014 2015
% o
f re
venue
Engineering costs (net) £m
23.7
29.333.2
36.841.4
0
10
20
30
40
50
0
10
20
30
40
50
2011 2012 2013 2014 2015
% o
f re
venue
Distribution costs £m
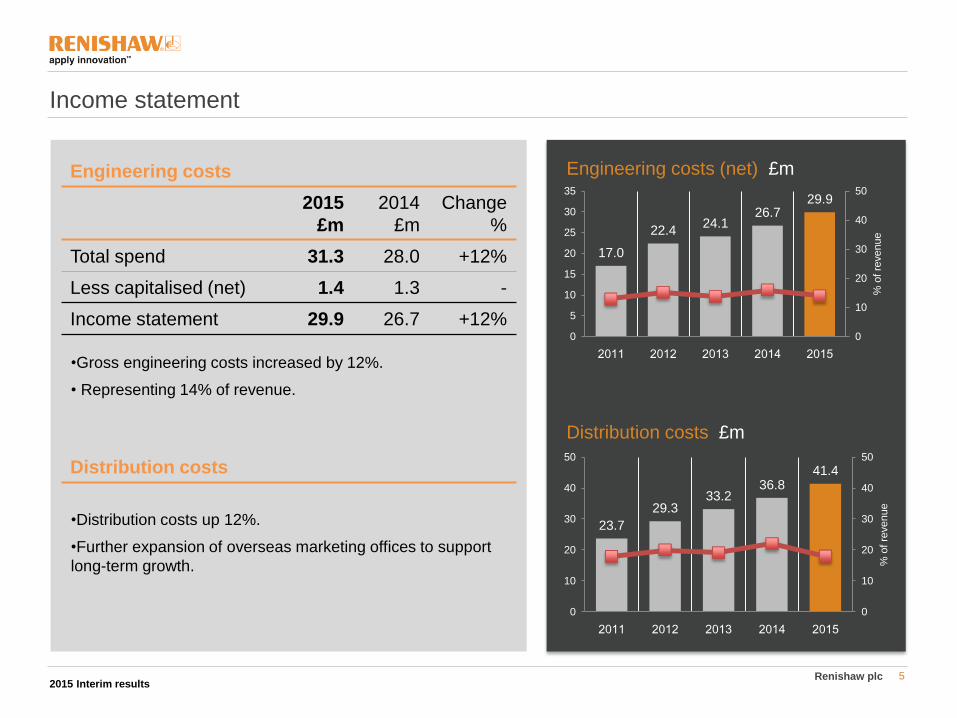
•Gross engineering costs increased by 12%.
• Representing 14% of revenue.
Engineering costs
2015
£m
2014
£m
Change
%
Total spend 31.3 28.0 +12%
Less capitalised (net) 1.4 1.3 -
Income statement 29.9 26.7 +12%
Distribution costs
•Distribution costs up 12%.
•Further expansion of overseas marketing offices to support
long-term growth.
2015 Interim results
Renishaw plc 6
Income statement
14.8 15.5
18.817.4
21.7
0
10
20
30
0
5
10
15
20
25
2011 2012 2013 2014 2015
% o
f re
venue
Administrative costs £m
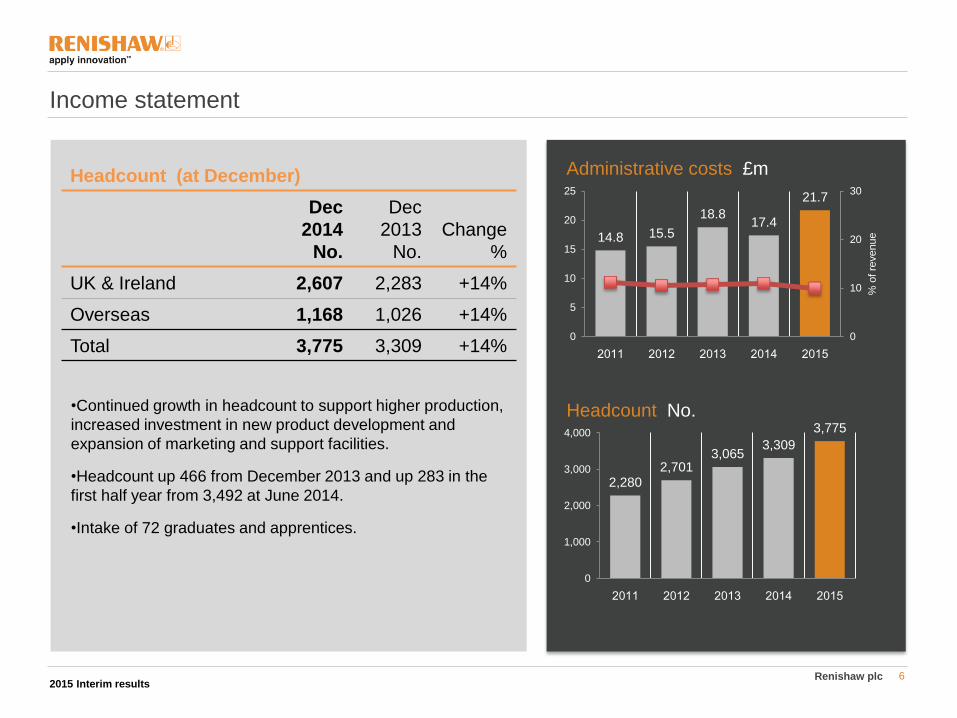
•Continued growth in headcount to support higher production,
increased investment in new product development and
expansion of marketing and support facilities.
•Headcount up 466 from December 2013 and up 283 in the
first half year from 3,492 at June 2014.
•Intake of 72 graduates and apprentices.
Headcount (at December)
Dec
2014
No.
Dec
2013
No.
Change
%
UK & Ireland 2,607 2,283 +14%
Overseas 1,168 1,026 +14%
Total 3,775 3,309 +14%
2015 Interim results
2,2802,701
3,0653,309
3,775
0
1,000
2,000
3,000
4,000
2011 2012 2013 2014 2015
Headcount No.
Renishaw plc 7
Income statement
2015 Interim results
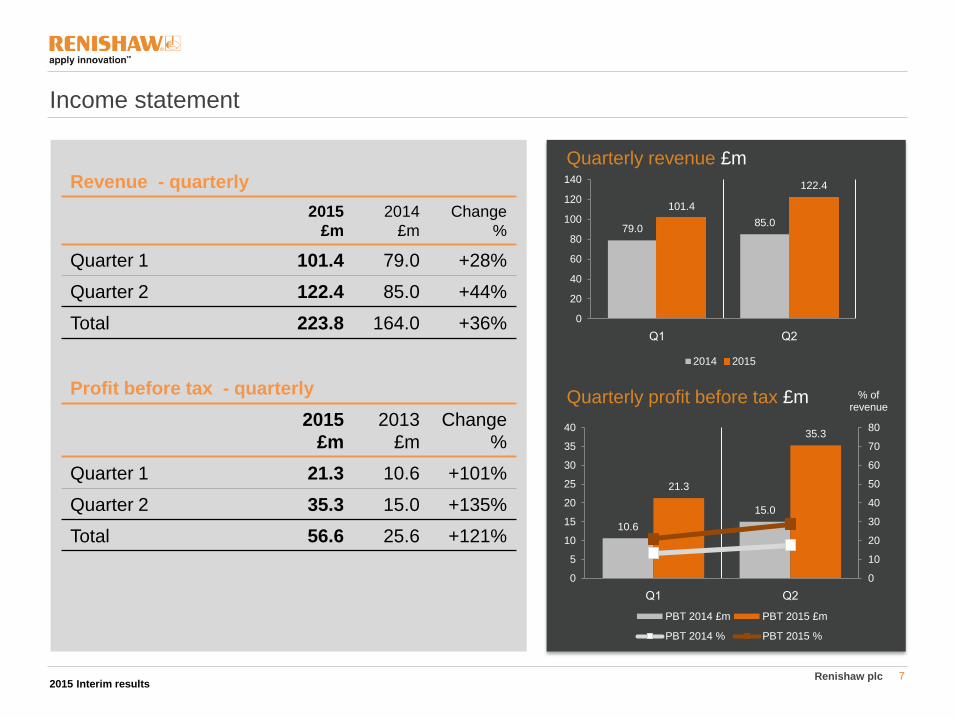
Revenue - quarterly
2015
£m
2014
£m
Change
%
Quarter 1 101.4 79.0 +28%
Quarter 2 122.4 85.0 +44%
Total 223.8 164.0 +36%
Profit before tax - quarterly
2015
£m
2013
£m
Change
%
Quarter 1 21.3 10.6 +101%
Quarter 2 35.3 15.0 +135%
Total 56.6 25.6 +121%
79.085.0
101.4
122.4
0
20
40
60
80
100
120
140
Q1 Q2
Quarterly revenue £m
2014 2015
10.6
15.0
21.3
35.3
0
10
20
30
40
50
60
70
80
0
5
10
15
20
25
30
35
40
Q1 Q2
% of revenue
Quarterly profit before tax £m
PBT 2014 £m PBT 2015 £m
PBT 2014 % PBT 2015 %

Renishaw plc 8
Income statement
0 10 20 30 40 50 60 70 80
2015 PBT
Additional administration costs
Additional distribution costs
Additional engineering costs
Margin improvement
Revenue increase less cost of sales
2014 PBT
Profit before tax changes from 2014 £m
25.6
(4.6)
(4.3)
38.8
4.4
(3.2)
56.6
2015 Interim results
Renishaw plc 9
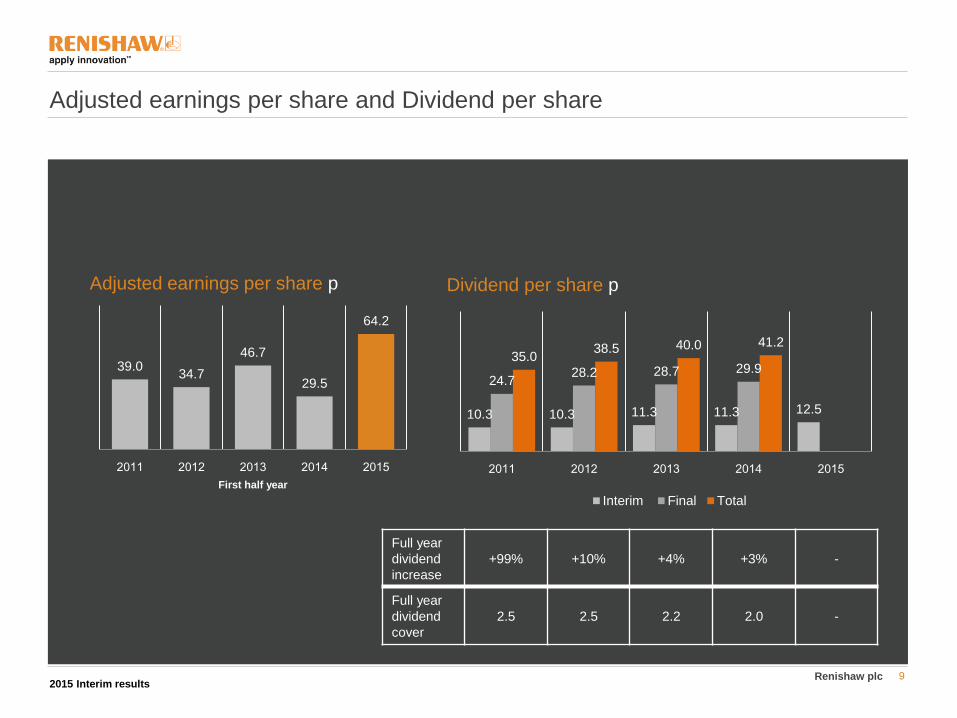
Adjusted earnings per share and Dividend per share
39.034.7
46.7
29.5
64.2
2011 2012 2013 2014 2015
First half year
Adjusted earnings per share p
10.3 10.3 11.3 11.3 12.5
24.728.2 28.7 29.9
35.038.5 40.0 41.2
2011 2012 2013 2014 2015
Dividend per share p
Interim Final Total
Full year
dividend
increase
+99% +10% +4% +3% -
Full year
dividend
cover
2.5 2.5 2.2 2.0 -
2015 Interim results
Renishaw plc 10
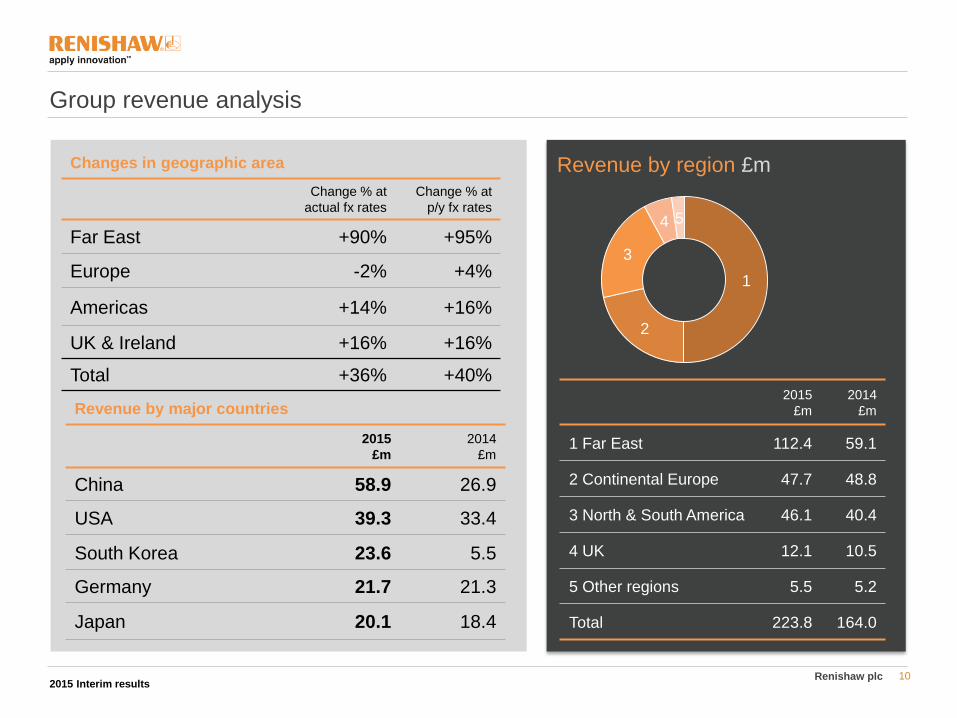
1
2
3
4 5
Revenue by region £m
2015
£m
2014
£m
1 Far East 112.4 59.1
2 Continental Europe 47.7 48.8
3 North & South America 46.1 40.4
4 UK 12.1 10.5
5 Other regions 5.5 5.2
Total 223.8 164.0
Changes in geographic area
Change % at
actual fx rates
Change % at
p/y fx rates
Far East +90% +95%
Europe -2% +4%
Americas +14% +16%
UK & Ireland +16% +16%
Total +36% +40%
Group revenue analysis
Revenue by major countries
2015
£m
2014
£m
China 58.9 26.9
USA 39.3 33.4
South Korea 23.6 5.5
Germany 21.7 21.3
Japan 20.1 18.4
2015 Interim results
Renishaw plc 11
Group revenue analysis
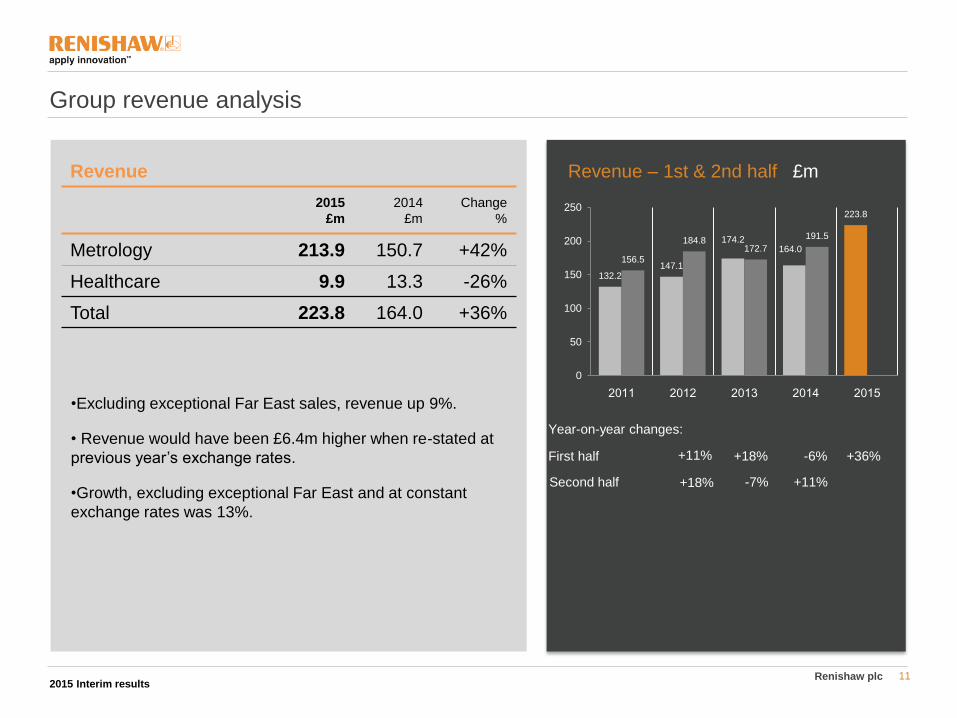
132.2147.1
174.2164.0
223.8
156.5
184.8172.7
191.5
0
50
100
150
200
250
2011 2012 2013 2014 2015
Revenue – 1st & 2nd half £m
•Excluding exceptional Far East sales, revenue up 9%.
• Revenue would have been £6.4m higher when re-stated at
previous year’s exchange rates.
•Growth, excluding exceptional Far East and at constant
exchange rates was 13%.
Revenue
2015
£m
2014
£m
Change
%
Metrology 213.9 150.7 +42%
Healthcare 9.9 13.3 -26%
Total 223.8 164.0 +36%
+11%
+18%
+18% -6%
+11%-7%
+36%First half
Second half
Year-on-year changes:
2015 Interim results

Renishaw plc 12
1
2
3
4 5
Revenue by region £m
2015
£m
2014
£m
1 Far East 110.1 54.1
2 Continental Europe 45.5 44.9
3 North and South America 43.5 37.9
4 UK 9.9 9.2
5 Other regions 4.9 4.6
Changes in geographic area
Change %
Far East +104%
Europe +1%
Americas +15%
UK & Ireland +8%
Group revenue analysis - Metrology
Results
2015
£m
2014
£m
Operating profit 62.3 27.8
Revenue
2015
£m
2014
£m
Change
%
Metrology 213.9 150.7 +42%
2015 Interim results
Renishaw plc 13
Metrology highlights
•Overall growth of 42%.
•Growth of 12% after adjusting for Far East large orders, 16% at constant exchange rates.
•Exceptional growth in machine tool products line.
•Good growth in measurement automation, 3D additive manufacturing and encoder products lines.
•Increased R&D investment in all products lines.
•EVO Project - the first additive manufacturing system designed and engineered in-house at
Renishaw , planned for H2 of calendar year 2015, has a strong emphasis on automation, monitoring
technologies and reduced operator interaction and is designed for single material industrial
production.
2015 Interim results

Renishaw plc 14
New product releases / Metrology
PlusPac™ upgrade pack
for AM250 additive
manufacturing machine
2015 Interim results
Cavity Profiler – new 3D
laser scanning software to
speed underground
mapping and modelling
operations
RVI20 vacuum compatible interferometer
assembly for plane mirrors
PH10M-iQ Plus – the
latest addition to the
range of PH10 heads
RSP3-6 REVO® scanning
probe for ultra-long styli
Renishaw plc 15
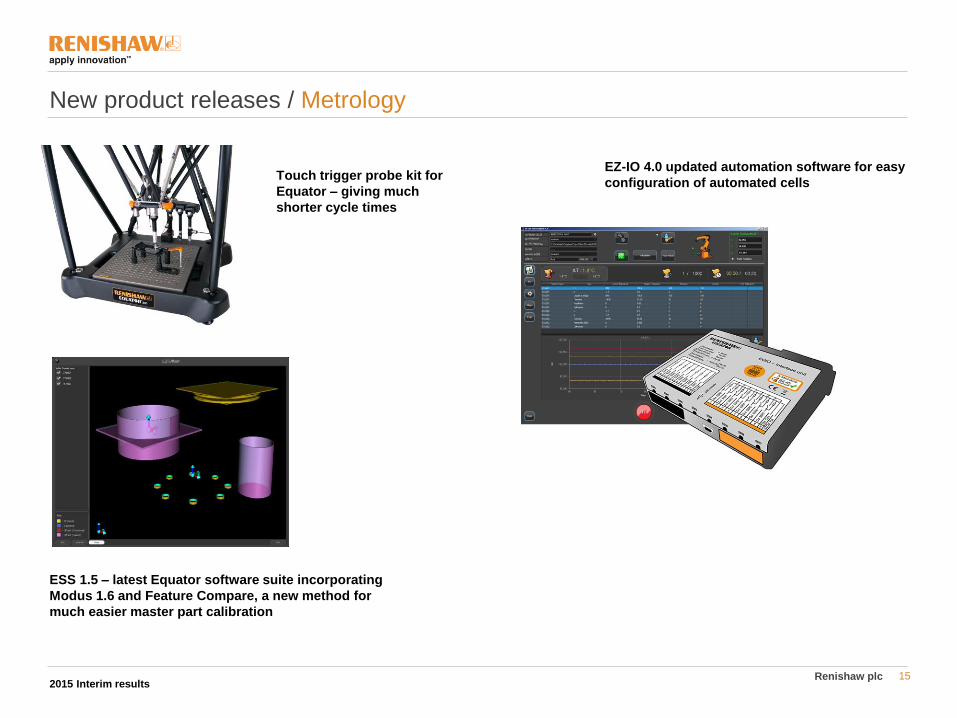
New product releases / Metrology
Touch trigger probe kit for
Equator – giving much
shorter cycle times
2015 Interim results
EZ-IO 4.0 updated automation software for easy
configuration of automated cells
ESS 1.5 – latest Equator software suite incorporating
Modus 1.6 and Feature Compare, a new method for
much easier master part calibration

Renishaw plc 16
1
2
3
4
5
Revenue by region £m
2015
£m
2014
£m
1 Far East 2.3 5.0
2 Continental Europe 2.2 3.9
3 North and South America 2.6 2.5
4 UK 2.3 1.3
5 Other regions 0.5 0.6
Changes in geographic area
Change %
Far East -54%
Europe -44%
Americas +4%
UK & Ireland +77%
Group revenue analysis - Healthcare
Results
2015
£m
2014
£m
Operating (loss) (5.7) (2.3)
Revenue
2015
£m
2014
£m
Change
%
Healthcare 9.9 13.3 -26%
2015 Interim results
Renishaw plc 17
Healthcare highlights
•Growth in neuro and dental products lines.
•Spectroscopy revenue lower but recovery expected in the second half year.
•Encouraging interest in our 3D additive manufacturing system for medical applications.
•Neuroinspire™ V4.0 surgical planning software, which includes significant new functionality, is CE
marked and now available for sale in the EU.
•Neuroinspire now integrates with our neuromate robot.
•Agreement with DENTSPLY Implants, one of the world’s leading companies in implant dentistry,
which will see them purchase Renishaw additive manufacturing technology for the manufacture of
dental products.
2015 Interim results

Renishaw plc 18
New product releases / Healthcare
WiRE 4.1 updated software with
improvements in 2D and 3D
imaging in Raman spectroscopy
2015 Interim results
2 material science and 2 biological
applications launched, for use with
the inVia Raman microscope
neuroinspire V4.0 - with significant new functionality
including ability to interface with hospital data
networks (PACS) and support for SEEG procedures
neuroinspire/neuromate integration –
integration of neuroinspire planning
software with the neuromate robot
allowing direct control of the neuromate
robot from surgical plans prepared in
neuroinspire

Renishaw plc 19
2015
£m
2014
£m
Profit before tax 56.6 25.6
Depreciation and amortisation 13.4 12.0
Financial income and expenses 0.4 0.5
Share of profits from associates (0.4) (0.7)
(Increase) in inventory (4.1) (0.3)
(Increase)/decrease in debtors (16.0) 5.6
Increase/(decrease) in creditors 2.6 (6.7)
Total movement in working capital (17.5) (1.4)
DB pension contributions (1.1) (1.1)
Income taxes paid (5.8) (5.2)
Cash from operating activities 45.6 29.7
Cash flow from operating activities
23.8
31.7
26.829.7
45.6
0
10
20
30
40
50
2011 2012 2013 2014 2015
Cash from operating activities £m
2015 Interim results
Renishaw plc 20
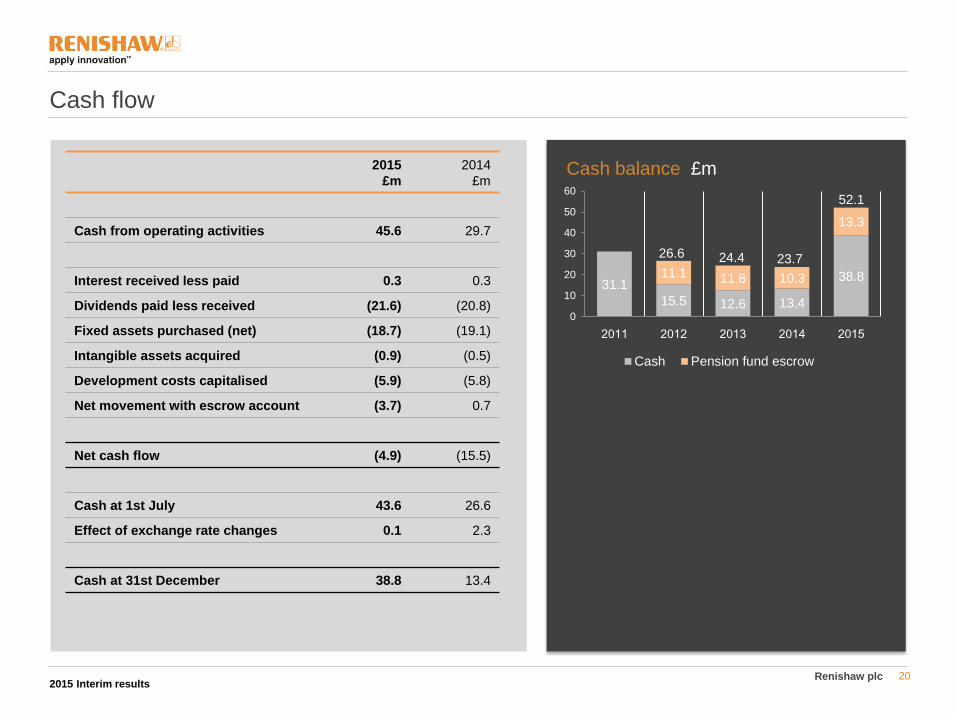
2015
£m
2014
£m
Cash from operating activities 45.6 29.7
Interest received less paid 0.3 0.3
Dividends paid less received (21.6) (20.8)
Fixed assets purchased (net) (18.7) (19.1)
Intangible assets acquired (0.9) (0.5)
Development costs capitalised (5.9) (5.8)
Net movement with escrow account (3.7) 0.7
Net cash flow (4.9) (15.5)
Cash at 1st July 43.6 26.6
Effect of exchange rate changes 0.1 2.3
Cash at 31st December 38.8 13.4
Cash flow
31.1
15.5 12.6 13.4
38.811.1 11.8 10.3
13.3
0
10
20
30
40
50
60
2011 2012 2013 2014 2015
Cash balance £m
Cash Pension fund escrow
23.7
2015 Interim results
26.6 24.4
52.1
Renishaw plc 21
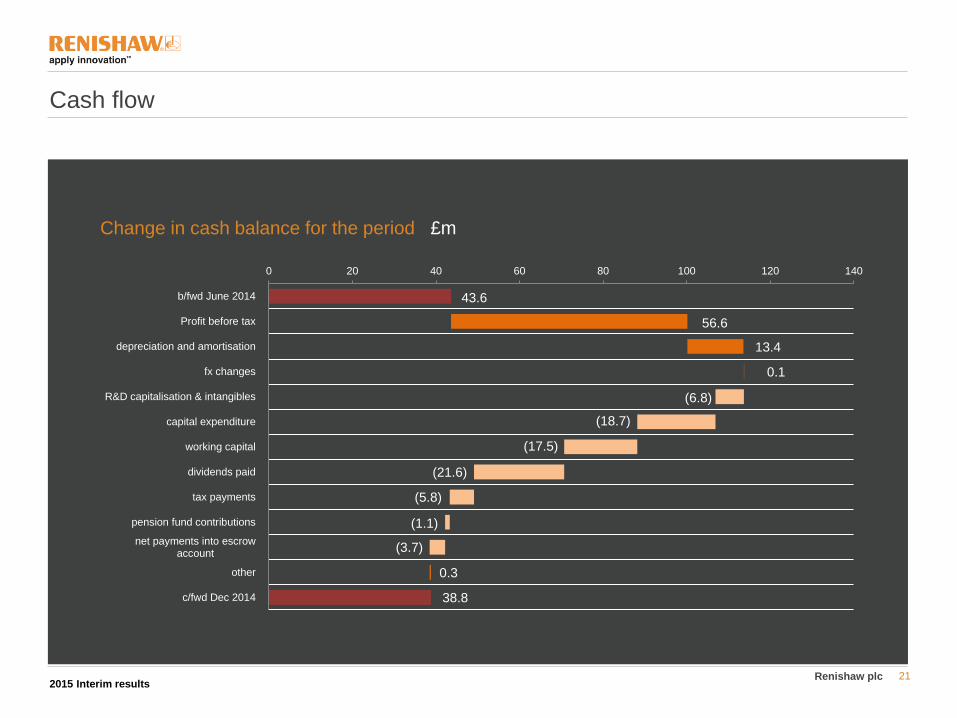
Cash flow
0 20 40 60 80 100 120 140
c/fwd Dec 2014
other
net payments into escrowaccount
pension fund contributions
tax payments
dividends paid
working capital
capital expenditure
R&D capitalisation & intangibles
fx changes
depreciation and amortisation
Profit before tax
b/fwd June 2014
Change in cash balance for the period £m
43.6
13.4
0.1
(18.7)
(21.6)
(5.8)
(1.1)
38.8
(6.8)
(17.5)
(3.7)
56.6
2015 Interim results
0.3
Renishaw plc 22
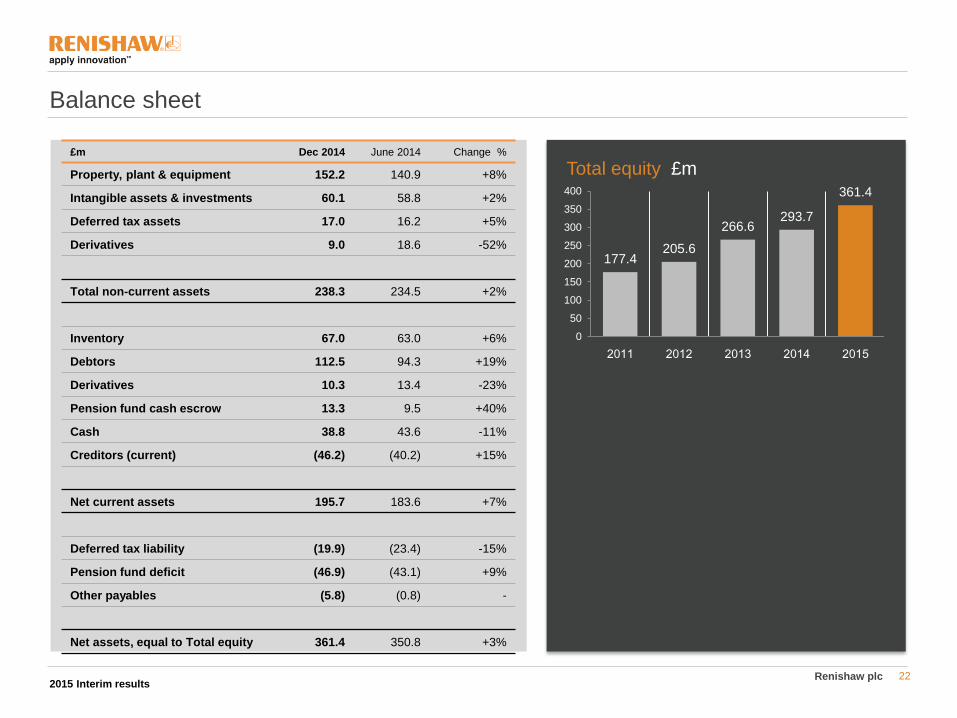
£m Dec 2014 June 2014 Change %
Property, plant & equipment 152.2 140.9 +8%
Intangible assets & investments 60.1 58.8 +2%
Deferred tax assets 17.0 16.2 +5%
Derivatives 9.0 18.6 -52%
Total non-current assets 238.3 234.5 +2%
Inventory 67.0 63.0 +6%
Debtors 112.5 94.3 +19%
Derivatives 10.3 13.4 -23%
Pension fund cash escrow 13.3 9.5 +40%
Cash 38.8 43.6 -11%
Creditors (current) (46.2) (40.2) +15%
Net current assets 195.7 183.6 +7%
Deferred tax liability (19.9) (23.4) -15%
Pension fund deficit (46.9) (43.1) +9%
Other payables (5.8) (0.8) -
Net assets, equal to Total equity 361.4 350.8 +3%
Balance sheet
177.4205.6
266.6293.7
361.4
0
50
100
150
200
250
300
350
400
2011 2012 2013 2014 2015
Total equity £m
2015 Interim results
Renishaw plc 23
2015
£m
2014
£m
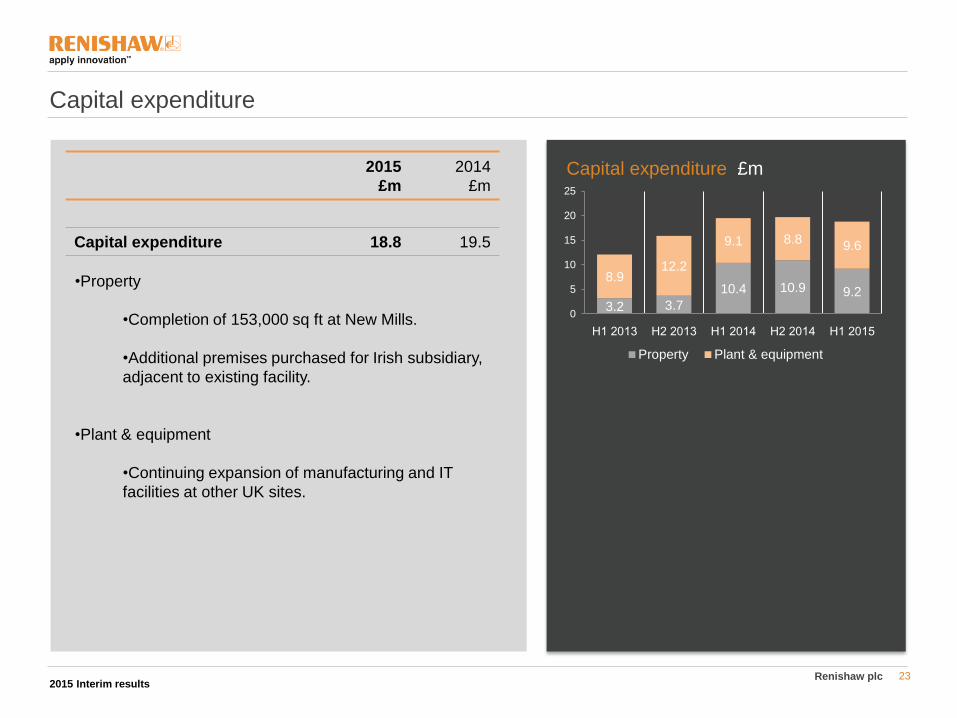
Capital expenditure 18.8 19.5
Capital expenditure
3.2 3.7
10.4 10.9 9.28.9
12.2
9.1 8.89.6
0
5
10
15
20
25
H1 2013 H2 2013 H1 2014 H2 2014 H1 2015
Capital expenditure £m
Property Plant & equipment
•Property
•Completion of 153,000 sq ft at New Mills.
•Additional premises purchased for Irish subsidiary,
adjacent to existing facility.
•Plant & equipment
•Continuing expansion of manufacturing and IT
facilities at other UK sites.
2015 Interim results
Renishaw plc 24
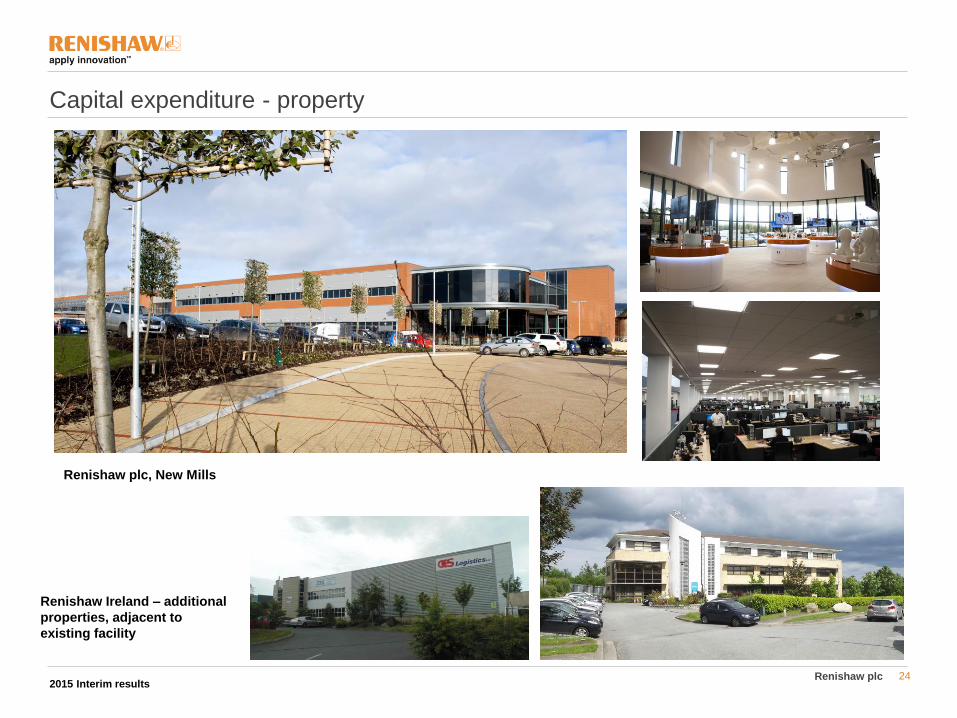
Capital expenditure - property
2015 Interim results
Renishaw plc, New Mills
Renishaw Ireland – additional
properties, adjacent to
existing facility
Renishaw plc 25
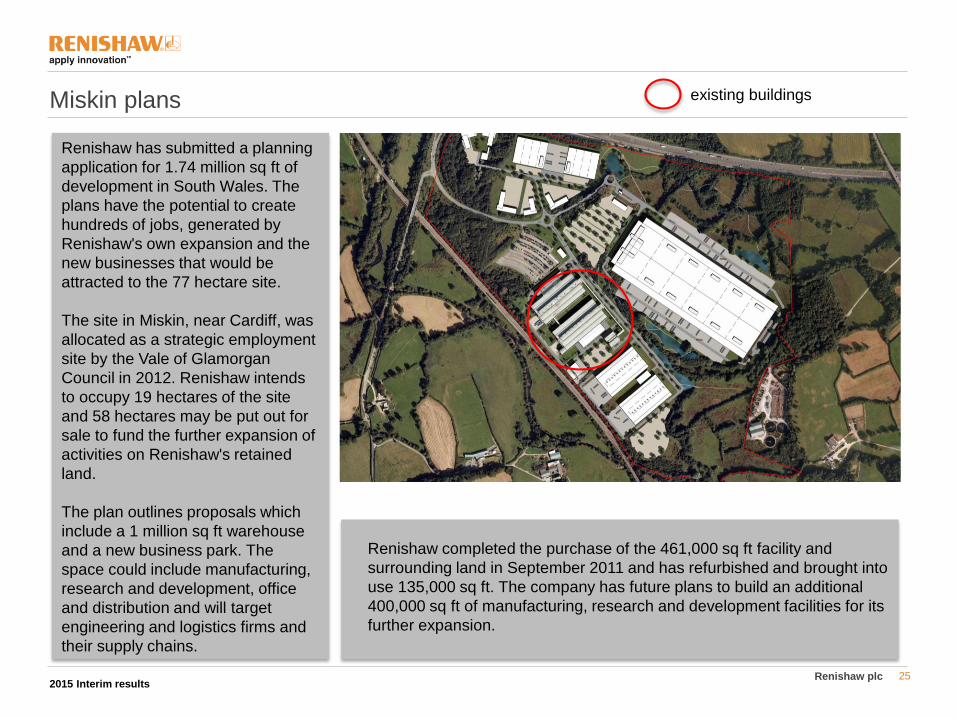
Miskin plans
Renishaw has submitted a planning
application for 1.74 million sq ft of
development in South Wales. The
plans have the potential to create
hundreds of jobs, generated by
Renishaw's own expansion and the
new businesses that would be
attracted to the 77 hectare site.
The site in Miskin, near Cardiff, was
allocated as a strategic employment
site by the Vale of Glamorgan
Council in 2012. Renishaw intends
to occupy 19 hectares of the site
and 58 hectares may be put out for
sale to fund the further expansion of
activities on Renishaw's retained
land.
The plan outlines proposals which
include a 1 million sq ft warehouse
and a new business park. The
space could include manufacturing,
research and development, office
and distribution and will target
engineering and logistics firms and
their supply chains.
Renishaw completed the purchase of the 461,000 sq ft facility and
surrounding land in September 2011 and has refurbished and brought into
use 135,000 sq ft. The company has future plans to build an additional
400,000 sq ft of manufacturing, research and development facilities for its
further expansion.
2015 Interim results
existing buildings
Renishaw plc 26
Outlook
We have experienced a strong first half year and, as we indicated in our
last trading statement, the trend in revenue growth is expected to
continue into the second half of this financial year. We currently
anticipate full year revenue to be in the range of £480m to £510m and
profit before tax to be in the range of £130m to £150m. Research and
development continues at a strong pace and a number of additional
products will be introduced this year. Furthermore, we are expanding
our sales and marketing activities throughout the Group. We remain
confident of the Group's prospects for both this year and the future.
2015 Interim results