Embed Size (px)
Citation preview
qlirogroup.com
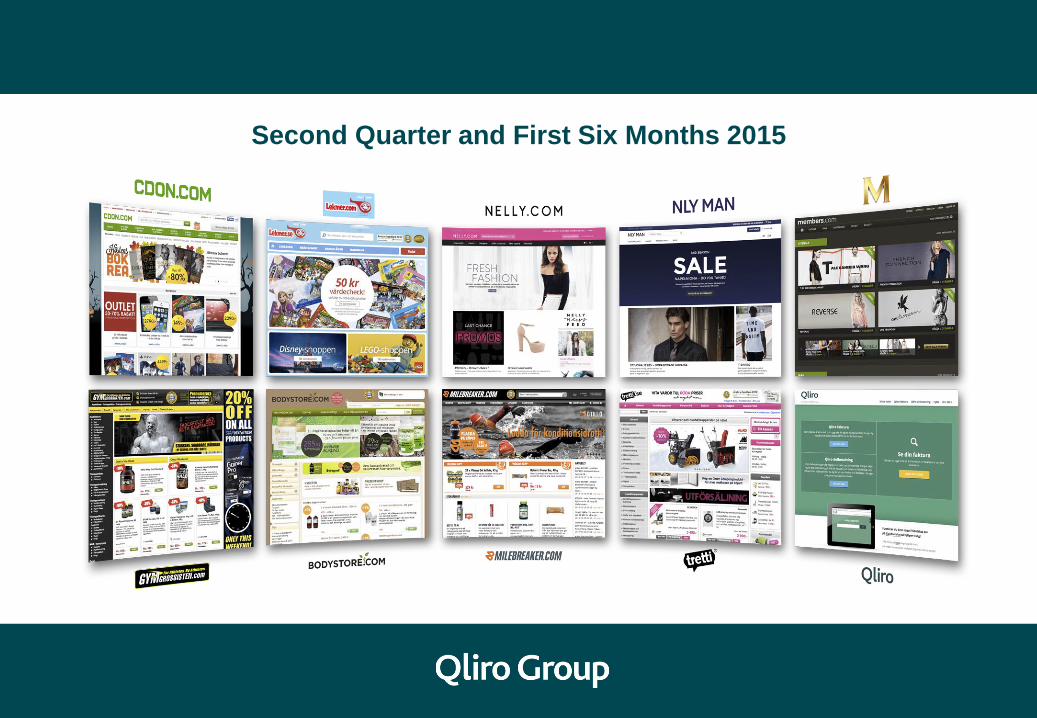
Second Quarter and First Six Months 2015
qlirogroup.com 2
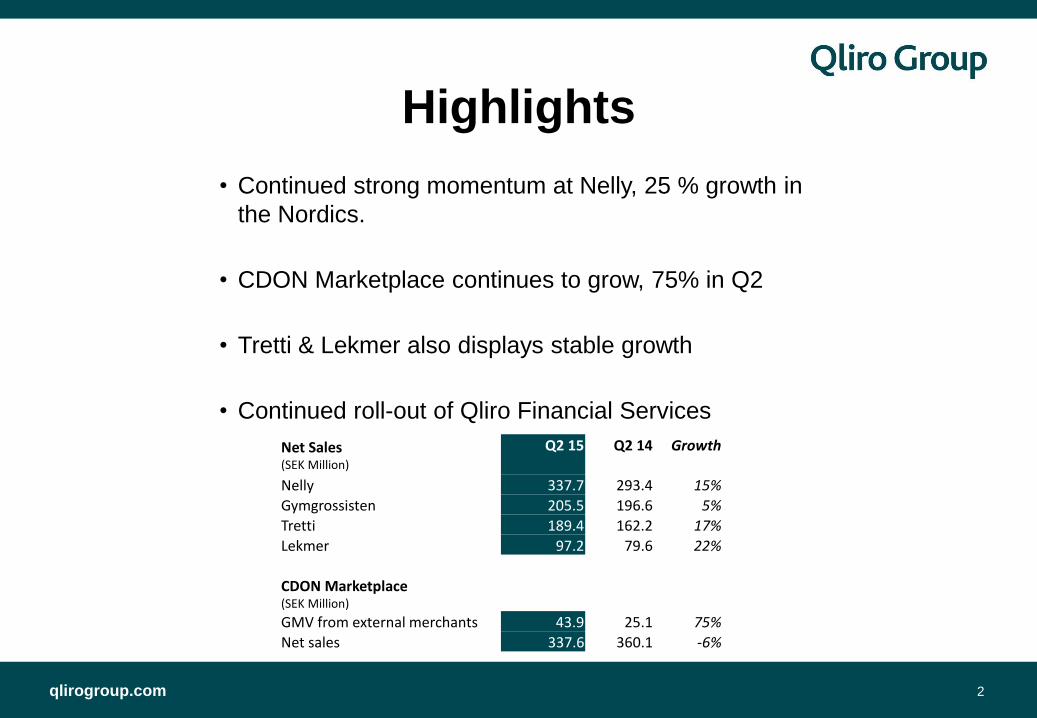
Highlights
• Continued strong momentum at Nelly, 25 % growth in
the Nordics.
• CDON Marketplace continues to grow, 75% in Q2
• Tretti & Lekmer also displays stable growth
• Continued roll-out of Qliro Financial Services
Net Sales (SEK Million)
Q2 15 Q2 14 Growth
Nelly 337.7 293.4 15%
Gymgrossisten 205.5 196.6 5%
Tretti 189.4 162.2 17%
Lekmer 97.2 79.6 22%
CDON Marketplace (SEK Million)
GMV from external merchants 43.9 25.1 75%
Net sales 337.6 360.1 -6%
qlirogroup.com 3
BUSINESS SEGMENTS
Q2 -15 vs Q2 -14
qlirogroup.com
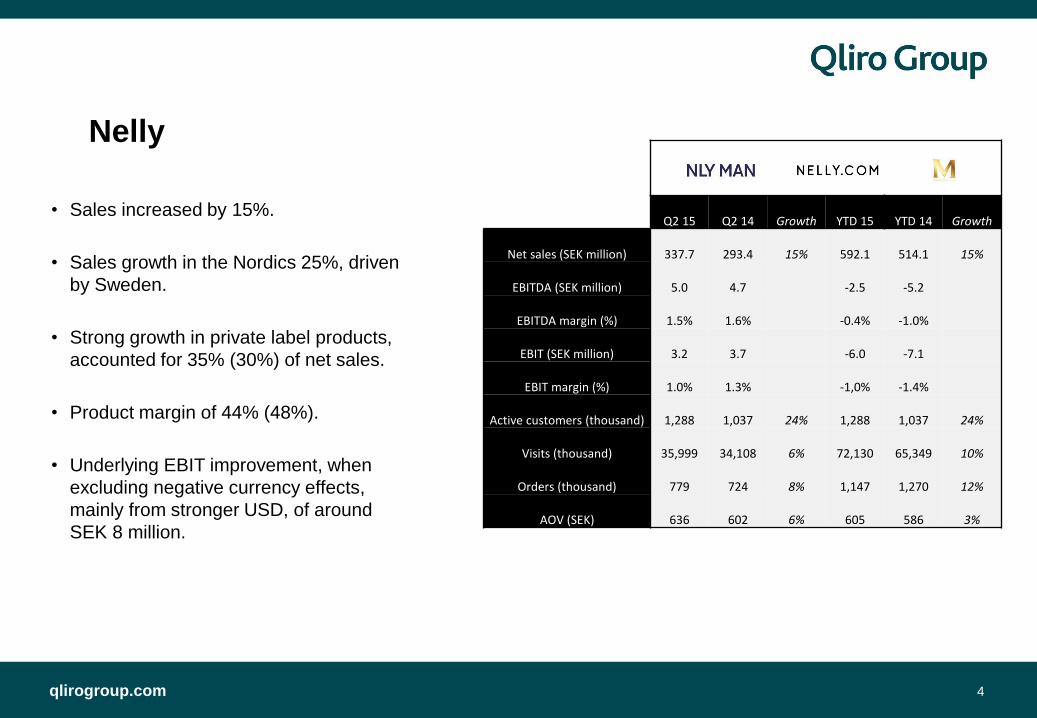
Q2 15 Q2 14 Growth YTD 15 YTD 14 Growth
Net sales (SEK million) 337.7 293.4 15% 592.1 514.1 15%
EBITDA (SEK million) 5.0 4.7 -2.5 -5.2
EBITDA margin (%) 1.5% 1.6% -0.4% -1.0%
EBIT (SEK million) 3.2 3.7 -6.0 -7.1
EBIT margin (%) 1.0% 1.3% -1,0% -1.4%
Active customers (thousand) 1,288 1,037 24% 1,288 1,037 24%
Visits (thousand) 35,999 34,108 6% 72,130 65,349 10%
Orders (thousand) 779 724 8% 1,147 1,270 12%
AOV (SEK) 636 602 6% 605 586 3%
4
Nelly
• Sales increased by 15%.
• Sales growth in the Nordics 25%, driven
by Sweden.
• Strong growth in private label products,
accounted for 35% (30%) of net sales.
• Product margin of 44% (48%).
• Underlying EBIT improvement, when
excluding negative currency effects,
mainly from stronger USD, of around
SEK 8 million.
qlirogroup.com
Q2 15 Q2 14 Growth YTD 15 YTD 14 Growth
Gross Merchandise Value, external merchants 43.9 25.1 75% 86.9 48.6 79%
Total Gross Merchandise Value 378.2 384.0 -1% 840.8 843.0 0%
Net sales (SEK million) 337.6 360.1 -6% 760.1 796.6 -5%
EBITDA (SEK million) -3.8 -7.1 -0.9 -5.2
EBITDA margin (%) -1.1% -2.0% -0.1% -0.7%
EBIT (SEK million) -5.8 -9.0 -5.0 -8.9
EBIT margin (%) -1.7% -2.5% -0.7% -1.1%
Active customers (thousand) 1,732 1,730 0% 1,732 1,730 0%
Visits (thousand) 16,613 16,603 0% 36,700 37,144 -1%
Orders (thousand) 652 692 -6% 1,488 1,561 -5%
AOV (SEK) 583 551 6% 556 536 6%
5
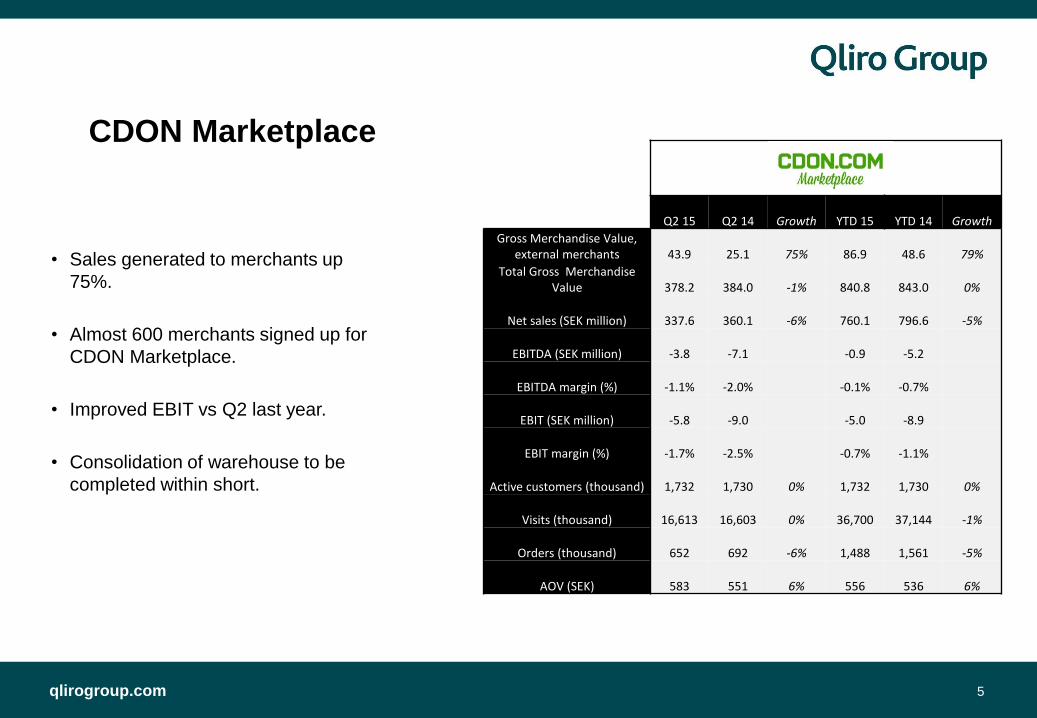
CDON Marketplace
• Sales generated to merchants up
75%.
• Almost 600 merchants signed up for
CDON Marketplace.
• Improved EBIT vs Q2 last year.
• Consolidation of warehouse to be
completed within short.
qlirogroup.com
Q2 15 Q2 14 Growth YTD 15 YTD 14 Growth
Net sales (SEK million) 205.5 196.6 5% 451.4 427.3 6%
EBITDA (SEK million) 11.3 14.8 31.1 37.2
EBITDA margin (%) 5.5% 7.5% 6.9% 8.7%
EBIT (SEK million) 10.6 14.0 29.6 35.6
EBIT margin (%) 5.1% 7.1% 6.5% 8.3%
Active customers (thousand) 517 488 6% 517 488 6%
Visits (thousand) 6,062 4,446 36% 12,571 10,626 18%
Orders (thousand) 280 249 13% 612 549 11%
AOV (SEK) 738 793 -7% 743 785 -5%
6
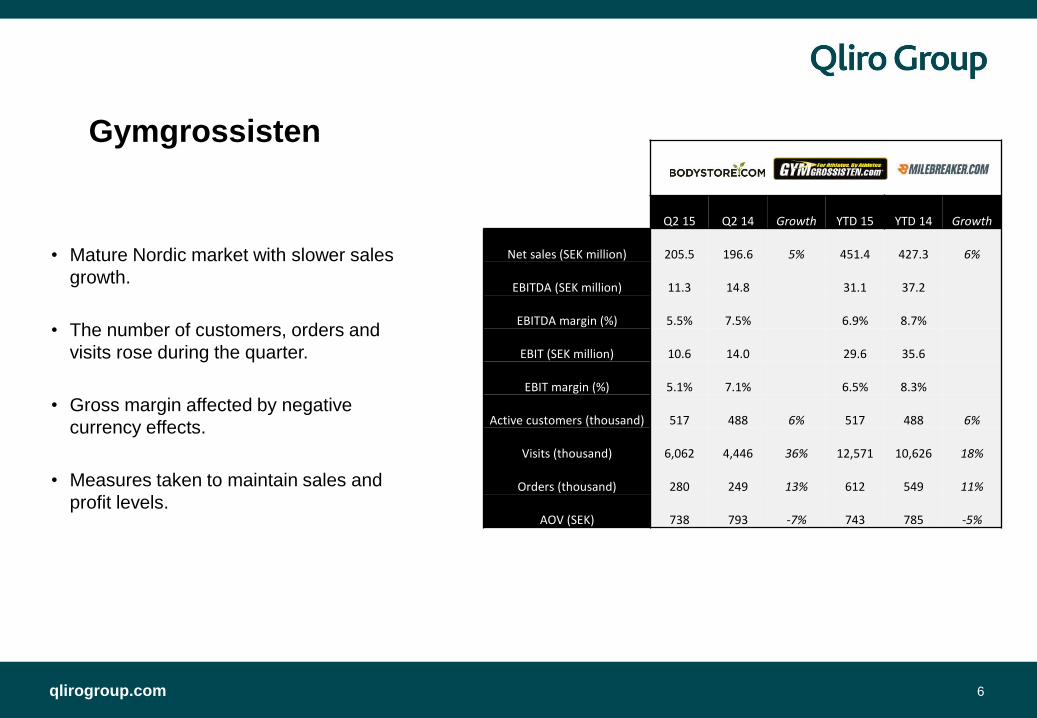
Gymgrossisten
• Mature Nordic market with slower sales
growth.
• The number of customers, orders and
visits rose during the quarter.
• Gross margin affected by negative
currency effects.
• Measures taken to maintain sales and
profit levels.
qlirogroup.com
Q2 15 Q2 14 Growth YTD 15 YTD 14 Growth
Net sales (SEK million) 189.4 162.2 17% 364.4 314.8 16%
EBITDA (SEK million) 1.0 1.6 2.6 2.7
EBITDA margin (%) 0.5% 1.0% 0.7% 0.9%
EBIT (SEK million) 0.1 0.9 1.0 1.1
EBIT margin (%) 0.1% 0.5% 0.3% 0.4%
Active customers (thousand) 291 230 26% 291 230 26%
Visits (thousand) 3,143 2,922 8% 6,991 5,735 22%
Orders (thousand) 82 75 9% 165 150 9%
AOV (SEK) 2,353 2,244 5% 2,279 2,183 4%
7
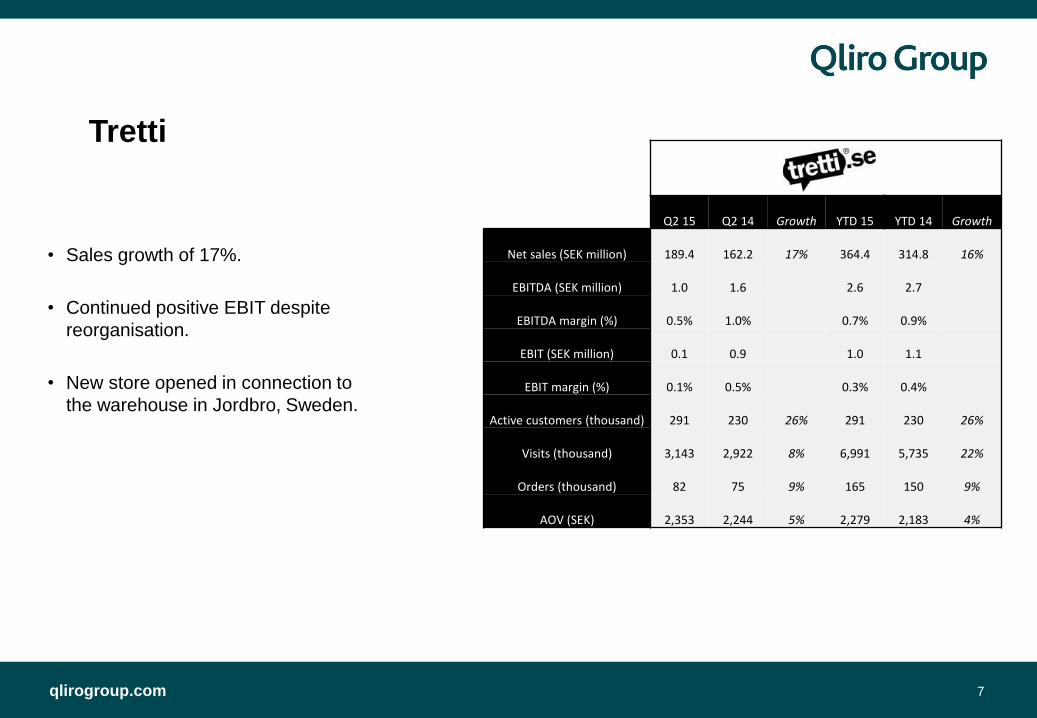
• Sales growth of 17%.
• Continued positive EBIT despite
reorganisation.
• New store opened in connection to
the warehouse in Jordbro, Sweden.
Tretti
qlirogroup.com
Q2 15 Q2 14 Growth YTD 15 YTD 14 Growth
Net sales (SEK million) 97.2 79.6 22% 192.1 145.1 32%
EBITDA (SEK million) -2.5 -2.5 -5.9 -7.4
EBITDA margin (%) -2.5% -3.2% -3.1% -5.1%
EBIT (SEK million) -2.8 -3.0 -6.7 -8.2
EBIT margin (%) -2.9% -3.7% -3.5% -5.6%
Active customers (thousand) 435 337 29% 435 337 29%
Visits (thousand) 5,869 4,484 31% 12,005 8,976 34%
Orders (thousand) 170 130 31% 327 240 36%
AOV (SEK) 587 620 -5% 604 613 -1%
8
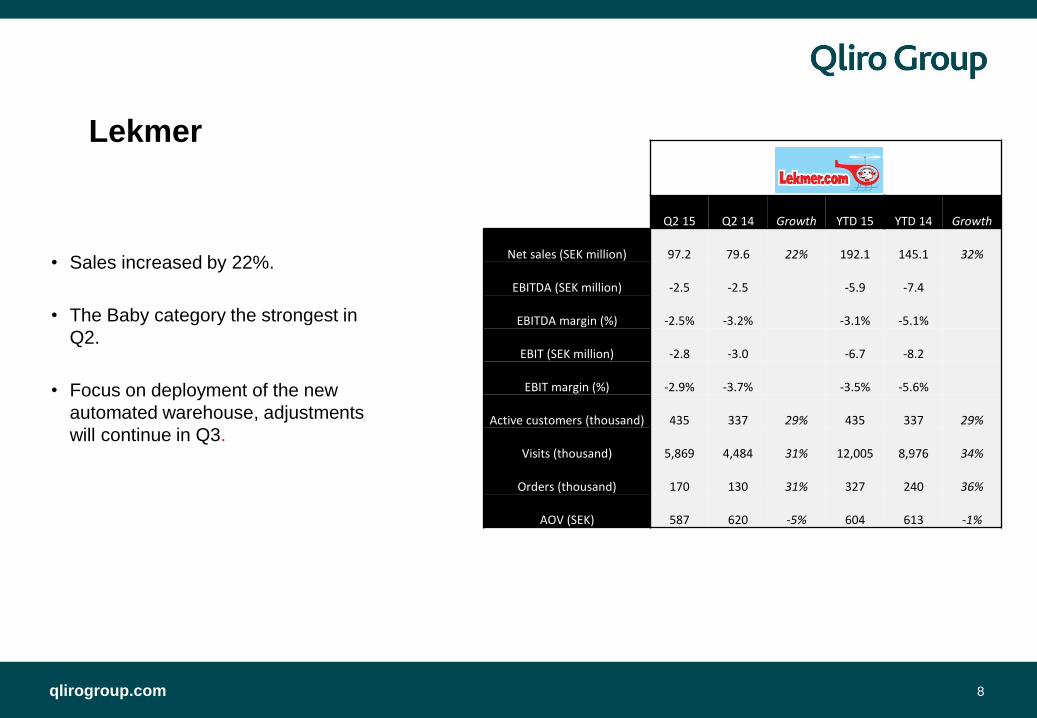
Lekmer
• Sales increased by 22%.
• The Baby category the strongest in
Q2.
• Focus on deployment of the new
automated warehouse, adjustments
will continue in Q3.
qlirogroup.com 9
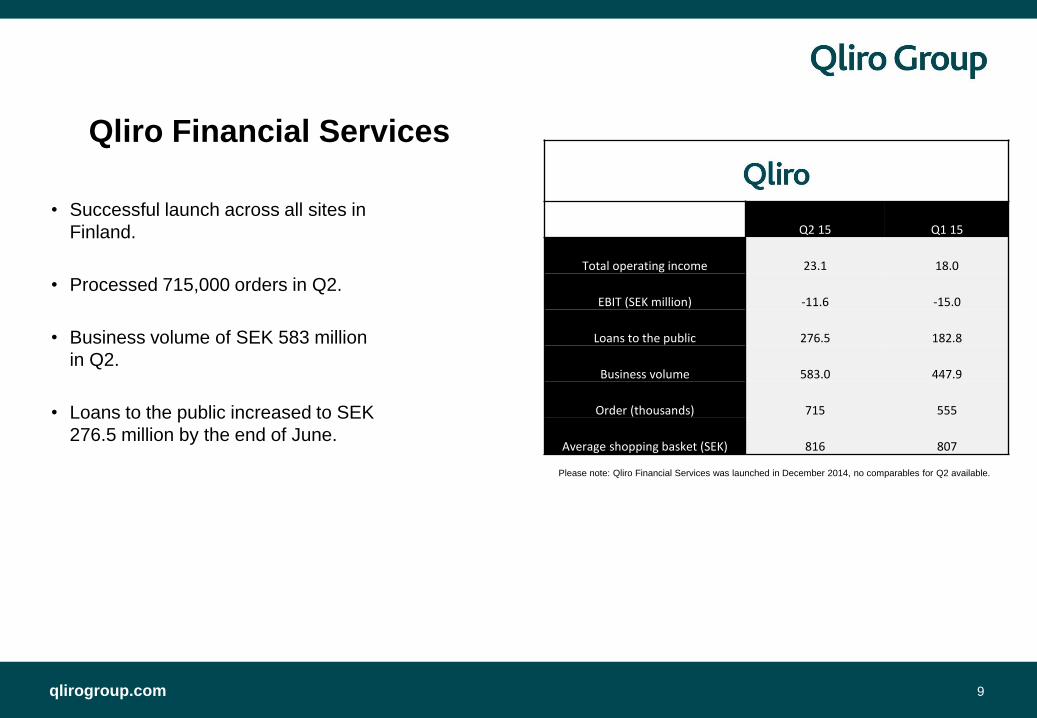
Qliro Financial Services
• Successful launch across all sites in
Finland.
• Processed 715,000 orders in Q2.
• Business volume of SEK 583 million
in Q2.
• Loans to the public increased to SEK
276.5 million by the end of June.
Please note: Qliro Financial Services was launched in December 2014, no comparables for Q2 available.
Q2 15 Q1 15
Total operating income 23.1 18.0
EBIT (SEK million) -11.6 -15.0
Loans to the public 276.5 182.8
Business volume 583.0 447.9
Order (thousands) 715 555
Average shopping basket (SEK) 816 807
qlirogroup.com 10
FINANCIALS
qlirogroup.com 11
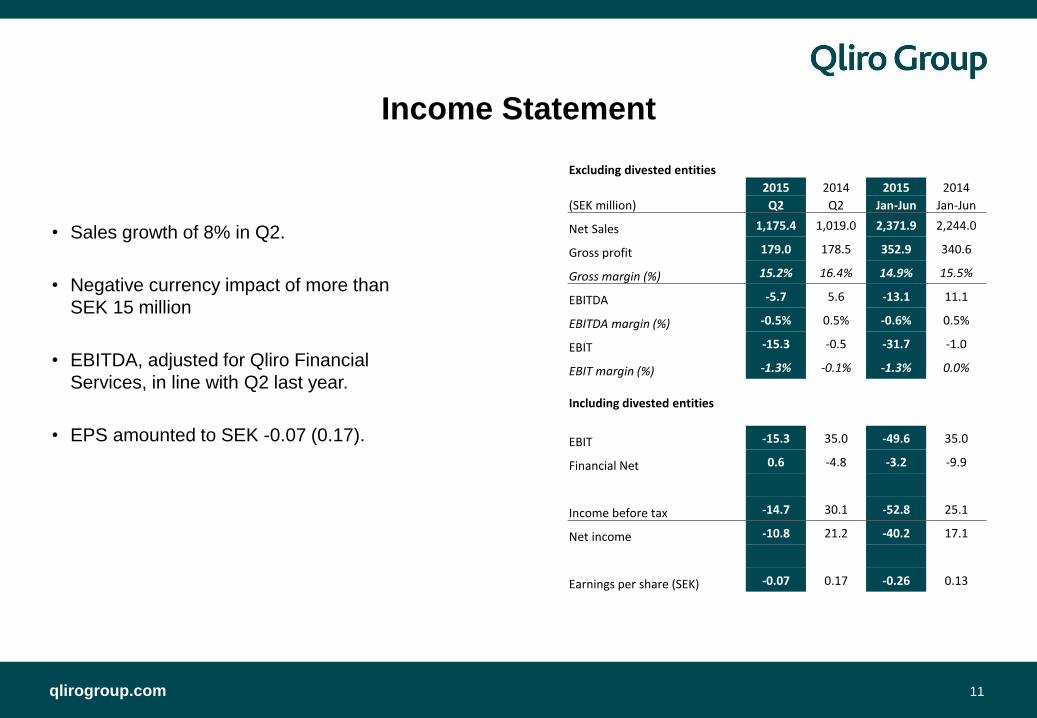
Income Statement
• Sales growth of 8% in Q2.
• Negative currency impact of more than
SEK 15 million
• EBITDA, adjusted for Qliro Financial
Services, in line with Q2 last year.
• EPS amounted to SEK -0.07 (0.17).
Excluding divested entities
2015 2014 2015 2014
(SEK million) Q2 Q2 Jan-Jun Jan-Jun
Net Sales 1,175.4 1,019.0 2,371.9 2,244.0
Gross profit 179.0 178.5 352.9 340.6
Gross margin (%) 15.2% 16.4% 14.9% 15.5%
EBITDA -5.7 5.6 -13.1 11.1
EBITDA margin (%) -0.5% 0.5% -0.6% 0.5%
EBIT -15.3 -0.5 -31.7 -1.0
EBIT margin (%) -1.3% -0.1% -1.3% 0.0%
Including divested entities
EBIT -15.3 35.0 -49.6 35.0
Financial Net 0.6 -4.8 -3.2 -9.9
Income before tax -14.7 30.1 -52.8 25.1
Net income -10.8 21.2 -40.2 17.1
Earnings per share (SEK) -0.07 0.17 -0.26 0.13
qlirogroup.com 12
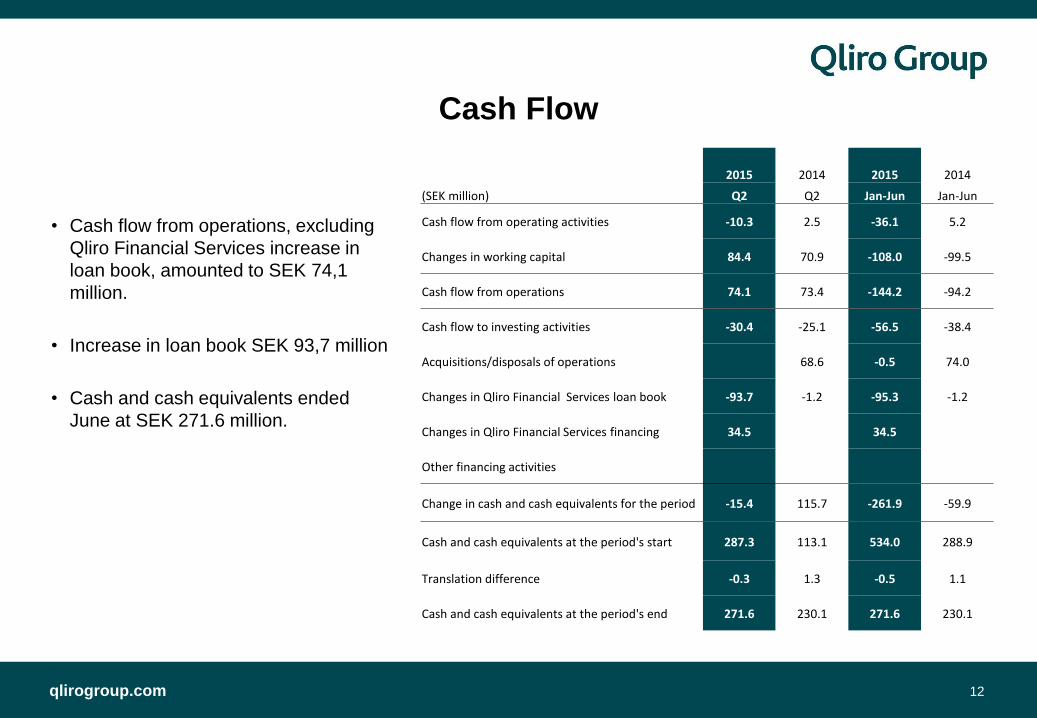
Cash Flow
• Cash flow from operations, excluding
Qliro Financial Services increase in
loan book, amounted to SEK 74,1
million.
• Increase in loan book SEK 93,7 million
• Cash and cash equivalents ended
June at SEK 271.6 million.
2015 2014 2015 2014
(SEK million) Q2 Q2 Jan-Jun Jan-Jun
Cash flow from operating activities -10.3 2.5 -36.1 5.2
Changes in working capital 84.4 70.9 -108.0 -99.5
Cash flow from operations 74.1 73.4 -144.2 -94.2
Cash flow to investing activities -30.4 -25.1 -56.5 -38.4
Acquisitions/disposals of operations 68.6 -0.5 74.0
Changes in Qliro Financial Services loan book -93.7 -1.2 -95.3 -1.2
Changes in Qliro Financial Services financing 34.5 34.5
Other financing activities
Change in cash and cash equivalents for the period -15.4 115.7 -261.9 -59.9
Cash and cash equivalents at the period's start 287.3 113.1 534.0 288.9
Translation difference -0.3 1.3 -0.5 1.1
Cash and cash equivalents at the period's end 271.6 230.1 271.6 230.1
qlirogroup.com 13
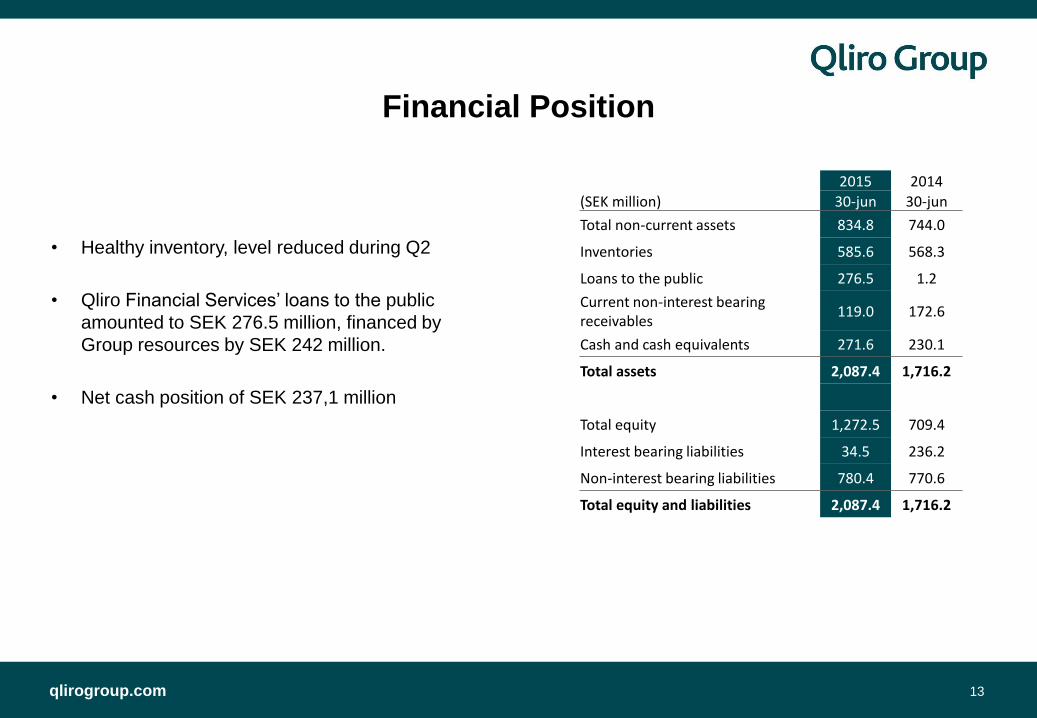
Financial Position
• Healthy inventory, level reduced during Q2
• Qliro Financial Services’ loans to the public
amounted to SEK 276.5 million, financed by
Group resources by SEK 242 million.
• Net cash position of SEK 237,1 million
2015 2014
(SEK million) 30-jun 30-jun
Total non-current assets 834.8 744.0
Inventories 585.6 568.3
Loans to the public 276.5 1.2
Current non-interest bearing receivables
119.0 172.6
Cash and cash equivalents 271.6 230.1
Total assets 2,087.4 1,716.2
Total equity 1,272.5 709.4
Interest bearing liabilities 34.5 236.2
Non-interest bearing liabilities 780.4 770.6
Total equity and liabilities 2,087.4 1,716.2
qlirogroup.com
Forward looking statement
14
• Increased focus of market related investments in the Nordics.
• Long-term goal for sales growth is growth that is in line with or above that of the market for
each segment.
• Qliro Financial Services will gradually improve its earnings in 2015.
• Qliro Financial Services is expected to generate positive earnings for the full year 2016 and
contribute approximately SEK 100 million for the full year 2018.
qlirogroup.com
Thank you!
Next report: 21st October 2015
follow us on twitter @qlirogroup nasdaq symbol QLRO
Qliro Group AB (publ.) Box 195 25 SE-104 32 Stockholm +46 (0)10 703 20 00 [email protected]