Embed Size (px)
Citation preview
1
NEWS CONTACT: Tom Marder (301) 380-2553 [email protected] MARRIOTT INTERNATIONAL REPORTS THIRD QUARTER RESULTS BETHESDA, MD – October 8, 2009 – Marriott International, Inc. (“Marriott”) (NYSE:MAR)
today reported third quarter 2009 adjusted income from continuing operations attributable to
Marriott of $53 million, a 57 percent decline over the year-ago quarter, and adjusted diluted
earnings per share (“EPS”) from continuing operations attributable to Marriott shareholders of
$0.15, down 55 percent. The company’s EPS guidance for the 2009 third quarter, disclosed on
July 16, 2009, totaled $0.09 to $0.14.
The reported loss from continuing operations attributable to Marriott was $466 million in the
third quarter of 2009 compared to reported income from continuing operations attributable to
Marriott of $94 million in the year-ago quarter. Reported diluted losses per share from
continuing operations attributable to Marriott shareholders was $1.31 in the third quarter of 2009
compared to diluted EPS from continuing operations attributable to Marriott shareholders of
$0.25 in the third quarter of 2008.
Adjusted results for the 2009 third quarter exclude $752 million pretax ($502 million after-tax
and $1.41 per diluted share) of impairment charges, which Marriott previously disclosed, related
to the timeshare segment. See the table on page A-14 of the accompanying schedules for the
detail of these impairment charges and their placement on the Consolidated Statements of
Income.
Adjusted results for the 2009 third quarter also exclude $8 million pretax ($4 million after-tax
and $0.01 per diluted share) of restructuring costs and other charges. Restructuring costs totaled
$9 million pretax and primarily included severance costs and timeshare facilities exit costs.
Other charges totaled $1 million of pretax earnings and primarily reflect the $3 million favorable
impact of the revaluation of residual interests from prior timeshare note sales due to three default

2
triggers curing in the quarter, partially offset by $2 million of reserves for guarantees and
contract cancellations. Of the total restructuring costs and other charges in the third quarter, cash
payments are expected to be $5 million. See the table on page A-13 of the accompanying
schedules for the detail of these restructuring costs and other charges and their placement on the
Consolidated Statements of Income.
Finally, adjusted results for the 2009 third quarter also exclude a $13 million after-tax non-cash
charge ($0.03 per diluted share) in the provision for income taxes primarily related to the
treatment of funds received from certain foreign subsidiaries that is in ongoing discussions with
the Internal Revenue Service. Adjusted results for the 2008 third quarter exclude a $29 million
after-tax non-cash charge ($0.08 per diluted share) in the provision for income taxes primarily
related to a 1994 tax planning transaction.
J.W. Marriott, Jr., chairman and chief executive officer of Marriott International, said, “Revenue
per available room across our North American system declined less than expected during the
third quarter as leisure travelers responded to attractive promotions and great values in our
hotels. With solid cost controls, our hotels translated better than expected occupancy rates to
stronger than expected fee revenue and earnings.
“The hotel industry has been challenged by the economic environment. We’ve worked hard to
rein in costs and right-size our businesses and those efforts are paying off. Our hotels are in
great shape; owners and customers prefer our brands; and we enjoy very strong market share
premiums. As we look ahead, while the recovery may be slow and perhaps uneven, our
continued focus on driving revenue, controlling costs and strengthening our balance sheet will
position us to benefit from an improving economy.”
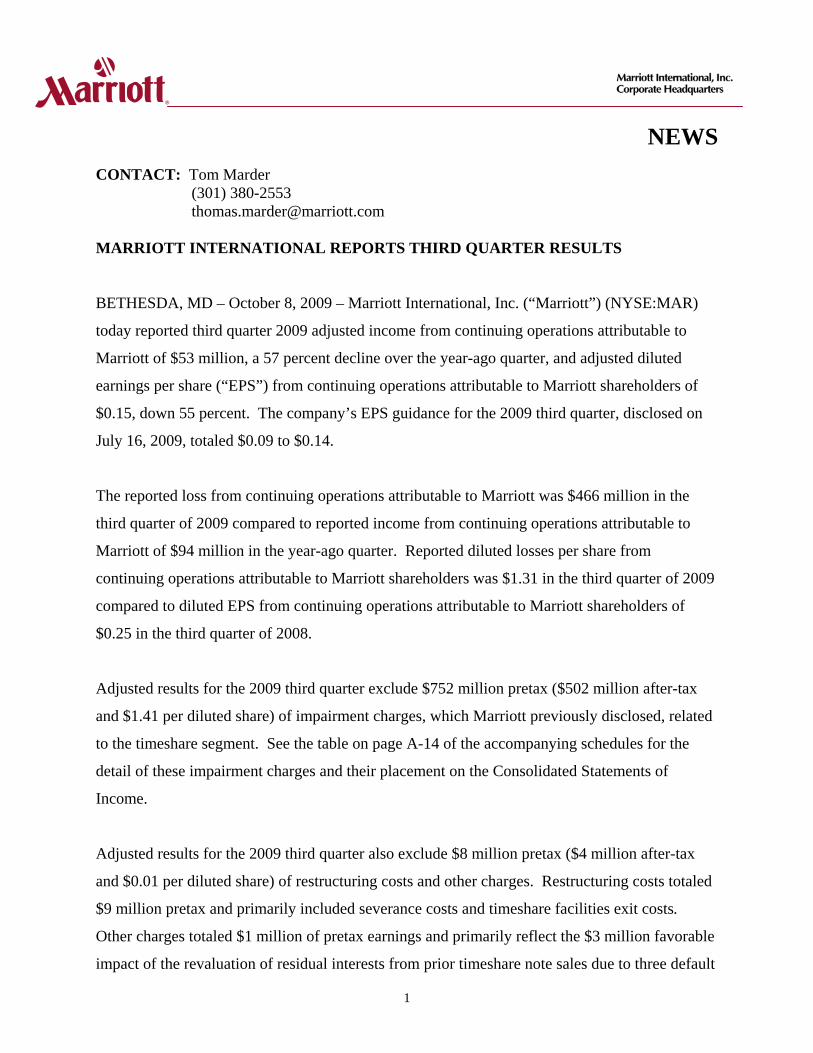
In the 2009 third quarter (12-week period from June 20, 2009 to September 11, 2009), REVPAR
for the company’s worldwide comparable company-operated properties declined 23.5 percent
(21.1 percent using constant dollars) and REVPAR for the company’s worldwide comparable
systemwide properties declined 21.4 percent (19.9 percent using constant dollars).
Markets outside North America were impacted by the difficult economic climate, the Olympics,
the timing of holidays and concerns about the H1N1 virus. International comparable company-

3
operated REVPAR declined 28.9 percent (22.3 percent using constant dollars), including a 22.7
percent decline in average daily rate (15.5 percent using constant dollars) in the third quarter of
2009.
In North America comparable company-operated REVPAR declined 20.6 percent and
comparable systemwide REVPAR declined 19.3 percent. REVPAR at the company’s
comparable company-operated North American full-service and luxury hotels (including
Marriott Hotels & Resorts, The Ritz-Carlton and Renaissance Hotels & Resorts) was down 20.2
percent driven by a 14.6 percent decline in average daily rate.
Marriott added 79 new properties (10,380 rooms) to its worldwide lodging portfolio in the 2009
third quarter, including over 8,600 North American limited-service rooms. Three properties (503
rooms) exited the system during the quarter. At quarter-end, the company’s lodging group
encompassed 3,362 properties and timeshare resorts for a total of over 586,000 rooms. As of the
end of the third quarter, the company’s worldwide pipeline of hotels under construction, awaiting
conversion or approved for development totaled approximately 105,000 rooms. The company
expects to open over 33,000 rooms in 2009.
Reported results for the 2009 third quarter, the adjusted results and the associated reconciliations
are shown on pages A-1, A-11, A-13, A-14 and A-17 of the accompanying schedules. The
following paragraphs reflect adjusted results where indicated.
MARRIOTT REVENUES totaled approximately $2.5 billion in the 2009 third quarter compared
to $3.0 billion for the third quarter of 2008. Base management and franchise fees declined 14
percent to $216 million reflecting worldwide declines in REVPAR in all brands offset in part by
fees from new hotels. With continued soft lodging demand trends worldwide, third quarter
incentive management fees declined 67 percent. The percentage of company-operated hotels
earning incentive management fees declined to 20 percent in the 2009 third quarter compared to
55 percent in the year-ago quarter. Year-to-date 25 percent of company-operated hotels earned
incentive management fees compared to 62 percent in the prior year. Nearly all incentive
management fees came from hotels outside of North America in the 2009 quarter compared to 68
percent in the 2008 quarter.

4
Worldwide comparable company-operated house profit margins declined 490 basis points in the
third quarter reflecting weak REVPAR offset by continued efficiency improvements at the
property level. House profit margins for comparable company-operated properties outside North
America declined 430 basis points. North American comparable company-operated house profit
margins declined 520 basis points from the year-ago quarter.
Owned, leased, corporate housing and other revenue, net of direct expenses, declined $8 million
in the 2009 third quarter, to $12 million, primarily reflecting weaker operating results at owned
and leased properties and lower corporate housing profits partially offset by a $6 million
transaction cancellation fee.
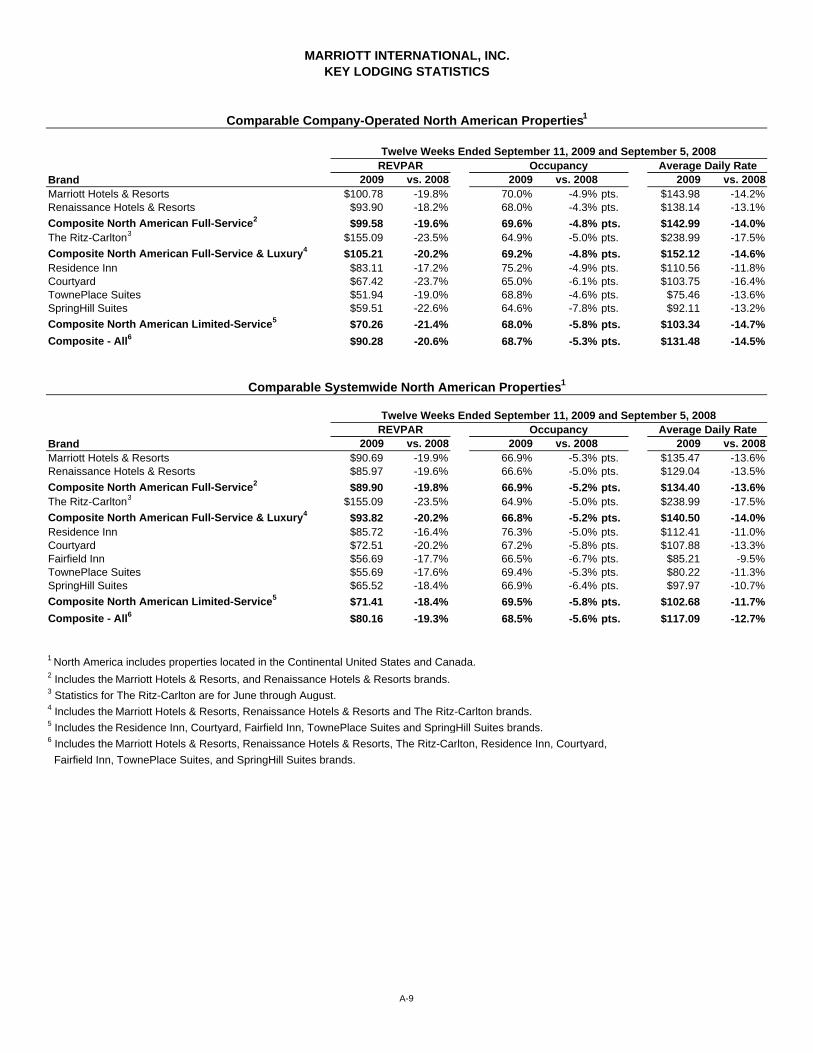
Third quarter adjusted Timeshare segment contract sales declined 42 percent to $176 million
excluding a $24 million allowance for fractional and residential contract cancellations recorded
in the quarter. Contract sales of core one-week timeshare intervals totaled $164 million as
marketing incentives encouraged demand.
In the third quarter of 2009, adjusted Timeshare sales and services revenue declined 35 percent
to $251 million and, net of expenses, declined to $13 million from $47 million in the 2008 third
quarter. Adjusted results reflected lower development profit due to continued soft demand for
timeshare, fractional, and residential products, and unfavorable reportability. Services profit was
also lower largely due to higher maintenance costs associated with unsold inventory and lower
rental rates.
Adjusted Timeshare segment results, which includes Timeshare sales and services revenue, net
of direct expenses, as well as base management fees, equity earnings, noncontrolling interest and
general, administrative and other expenses associated with the timeshare business, totaled $9
million in the 2009 third quarter compared to $49 million in the prior year quarter. The 2008
third quarter segment results reflected a net $10 million pretax impairment charge for a fractional
and residential consolidated joint venture project. The $10 million charge in 2008 included a
$22 million negative adjustment in timeshare direct expenses partially offset by a $12 million
pretax ($8 million after-tax) benefit associated with the joint venture partner’s share, which is
reflected in net losses attributable to noncontrolling interest, net of tax.

5
ADJUSTED GENERAL, ADMINISTRATIVE AND OTHER expenses for the 2009 third
quarter totaled $143 million, a 14 percent decline from the year-ago quarter largely reflecting
cost reductions throughout the organization. The quarter also included a $15 million unfavorable
impact associated with deferred compensation compared to the 2008 quarter (offset by a similar
decrease in the provision for taxes) and $5 million of certain litigation expenses. Excluding
these items, general, administrative and other expenses for the third quarter of 2009 declined 25
percent compared to the third quarter of 2008.
(LOSSES) GAINS AND OTHER INCOME totaled a loss of $1 million and included a $5
million impairment charge on an investment partially offset by $3 million of gains on the sale of
real estate and a $1 million gain on the extinguishment of debt. The prior year’s third quarter
gains totaled $7 million and included $2 million of gains on the sale of real estate, a $2 million
gain from the sale of the company’s interest in a joint venture and $3 million of returns from
joint venture investments.
INTEREST EXPENSE decreased $6 million in the third quarter primarily due to lower interest
rates on short-term borrowings and lower debt balances partially offset by lower capitalized
interest associated with construction projects.
ADJUSTED EQUITY IN (LOSSES) EARNINGS totaled an $11 million loss in the quarter
compared to $2 million in earnings in the year-ago quarter. Losses in the 2009 quarter primarily
reflected losses in four joint ventures and the impairment of one investment.
NET LOSSES ATTRIBUTABLE TO NONCONTROLLING INTERESTS, NET OF TAX
totaled $3 million in the quarter compared to $10 million in the year-ago quarter.
BALANCE SHEET
At the end of third quarter 2009, total debt was $2,660 million and cash balances totaled $130
million, compared to $3,095 million of debt and $134 million of cash at year-end 2008.
COMMON STOCK
Adjusted weighted average fully diluted shares outstanding totaled 366.3 million in the 2009
third quarter compared to 368.0 million in the year-ago quarter. The remaining share repurchase

6
authorization, as of September 11, 2009, totaled 21.3 million shares. No share repurchases are
planned in 2009.
On August 6, 2009, the Board of Directors declared the issuance of a stock dividend payable on
September 3, 2009, to shareholders of record on August 20, 2009. For periods prior to the stock
dividend, all share and per share data in our condensed consolidated financial statements and
related notes have been retroactively adjusted to reflect the stock dividend.
FOURTH QUARTER 2009 OUTLOOK
While Marriott typically provides a range of guidance for future performance, the current global
economic and financial climate continues to make predictions very difficult. Therefore, the
company is unable to give its typical guidance. Instead, the company is providing the following
assumptions which it is using for internal planning purposes. For the fourth quarter, the
company assumes North American comparable systemwide hotel REVPAR declines of 13 to 16
percent. For comparable systemwide hotels outside North America, the company assumes
REVPAR declines of 16 to 18 percent on a constant dollar basis. Total fee revenue could be
$310 million to $320 million. Owned, leased, corporate housing and other revenue, net of direct
expenses, could total $15 to $20 million.
In the fourth quarter, the company assumes Timeshare sales and services revenue, net of direct
expenses, will total approximately $15 million, including a note sale gain of approximately $10
million to $15 million. Fourth quarter Timeshare contract sales could total $185 million to $195
million.
The company anticipates that general, administrative and other expenses will total about $185
million to $190 million in the fourth quarter of 2009, a roughly 20 percent decline from the
adjusted 2008 fourth quarter amount.
Based upon the above assumptions and a 38 percent tax rate, adjusted diluted EPS from
continuing operations attributable to Marriott shareholders for the 2009 fourth quarter could total
$0.20 to $0.23.

7
The company expects investment spending in 2009 will decline by more than 50 percent from
2008 levels to approximately $325 million to $375 million. This investment spending estimate
includes $145 million to $155 million for capital expenditures and maintenance capital spending,
$20 million to $30 million for net timeshare development, $90 million to $100 million in new
mezzanine financing and mortgage loans, $35 million to $45 million for contract acquisition
costs and $35 million to $45 million in equity and other investments (including timeshare equity
investments).
2010 OUTLOOK
As in 2009, the company is unable to provide its typical guidance for 2010. Instead, Marriott is
providing the following assumptions, which it is using for internal planning purposes. For the
full year 2010, the company expects the business climate, particularly the pricing environment,
to remain difficult. For worldwide comparable systemwide hotels, the company assumes full
year 2010 REVPAR will be flat to down 5 percent (on a constant dollar basis) with performance
strengthening over the year. The company expects REVPAR in international markets to show
greater relative year over year strength than North American markets.
The company expects to open 25,000 to 30,000 rooms in 2010 as most hotels expected to open
are already under construction or undergoing conversion from other brands. Given these
assumptions, full year 2010 fee revenue could total $1,050 million to $1,110 million. The
company estimates that, on a full-year basis, one point of worldwide systemwide REVPAR
impacts total fees by approximately $10 million to $15 million pretax.
For its timeshare business, the company assumes 2010 timeshare contract sales could be in line
with 2009 levels.
The company expects to adopt FAS 166 and 167 at the beginning of 2010, which will impact its
accounting for securitized timeshare loans. Assuming the consolidation of the existing portfolio
of securitized loans, the company expects assets to increase by $950 million to $1,025 million,
liabilities to increase by $1,020 million to $1,120 million, and shareholders’ equity to decline by
$70 million to $95 million. Pretax earnings in 2010 would increase by $30 million to $50
million as a result of the accounting change, but no change in cash flow is anticipated.

8
The company expects its 2010 general and administrative costs to be modestly higher than in
2009. As part of its ongoing budget process, the company continues to evaluate its timeshare
earnings outlook and investment spending estimates for 2010. Based on its preliminary outlook
for 2010, excluding the impact of FAS 166 and 167, the company anticipates continued
meaningful reductions in debt levels in 2010.
Marriott International, Inc. (NYSE:MAR) will conduct its quarterly earnings review for the
investment community and news media on Thursday, October 8, 2009 at 10 a.m. Eastern Time
(ET). The conference call will be webcast simultaneously via Marriott’s investor relations
website at http://www.marriott.com/investor, click the “Recent and Upcoming Events” tab and
click on the quarterly conference call link. A replay will be available at that same website until
October 8, 2010. The webcast will also be available as a podcast from the same site.
The telephone dial-in number for the conference call is 719-325-4808. A telephone replay of the
conference call will be available from 1 p.m. ET, Thursday, October 8, 2009 until 8 p.m. ET,
Thursday, October 15, 2009. To access the replay, call 719-457-0820. The reservation number
for the recording is 5860348.
Note: This press release and accompanying schedules contain “forward-looking statements” within the meaning of federal securities laws, including REVPAR, profit margin and earnings trends, estimates and assumptions; statements concerning the number of lodging properties we expect to add in the future; our expected cost savings, investment spending and share repurchases; and similar statements concerning anticipated future events and expectations that are not historical facts. We caution you that these statements are not guarantees of future performance and are subject to numerous risks and uncertainties, including the depth and duration of the current recession; supply and demand changes for hotel rooms, vacation ownership, condominiums, and corporate housing; competitive conditions in the lodging industry; relationships with clients and property owners; the availability of capital to finance hotel growth and refurbishment; and other risk factors identified in our most recent quarterly report on Form 10-Q; any of which could cause actual results to differ materially from those expressed in or implied by the statements herein. These statements are made as of the date of this press release, and we undertake no obligation to publicly update or revise any forward-looking statement, whether as a result of new information, future events or otherwise.

9
MARRIOTT INTERNATIONAL, INC. (NYSE:MAR) is a leading lodging company with more than 3,300 lodging properties in 68 countries and territories. Marriott International operates and franchises hotels under the Marriott, JW Marriott, The Ritz-Carlton, Renaissance, Residence Inn, Courtyard, TownePlace Suites, Fairfield Inn, SpringHill Suites and Bulgari brand names; develops and operates vacation ownership resorts under the Marriott Vacation Club, The Ritz-Carlton Destination Club, The Ritz-Carlton Residences and Grand Residences by Marriott brands; operates Marriott Executive Apartments; provides furnished corporate housing through its Marriott ExecuStay division; and operates conference centers. The company is headquartered in Bethesda, Maryland, USA and had approximately 146,000 employees at 2008 year-end. It is recognized by BusinessWeek as one of the 100 best global brands, by FORTUNE® as one of the best companies to work for, and by the U.S. Environmental Protection Agency (EPA) as Partner of the Year since 2004. In fiscal year 2008, Marriott International reported sales from continuing operations of nearly $13 billion. For more information or reservations, please visit our web site at www.marriott.com. For an interactive online version of Marriott's 2008 Annual Report, which includes a short video message from Chairman and CEO J.W. Marriott, Jr., visit www.marriott.com/investor.
IRPR#1
Tables follow

Adjustments
As Reported12 Weeks
EndedSeptember 11,
2009
Restructuring Costs
& Other Charges6
Timeshare Strategy -
Impairment Charges5,10
CertainTax Items
As Adjusted12 Weeks
EndedSeptember 11,
2009**
As Reported12 Weeks
EndedSeptember 5,
2008Certain
Tax Items
As Adjusted12 Weeks
EndedSeptember 5,
2008**
PercentBetter/(Worse) Adjusted 2009
vs.Adjusted 2008
REVENUESBase management fees 116$ -$ -$ -$ 116$ 143$ -$ 143$ (19) Franchise fees 100 - - - 100 108 - 108 (7) Incentive management fees 17 - - - 17 52 - 52 (67) Owned, leased, corporate housing and other revenue 1 226 - - - 226 260 - 260 (13) Timeshare sales and services 2 254 (3) - - 251 384 - 384 (35) Cost reimbursements 3 1,758 - - - 1,758 2,016 - 2,016 (13) Total Revenues 2,471 (3) - - 2,468 2,963 - 2,963 (17)
OPERATING COSTS AND EXPENSESOwned, leased and corporate housing - direct 4 214 - - - 214 240 - 240 11 Timeshare - direct 238 - - - 238 337 - 337 29 Timeshare strategy - impairment charges 5 614 - (614) - - - - - -Reimbursed costs 1,758 - - - 1,758 2,016 - 2,016 13 Restructuring costs 9 (9) - - - - - - -General, administrative and other 7 144 (1) - - 143 167 - 167 14 Total Expenses 2,977 (10) (614) - 2,353 2,760 - 2,760 15
OPERATING (LOSS) / INCOME (506) 7 614 - 115 203 - 203 (43)
(Losses) / gains and other income 8 (1) - - - (1) 7 - 7 (114) Interest expense (27) - - - (27) (33) - (33) 18 Interest income 5 - - - 5 8 - 8 (38) (Provision for) reversal of loan losses - - - - - - - - -Equity in (losses) earnings 9 (12) 1 - - (11) 2 - 2 (650) Timeshare strategy - impairment charges (non-operating) 10 (138) - 138 - - - - - -
(LOSS) / INCOME FROM CONTINUING OPERATIONS BEFORE INCOME TAXES (679) 8 752 - 81 187 - 187 (57)
Benefit / (Provision) for income taxes 210 (4) (250) 13 (31) (103) 29 (74) 58 (LOSS) / INCOME FROM CONTINUING OPERATIONS (469) 4 502 13 50 84 29 113 (56)
Discontinued operations - Synthetic Fuel, net of tax 11 - - - - - - - - -
NET (LOSS) / INCOME (469) 4 502 13 50 84 29 113 (56)
Add: Net losses attributable to noncontrolling interests, net of tax 3 - - - 3 10 - 10 (70)
NET (LOSS) / INCOME ATTRIBUTABLE TO MARRIOTT (466)$ 4$ 502$ 13$ 53$ 94$ 29$ 123$ (57)
(LOSSES) / EARNINGS PER SHARE - Basic (Losses) / earnings from continuing operations attributable to Marriott shareholders 12 (1.31)$ 0.01$ 1.41$ 0.03$ 0.15$ 0.27$ 0.08$ 0.35$ (57) Earnings from discontinued operations 11 - - - - - - - - - (Losses) / earnings per share attributable to Marriott shareholders 12 (1.31)$ 0.01$ 1.41$ 0.03$ 0.15$ 0.27$ 0.08$ 0.35$ (57)
(LOSSES) / EARNINGS PER SHARE - Diluted (Losses) / earnings from continuing operations attributable to Marriott shareholders 12 (1.31)$ 0.01$ 1.41$ 0.03$ 0.15$ 0.25$ 0.08$ 0.33$ (55) Earnings from discontinued operations 11 - - - - - - - - - (Losses) / earnings per share attributable to Marriott shareholders 12 (1.31)$ 0.01$ 1.41$ 0.03$ 0.15$ 0.25$ 0.08$ 0.33$ (55)
Basic Shares 13 355.5 355.5 355.5 355.5 355.5 353.8 353.8 353.8Diluted Shares 13,14 355.5 355.5 355.5 355.5 366.3 368.0 368.0 368.0
See page A-3 for footnote references.
MARRIOTT INTERNATIONAL, INC.CONSOLIDATED STATEMENTS OF INCOME
(in millions, except per share amounts)
Adjustments
A-1

Adjustments
As Reported36 Weeks
EndedSeptember 11,
2009
Restructuring Costs
& Other Charges6
Timeshare Strategy -
Impairment Charges5,10
CertainTax Items
As Adjusted36 Weeks
EndedSeptember 11,
2009**
As Reported36 Weeks
EndedSeptember 5,
2008Certain
Tax Items
As Adjusted36 Weeks
EndedSeptember 5,
2008**
PercentBetter/(Worse)
Adjusted 2009 vs.Adjusted 2008
REVENUESBase management fees 367$ -$ -$ -$ 367$ 452$ -$ 452$ (19) Franchise fees 281 - - - 281 314 - 314 (11) Incentive management fees 95 - - - 95 229 - 229 (59) Owned, leased, corporate housing and other revenue 1 684 - - - 684 849 - 849 (19) Timeshare sales and services 2 746 26 - - 772 1,098 - 1,098 (30) Cost reimbursements 3 5,355 - - - 5,355 6,153 - 6,153 (13) Total Revenues 7,528 26 - - 7,554 9,095 - 9,095 (17)
OPERATING COSTS AND EXPENSESOwned, leased and corporate housing - direct 4 638 - - - 638 757 - 757 16 Timeshare - direct 737 1 - - 738 961 - 961 23 Timeshare strategy - impairment charges 5 614 - (614) - - - - - -Reimbursed costs 5,355 - - - 5,355 6,153 - 6,153 13 Restructuring costs 44 (44) - - - - - - -General, administrative and other 7 464 (49) - - 415 513 - 513 19 Total Expenses 7,852 (92) (614) - 7,146 8,384 - 8,384 15
OPERATING (LOSS) / INCOME (324) 118 614 - 408 711 - 711 (43)
Gains and other income 8 27 - - - 27 19 - 19 42 Interest expense (84) - - - (84) (113) - (113) 26 Interest income 20 - - - 20 28 - 28 (29) (Provision for) reversal of loan losses (43) 43 - - - 2 - 2 (100) Equity in (losses) earnings 9 (50) 33 - - (17) 26 - 26 (165) Timeshare strategy - impairment charges (non-operating) 10 (138) - 138 - - - - - -
(LOSS) / INCOME FROM CONTINUING OPERATIONS BEFORE INCOME TAXES (592) 194 752 - 354 673 - 673 (47)
Benefit / (Provision) for income taxes 133 (76) (250) 56 (137) (317) 65 (252) 46 (LOSS) / INCOME FROM CONTINUING OPERATIONS (459) 118 502 56 217 356 65 421 (48)
Discontinued operations - Synthetic Fuel, net of tax 11 - - - - - 3 - 3 (100)
NET (LOSS) / INCOME (459) 118 502 56 217 359 65 424 (49)
Add: Net losses attributable to noncontrolling interests, net of tax 7 - - - 7 13 - 13 (46)
NET (LOSS) / INCOME ATTRIBUTABLE TO MARRIOTT (452)$ 118$ 502$ 56$ 224$ 372$ 65$ 437$ (49)
(LOSSES) / EARNINGS PER SHARE - Basic (Losses) / earnings from continuing operations attributable to Marriott shareholders 12 (1.27)$ 0.33$ 1.42$ 0.16$ 0.63$ 1.04$ 0.18$ 1.22$ (48) Earnings from discontinued operations 11 - - - - - 0.01 - 0.01 (100) (Losses) / earnings per share attributable to Marriott shareholders 12 (1.27)$ 0.33$ 1.42$ 0.16$ 0.63$ 1.05$ 0.18$ 1.23$ (49)
(LOSSES) / EARNINGS PER SHARE - Diluted (Losses) / earnings from continuing operations attributable to Marriott shareholders 12 (1.27)$ 0.33$ 1.42$ 0.16$ 0.62$ 0.99$ 0.17$ 1.16$ (47) Earnings from discontinued operations 11 - - - - - 0.01 - 0.01 (100) (Losses) / earnings per share attributable to Marriott shareholders 12 (1.27)$ 0.33$ 1.42$ 0.16$ 0.62$ 1.00$ 0.17$ 1.17$ (47)
Basic Shares 13 354.5 354.5 354.5 354.5 354.5 355.6 355.6 355.6Diluted Shares 13,14 354.5 354.5 354.5 354.5 364.2 372.0 372.0 372.0
See page A-3 for footnote references.
Adjustments
MARRIOTT INTERNATIONAL, INC.CONSOLIDATED STATEMENTS OF INCOME
(in millions, except per share amounts)
A-2

Reconciliations of Consolidated (Loss) / Income from Continuing Operations to (Loss) / Income from Continuing Operations Attributable to Marriott
AdjustmentsAs Reported
12 WeeksEnded
September 11, 2009
Restructuring Costs
& Other Charges6
Timeshare Strategy -
Impairment Charges5,10
CertainTax Items
As Adjusted12 Weeks
EndedSeptember 11,
2009**
As Reported12 Weeks
EndedSeptember 5,
2008Certain
Tax Items
As Adjusted12 Weeks
EndedSeptember 5,
2008**
PercentBetter/(Worse) Adjusted 2009
vs.Adjusted 2008
CONSOLIDATED (LOSS) / INCOME FROM CONTINUING OPERATIONS (469)$ 4$ 502$ 13$ 50$ 84$ 29$ 113$ (56) Add: Losses attributable to noncontrolling interests, net of tax 3 - - - 3 10 - 10 (70) (LOSS) / INCOME FROM CONTINUING OPERATIONS ATTRIBUTABLE TO MARRIOTT (466)$ 4$ 502$ 13$ 53$ 94$ 29$ 123$ (57)
AdjustmentsAs Reported
36 Weeks Ended
September 11, 2009
Restructuring Costs
& Other Charges6
Timeshare Strategy -
Impairment Charges5,10
CertainTax Items
As Adjusted36 Weeks
EndedSeptember 11,
2009**
As Reported36 Weeks
EndedSeptember 5,
2008Certain
Tax Items
As Adjusted36 Weeks
EndedSeptember 5,
2008**
PercentBetter/(Worse) Adjusted 2009
vs.Adjusted 2008
CONSOLIDATED (LOSS) / INCOME FROM CONTINUING OPERATIONS (459)$ 118$ 502$ 56$ 217$ 356$ 65$ 421$ (48) Add: Losses attributable to noncontrolling interests, net of tax 7 - - - 7 13 - 13 (46) (LOSS) / INCOME FROM CONTINUING OPERATIONS ATTRIBUTABLE TO MARRIOTT (452)$ 118$ 502$ 56$ 224$ 369$ 65$ 434$ (48)
** Denotes non-GAAP financial measures. Please see pages A-20 and A-21 for additional information about our reasons for providing these alternative financial measures and the limitations on their use.
venture earnings. Timeshare sales and services also includes gains / (losses) on the sale of timeshare note receivable securitizations.
9 – Equity in (losses) earnings includes our equity in (losses) / earnings of unconsolidated equity method joint ventures10 – Reflects a $71 million joint venture impairment charge which is allocated to the Timeshare segment and $67 million loan impairment and funding liability charge which is unallocated. See page A-14 for informati
11 – Discontinued operations relates to our Synthetic Fuel business which was shut down and substantially all the assets liquidated at December 28, 2007
14 – Basic and fully diluted weighted average common shares outstanding used to calculate earnings per share from continuing operations for the periods in which we ha a loss are the same because inclusion of additional equivalents would be anti-dilutive.
12 – (Losses) / earnings per share attributable to Marriott shareholders plus adjustment items may not equal earnings per share attributable to Marriott shareholders as adjusted due to rounding.13 – All share numbers and per share amounts have been retroactively adjusted to reflect the stock dividends with distribution dates of July 30, 2009 and September 3, 2009.
pre-opening expenses and depreciation, plus expenses related to our corporate housing business.
Adjustments
regarding Timeshare Strategy - Impairment Charges.
the sale of joint ventures and investments; and debt extinguishments, as well as income from cost method joint ventures.
3 – Cost reimbursements include reimbursements from lodging properties for Marriott-funded operating expenses.4 – Owned, leased and corporate housing - direct expenses include operating expenses related to our owned or leased hotels, including lease payments,
information regarding Timeshare Strategy - Impairment Charges.
MARRIOTT INTERNATIONAL, INC.CONSOLIDATED STATEMENTS OF INCOME
(in millions, except per share amounts)
8 – Gains and other income includes gains and losses on: the sale of real estate, note sales or repayments (except timeshare note securitizations),
Adjustments
5 – Reflects the following impairments; inventory $529 million, property and equipment $64 million; and other impairments $21 million, all of which are allocated to the Timeshare segment. See page A-14 for
6 – See page A-13 for information regarding Restructuring Costs and Other Charges.7 – General, administrative and other expenses include the overhead costs allocated to our segments, and our corporate overhead costs and general expenses.
1 – Owned, leased, corporate housing and other revenue includes revenue from the properties we own or lease, revenue from our corporate housing business, termination fees and other revenue.2 – Timeshare sales and services includes total timeshare revenue except for base management fees, cost reimbursements, real estate gains and joint
A-3

MARRIOTT INTERNATIONAL, INC.BUSINESS SEGMENTS
($ in millions)
Twelve Weeks Ended PercentBetter/
September 11, 2009 September 5, 2008 (Worse)
REVENUES
North American Full-Service $ 1,074 $ 1,239 (13) North American Limited-Service 489 544 (10) International 259 342 (24) Luxury 296 357 (17) Timeshare 330 463 (29)
Total segment revenues 1 2,448 2,945 (17) Other unallocated corporate 23 18 28
Total $ 2,471 $ 2,963 (17)
INCOME / (LOSS) FROM CONTINUING OPERATIONS
North American Full-Service $ 51 $ 66 (23) North American Limited-Service 77 103 (25) International 25 50 (50) Luxury 7 17 (59) Timeshare 2,3 (681) 49 (1,490)
Total segment financial results 1 (521) 285 (283) Other unallocated corporate (65) (58) (12) Interest income, provision for loan losses
and interest expense 4 (89) (25) (256) Income taxes 2 209 (108) 294
Total $ (466) $ 94 (596)
1 We consider segment revenues and segment financial results to be meaningful indicators of our performance because they measure changes in our profitability as a lodging company and enable investors to compare the revenues and results of our lodging operations to those of other lodging companies.
2 We allocate noncontrolling interests of our consolidated subsidiaries to our segments. Accordingly, we allocated $3 millionof noncontrolling interests of our consolidated subsidiaries for the 2009 third quarter as reflected in our income statementas follows: $4 million to our Timeshare segment and $(1) million to provision for income taxes. For the 2008 third quarter, we allocated $10 million of noncontrolling interests as follows: $15 million to our Timeshare segment
and $(5) million to provision for income taxes.
3 Reflects $685 million of impairment charges recorded in the 2009 third quarter. See page A-14 for more information.
4 Reflects a $67 million loan impairment and funding liability charge in the 2009 third quarter which is unallocated. See page A-14 for more information.
A-4

MARRIOTT INTERNATIONAL, INC.BUSINESS SEGMENTS
($ in millions)
Thirty-Six Weeks Ended PercentBetter/
September 11, 2009 September 5, 2008 (Worse)
REVENUES
North American Full-Service $ 3,382 $ 3,917 (14)North American Limited-Service 1,401 1,570 (11)International 756 1,093 (31)Luxury 971 1,147 (15)Timeshare 962 1,326 (27)
Total segment revenues 1 7,472 9,053 (17)Other unallocated corporate 56 42 33
Total $ 7,528 $ 9,095 (17)
INCOME / (LOSS) FROM CONTINUING OPERATIONS
North American Full-Service $ 191 $ 290 (34)North American Limited-Service 182 301 (40)International 2 89 179 (50)Luxury - 66 (100)Timeshare 2,3 (733) 123 (696)
Total segment financial results 1 (271) 959 (128)Other unallocated corporate (136) (183) 26Interest income, provision for loan losses
and interest expense 4 (174) (83) (110)Income taxes 2 129 (324) 140
Total $ (452) $ 369 (222)
1 We consider segment revenues and segment financial results to be meaningful indicators of our performance because they measure changes in our profitability as a lodging company and enable investors to compare the revenues and results of our lodging operations to those of other lodging companies.
2 We allocate noncontrolling interests of our consolidated subsidiaries to our segments. Accordingly, we allocated $7 millionof noncontrolling interests of our consolidated subsidiaries for the 2009 third quarter year-to-date as reflected in our incomestatement as follows: $11 million to our Timeshare segment and $(4) million to provision for income taxes. For the 2008 third quarter year-to-date, we allocated $13 million of noncontrolling interests as follows: $21 million to our Timeshare segment, $(1)
million to our International segment, and $(7) million to provision for income taxes.
3 Reflects $685 million of impairment charges recorded in the 2009 third quarter. See page A-14 for more information.
4 Reflects a $67 million loan impairment and funding liability charge in the 2009 third quarter which is unallocated. See page A-14 for more information.
A-5

BrandSeptember 11,
2009September 5,
2008vs. September 5,
2008September 11,
2009September 5,
2008vs. September 5,
2008
Domestic Full-Service Marriott Hotels & Resorts 350 345 5 139,280 137,498 1,782 Renaissance Hotels & Resorts 78 75 3 28,508 27,546 962 Domestic Limited-Service Courtyard 761 715 46 106,835 99,676 7,159 Fairfield Inn 609 547 62 54,537 48,542 5,995 SpringHill Suites 241 198 43 27,818 23,057 4,761 Residence Inn 583 541 42 69,865 64,552 5,313 TownePlace Suites 179 154 25 17,917 15,403 2,514 International Marriott Hotels & Resorts 188 179 9 57,010 53,805 3,205 Renaissance Hotels & Resorts 65 65 - 22,291 21,684 607 Courtyard 88 78 10 17,254 14,708 2,546 Fairfield Inn 9 9 - 1,109 1,109 - SpringHill Suites 1 1 - 124 124 - Residence Inn 18 18 - 2,604 2,665 (61) Marriott Executive Apartments 22 19 3 3,580 3,029 551 Luxury The Ritz-Carlton - Domestic 37 37 - 11,549 11,603 (54) The Ritz-Carlton - International 33 33 - 10,117 10,171 (54) Bulgari Hotels & Resorts 2 2 - 117 117 - The Ritz-Carlton Residential 25 21 4 2,638 2,122 516 The Ritz-Carlton Serviced Apartments 3 2 1 474 387 87 Timeshare 2
Marriott Vacation Club 3 52 51 1 11,854 11,772 82 The Ritz-Carlton Destination Club 10 9 1 461 425 36 The Ritz-Carlton Residences 4 3 1 234 145 89 Grand Residences by Marriott - Fractional 2 2 - 248 248 - Grand Residences by Marriott - Residential 2 1 1 91 65 26 Sub Total Timeshare 70 66 4 12,888 12,655 233
Total 3,362 3,105 257 586,515 550,453 36,062
Number of Timeshare Interval, Fractional and Residential Resorts Total Properties in
Properties 2 Active Sales 4
100% Company-Developed Marriott Vacation Club 3 52 29 The Ritz-Carlton Destination Club and Residences 10 8 Grand Residences by Marriott and Residences 4 4
Joint Ventures The Ritz-Carlton Destination Club and Residences 4 4
Total 70 45
1 Total Lodging Products excludes the 2,153 and 2,314 corporate housing rental units as of September 11, 2009 and September 5, 2008, respectively.2 Includes products that are in active sales as well as those that are sold out. Residential products are included once they possess a certificate of occupancy.3 Marriott Vacation Club includes Horizons by Marriott Vacation Club products that were previously reported separately. 4 Products in active sales may not be ready for occupancy.
MARRIOTT INTERNATIONAL, INC.TOTAL LODGING PRODUCTS 1
Number of Properties Number of Rooms/Suites
A-6

MARRIOTT INTERNATIONAL, INC.KEY LODGING STATISTICS
Constant $
Comparable Company-Operated International Properties1
Three Months Ended August 31, 2009 and August 31, 2008REVPAR Occupancy Average Daily Rate
Region 2009 vs. 2008 2009 vs. 2008 2009 vs. 2008Caribbean & Latin America $105.28 -23.9% 66.3% -9.1% pts. $158.84 -13.5%Continental Europe $109.13 -18.4% 71.0% -2.1% pts. $153.72 -16.0%United Kingdom $111.78 -12.3% 77.3% -2.7% pts. $144.66 -9.1%Middle East & Africa $74.52 -27.8% 61.6% -13.8% pts. $121.06 -11.7%Asia Pacific2 $74.55 -29.6% 62.6% -6.1% pts. $119.16 -22.7%
Regional Composite3 $97.11 -21.4% 68.3% -5.4% pts. $142.25 -15.2%
International Luxury4 $155.56 -26.7% 55.0% -9.7% pts. $282.69 -13.7%
Total International5 $103.26 -22.3% 66.9% -5.8% pts. $154.40 -15.5%
Worldwide6 $94.06 -21.1% 68.1% -5.4% pts. $138.03 -14.9%
Comparable Systemwide International Properties1
Three Months Ended August 31, 2009 and August 31, 2008REVPAR Occupancy Average Daily Rate
Region 2009 vs. 2008 2009 vs. 2008 2009 vs. 2008Caribbean & Latin America $90.76 -24.5% 62.4% -9.5% pts. $145.41 -13.1%Continental Europe $108.55 -20.3% 69.4% -3.4% pts. $156.47 -16.3%United Kingdom $109.26 -12.5% 76.2% -2.8% pts. $143.41 -9.3%Middle East & Africa $74.52 -27.8% 61.6% -13.8% pts. $121.06 -11.7%Asia Pacific2 $82.39 -25.0% 63.1% -6.7% pts. $130.53 -17.0%
Regional Composite3 $96.60 -21.4% 67.0% -6.0% pts. $144.17 -14.4%
International Luxury4 $155.56 -26.7% 55.0% -9.7% pts. $282.69 -13.7%
Total International5 $101.66 -22.1% 66.0% -6.3% pts. $154.10 -14.7%
Worldwide6 $83.79 -19.9% 68.0% -5.7% pts. $123.15 -13.2%
1 We report International results on a period basis, and international statistics on a monthly basis. Statistics are in constant dollars for June through August. International includes properties located outside the Continental United States and Canada, except for Worldwide which also includes North America.2 Does not include Hawaii.3 Regional information includes the Marriott Hotels & Resorts, Renaissance Hotels & Resorts and Courtyard brands. Includes Hawaii.4 International Luxury includes The Ritz-Carlton properties outside of North America and Bulgari Hotels & Resorts.5 Includes Regional Composite and International Luxury.6 Includes international statistics for the three calendar months ended August 31, 2009 and August 31, 2008, and North American statistics for the twelve weeks ended September 11, 2009 and September 5, 2008. Includes the Marriott Hotels & Resorts, Renaissance Hotels & Resorts, The Ritz-Carlton, Bulgari Hotels & Resorts, Residence Inn, Courtyard, Fairfield Inn, TownePlace Suites and SpringHill Suites brands.
A-7

MARRIOTT INTERNATIONAL, INC.KEY LODGING STATISTICS
Constant $
Comparable Company-Operated International Properties1
Eight Months Ended August 31, 2009 and August 31, 2008REVPAR Occupancy Average Daily Rate
Region 2009 vs. 2008 2009 vs. 2008 2009 vs. 2008Caribbean & Latin America $121.87 -21.3% 67.6% -9.8% pts. $180.31 -9.9%Continental Europe $101.15 -18.7% 65.0% -5.2% pts. $155.57 -12.2%United Kingdom $96.91 -14.0% 71.6% -4.4% pts. $135.44 -8.6%Middle East & Africa $92.22 -21.3% 67.0% -12.5% pts. $137.69 -6.7%Asia Pacific2 $74.93 -27.2% 60.5% -9.2% pts. $123.94 -16.1%
Regional Composite3 $96.58 -20.3% 65.7% -7.3% pts. $146.92 -11.5%
International Luxury4 $177.03 -24.1% 56.2% -10.3% pts. $314.73 -10.2%
Total International5 $105.04 -21.0% 64.7% -7.6% pts. $162.25 -11.7%
Worldwide6 $96.54 -20.9% 65.3% -7.0% pts. $147.82 -12.4%
Comparable Systemwide International Properties1
Eight Months Ended August 31, 2009 and August 31, 2008REVPAR Occupancy Average Daily Rate
Region 2009 vs. 2008 2009 vs. 2008 2009 vs. 2008Caribbean & Latin America $104.49 -21.4% 63.4% -9.1% pts. $164.74 -10.1%Continental Europe $99.59 -19.6% 63.2% -6.1% pts. $157.58 -11.9%United Kingdom $94.59 -14.3% 70.3% -4.7% pts. $134.55 -8.6%Middle East & Africa $92.22 -21.3% 67.0% -12.5% pts. $137.69 -6.7%Asia Pacific2 $81.23 -24.0% 61.5% -9.0% pts. $132.08 -13.0%
Regional Composite3 $95.08 -20.2% 64.4% -7.5% pts. $147.73 -11.0%
International Luxury4 $177.03 -24.1% 56.2% -10.3% pts. $314.73 -10.2%
Total International5 $102.13 -20.8% 63.7% -7.7% pts. $160.41 -11.2%
Worldwide6 $83.54 -19.3% 64.9% -6.5% pts. $128.81 -11.3%
1 We report International results on a period basis, and international statistics on a monthly basis. Statistics are in constant dollars for January through August. International includes properties located outside the Continental United States and Canada, except for Worldwide which also includes North America.2 Does not include Hawaii.3 Regional information includes the Marriott Hotels & Resorts, Renaissance Hotels & Resorts and Courtyard brands. Includes Hawaii.4 International Luxury includes The Ritz-Carlton properties outside of North America and Bulgari Hotels & Resorts.5 Includes Regional Composite and International Luxury.6 Includes international statistics for the eight calendar months ended August 31, 2009 and August 31, 2008, and North American statistics for the thirty-six weeks ended September 11, 2009 and September 5, 2008. Includes the Marriott Hotels & Resorts, Renaissance Hotels & Resorts, The Ritz-Carlton, Bulgari Hotels & Resorts, Residence Inn, Courtyard, Fairfield Inn, TownePlace Suites and SpringHill Suites brands.
A-8
MARRIOTT INTERNATIONAL, INC.KEY LODGING STATISTICS
Comparable Company-Operated North American Properties1
Twelve Weeks Ended September 11, 2009 and September 5, 2008REVPAR Occupancy Average Daily Rate
Brand 2009 vs. 2008 2009 vs. 2008 2009 vs. 2008Marriott Hotels & Resorts $100.78 -19.8% 70.0% -4.9% pts. $143.98 -14.2%Renaissance Hotels & Resorts $93.90 -18.2% 68.0% -4.3% pts. $138.14 -13.1%Composite North American Full-Service2 $99.58 -19.6% 69.6% -4.8% pts. $142.99 -14.0%The Ritz-Carlton3 $155.09 -23.5% 64.9% -5.0% pts. $238.99 -17.5%Composite North American Full-Service & Luxury4 $105.21 -20.2% 69.2% -4.8% pts. $152.12 -14.6%Residence Inn $83.11 -17.2% 75.2% -4.9% pts. $110.56 -11.8%Courtyard $67.42 -23.7% 65.0% -6.1% pts. $103.75 -16.4%TownePlace Suites $51.94 -19.0% 68.8% -4.6% pts. $75.46 -13.6%SpringHill Suites $59.51 -22.6% 64.6% -7.8% pts. $92.11 -13.2%Composite North American Limited-Service5 $70.26 -21.4% 68.0% -5.8% pts. $103.34 -14.7%Composite - All6 $90.28 -20.6% 68.7% -5.3% pts. $131.48 -14.5%
Comparable Systemwide North American Properties1
Twelve Weeks Ended September 11, 2009 and September 5, 2008REVPAR Occupancy Average Daily Rate
Brand 2009 vs. 2008 2009 vs. 2008 2009 vs. 2008Marriott Hotels & Resorts $90.69 -19.9% 66.9% -5.3% pts. $135.47 -13.6%Renaissance Hotels & Resorts $85.97 -19.6% 66.6% -5.0% pts. $129.04 -13.5%Composite North American Full-Service2 $89.90 -19.8% 66.9% -5.2% pts. $134.40 -13.6%The Ritz-Carlton3 $155.09 -23.5% 64.9% -5.0% pts. $238.99 -17.5%Composite North American Full-Service & Luxury4 $93.82 -20.2% 66.8% -5.2% pts. $140.50 -14.0%Residence Inn $85.72 -16.4% 76.3% -5.0% pts. $112.41 -11.0%Courtyard $72.51 -20.2% 67.2% -5.8% pts. $107.88 -13.3%Fairfield Inn $56.69 -17.7% 66.5% -6.7% pts. $85.21 -9.5%TownePlace Suites $55.69 -17.6% 69.4% -5.3% pts. $80.22 -11.3%SpringHill Suites $65.52 -18.4% 66.9% -6.4% pts. $97.97 -10.7%Composite North American Limited-Service5 $71.41 -18.4% 69.5% -5.8% pts. $102.68 -11.7%Composite - All6 $80.16 -19.3% 68.5% -5.6% pts. $117.09 -12.7%
1 North America includes properties located in the Continental United States and Canada.2 Includes the Marriott Hotels & Resorts, and Renaissance Hotels & Resorts brands. 3 Statistics for The Ritz-Carlton are for June through August.4 Includes the Marriott Hotels & Resorts, Renaissance Hotels & Resorts and The Ritz-Carlton brands. 5 Includes the Residence Inn, Courtyard, Fairfield Inn, TownePlace Suites and SpringHill Suites brands.6 Includes the Marriott Hotels & Resorts, Renaissance Hotels & Resorts, The Ritz-Carlton, Residence Inn, Courtyard, Fairfield Inn, TownePlace Suites, and SpringHill Suites brands.
A-9

MARRIOTT INTERNATIONAL, INC.KEY LODGING STATISTICS
Comparable Company-Operated North American Properties1
Thirty-six Weeks Ended September 11, 2009 and September 5, 2008REVPAR Occupancy Average Daily Rate
Brand 2009 vs. 2008 2009 vs. 2008 2009 vs. 2008Marriott Hotels & Resorts $104.85 -19.4% 66.9% -6.1% pts. $156.81 -12.1%Renaissance Hotels & Resorts $102.27 -17.3% 66.2% -5.8% pts. $154.51 -10.0%Composite North American Full-Service2 $104.40 -19.1% 66.7% -6.0% pts. $156.42 -11.8%The Ritz-Carlton3 $174.21 -27.6% 61.8% -10.3% pts. $281.86 -15.6%Composite North American Full-Service & Luxury4 $110.70 -20.4% 66.3% -6.4% pts. $166.98 -12.7%Residence Inn $81.49 -17.6% 70.5% -6.7% pts. $115.58 -9.7%Courtyard $68.60 -23.7% 62.0% -7.5% pts. $110.72 -14.5%TownePlace Suites $50.04 -18.9% 63.2% -6.9% pts. $79.23 -10.1%SpringHill Suites $61.58 -22.0% 62.2% -9.1% pts. $99.05 -10.5%Composite North American Limited-Service5 $70.58 -21.6% 64.5% -7.3% pts. $109.47 -12.7%Composite - All6 $93.44 -20.8% 65.5% -6.8% pts. $142.62 -12.6%
Comparable Systemwide North American Properties1
Thirty-six Weeks Ended September 11, 2009 and September 5, 2008REVPAR Occupancy Average Daily Rate
Brand 2009 vs. 2008 2009 vs. 2008 2009 vs. 2008Marriott Hotels & Resorts $93.03 -19.6% 64.1% -6.2% pts. $145.13 -11.9%Renaissance Hotels & Resorts $91.36 -18.0% 64.4% -6.0% pts. $141.97 -10.4%Composite North American Full-Service2 $92.75 -19.4% 64.1% -6.1% pts. $144.60 -11.7%The Ritz-Carlton3 $174.21 -27.6% 61.8% -10.3% pts. $281.86 -15.6%Composite North American Full-Service & Luxury4 $97.10 -20.2% 64.0% -6.3% pts. $151.67 -12.3%Residence Inn $82.60 -15.8% 71.8% -5.7% pts. $115.12 -9.2%Courtyard $71.76 -19.9% 64.0% -6.3% pts. $112.08 -12.0%Fairfield Inn $53.54 -16.6% 62.3% -6.4% pts. $85.87 -8.0%TownePlace Suites $53.48 -16.8% 64.4% -6.7% pts. $83.08 -8.2%SpringHill Suites $64.52 -17.1% 63.9% -6.5% pts. $101.01 -8.6%Composite North American Limited-Service5 $69.49 -17.8% 65.7% -6.2% pts. $105.71 -10.1%Composite - All6 $80.21 -19.0% 65.1% -6.3% pts. $123.26 -11.2%
1 North America includes properties located in the Continental United States and Canada.2 Includes the Marriott Hotels & Resorts, and Renaissance Hotels & Resorts brands. 3 Statistics for The Ritz-Carlton are for January through August.4 Includes the Marriott Hotels & Resorts, Renaissance Hotels & Resorts and The Ritz-Carlton brands. 5 Includes the Residence Inn, Courtyard, Fairfield Inn, TownePlace Suites and SpringHill Suites brands.6 Includes the Marriott Hotels & Resorts, Renaissance Hotels & Resorts, The Ritz-Carlton, Residence Inn, Courtyard, Fairfield Inn, TownePlace Suites, and SpringHill Suites brands.
A-10
As Reported 12 Weeks Ended September 11,
2009Restructuring Costs &
Other ChargesTimeshare Strategy - Impairment Charges
As Adjusted 12 Weeks Ended September 11,
2009**
As Reported 12 Weeks Ended September 5,
2008
Percent Better / (Worse) As Adjusted
2009 vs. 2008 As Reported
Segment RevenuesSegment revenues $ 330 $ (3) $ - $ 327 $ 463 (29)
Segment ResultsBase fees revenue $ 11 $ - $ - $ 11 $ 12 (8)Timeshare sales and services, net 16 (3) - 13 47 (72)Timeshare strategy - impairment charges (614) - 614 - - -Restructuring costs (7) 7 - - - -General, administrative and other expense (17) - - (17) (27) 37 Gains and other income 1 - - 1 - * Joint venture equity earnings (4) 1 - (3) 2 (250)Timeshare strategy - impairment charges (non-operating) (71) - 71 - - -Noncontrolling interest 4 - - 4 15 (73)
Segment results $ (681) $ 5 $ 685 $ 9 $ 49 (82)
Sales and Services RevenueDevelopment $ 138 $ - $ - $ 138 $ 265 (48)Services 82 - - 82 81 1 Financing 27 (3) - 24 31 (23)Other revenue 7 - - 7 7 *
Sales and services revenue $ 254 $ (3) $ - $ 251 $ 384 (35)
Contract SalesCompany:
Timeshare $ 164 $ - $ - $ 164 $ 283 (42)Fractional 7 - - 7 18 (61)Residential 2 - - 2 (6) 133 Total company 173 - - 173 295 (41)
Joint ventures:Timeshare - - - - - -Fractional (4) 7 - 3 6 (50)Residential (17) 17 - - 5 (100) Total joint ventures (21) 24 - 3 11 (73)
Total contract sales, including joint ventures $ 152 $ 24 $ - $ 176 $ 306 (42)
(Loss) / Gain on Notes Sold(Loss) / gain on notes sold $ - $ - $ - $ - $ (1) 100
*Percent cannot be calculated.**Denotes non-GAAP financial measures. Please see pages A-20 and A-21 for additional information about our reasons for providing these alternative financial measures and the limitations on their use.
MARRIOTT INTERNATIONAL, INC.TIMESHARE SEGMENT
($ in millions)
Adjustments
A-11

As Reported 36 Weeks Ended September 11,
2009Restructuring Costs &
Other ChargesTimeshare Strategy - Impairment Charges
As Adjusted 36 Weeks Ended September 11,
2009**
As Reported 36 Weeks Ended September 5,
2008
Percent Better / (Worse) As Adjusted
2009 vs. 2008 As Reported
Segment RevenuesSegment revenues $ 962 $ 26 $ - $ 988 $ 1,326 (25)
Segment ResultsBase fees revenue $ 32 $ - $ - $ 32 $ 35 (9)Timeshare sales and services, net 9 25 - 34 137 (75)Timeshare strategy - impairment charges (614) - 614 - - -Restructuring costs (38) 38 - - - -General, administrative and other expense (57) 7 - (50) (79) 37 Gains and other income 1 - - 1 - * Joint venture equity earnings (6) 3 - (3) 9 (133)Timeshare strategy - impairment charges (non-operating) (71) - 71 - - -Noncontrolling interest 11 - - 11 21 (48)
Segment results $ (733) $ 73 $ 685 $ 25 $ 123 (80)
Sales and Services RevenueDevelopment $ 441 $ 4 $ - $ 445 $ 722 (38)Services 232 - - 232 244 (5)Financing 54 22 - 76 107 (29)Other revenue 19 - - 19 25 (24)
Sales and services revenue $ 746 $ 26 $ - $ 772 $ 1,098 (30)
Contract SalesCompany:
Timeshare $ 502 $ - $ - $ 502 $ 859 (42)Fractional 25 1 - 26 34 (24)Residential (1) 4 - 3 33 (91) Total company 526 5 - 531 926 (43)
Joint ventures:Timeshare - - - - - -Fractional (9) 23 - 14 17 (18)Residential (27) 27 - - 30 (100) Total joint ventures (36) 50 - 14 47 (70)
Total contract sales, including joint ventures 490$ 55$ -$ 545$ 973$ (44)
(Loss) / Gain on Notes Sold(Loss) / gain on notes sold (1)$ -$ -$ (1)$ 28$ (104)
*Percent cannot be calculated.**Denotes non-GAAP financial measures. Please see pages A-20 and A-21 for additional information about our reasons for providing these alternative financial measures and the limitations on their use.
MARRIOTT INTERNATIONAL, INC.TIMESHARE SEGMENT
($ in millions)
Adjustments
A-12

MARRIOTT INTERNATIONAL, INC.Summary of Restructuring Costs and Other Charges
($ in millions)
External Line Description Third QuarterThird Quarter Year to Date
Timeshare sales and services revenue Mark-to-market of residual interests (3)$ 22$
Contract sale cancellation allowances - 4 Timeshare sales and services revenue (3) 26
Timeshare - direct expenses Contract sale cancellation allowances - (1)
Timeshare - direct expenses - (1)
Restructuring costs Severance 4 16 Facilities exit costs 5 27 Development cancellations - 1
Restructuring costs 9 44
General, administrative and other System development write-down - 7 Accounts receivable and guarantee charges 1 4 Reserves for security deposits, net of prior year reserves - 38
General, administrative and other 1 49
Provision for loan losses Loan impairments - 43 Provision for loan losses - 43
Equity in (earnings) losses Contract sale cancellation allowances 1 3 Investment impairment - 30
Equity in (earnings) losses 1 33
Restructuring Costs & Other Charges Total 8 194
Tax Impact (4) (76)
Restructuring Costs & Other Charges Net of Tax 4$ 118$
2009
A-13

ImpairmentCharge
Third Quarter 2009 Operating Income ImpactInventory impairment 529$ Property and equipment impairment 64Other impairments 21
Total operating income impact 614
Third Quarter 2009 Non-Operating Income ImpactJoint venture impairment 71Loan impairment 40Funding liability 27
Total non-operating income impact 138
Total impact 752$
MARRIOTT INTERNATIONAL, INC.Timeshare Strategy - Impairment Charges Summary
Third Quarter 2009($ in millions)
A-14

First Quarter
Second Quarter
Third Quarter
Total Year to Date
Net (Loss) / Income attributable to Marriott (23)$ 37$ (466)$ (452)$ Interest expense 29 28 27 84 Tax provision, continuing operations 33 44 (210) (133) Tax provision, noncontrolling interest 1 2 1 4 Depreciation and amortization 39 42 43 124 Less: Depreciation reimbursed by third-party owners (2) (2) (2) (6) Interest expense from unconsolidated joint ventures 3 6 4 13 Depreciation and amortization from unconsolidated joint ventures 6 6 6 18 EBITDA ** 86 163 (597) (348)
Restructuring costs and other charges Severance 2 10 4 16 Facilities exit costs - 22 5 27 Development cancellations - 1 - 1 Total restructuring costs 2 33 9 44 Impairment of investments and other, net of prior year reserves 68 3 1 72 Reserves for loan losses 42 1 - 43 Contract cancellation allowances 4 1 1 6 Residual interests valuation 13 12 (3) 22 System development write-off - 7 - 7 Total other charges 127 24 (1) 150 Total restructuring costs and other charges 129 57 8 194
Timeshare strategy - impairment charges Operating impairments - - 614 614 Non-operating impairments - - 138 138 Total timeshare strategy - impairment charges - - 752 752
Adjusted EBITDA ** 215$ 220$ 163$ 598$
Decrease over 2008 Adjusted EBITDA -25% -43% -43% -38%
FirstQuarter
Second Quarter
Third Quarter
Fourth Quarter Total
Net Income/ (Loss) attributable to Marriott 121$ 157$ 94$ (10)$ 362$ Interest expense 42 38 33 50 163 Tax provision, continuing operations 75 139 103 33 350 Tax provision, minority interest 1 1 5 2 9 Tax benefit, synthetic fuel - (6) (1) - (7) Depreciation and amortization 41 47 42 60 190 Less: Depreciation reimbursed by third-party owners (3) (3) (2) (2) (10) Interest expense from unconsolidated joint ventures 4 4 5 5 18 Depreciation and amortization from unconsolidated joint ventures 5 6 6 10 27 EBITDA ** 286 383 285 148 1,102
Discontinued operations adjustment (synthetic fuel) 1 2 1 - 4 Restructuring costs and other charges Severance - - - 19 19 Facilities exit costs - - - 5 5 Development cancellations - - - 31 31 Total restructuring costs - - - 55 55 Reserves for expected fundings - - - 16 16 Inventory write-downs - - - 9 9 Contract cancellation allowances - - - 12 12 Accounts receivable-bad debts - - - 4 4 Residual interests valuation - - - 32 32 Hedge ineffectiveness - - - 12 12 Impairment of investments and other - - - 30 30 Reserves for loan losses - - - 22 22 Total other charges - - - 137 137 Total restructuring costs and other charges - - - 192 192
Adjusted EBITDA ** 287$ 385$ 286$ 340$ 1,298$
The following items make up the discontinued operations adjustment (synthetic fuel)Pre-tax Synthetic Fuel losses 1$ 2$ 1$ -$ 4$ EBITDA adjustment for discontinued operations (synthetic fuel) 1$ 2$ 1$ -$ 4$
** Denotes non-GAAP financial measures. Please see pages A-20 and A-21 for additional information about our reasons for providing these alternative financial measures and the limitations on their use.
MARRIOTT INTERNATIONAL, INC.Non-GAAP Financial Measure EBITDA and Adjusted EBITDA
($ in millions)
Fiscal Year 2009
Fiscal Year 2008
A-15

MARRIOTT INTERNATIONAL, INC.Non-GAAP Financial Measure
Total Debt Net of Cash($ in millions)
Balance atEnd of 2009
Third Quarter
Balance at Year-End
2008
Better/(Worse)Change
Total debt 2,660$ 3,095$ 435$ Cash and cash equivalents (130) (134) (4) Total debt net of cash** 2,530$ 2,961$ 431$
Range RangeEstimated Balance
Estimated Balance
Year-End 2009 (a)
Year-End 2009 (b)
Better/(Worse)Change (a)
Better/(Worse)Change (b)
Total debt 2,476$ 2,426$ 619$ 669$ Cash and cash equivalents (115) (115) (19) (19) Total debt net of cash** 2,361$ 2,311$ 600$ 650$
(a) Assumes $619 debt repayment in 2009 and $19 reduction in cash(b) Assumes $669 debt repayment in 2009 and $19 reduction in cash
** Denotes non-GAAP financial measures. Please see pages A-20 and A-21 for additional information about our reasons forproviding these alternative financial measures and the limitations on their use.
As Compared to Balanceat Year-End 2008
A-16

Third Quarter 2008 Third Quarter 2009General, administrative and other expenses 167$ 144$ Less: Restructuring costs and other charges - (1) Deferred Compensation charges 7 (8) Certain Litigation Expenses - (5)
Adjusted General, administrative and other expenses** 174$ 130$
** Denotes non-GAAP financial measures. Please see pages A-20 and A-21 for additional information about our reasons for providing these alternative financial measures and the limitations on their use.
MARRIOTT INTERNATIONAL, INC.Non-GAAP Financial Measure Reconciliation
Adjusted Third Quarter 2008 and 2009 General, Administrative and
($ in millions)
Other Expenses Excluding Restructuring Costs and Other Charges,Deferred Compensation Charges and Certain Litigation Expenses
A-17

Fourth Quarter 2008
General, administrative and other expenses 270$
Less: Restructuring costs and other charges (32)
General, administrative and other expenses excluding restructuring costs and other charges** 238$
** Denotes non-GAAP financial measures. Please see pages A-20 and A-21 for additional information about our reasons for providing these alternative financial measures and the limitations on their use.
($ in millions)
MARRIOTT INTERNATIONAL, INC.Non-GAAP Financial Measure Reconciliation
Adjusted Fourth Quarter 2008 General, Administrative and Other ExpensesExcluding Restructuring Costs and Other Charges
A-18

Assumed/Estimated Fourth Quarter 2009
Assumed/Estimated Fourth Quarter 2009
Earnings per share attributable to Marriott shareholders 0.19$ 0.22$
Add back: Restructuring costs and other charges, timeshare strategy - impairment charges and certain tax items 0.01 0.01
Earnings per share attributable to Marriott shareholders excluding restructuring costs and other charges, timeshare strategy - impairment charges and certain tax items** 0.20$ 0.23$
** Denotes non-GAAP financial measures. Please see pages A-20 and A-21 for additional information about our reasons for providing these alternative financial measures and the limitations on their use.
Range
MARRIOTT INTERNATIONAL, INC.Non-GAAP Financial Measure Reconciliation
Internal Planning Assumptions and Related Estimates ofEarnings per Share Attributable to Marriott Shareholders that Exclude Restructuring Costs and Other Charges, Timeshare Strategy - Impairment Charges and Certain Tax Items in 2009
A-19

In our press release and schedules, and on the related conference call, we report certain financial measures that are not prescribed or authorized by United States generally accepted accounting principles (“GAAP”). We discuss management’s reasons for reporting these non-GAAP measures below, and the press release schedules reconcile the most directly comparable GAAP measure to each non-GAAP measure that we refer to (identified by a double asterisk on the preceding pages). Although management evaluates and presents these non-GAAP measures for the reasons described below, please be aware that these non-GAAP measures are not alternatives to revenue, operating income, income from continuing operations, net income, earnings per share or any other comparable operating measure prescribed by GAAP. In addition, these non-GAAP financial measures may be calculated and/or presented differently than measures with the same or similar names that are reported by other companies, and as a result, the non-GAAP measures we report may not be comparable to those reported by others.
Measures That Exclude Timeshare Strategy - Impairment Charges, Restructuring Costs and Other Charges, Deferred Compensation Charges (Credits), Litigation Expenses, and Certain Tax Expenses . Management evaluates non-GAAP measures that exclude the impact of Timeshare strategy - impairment charges incurred in the 2009 third quarter, restructuring costs and other charges and certain tax expenses incurred in the 2009 first quarter, 2009 and 2008 second and third quarters, as well as estimated restructuring costs and other charges expected to be incurred in the fourth quarter of 2009 and estimated full year 2009 restructuring costs and other charges, deferred compensation charges (credits) incurred in the 2009 and 2008 third quarters of $8 million and ($7) million, respectively, associated with our deferred compensation plan, and litigation expenses of $5 million because those non-GAAP measures allow for period-over-period comparisons of our on-going core operations before material charges. These non-GAAP measures also facilitate management’s comparison of results from our on-going operations before material charges with results from other lodging companies.
In response to the difficult business conditions that the Timeshare segment’s timeshare, luxury residential, and luxury fractional real estate development businesses continue to experience, we evaluated the entire Timeshare portfolio in the 2009 third quarter. In order to adjust the business strategy to reflect current market conditions, on September 22, 2009, we approved plans for our Timeshare segment to take the following actions: (1) for our luxury residential projects, reduce prices, convert certain proposed projects to other uses, sell some undeveloped land, and not pursue further Marriott-funded residential development projects; (2) reduce prices for existing luxury fractional units; (3) continue short-term promotions for our U.S. timeshare business and defer the introduction of new projects and development phases; and (4) for our European timeshare and fractional resorts, continue promotional pricing and marketing incentives and not pursue further development. As a result of these decisions, we recorded third quarter 2009 pretax charges totaling $752 million in our Consolidated Statements of Income ($502 million after-tax), including $614 million of pretax charges impacting operating income under the “Timeshare strategy-impairment charges” caption, and $138 million of pretax charges impacting non-operating income under the “Timeshare strategy-impairment charges (non-operating)” caption.
During the latter part of 2008 and particularly the fourth quarter, we experienced a significant decline in demand for hotel rooms both domestically and internationally due, in part, to the failures and near failures of several large financial service companies and the dramatic downturn in the economy. Our capital intensive Timeshare business was also hurt by the downturn in market conditions and particularly, the significant deterioration in the credit markets, which resulted in our decision not to complete a note sale in the fourth quarter of 2008 (although we did complete a note sale in the first quarter of 2009). These declines resulted in reduced management and franchise fees, cancellation of development projects, reduced timeshare contract sales, contract cancellation allowances, and charges and reserves associated with expected fundings, loans, Timeshare inventory, accounts receivable, contract cancellation allowances, valuation of Timeshare residual interests, hedge ineffectiveness, and asset impairments. We responded by implementing various cost saving measures, beginning in the fourth quarter of 2008 and which continued in the first quarter through third quarters of 2009, and resulted in first quarter 2009 restructuring costs of $2 million, second quarter 2009 restructuring costs of $33 million, and third quarter 2009 restructuring costs of $9 million that were directly related to the downturn. We also incurred other first quarter 2009 and second quarter 2009 charges totaling $127 million and $24 million, respectively, as well as $1 million in net other credits in the 2009 third quarter, that were directly related to the downturn, including asset impairment charges, accounts receivable and guarantee charges, reserves associated with loans, reversal of the liability related to expected fundings, Timeshare contract cancellation allowances, and charges related to the valuation of Timeshare residual interests. Currently, we expect to incur $5 million to $6 million in restructuring costs and other charges in the 2009 fourth quarter. For full year 2009, we expect restructuring costs and other charges to total $199 million to $200 million as a result of our restructuring efforts and the economic downturn, which includes $194 million of restructuring costs and other charges already incurred in the first three quarters of 2009. These estimates are subject to change.
Certain tax expenses included $26 million in the 2009 first quarter, $17 million in the 2009 second quarter, $13 million in the 2009 third quarter and $24 million in the 2008 second quarter of non-cash charges primarily related to the treatment of funds received from certain foreign subsidiaries, an issue we are contesting with the Internal Revenue Service ("IRS"). Additionally, certain tax expenses in the 2008 second quarter also reflected $12 million of tax expense due primarily to prior years' tax adjustments, including a settlement with the IRS that resulted in a lower than expected refund of taxes associated with a 1995 leasing transaction. Certain tax items in the 2008 third quarter reflected $29 million of tax expense primarily related to an unfavorable court decision involving a tax planning transaction associated with a 1994 sale transaction.
Earnings Before Interest, Taxes, Depreciation and Amortization . Earnings before interest, taxes, depreciation and amortization (“EBITDA”) reflects earnings excluding the impact of interest expense, tax expense, depreciation and amortization. Management considers EBITDA to be an indicator of operating performance because it can be used to measure our ability to service debt, fund capital expenditures, and expand our business. EBITDA is used by analysts, lenders, investors and others, as well as by us, to evaluate companies because it excludes certain items that can vary widely across different industries or among companies within the same industry. For example, interest expense can be dependent on a company’s capital structure, debt levels and credit ratings. Accordingly, the impact of interest expense on earnings can vary significantly among companies. The tax positions of companies can also vary because of their differing abilities to take advantage of tax benefits and because of the tax policies of the jurisdictions in which they operate. As a result, effective tax rates and tax expense can vary considerably among companies. EBITDA also excludes depreciation and amortization because companies utilize productive assets of different ages and use different methods of both acquiring and depreciating productive assets. These differences can result in considerable variability in the relative costs of productive assets and the depreciation and amortization expense among companies.
MARRIOTT INTERNATIONAL, INC.Non-GAAP Financial Measures
A-20

Adjusted EBITDA. Management also evaluates adjusted EBITDA which excludes: (1) Timeshare strategy - impairment charges of $752 million incurred in the 2009 third quarter (2) the 2009 third quarter restructuring costs and other charges totaling $8 million; (3) the 2009 second quarter restructuring costs and other charges totaling $57 million; (4) the 2009 first quarter restructuring costs and other charges totaling $129 million; (5) the 2008 fourth quarter restructuring costs and other charges totaling $192 million; and (6) the first through third quarters of 2008 impact of the synthetic fuel business. Management excludes the restructuring costs and other charges incurred in the 2009 first through third quarters and in the 2008 fourth quarter and the timeshare strategy-impairment charges recorded in the 2009 third quarter for the reasons noted abov塅��塅Eer “Measures That Exclude Timeshare - Strategy Impairment Charges, Restructuring Costs and Other Charges, Deferred Compensation Charges (Credits), Litigation Expenses, and Certain Tax Expenses.” Fourth quarter 2008 restructuring costs and other charges included $55 million of restructuring costs and $137 million of other charges, including charges and reserves associated with expected fundings, loans, Timeshare inventory, accounts receivable, contract cancellation allowances, valuation of Timeshare residual interests, hedge ineffectiveness, and asset impairments. Management also excludes the first through third quarters of 2008 impact of the synthetic fuel business, which was discontinued in 2007 and which did not relate to our core lodging business, to allow for period-over-period comparisons of our on-going core lodging operations and facilitate management’s comparison of our results with those of other lodging companies.
Total Debt, Net of Cash (or, "Net Debt"). Total debt net of cash reflects total debt less cash and cash equivalents. Management considers total debt net of cash to be a more accurate indicator of the net debt that must be repaid or refinanced at maturity (as it gives consideration to cash resources available to retire a portion of the debt when due). Additionally, management believes that this financial measure provides a clearer picture of the future demands on cash to repay debt. Management uses this financial measure in making decisions regarding its borrowing capacity and future refinancing needs.
MARRIOTT INTERNATIONAL, INC.Non-GAAP Financial Measures
(cont.)
A-21