Embed Size (px)
Citation preview

Bruker Corporation (NASDAQ: BRKR)
Q1 2015 Earnings Presentation
Frank Laukien, President & CEO
Charles Wagner, EVP & CFO
Joshua Young, VP, Investor Relations May 6, 2015
Innovation with Integrity

Any statements contained in this presentation that do not describe historical facts may constitute
forward-looking statements as that term is defined in the Private Securities Litigation Reform Act of 1995.
Any forward-looking statements contained herein are based on current expectations, but are subject to
risks and uncertainties that could cause actual results to differ materially from those projected, including,
but not limited to, risks and uncertainties relating to adverse changes in conditions in the global economy
and volatility in the capital markets, the integration of businesses we have acquired or may acquire in the
future, changing technologies, product development and market acceptance of our products, the cost and
pricing of our products, manufacturing, competition, dependence on collaborative partners and key
suppliers, capital spending and government funding policies, changes in governmental regulations,
realization of anticipated benefits from economic stimulus programs, intellectual property rights,
litigation, and exposure to foreign currency fluctuations and other risk factors discussed from time to time
in our filings with the Securities and Exchange Commission. These and other factors are identified and
described in more detail in our filings with the SEC, including, without limitation, our annual report on
Form 10-K for the year ended December 31, 2014. We will also be referencing non-GAAP financial
measures in this presentation. A reconciliation of non-GAAP to GAAP results is available in our earnings
press release and in this presentation.
Bruker Corporation
Safe Harbor & Reg. G Statement
© Bruker Corporation 2

Q1 2015 Business Update
© Bruker Corporation 3

$0.11
$0.14
Q1-14
Q1-15
Q1-15 Financials
Revenues [$ m]
Non-GAAP EPS
Restructuring & operational initiatives drive higher
profit and free cash flow, despite lower revenue
-17%
+27%
© Bruker Corporation 4
424 354
Q1-14 Q1-15
Q1 2015 Performance
Revenues decline $70m, or -17% y-o-y
− Changes in foreign exchange lower
revenues by $47M, or -11% y-o-y
− CAM divestitures result in $12M y-o-y
revenue decline
Organic revenue decline of -3.0%, mostly due
to lower NMR revenue
Non-GAAP EPS of $0.14, or 27% growth y-o-y
− CAM restructuring plus operational and
commercial excellence initiatives drive
EPS up by +$0.05 y-o-y
− Currency reduces EPS by ($0.02) y-o-y
− Net effect is +$0.03 non-GAAP EPS
increase y-o-y

Bruker BIOSPIN Group
Weak NMR order bookings in 2014 drive revenue decline in Q1-15
NMR new order bookings improving in Q1-15
New pricing and commercial practices put in place during Q1-15
Negotiations with workers councils to finalize restructuring plans are
expected to be completed in May 2015
Next-gen GHz technology launch reflects commitment to innovation;
customer reaction positive; IDPs create new UHF-NMR demand;
Bruker CALID Group
Low single-digit organic revenue growth and significant improvement
in profitability in Q1-15
CAM Division restructuring successfully completed in Q1-15, one
quarter ahead of schedule
Daltonics Division benefits from strong Q1-15 performance of MALDI
Biotyper; US-FDA cleared expanded claim 2; April launch of CE-
marked Sepsityper solution and high-end MALDI Biotypersmart
Detection Division Q1-15 performance benefits from export licenses;
books important Explosives Trace Detection orders for EU airports;
5 © Bruker Corporation
GROUP OVERVIEW:
Q1 2015 Performance

Bruker NANO Group
Low single-digit organic revenue growth driven by solid Q1-15 for
the AXS Division
Group achieves higher profitability y-o-y due to 2013-2014
restructuring, new products and continued expense controls
AXS Division grows revenue in all product lines
Demand in Asia remains weak, particularly for industrial markets
BNS new BioAFM and Fluorescence Microscopy products doing well
BEST Segment
Low single-digit organic revenue decline primarily driven by timing
and completion of prior year “Big Science” projects
Solid execution in improving working capital, particularly inventory
Expect improvements in BEST financial performance from Q1-15
levels over the remainder of the year
GROUP OVERVIEW:
Q1 2015 Performance
6 © Bruker Corporation

Bruker 2015 Priorities
© Bruker Corporation 7
Continue transformation of leadership, management processes, and systems
Execute BIOSPIN rightsizing and factory consolidation
Accelerate further outsourcing of high-level assemblies in CALID and NANO
Drive profitable growth initiative
• New high-performance products
• New high-value analytical and clinical solutions
• Entry into adjacent markets

Progress with Profitable Growth Initiative
© Bruker Corporation 8
• Next-generation Explosives Trace Detectors (ETD) qualified under new European passenger and cargo requirements; major contract win in Germany; significant opportunity;
• Next-generation GHz NMR technology launched for molecular biology and pathogenesis research on Intrinsically Disordered Proteins (IDPs); IDPs play major role in cancer and neurodegenerative diseases;
• MALDI Biotyper: China business growing; Clearance of expanded 2nd US FDA claim; April launch of high-end MALDI Biotypersmart system and CE-marked
MALDI Sepsityper solution;
IDPs by NMR Video: http://www.idpbynmr.eu/home/video.html

Q1 2015 Financial Update
© Bruker Corporation 9

NON-GAAP FINANCIAL PERFORMANCE:
Q1 2015 Overview
[$ m, except EPS] Q1 2015 Q1 2014 Δ
Revenues 353.5 423.7 -17%
Operating Income 35.8 32.1 12%
Margin (%) 10.1% 7.6%
EPS $0.14 $0.11 27%
Free Cash Flow 21.3 9.3 12.0M
Non-GAAP operating margins increase y-o-y due to CAM divestitures and operational improvement initiatives
Free cash flow increase driven by improvement in working capital and lower capex spending
Working capital ratios improve as result of improved operations, outsourcing and currency changes
10 © Bruker Corporation
COMMENTS
[$ m] Mar 31, 2015 Mar 31, 2014 Δ
Net Cash 137.7 99.2 39%
Working capital (WC)* 614.4 799.1 -23%
WC-to-revenue ratio 0.35 0.43 -0.08
* WC = (Accounts Receivable + Inventory – Accounts Payable)

Q1 2014 Organic Currency Divestitures Q1 2015
$423.7M
$353.5M
Q1 2015 revenue bridge
Organic revenue decline of -3.0%
Retained CAM products included in organic growth calculation, divested assets excluded
Weaker Euro drove approximately 70% of the $47M decline in revenues from FX rates
11 © Bruker Corporation
FY 2015 DRIVERS
Q1 2015 Revenue Bridge [$ m]
-$12.5 -$46.8 -$10.9
Organic Currency Acquisitions & Divestitures Total
-3.0% -11.0% -2.6% -16.6%
Q1 2015 Revenue for Bruker Corp.

Q1 2015 Non-GAAP Results
FX reduces revenue by -$47M;
Gross profit margin improvement driven by prior programs and higher profitability in NANO and CALID Groups
Currency represented a headwind of -$6M to operating income
12 © Bruker Corporation
COMMENTS [$ m, except EPS] Q1 2015 Q1 2014 Δ
Total Revenues 353.5 423.7 -17%
Gross Profit 167.1 187.2 -11% Margin (% of revenues) 47.3% 44.2%
SG&A -94.1 -109.1 -14%
(% of revenues) 26.6%
25.7%
R&D -37.2 -46.0 -19% (% of revenues) 10.5% 10.9%
Operating Income 35.8 32.1 12%
(% of revenues) 10.1% 7.6%
Tax Rate 27.2% 25.5% 170 bps
Net Income* 23.1 18.7 24%
EPS $0.14 $0.11 27%
Shares Outstanding 169.7 169.4 NM
* Attributable to Bruker Sum of items may not total due to rounding

Q1 2015 Reconciliation of GAAP and
Non-GAAP Results
[$ m, except EPS] Q1 2015 Q1 2014
GAAP Operating Income 15.2 20.6
Restructuring Costs 3.3 2.4
Acquisition-Related Costs 0.2 1.1
Purchased Intangible Amortization 5.2 5.2
Other Costs 11.9 2.8
TOTAL 20.6 11.5
Non-GAAP Operating Income 35.8 32.1
Non-GAAP Net Interest Income (Expense) & Other -3.5 -5.2*
Non GAAP Profit Before Tax 32.3 26.9
Taxes -8.8 -6.9
Non-GAAP Tax Rate 27.2% 25.5%
Minority Interest -0.4 -1.3
Non-GAAP Net Income** 23.1 18.7
Non-GAAP EPS $0.14 $0.11
13 © Bruker Corporation
*Excludes $0.3 million of gains for 2014 ** Attributable to Bruker
Sum of items may not total due to rounding

Q1 2015 Cash Flow Statement
Seventh straight quarter of positive free cash flow for Bruker
Working capital efficiency continues to improve, and capex remains controlled
14 © Bruker Corporation
COMMENTS [$ m] Q1 2015 Q1 2014 Δ
Net Income 6.9 10.0 -3.1
Depreciation & amortization 13.5 15.2 -1.7
Changes in working capital* 30.5 17.0 13.5
Other -23.9 -23.7 -0.2
Operating cash flow 27.0 18.5 8.5
Capital expenditures -5.7 -9.2 3.5
Free cash flow 21.3 9.3 12.0

2015 Outlook
© Bruker Corporation 15
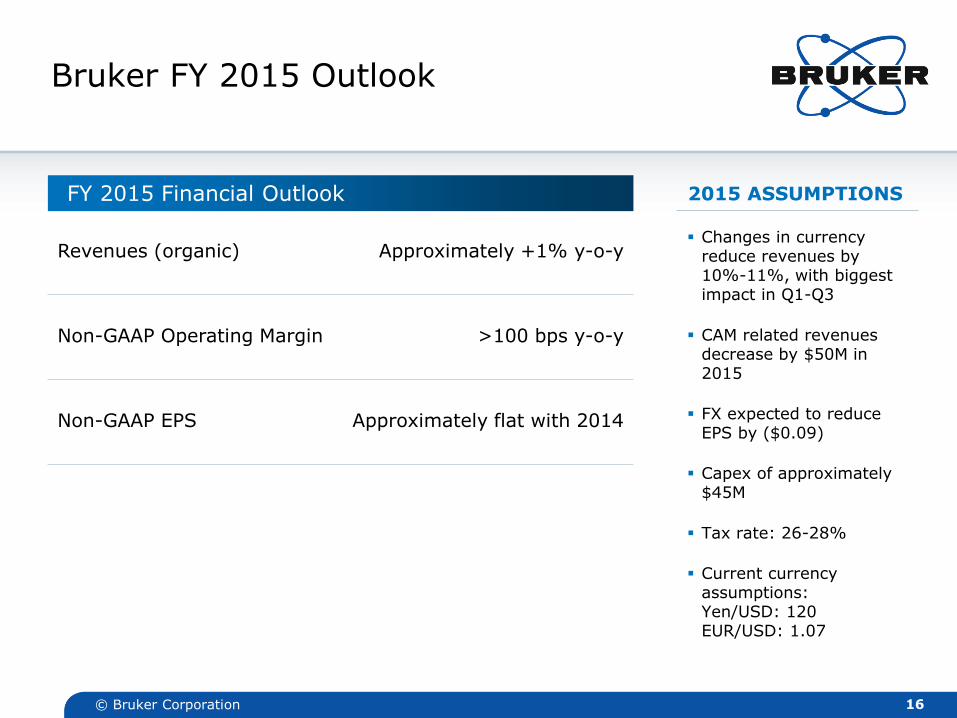
FY 2015 Financial Outlook
Revenues (organic) Approximately +1% y-o-y
Non-GAAP Operating Margin >100 bps y-o-y
Non-GAAP EPS Approximately flat with 2014
16 © Bruker Corporation
Bruker FY 2015 Outlook
Changes in currency reduce revenues by 10%-11%, with biggest impact in Q1-Q3
CAM related revenues decrease by $50M in 2015
FX expected to reduce EPS by ($0.09)
Capex of approximately $45M
Tax rate: 26-28%
Current currency assumptions: Yen/USD: 120 EUR/USD: 1.07
2015 ASSUMPTIONS

Appendix
© Bruker Corporation 17

Q1 2015 GAAP Results
[$ m, except EPS] Q1 2015 Q1 2014 Δ
Total Revenues 353.5 423.7 -17%
Gross Profit 160.2 179.7 -11%
Margin (% of sales) 45.3% 42.4%
SG&A -94.6 -109.5 -14%
(% of revenues) 26.8% 25.8%
R&D -37.2 -46.0 -19%
(% of revenues) 10.5% 10.9%
Operating Income 15.2 20.6 -26%
(% of revenues) 4.3% 4.9%
Net Income* 6.5 8.7 -25%
EPS $0.04 $0.05 -20%
Shares Outstanding 169.7 169.4 NM
18 © Bruker Corporation
* Attributable to Bruker Sum of items may not total due to rounding

Balance sheet
[$ m] Mar 31, 2015 Dec 31, 2014 Δ
Cash, Cash Equivalents & Short-term Investments
492.3 497.5 -1%
Financial Debt 354.6 355.0 NM
Net Cash 137.7 142.5 -3%
19 © Bruker Corporation
[$ m] Mar 31, 2015 Dec 31, 2014 Δ
Total Assets 1,772.7 1,864.8 -5%
Working Capital* 614.4 694.6 -12%
Intangibles, net & Other Long-Term Assets
239.2 248.6 -4%
* WC = (Accounts Receivable + Inventory - Accounts Payable)

Q1 SEGMENT RESULTS:
BSI and BEST GAAP Performance
[$ m] Q1 2015 Q1 2014 Δ
REVENUE
Scientific Instruments (BSI) 327.5 393.9 -17%
Organic Revenue Growth (%) -3.6% 6.6%
Energy & Supercon Technologies (BEST) 27.5 34.8 -21%
Organic Revenue Growth (%) -4.1% 7.4%
Corporate Eliminations -1.5 -5.0
Total Revenue 353.5 423.7 -17%
OPERATING INCOME
Scientific Instruments (BSI) 13.7 16.6 -17%
Energy & Supercon Technologies (BEST) 1.0 2.8 -64%
Corporate Eliminations 0.5 1.2
Total Operating Income 15.2 20.6 -26%
20 © Bruker Corporation
Sum of items may not total due to rounding