Embed Size (px)
Citation preview

Principal Financial Group®
February 2017

A non-GAAP financial measure is a numerical measure of performance, financial position, or cash flows that includes adjustments from a comparable financial measure presented in accordance with U.S. GAAP. The company uses a number of non-GAAP financial measures that management believes are useful to investors because they illustrate the performance of the company’s normal, ongoing operations which is important in understanding and evaluating the company’s financial condition and results of operations. While such measures are also consistent with measures utilized by investors to evaluate performance, they are not, however, a substitute for U.S. GAAP financial measures. Therefore, on principal.com/investor, the company has provided reconciliations of the non-GAAP financial measures to the most directly comparable U.S. GAAP financial measure. The company adjusts U.S. GAAP financial measures for items not directly related to ongoing operations. However, it is possible these adjusting items have occurred in the past and could recur in future reporting periods. Management also uses non-GAAP financial measures for goal setting, as a basis for determining employee and senior management awards and compensation, and evaluating performance on a basis comparable to that used by investors and securities analysts. The company also uses a variety of other operational measures that do not have U.S. GAAP counterparts, and therefore do not fit the definition of non-GAAP financial measures. Assets under management is an example of an operational measure that is not considered a non-GAAP financial measure.
Use of Non-GAAP Financial Measures
2

Certain statements made by the company which are not historical facts may be considered forward-looking statements, including, without limitation, statements as to operating earnings, net income available to common stockholders, net cash flows, realized and unrealized gains and losses, capital and liquidity positions, sales and earnings trends, and management’s beliefs, expectations, goals and opinions. The company does not undertake to update these statements, which are based on a number of assumptions concerning future conditions that may ultimately prove to be inaccurate. Future events and their effects on the company may not be those anticipated, and actual results may differ materially from the results anticipated in these forward-looking statements. The risks, uncertainties and factors that could cause or contribute to such material differences are discussed in the company’s annual report on Form 10-K for the year ended Dec. 31, 2015 , and in the company’s quarterly report on Form 10-Q for the quarter ended Sep. 30, 2016, filed by the company with the U.S. Securities and Exchange Commission, as updated or supplemented from time to time in subsequent filings. These risks and uncertainties include, without limitation: adverse capital and credit market conditions may significantly affect the company’s ability to meet liquidity needs, access to capital and cost of capital; conditions in the global capital markets and the economy generally; volatility or declines in the equity, bond or real estate markets; changes in interest rates or credit spreads or a sustained low interest rate environment; the company’s investment portfolio is subject to several risks that may diminish the value of its invested assets and the investment returns credited to customers; the company’s valuation of investments and the determination of the amount of allowances and impairments taken on such investments may include methodologies, estimations and assumptions that are subject to differing interpretations; any impairments of or valuation allowances against the company’s deferred tax assets; the company’s actual experience could differ significantly from its pricing and reserving assumptions; the pattern of amortizing the company’s DAC and other actuarial balances on its universal life-type insurance contracts, participating life insurance policies and certain investment contracts may change; the company may not be able to protect its intellectual property and may be subject to infringement claims; the company’s ability to pay stockholder dividends and meet its obligations may be constrained by the limitations on dividends or distributions Iowa insurance laws impose on Principal Life; changes in laws, regulations or accounting standards; results of litigation and regulatory investigations; from time to time the company may become subject to tax audits, tax litigation or similar proceedings, and as a result it may owe additional taxes, interest and penalties in amounts that may be material; applicable laws and the company’s certificate of incorporation and by-laws may discourage takeovers and business combinations that some stockholders might consider in their best interests; competition from companies that may have greater financial resources, broader arrays of products, higher ratings and stronger financial performance; a downgrade in the company’s financial strength or credit ratings; changes in investor preferences; inability to attract and retain qualified employees and sales representatives and develop new distribution sources; international business risks; fluctuations in foreign currency exchange rates; the company may need to fund deficiencies in its “Closed Block” assets that support participating ordinary life insurance policies that had a dividend scale in force at the time of Principal Life’s 1998 conversion into a stock life insurance company; the company’s reinsurers could default on their obligations or increase their rates; risks arising from acquisitions of businesses; and a computer system failure or security breach could disrupt the company’s business and damage its reputation.
Forward Looking Statements
3

26%
24% 15%
16%
13% 6%
RIS - Fee
Principal GlobalInvestors
PrincipalInternational
RIS - Spread
SpecialtyBenefits
Individual Life
Operating Earnings1
$1,887.6 million As of Dec. 31, 2016
Fortune 500 company; 137 year history A Leading Financial Services Company
67%
24%
9% Principal GlobalInvestors
PrincipalInternational &Other PFGEntitiesThird Party AssetManagers
Assets Under Management2
$591.6 billion As of Dec. 31, 2016
1 Trailing Twelve Months. Pre-tax. Results exclude Corporate. 2 Assets under management by asset manager. 4
Company Overview
Fee
Spread
Risk

Segment Reporting Structure
Principal Financial Group Dan Houston CEO
Deanna Strable CFO
Retirement & Income
Solutions (RIS) Nora Everett
President
Principal Global Investors (PGI)
Jim McCaughan President
U.S. Insurance Solutions (USIS) Amy Friedrich/Greg Linde
SVP
Corporate
Management team averages 30 years of industry experience
Principal International (PI)
Luis Valdes President
RIS – Fee RIS – Spread
Specialty Benefits Life
5
Company Overview

6
Where we compete More than 70 countries around the world
As of 12/31/2016
Asset management, retirement/long-term savings, risk protection
Asset management, retirement/long-term savings
Asset management
Company Overview

*As of 12/2017
Experienced Management Team
7
Company Overview
Name Age* Title (Industry/PFG)*__
Daniel J. Houston 56 Chairman, President & Chief Executive Officer 33/33 Nora M. Everett 58 President - Retirement & Income Solutions 26/26 James P. McCaughan 64 President - Global Asset Management 43/15 Deanna D. Strable 49 Executive VP & President - U.S. Insurance Solutions 28/28 Luis E. Valdes 60 President - International Asset Management and Accumulation 29/26 Timothy M. Dunbar 60 Executive VP & Chief Investment Officer 36/31 Terrance J. Lillis 65 Executive VP & Chief Financial Officer 35/35 Gary P. Scholten 60 Executive VP & Chief Information Officer 37/37 Karen E. Shaff 63 Executive VP, General Counsel & Secretary 35/35 Elizabeth S. Brady 57 Senior VP & Chief Marketing Officer 33/4 Gregory B. Elming 57 Senior VP & Chief Risk Officer 35/35 Elizabeth L. Raymond 51 Senior VP & Chief Human Resources Officer 26/17

Sources: 1Pensions & Investments, “The Best Places to Work in Money Management among companies with our size category”, PFG recognition 12/12/2016. 2Asociacion de Administradóras de Fondos Mutuos De Chile, June 2016. 3The 5th largest manager of domestic real estate equity (net of leverage), out of 66 managers profiled. Managers ranked by U.S. institutional, tax-exempt assets managed internally, as of Jun. 30, 2016. “Real Estate Managers”, PENSIONS & INVESTMENTS, Oct 3, 2016. 4 12th largest manager of high yield securities, out of 85 managers profiled. Managers ranked by U.S. institutional, tax-exempt assets managed internally, as of Dec. 31, 2015 “Largest Money Managers”, PENSIONS & INVESTMENTS, May 30, 2016. 5March 28, 2016, U.S. Environmental Protection Agency, Principal Real Estate Investors awarded. 6 PLANSPONSOR Recordkeeping Survey, June 2016. 7AUM among multi-country pension providers. 8CONSAR, September 2016. 9Ranking in terms of AUM for PGBL and VGBL products, Fenaprevi. September 2016. 10Gadbury Group MPF Market Share Report, September 2016. 11PLANSPONSOR Defined Benefit Administration Survey, May 2015. 12PLANSPONSOR Recordkeeping Survey, June 2016. 13PLANSPONSOR NQDC Buyer’s Guide, July 2015. 14LIMRA 2015 survey: Non-medical based on fully insured employer contracts in force. 15 LIMRA 2015 survey: Individual Disability Insurance (IDI) rank based on in-force premium
Industry Leadership
Global Retirement and Long-Term Savings
Risk Protection
Global Asset Management
#1 Non-qualified deferred compensation13
#4 Non-medical coverages14 #5 Individual Disability
Insurance15
#4 provider of DC plans6
#2 Pension provider in Latin America7 #7 AFORE – Mexico8
Brasilprev #1 market share – Brazil9
#5 MPF provider – Hong Kong10
#1 provider of DB plans11
#1 provider of ESOP plans12
Best Place to Work in Money Mgmt1 #1 APV – Chile Funds2
Top 10 manager Real Estate3 12th largest manager High Yield4
ENERGY STAR Partner of the Year5
8
Company Overview

Current Ratings (As of January 2017)
Ratings related to Principal Life Insurance Company and Principal National Life Insurance Company.
9
Company Overview
Moody’s Investors Service ‘A1’, Good – fifth highest of 21 rating levels. Outlook: Stable
Fitch Ratings ‘AA-’, Very Strong – fourth highest of 19 rating levels. Outlook: Stable
Standard & Poor’s ‘A+’, Strong – fifth highest of 20 rating levels. Outlook: Stable
A.M. Best ‘A+’, Superior – second highest of 13 rating levels. Outlook: Stable

Strong business fundamentals
10 1Department of Labor & Cerulli Associates, 2015. 2For trailing 12 months. 3Defined contribution and defined benefit.
Net cash flow as a percent of beginning of year account value (2011-2015 average)
- 0.1%
+2.4%
Industry1 Principal
4Q 2012
4Q 2016 CAGR
RIS total account value $172B $231B 8%
RIS-Fee return on net revenue2 30.6% 32.7%
RIS-Spread return on net revenue2 56.8% 61.3%
Participants3 3.9M 5.1M 7%
Retirement & Income Solutions

Customer-Centric Business Model
Bundled
Unbundled
Small Case Large Case
BU
SIN
ESS
MO
DEL
TARGET MARKET
MetLife
Nationwide
John Hancock
ING/VOYA
Transamerica Great West
Mass Mutual
Fidelity T.Rowe Price
Prudential
Vanguard
Wells Fargo
11
Retirement & Income Solutions (RIS – Fee)

0
5
10
15
20
25
UNITED STATES 2nd THROUGH 10thLARGEST
MARKETS COMBINED
$ Tr
illio
ns
Defined Contribution
+ IRA
Defined Benefit
Source: Retirement Markets 2015, Retirement Research Inc., April 2015
Retirement market opportunities RETIREMENT READINESS: • New plan formation • Non-participants • Under-saved INCOME SOLUTIONS: • Yield/Income • Outcomes:
−Longevity −Market volatility −Inflation
The Top Retirement Market in the World
12
Retirement & Income Solutions (RIS – Fee)

Principal Total Retirement Suite SM Still a differentiator
All rankings sourced from PLANSPONSOR magazine as follows – Defined Benefit: DB Administration Survey 05/15; Defined Contribution and ESOP: Recordkeeping Survey 06/16; Nonqualified Deferred Compensation: PLANSPONSOR NQDC Buyer’s Guide, July 2015
Defined Benefit
#1 DB provider
(by # of clients)
Defined Contribution
#4 DC plan recordkeeper
(by # of plans)
Employee Stock Ownership Plan
#1 ESOP plan recordkeeper
(by # of plans)
Nonqualified Plans
#1 Deferred Comp provider
(by # of plans)
13
Retirement & Income Solutions (RIS – Fee)

2.9 3.0 3.4 3.6 4.2
2.5 1.8 1.8 1.9 2.3
2.6 3.1 1.9 1.9
2.6
3.3 2.7 2.2 2.5
3.3
-1.0
1.0
3.0
5.0
7.0
9.0
11.0
13.0
2012 2013 2014 2015 2016
$ B
illio
ns1 4th Quarter
3rd Quarter2nd Quarter1st Quarter
Balanced Sales Approach
14
Retirement & Income Solutions (RIS – Fee)
11.3
12.4
9.9 9.3
10.6
1 Transfer deposits

3.7 4.1 4.3 4.8 5.0
3.5 4.2 4.3 4.6 4.9
3.3 3.6 4.1
4.3 4.6 3.4 3.8
4.1 4.2
4.5
0
2
4
6
8
10
12
14
16
18
20
2012 2013 2014 2015 2016
$ B
illio
ns2
1st Quarter 2nd Quarter 3rd Quarter 4th Quarter
• People making a deferral +40%1
• Avg deferral per member +10%1
• People receiving a match +45%1
The Power of Payroll Deduction
13.9
15.7 16.8 17.9
1 4Q11 compared to 4Q16 2 Recurring deposits
19.0
15
Retirement & Income Solutions (RIS – Fee)
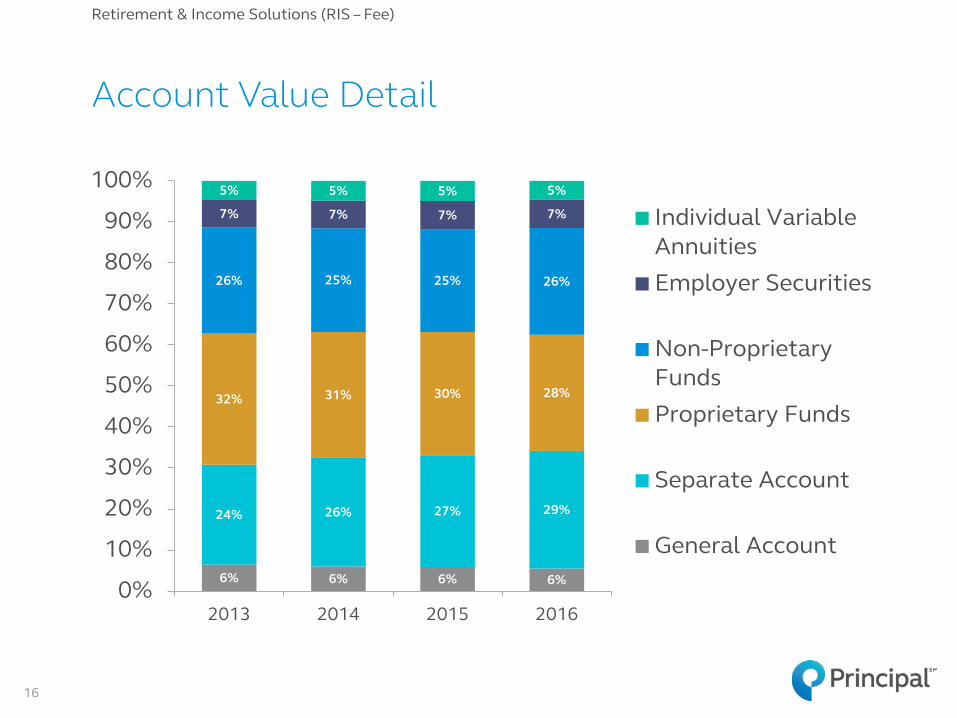
6% 6% 6% 6%
24% 26% 27% 29%
32% 31% 30% 28%
26% 25% 25% 26%
7% 7% 7% 7%
5% 5% 5% 5%
0%
10%
20%
30%
40%
50%
60%
70%
80%
90%
100%
2013 2014 2015 2016
Individual VariableAnnuitiesEmployer Securities
Non-ProprietaryFundsProprietary Funds
Separate Account
General Account
Account Value Detail
16
Retirement & Income Solutions (RIS – Fee)

Multiple Businesses Leverage Success Revenue sourced from 401(k) platform ($Billions)
Variable Annuities, RIS – Spread, PGI, and Individual Life are all beneficiaries
17
0.0
0.5
1.0
1.5
2.0
2.5
3.0
3.5
2016 2021E
$Bill
ions
Other PFG businessesDefined contribution
$0.6B
$0.4B
Retirement & Income Solutions (RIS – Fee)

Innovative Solutions: Solving Income Needs
MULTI-PRODUCT SOLUTION SET
• “Through Retirement” Lifecycle Funds • Mutual Funds that: ‒Generate income ‒Preserve capital ‒Protect against inflation ‒Address market volatility
• Annuities to provide: ‒Fixed returns ‒Guaranteed income ‒Protection against volatility
• Bank products • Full Service Payout ‒Defined Benefit plan terminations
ACCUMULATION RETIREMENT INCOME
OUR APPROACH: • Education • Planning assistance
(RetireSecure®)
• Full array of options • Innovative solutions
18
Retirement & Income Solutions

$59 B
$189 B
19
$143 B
Diversified Global Asset Management Organization
$391B
Fixed Income Equity Alternatives
19
of AUM1
• Broad range of investors in over 70 countries
• Offices in major money centers worldwide
• Long commitment to corporate stewardship; signatory to United Nations’ Principles for Responsible Investment (PRI)
• Principal ranked among top companies with 1,000+ employees in Pensions & Investments’ Best Places to Work in Money Management, for the last four years2
1AUM as of 12/31/2016. 2Pensions & Investments, “The Best Places to Work in Money Management among companies with our size category”, PFG recognition 12/12/2016.
Principal Global Investors

Global leadership in funds
20 20
PGI/Funds integration makes Principal a global destination for funds • $176B in AUM across U.S. and International platforms, as well as
various private funds1
• Strong performance across boutiques and strategies
• Well positioned in Active and Smart Beta ETFs
Key functions aligned globally • Distribution, governance and operations
Capabilities compelling to big intermediaries
• Focus on global consultants, global distributors, U.S. wirehouses, U.S. independent broker-dealers and RIAs2, private banks
Work closely with PI in their local markets
1As of 12/31/2016. Includes Principal Funds, PGI Trust CITs, PGI Dublin Funds, PGI Australia Funds, and various boutique-level funds. 2RIA: Registered Investment Advisor.
Principal Global Investors

Morningstar rankings Percentage of funds in the top two quartiles
Top Tier Investment Performance
88% 89% 93%
59%
90% 86%
51%
76%
86%
1-Year 3-Year 5-Year
12/31/2015 09/30/2016 12/31/2016
Principal “I” shares; if no “I” share class then “A” share class; separate accounts use “R6” rate level; Includes Principal mutual funds, separate accounts and collective investment trusts (CITs); Excludes money market, stable value and U.S. Property separate account.
4 OR 5 STARS = 36 FUNDS 3 STARS 19 FUNDS
2 STARS 3 FUNDS
1 STAR 1 FUND
of rated funds have 4 or 5 star rating
61%
21
Principal Global Investors

Wells Fargo Merrill Lynch Morgan Stanley Raymond James Principal Securities Inc
Top 5 distributors Top 5 U.S. strategies
Distribution – Principal Funds
1 AUM figures include both Retail and Retirement AUM and remove double counting for fund-of-fund assets. As of 12/31/2016.
Success through engaging distributors and advisors across channels
AUM (1) 5-Yr AUM CAGR
Target Date $25.9B 8.5%
Dynamic Outcome Strategies $14.0B 33.6%
Strategic Asset Management $13.9B 9.5%
Midcap $10.9B 44.2%
Preferred Securities $5.2B 15.5%
22
Principal Global Investors

• Strong teams, representing all boutiques
• Close partnership with product specialists in the boutiques
• Broad range of specialist investment capabilities enables us to attract top sales talent
• #30 on Institutional Investor Top 3001
Global Distribution Institutional
$110.2 $114.7
$122.0 $130.6
2013 2014 2015 2016
Principal Global Investors Institutional AUM
($ in billions)
1 Managers ranked by total assets under management. II 300 America’s Top 300 Money Manager, Institutional Investor, July 2016, data as of 12/31/2015. 23
Principal Global Investors
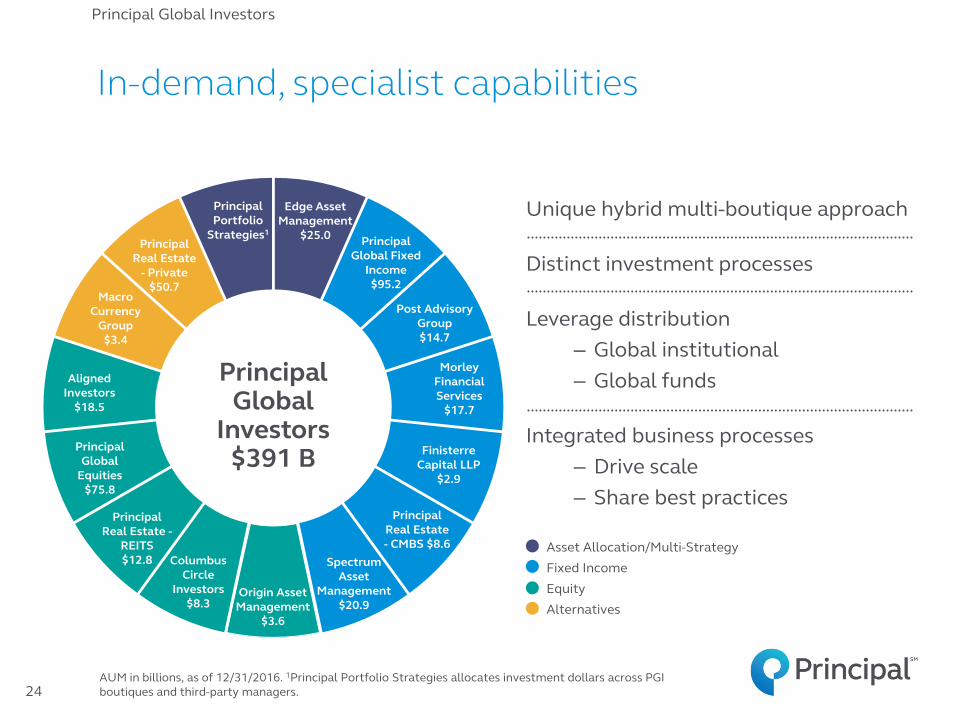
In-demand, specialist capabilities
Principal Global
Equities $75.8
Principal Portfolio
Strategies1
Principal
Global Fixed Income $95.2
Finisterre Capital LLP
$2.9
Principal Global
Investors $391 B
Principal Real Estate
- Private $50.7
Morley Financial Services
$17.7
Edge Asset Management
$25.0
Post Advisory Group $14.7
Columbus Circle
Investors $8.3
Origin Asset Management
$3.6
Spectrum Asset
Management $20.9
Macro Currency
Group $3.4
Principal Real Estate -
REITS $12.8
Principal Real Estate - CMBS $8.6
Aligned Investors
$18.5
Unique hybrid multi-boutique approach
Distinct investment processes
Leverage distribution – Global institutional – Global funds
Integrated business processes – Drive scale – Share best practices
24
Asset Allocation/Multi-Strategy Fixed Income Equity Alternatives
AUM in billions, as of 12/31/2016. 1Principal Portfolio Strategies allocates investment dollars across PGI boutiques and third-party managers.
Principal Global Investors

• Industry leader in delivering solutions, including multi-asset solutions
• Strong and growing suite of alternatives
• Early entrant in the Active ETF space
• Hybrid, Passive and Indexed offerings on retirement platform of the Principal Financial Group
• With boutiques across asset classes, sector rotation presents opportunities
Well-Positioned for Industry Trends
Generate Income
Manage Volatility
Protect Purchasing
Power
Client Needs
25
Principal Global Investors

Our Locations We operate in emerging markets with a fast growing middle class
26
Principal International
(Year) = Principal entered country
PI Sourced AUM as of 12/31/2016
Principal Financial
Group Mexico (1993)
• Annuities, Mutual Funds, Pensions, Asset Management
• AUM of $8.7B • Wholly owned
Chile (1995) • Annuities, Mutual Funds, Asset
Management, Mandatory Pensions, Voluntary Pensions
• AUM of $41.7B • Wholly owned • Cuprum – a 98% majority owned
company AUM of $35.5B
Brazil (1999) • Annuities, Pensions,
Mutual Funds, Asset Management
• Brasilprev – a 25% owned joint venture with Banco do Brasil
AUM of $61.8B • Claritas – 100% owned
mutual fund company AUM of $1.3B
India (2000) • Asset Management,
Mutual Funds, Advisory Services
• AUM of $0.7B • 79% majority owned
company with Punjab National Bank
Malaysia (2003) • Conventional & Islamic
Asset Management, Mutual Funds, Pensions
• AUM of $12.0B • CIMB-Principal – 40%
owned joint venture with CIMB Group; 50% owned Islamic company with CIMB
China (2005) • Asset Management,
Mutual Funds • AUM of $101.3B • CCB-Principal – a 25%
owned joint venture with China Construction Bank
Hong Kong (1996) • Asset Management,
Mutual Funds, Pensions • AUM of $7.6B • AXA – Transaction closed
9/1/2015 adding AUM of $3.1B
• Wholly owned
Thailand (2010) • Asset Management, Mutual Funds • AUM of $2.9B • Wholly owned subsidiary of Malaysian JV
Indonesia (2007) • Asset Management,
Mutual Funds • AUM of $0.4B • Wholly owned
subsidiary of Malaysian JV
Singapore (2006) • Asset Management • AUM of $5.7M • Wholly owned
subsidiary of Malaysian JV

Country 2014 rank 2019E rank
2024E rank
2030E rank
U.S. #1 #1 #1 #2
China #2 #2 #2 #1
Brazil #7 #7 #6 #5
India #9 #5 #4 #3
Mexico #15 #14 #13 #13
Indonesia #16 #15 #15 #12
$64 $102
$400
2012 2020 2050
2014 2030 16 year CAGR
$34 Trillion $100 Trillion 7%
Total GDP for Six Listed Countries
6.0% CAGR
Global Asset Management Industry Projected AUM
In Trillions
4.7% CAGR
Sources: Asset Management 2020: A Brave New World, PwC, 2014; The age of asset management? Speech by Andrew G Haldane, Executive Director, Financial Stability, Bank of England, at the London Business School, London, 4 April 2014.) ; http://www.cebr.com/reports/world-economic-league-table-2015/
High Growth High Potential Markets
27
Principal International

Joint Venture Partner Partner’s Industry Ranking Partner’s Distribution Reach
Banco do Brasil Largest bank in Latin America(1)
5,430 branches (2)
65 million customers (2)
2nd largest listed bank in world(1)
14,917 branches (3)
341 million retail customers (3)
5th largest banking group in ASEAN (4)
992 branches (4)
12 million retail customers(4)
2nd largest Nationalized bank in India(5)
6,560 branches (6)
104 million retail customers (6)
SOURCE: (1) S&P Global Market Intelligence, 4/11/2016 in terms of total assets; (2) Banco do Brasil 3Q 2016 Historical Data IR site; (3) CCB 2015 Annual Report (4) CIMB Group 2015 Annual Report; (5) Indian Banks’ Association March 2016 in terms of assets; (6) PNB 2015 Annual report – customer count based on customer accounts
Leveraging Strong Marquee Partners Principal International
28

Proven Strength & Success
BRAZIL MEXICO CHILE
Brasilprev: #1 in net
deposits and total market
share
7th largest AFORE (by AUM)
#1 APV: PI Chile and
Cuprum
Principal is 2nd Largest Pension Provider in Latin America
Brazil source: Ranking in term of AUM for PGBL and VGBL products, Fenaprevi September 2016. Mexico source: CONSAR September 2016. Chile source: Asociacion de Administradóras de Fondos Mutuos De Chile September 2016. Principal is 2nd largest pension provider in Latin America by AUM among multi-country pension providers. 29
Principal International

Building a Strong Foundation
*Mandatory Provident Fund. Malaysia source: Lipper. Percentage of market share as of December 2016. Hong Kong source: Gadbury Group MPF Market Share Report as of September 2016. China source: East Money. Based on AUM as of December 2016. India source: Company data/media tracking at launch 11/12
HONG KONG
5th largest MPF provider
MALAYSIA
#2 in PRS
CHINA
#6 in Mutual Funds
INDIA
1st mover in advisory services business
30
Principal International

Focus on the SMB market Solutions for business owners, employers, and individuals
• Business Owner Executive Solutions (life & disability)
Business Owners Individuals Employers
• Group Insurance (dental, vision, disability, life)
• Multi-life Disability • Nonqualified Deferred
Compensation
• Group Voluntary Insurance (dental, vision, disability, life, critical illness)
• Individual Disability Insurance • Individual Life Insurance • Individual Dental
U.S. Insurance Solutions
31

2015 Market Share
2015 Industry
Rank Specialty Benefits • Total Group In-Force Contracts 7.5% #4
• Life 10.2% #3
• Disability 7.9% #5
• Dental 5.1% #7
• Individual Disability In-Force Premium 9.5% #5
• Individual Disability New Sales Premium 15.8% #3
Individual Life • Non-Qualified Plans1 13.9% #1
• Total Life New Sales Premium 1.5% #20
Success Reflects Expertise Serving SMB Market
Nonqualified Plans ranking from PLANSPONSOR Buyers Guide Survey, July 2015. All other rankings are from LIMRA 2015. 1Excludes governmental 457 plans. 2Based on LIMRA 2014 data
32
U.S. Insurance Solutions

BOES 28%
ER/NQ 25%
Individual 47%
Solutions for businesses, business owners and key executives
Business owners’ financial challenges • Exiting the business • Business transition • Retaining key employees • Retirement planning
Solutions for key employees • Retirement income • Survivor income • Business protection
Focus on the Business Market
2016 Sales
BOES = Business Owner/Executive Solutions ER/NQ = Employer/Non-qualified
33
U.S. Insurance Solutions: Individual Life

5.6%
10.9%
3.1% 1.6%
Group Benefits Individual DI
The Principal Industry
Balanced Portfolio and Above Industry Premium Growth
2016 Total Premium & Fees
Group Benefits
81%
• Stable loss ratios • Attractive margins • ROE of 14% +
Source: LIMRA 2012-2015
3 Year In-Force Premium Growth (2012 – 2015 CAGR)
34
U.S. Insurance Solutions: Specialty Benefits Insurance
Group Disability
27%
Dental/ Vision 47%
Group Life 26%
Group Benefits
83%
Individual Disability
17%

U.S. Distribution Overview
PRINCIPAL CONNECTION
• 70 counselors with focus on education
PRINCIPAL ADVISOR
NETWORK
• 1,200 advisors • Sell all products • Financial
Planning Focused
BANKS INSURANCE-ORIENTED
INVESTMENT-ORIENTED
• Wirehouses • Regional
Broker/Dealers • Planners
• Brokerage General Agents
• Insurance Producers
• Banks • Broker/
Dealers • Marketers
THIRD PARTY PROPRIETARY
Global Firm Relations Select 3rd party distributors with dedicated support
STRENGTHENS RELATIONSHIPS AND FUELS SALES GROWTH
All supported by DEDICATED SERVICE TEAMS providing education, training, counseling and retention
WHOLESALE CHANNELS Group
Benefits Retirement Investment Solutions Annuities NQDC
Disability Insurance
Retail Life ESOP
35
Distribution

Broad and Deep Distribution Proprietary provides foundation; 3rd party provides accelerated growth
Product Line New Sales 1st 2nd 3rd Top 3
Represent
NQ Life 38% Retail Life 58% Individual Disability Plus Group 38%
Group Benefits 10% Fixed Annuities 74% Variable Annuities KeyCorp Ins.
Agency 97%
Mutual Funds 19% FSA – New Sales Assets 30%
FSA – New Sales Case Counts 34%
Highland Capital Brokerage
Principal Advisor Network
Principal Advisor Network
Principal Advisor Network
Principal Advisor Network
Principal Advisor Network
Principal Advisor Network
Rankings and percentages as of 12/31/2016
36
Distribution

Corporate Public Bonds
28%
Corporate Private Bonds
16%
CMBS
5%
Commercial Mortgages
15% MBS
6% ABS
5%
Government, Agency, State & Political
10%
Other1
11% Cash
4%
1Other includes Equity Securities, Residential Mortgages, Real Estate, Policy Loans, Investment in Equity Method subs, Direct Finance Leases and Other Investments
Investment philosophy & strategy
Our strategy hasn’t changed:
High quality, well-diversified portfolio Liability-driven investment approach Active asset/liability management Optimized risk adjusted yields and returns Global collaboration and best practices Portfolio responsibility remains at local country
Total PFG as of 12/31/2016 GAAP carrying value
Diversified investment portfolio Total invested assets & cash
$78.6B Total invested assets & cash
37
Investments

Continual shift in mix of business leading to a higher ROE and more free cash flow
68%
12%
20%
2016
Operating Earnings After tax
Power of our Fee-Based Model
30%
40%
30%
2001
Fee Spread Risk
Fee includes Retirement & Income Solutions – Fee, Principal Global Investors, and Principal International. Spread includes Retirement & Income Solutions - Spread. Risk includes U.S. Insurance Solutions.
38
Financials

Returning Capital to Shareholders
• Less capital needed to support organic growth • Moving to higher dividend payout ratio • Diligently pursuing active acquisition opportunities • Opportunistically buying back shares
Organic Growth Dividends Available Capital
Current Targeted 2007
50%
25%
25%
34% 33%
33%
30% 40%
30%
(Acquisitions & share buybacks)
39
Financials

Grow capital • Organic growth • Mergers and
acquisitions (M&A)
Expect to deploy 65–70% of our net income over the long-term, with fluctuations in any given year
Balanced capital deployment strategy
Return capital • Common
stock dividends • Share repurchases
Optimize capital structure • Financial flexibility
40
Long-term financial outlook
Financials

Driving ROE Growth Earnings
+ 4-5% for market performance
+ 4-5% for growth from sales/NCF
+ 1-2% operational efficiency
• Organic growth • Dividend growth • Opportunistic
share repurchases
ROE =
30-60 bps average annual ROE
improvement
Equity
41
Financials

Executing on our strategy to increase our global footprint and fee-based earnings
We’ve Played Offense Since the Recession
Opportunity Year
Announced Rationale
AXA Hong Kong Pension 2014
15 year exclusive distribution with 4,440 agents
Gateway into China
2012 Complete offering in Chile
with marquee pension and savings franchise
2012 Entry into Brazil mutual
fund and asset management market
2011 Enhance global equity investment capabilities
2011 Establish leadership in
emerging markets fixed income investing
2011 Solidify position as a leader in Mexican Afore market
BrasilPrev 2010 23 year extension of
successful JV with Banco do Brasil
Emerged from financial crisis in a position of strength and flexibility
AFORE
42
Financials

Capital Deployment
Deployed $480 million
$287 $150
$50
Deployed $855 million
$375
$200
$180
$100
Long term: expect to deploy 65–70 percent of our net income with fluctuations in any given year
Deployed $1.1 billion
$441
$275
$355
43
Financials
Deployed $856 million
$465 $257
$40 $94
2013 2014 2015 2016
Common Stock Dividends Share Repurchases Strategic Acquisition Surplus Note Redemption
$ in millions

If macroeconomics change by…
Equity market return +/- 10%
Interest rates
+/- 100 bps FX: US dollar
changes +/- 2%
Then Principal’s annual pre-tax operating earnings will change by…
+/- 4-6%1 +/- < 1%2 -/+ < 1%3
And the primary businesses impacted are…
RIS – Fee RIS – Spread PI
PGI Individual Life
SBD
1 Assumes an immediate 10% change in the S&P 500 followed by 2% growth per quarter thereafter. 2 Excludes the impact of actuarial unlockings. 3 Principal is primarily impacted by changes in Latin American and Asian currencies. Inverse relationship between movement of the US dollar and impact to Operating Earnings.
What if things don’t go as expected?
44
Changes in key macroeconomic conditions have an impact on Principal’s annual pre-tax operating earnings
Long-term financial outlook
Financials
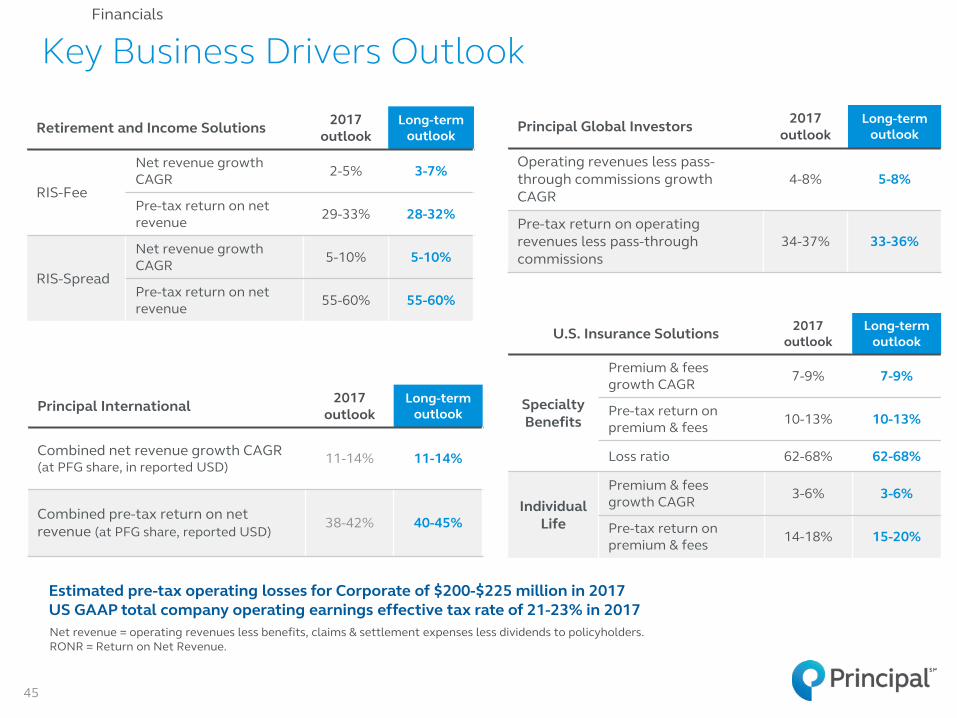
Key Business Drivers Outlook
Net revenue = operating revenues less benefits, claims & settlement expenses less dividends to policyholders. RONR = Return on Net Revenue.
Estimated pre-tax operating losses for Corporate of $200-$225 million in 2017 US GAAP total company operating earnings effective tax rate of 21-23% in 2017
45
Financials
Retirement and Income Solutions 2017 outlook
Long-term outlook
RIS-Fee
Net revenue growth CAGR 2-5% 3-7%
Pre-tax return on net revenue 29-33% 28-32%
RIS-Spread
Net revenue growth CAGR 5-10% 5-10%
Pre-tax return on net revenue 55-60% 55-60%
Principal International 2017 outlook
Long-term outlook
Combined net revenue growth CAGR (at PFG share, in reported USD) 11-14% 11-14%
Combined pre-tax return on net revenue (at PFG share, reported USD)
38-42% 40-45%
Principal Global Investors 2017 outlook
Long-term outlook
Operating revenues less pass-through commissions growth CAGR
4-8% 5-8%
Pre-tax return on operating revenues less pass-through commissions
34-37% 33-36%
U.S. Insurance Solutions 2017 outlook
Long-term outlook
Specialty Benefits
Premium & fees growth CAGR 7-9% 7-9%
Pre-tax return on premium & fees 10-13% 10-13%
Loss ratio 62-68% 62-68%
Individual Life
Premium & fees growth CAGR 3-6% 3-6%
Pre-tax return on premium & fees 14-18% 15-20%

Non-GAAP Financial Measure Reconciliations
Pre-tax operating earnings (losses):
Trailing twelve
months, 31-Dec-16
Pre-tax operating earnings, excluding Corporate $1,887.6Pre-tax operating earnings - Corporate (218.9)Pre-tax operating earnings - PFG 1,668.7
Pre-tax net realized capital gains, as adjusted 46.3Pre-tax other adjustments -86.4
Certain adjustments related to equity method investments and noncontrollinginterest (36.9)Income before income taxes $1,591.7
Financials
46