Embed Size (px)
Citation preview
1
2030 Strategic Plan and
2014-2018 Business Plan
Maria das Graças Silva Foster
CEO
2
FORWARD-LOOKING STATEMENTS:
DISCLAIMER
The presentation may contain forward-looking statements about future events within the
meaning of Section 27A of the Securities Act of 1933, as amended, and Section 21E of
the Securities Exchange Act of 1934, as amended, that are not based on historical facts
and are not assurances of future results. Such forward-looking statements merely reflect
the Company’s current views and estimates of future economic circumstances, industry
conditions, company performance and financial results. Such terms as "anticipate",
"believe", "expect", "forecast", "intend", "plan", "project", "seek", "should", along with
similar or analogous expressions, are used to identify such forward-looking statements.
Readers are cautioned that these statements are only projections and may differ
materially from actual future results or events. Readers are referred to the documents
filed by the Company with the SEC, specifically the Company’s most recent Annual
Report on Form 20-F, which identify important risk factors that could cause actual results
to differ from those contained in the forward-looking statements, including, among other
things, risks relating to general economic and business conditions, including crude oil and
other commodity prices, refining margins and prevailing exchange rates, uncertainties
inherent in making estimates of our oil and gas reserves including recently discovered oil
and gas reserves, international and Brazilian political, economic and social
developments, receipt of governmental approvals and licenses and our ability to obtain
financing.
We undertake no obligation to publicly update or revise any forward-looking
statements, whether as a result of new information or future events or for any
other reason. Figures for 2014 on are estimates or targets.
All forward-looking statements are expressly qualified in their entirety by this
cautionary statement, and you should not place reliance on any forward-looking
statement contained in this presentation.
NON-SEC COMPLIANT OIL AND GAS RESERVES:
CAUTIONARY STATEMENT FOR US INVESTORS
We present certain data in this presentation, such as oil and gas resources,
that we are not permitted to present in documents filed with the United States
Securities and Exchange Commission (SEC) under new Subpart 1200 to
Regulation S-K because such terms do not qualify as proved, probable or
possible reserves under Rule 4-10(a) of Regulation S-X.
DISCLAIMER
3
2030 Strategic Plan
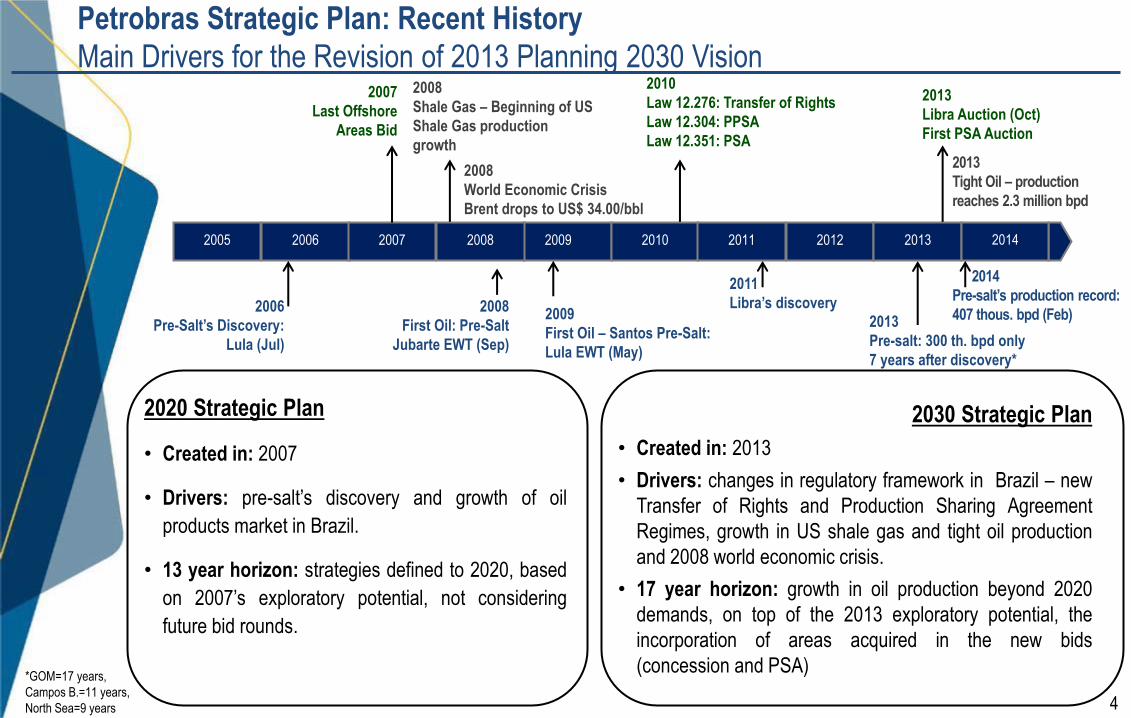
4
2030 Strategic Plan
• Created in: 2013
• Drivers: changes in regulatory framework in Brazil – new
Transfer of Rights and Production Sharing Agreement
Regimes, growth in US shale gas and tight oil production
and 2008 world economic crisis.
• 17 year horizon: growth in oil production beyond 2020
demands, on top of the 2013 exploratory potential, the
incorporation of areas acquired in the new bids
(concession and PSA)
Petrobras Strategic Plan: Recent History
Main Drivers for the Revision of 2013 Planning 2030 Vision
2005 2006
2006
Pre-Salt’s Discovery:
Lula (Jul)
2008
First Oil: Pre-Salt
Jubarte EWT (Sep)
2009
First Oil – Santos Pre-Salt:
Lula EWT (May)
2014
Pre-salt’s production record:
407 thous. bpd (Feb)
2011
Libra’s discovery
2013
Pre-salt: 300 th. bpd only
7 years after discovery*
2007 2008 2009 2010 2011 2012 2013 2014
2020 Strategic Plan
• Created in: 2007
• Drivers: pre-salt’s discovery and growth of oil
products market in Brazil.
• 13 year horizon: strategies defined to 2020, based
on 2007’s exploratory potential, not considering
future bid rounds.
2013
Libra Auction (Oct)
First PSA Auction
2007
Last Offshore
Areas Bid
2010
Law 12.276: Transfer of Rights
Law 12.304: PPSA
Law 12.351: PSA
*GOM=17 years,
Campos B.=11 years,
North Sea=9 years
2008
Shale Gas – Beginning of US
Shale Gas production
growth
2008
World Economic Crisis
Brent drops to US$ 34.00/bbl
2013
Tight Oil – production
reaches 2.3 million bpd
5
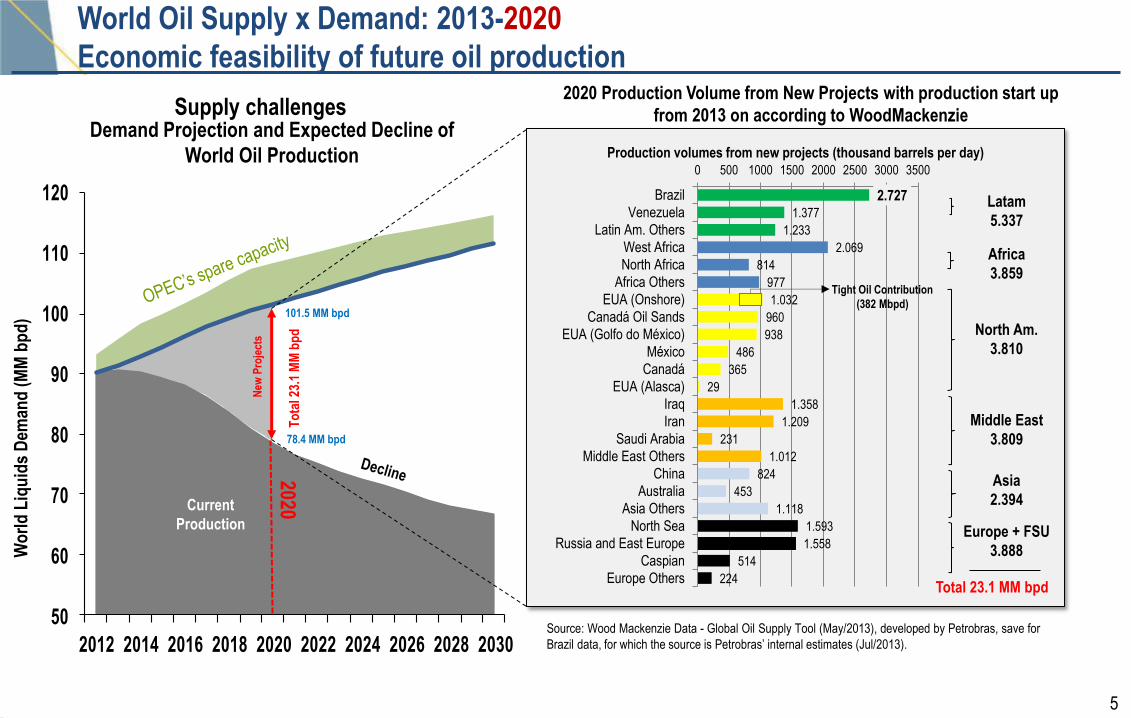
50
60
70
80
90
100
110
120
2012 2014 2016 2018 2020 2022 2024 2026 2028 2030
Demand Projection and Expected Decline of
World Oil Production
Supply challenges
New
Pro
ject
s
Current
Production
2020
To
tal 2
3.1
MM
bp
d
101.5 MM bpd
78.4 MM bpd
Wo
rld
Liq
uid
s D
eman
d (
MM
bp
d)
World Oil Supply x Demand: 2013-2020
Economic feasibility of future oil production
224
514
1.558
1.593
1.118
453
824
1.012
231
1.209
1.358
29
365
486
938
960
1.032
977
814
2.069
1.233
1.377
2.727
0 500 1000 1500 2000 2500 3000 3500
Europe Others
Caspian
Russia and East Europe
North Sea
Asia Others
Australia
China
Middle East Others
Saudi Arabia
Iran
Iraq
EUA (Alasca)
Canadá
México
EUA (Golfo do México)
Canadá Oil Sands
EUA (Onshore)
Africa Others
North Africa
West Africa
Latin Am. Others
Venezuela
Brazil
Production volumes from new projects (thousand barrels per day)
Latam
5.337
Africa
3.859
North Am.
3.810
Middle East
3.809
Asia
2.394
Europe + FSU
3.888
Total 23.1 MM bpd
Source: Wood Mackenzie Data - Global Oil Supply Tool (May/2013), developed by Petrobras, save for
Brazil data, for which the source is Petrobras’ internal estimates (Jul/2013).
Tight Oil Contribution
(382 Mbpd)
2020 Production Volume from New Projects with production start up
from 2013 on according to WoodMackenzie
6
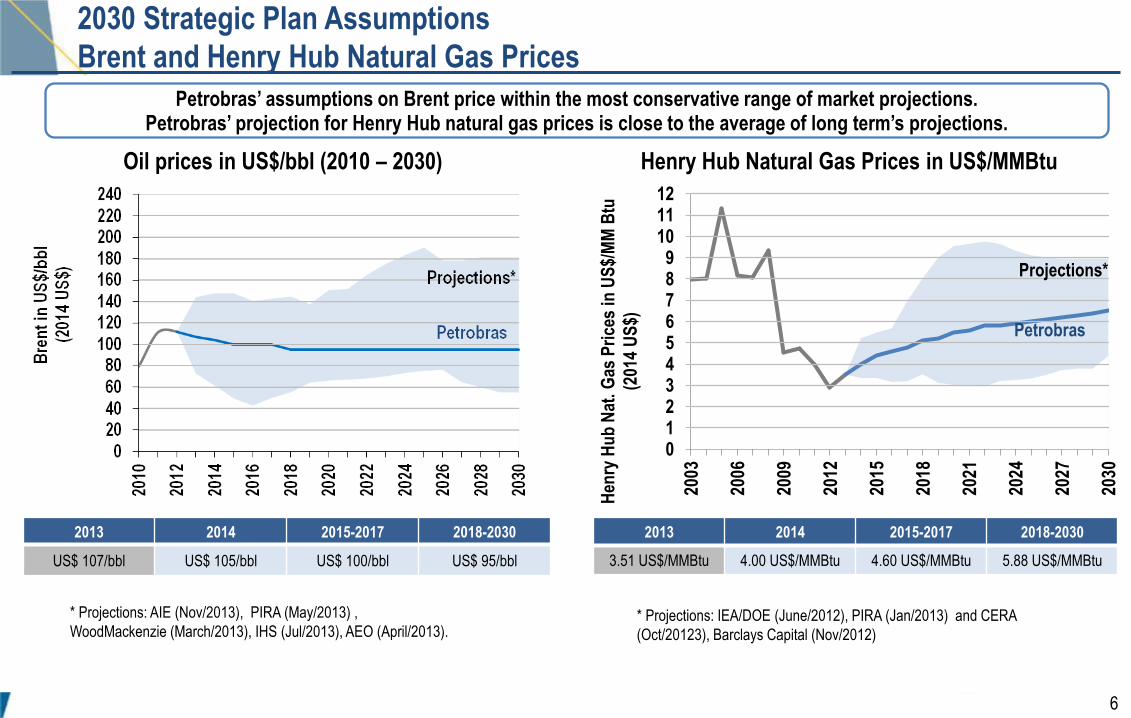
2030 Strategic Plan Assumptions
Brent and Henry Hub Natural Gas Prices
Petrobras’ assumptions on Brent price within the most conservative range of market projections. Petrobras’ projection for Henry Hub natural gas prices is close to the average of long term’s projections.
2013 2014 2015-2017 2018-2030
US$ 107/bbl US$ 105/bbl US$ 100/bbl US$ 95/bbl
Oil prices in US$/bbl (2010 – 2030)
* Projections: AIE (Nov/2013), PIRA (May/2013) ,
WoodMackenzie (March/2013), IHS (Jul/2013), AEO (April/2013).
0123456789
101112
2003
2006
2009
2012
2015
2018
2021
2024
2027
2030
Hen
ry H
ub
Nat
. G
as P
rice
s in
US
$/M
M B
tu
(201
4 U
S$)
* Projections: IEA/DOE (June/2012), PIRA (Jan/2013) and CERA
(Oct/20123), Barclays Capital (Nov/2012)
Henry Hub Natural Gas Prices in US$/MMBtu
Petrobras
2013 2014 2015-2017 2018-2030
3.51 US$/MMBtu 4.00 US$/MMBtu 4.60 US$/MMBtu 5.88 US$/MMBtu
Projections*
7
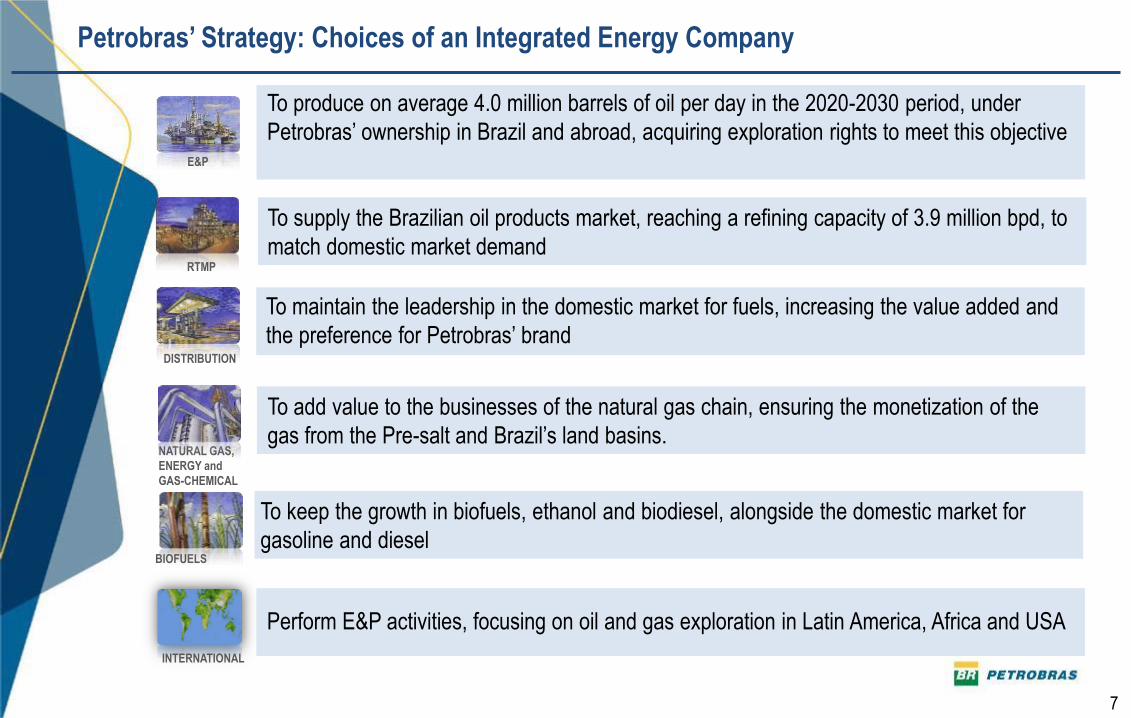
INTERNATIONAL
DISTRIBUTION
NATURAL GAS,
ENERGY and
GAS-CHEMICAL
BIOFUELS
To produce on average 4.0 million barrels of oil per day in the 2020-2030 period, under
Petrobras’ ownership in Brazil and abroad, acquiring exploration rights to meet this objective
To maintain the leadership in the domestic market for fuels, increasing the value added and
the preference for Petrobras’ brand
To add value to the businesses of the natural gas chain, ensuring the monetization of the
gas from the Pre-salt and Brazil’s land basins.
To keep the growth in biofuels, ethanol and biodiesel, alongside the domestic market for
gasoline and diesel
RTMP
To supply the Brazilian oil products market, reaching a refining capacity of 3.9 million bpd, to
match domestic market demand
Perform E&P activities, focusing on oil and gas exploration in Latin America, Africa and USA
E&P
E&P
Petrobras’ Strategy: Choices of an Integrated Energy Company
8
Source: Petrobras – Dec/2013 – E&P-CORP
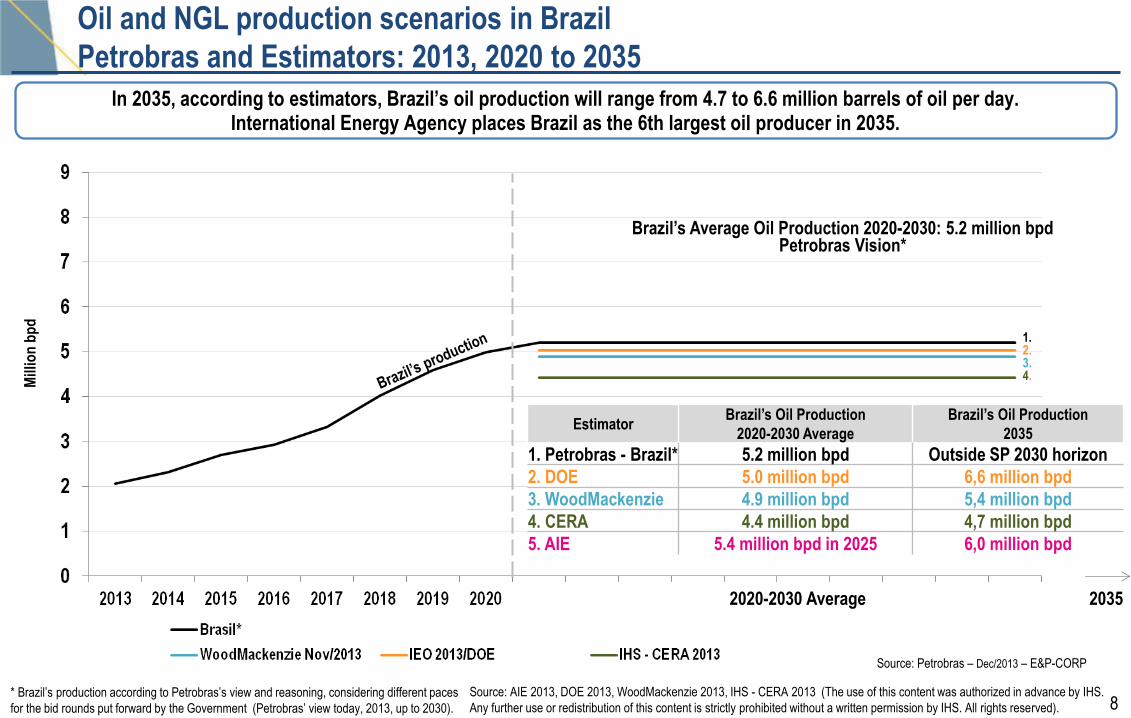
Oil and NGL production scenarios in Brazil
Petrobras and Estimators: 2013, 2020 to 2035
2020-2030 Average
Mill
ion
bp
d
Brazil’s Average Oil Production 2020-2030: 5.2 million bpd Petrobras Vision*
In 2035, according to estimators, Brazil’s oil production will range from 4.7 to 6.6 million barrels of oil per day. International Energy Agency places Brazil as the 6th largest oil producer in 2035.
Source: AIE 2013, DOE 2013, WoodMackenzie 2013, IHS - CERA 2013 (The use of this content was authorized in advance by IHS.
Any further use or redistribution of this content is strictly prohibited without a written permission by IHS. All rights reserved).
Estimator Brazil’s Oil Production
2020-2030 Average
Brazil’s Oil Production
2035
1. Petrobras - Brazil* 5.2 million bpd Outside SP 2030 horizon
2. DOE 5.0 million bpd 6,6 million bpd
3. WoodMackenzie 4.9 million bpd 5,4 million bpd
4. CERA 4.4 million bpd 4,7 million bpd
5. AIE 5.4 million bpd in 2025 6,0 million bpd
2035
1. 2. 3. 4.
* Brazil’s production according to Petrobras’s view and reasoning, considering different paces
for the bid rounds put forward by the Government (Petrobras’ view today, 2013, up to 2030).
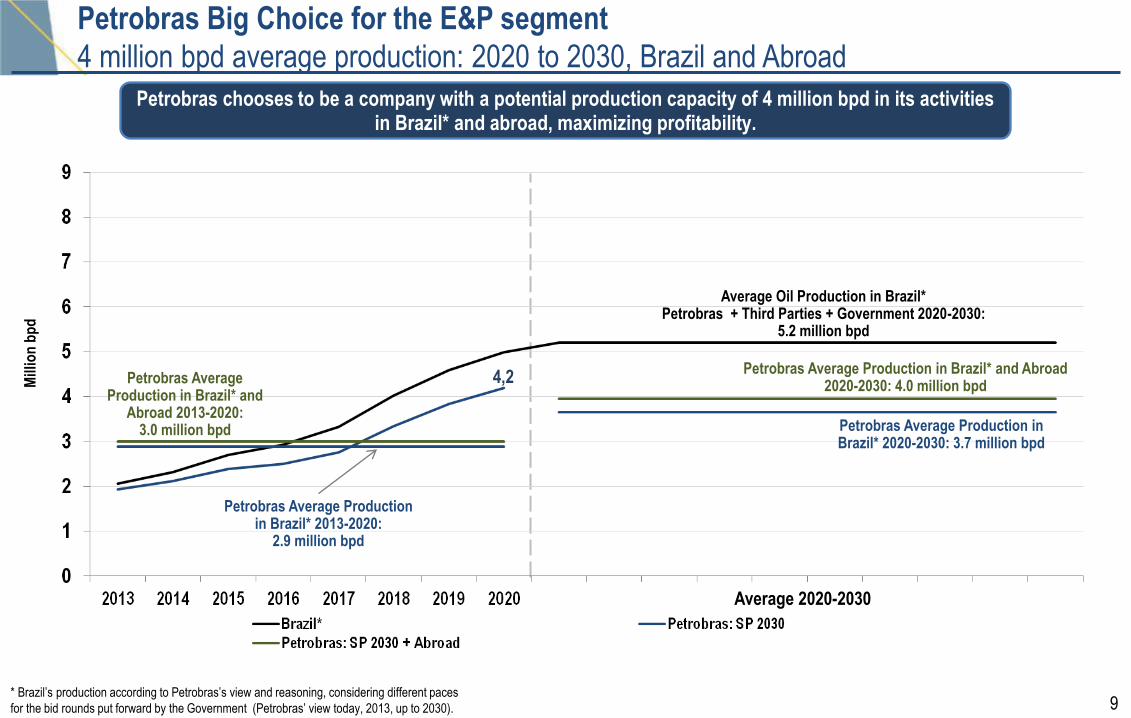
9
4,2
Petrobras Big Choice for the E&P segment
4 million bpd average production: 2020 to 2030, Brazil and Abroad
Petrobras chooses to be a company with a potential production capacity of 4 million bpd in its activities in Brazil* and abroad, maximizing profitability.
Petrobras Average Production in Brazil* and Abroad 2020-2030: 4.0 million bpd
Average 2020-2030
Mill
ion
bp
d
Petrobras Average Production in Brazil* 2020-2030: 3.7 million bpd
Average Oil Production in Brazil* Petrobras + Third Parties + Government 2020-2030:
5.2 million bpd
Petrobras Average Production in Brazil* and
Abroad 2013-2020: 3.0 million bpd
Petrobras Average Production in Brazil* 2013-2020:
2.9 million bpd
* Brazil’s production according to Petrobras’s view and reasoning, considering different paces
for the bid rounds put forward by the Government (Petrobras’ view today, 2013, up to 2030).
10
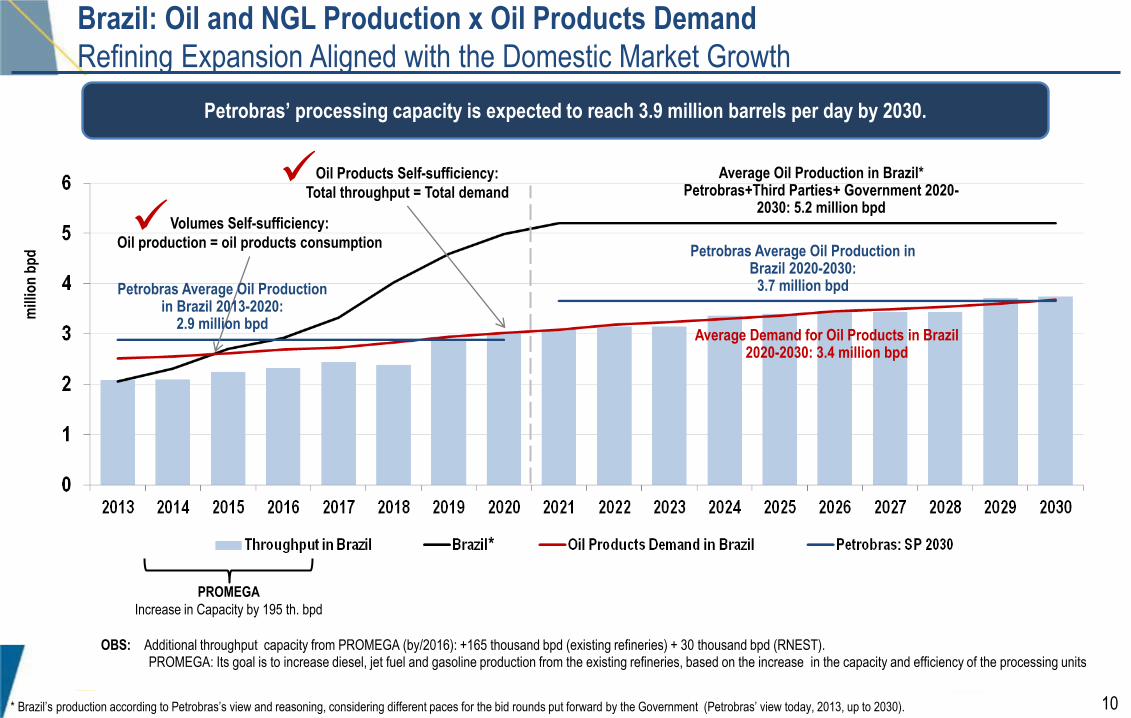
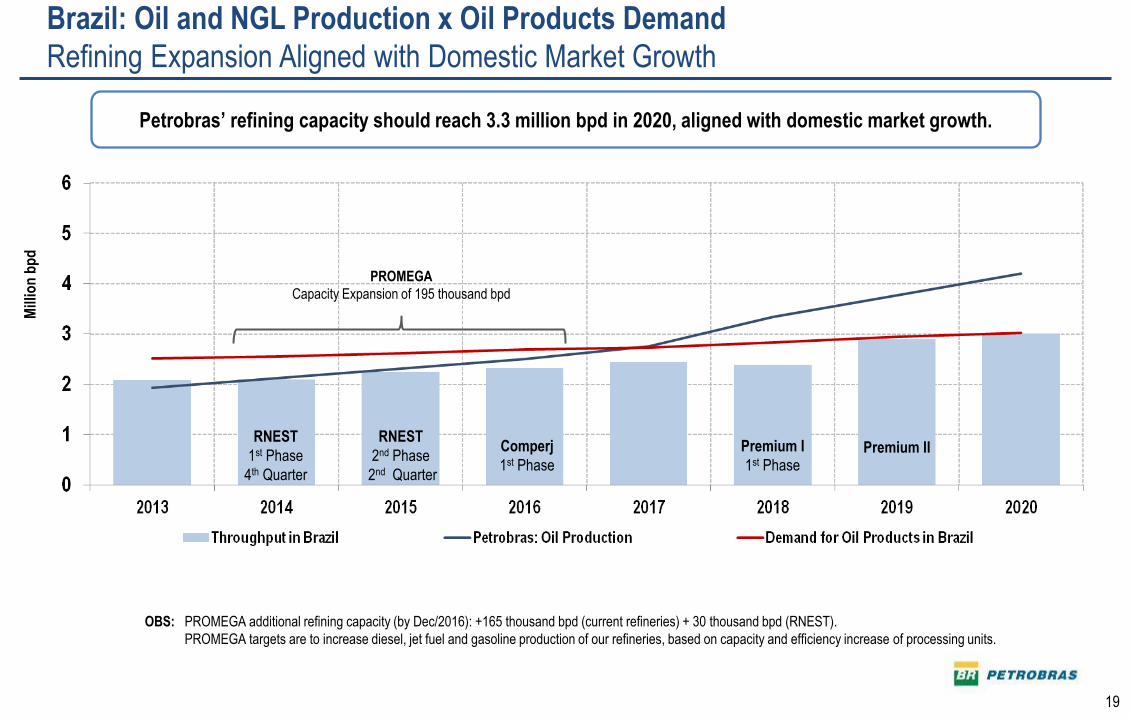
Brazil: Oil and NGL Production x Oil Products Demand
Refining Expansion Aligned with the Domestic Market Growth
OBS: Additional throughput capacity from PROMEGA (by/2016): +165 thousand bpd (existing refineries) + 30 thousand bpd (RNEST). PROMEGA: Its goal is to increase diesel, jet fuel and gasoline production from the existing refineries, based on the increase in the capacity and efficiency of the processing units
mill
ion
bp
d
PROMEGA
Increase in Capacity by 195 th. bpd
Average Oil Production in Brazil* Petrobras+Third Parties+ Government 2020-
2030: 5.2 million bpd
Average Demand for Oil Products in Brazil 2020-2030: 3.4 million bpd
Oil Products Self-sufficiency:
Total throughput = Total demand
Petrobras Average Oil Production in Brazil 2020-2030:
3.7 million bpd
Volumes Self-sufficiency:
Oil production = oil products consumption
Petrobras Average Oil Production in Brazil 2013-2020:
2.9 million bpd
Petrobras’ processing capacity is expected to reach 3.9 million barrels per day by 2030.
*
* Brazil’s production according to Petrobras’s view and reasoning, considering different paces for the bid rounds put forward by the Government (Petrobras’ view today, 2013, up to 2030).
11
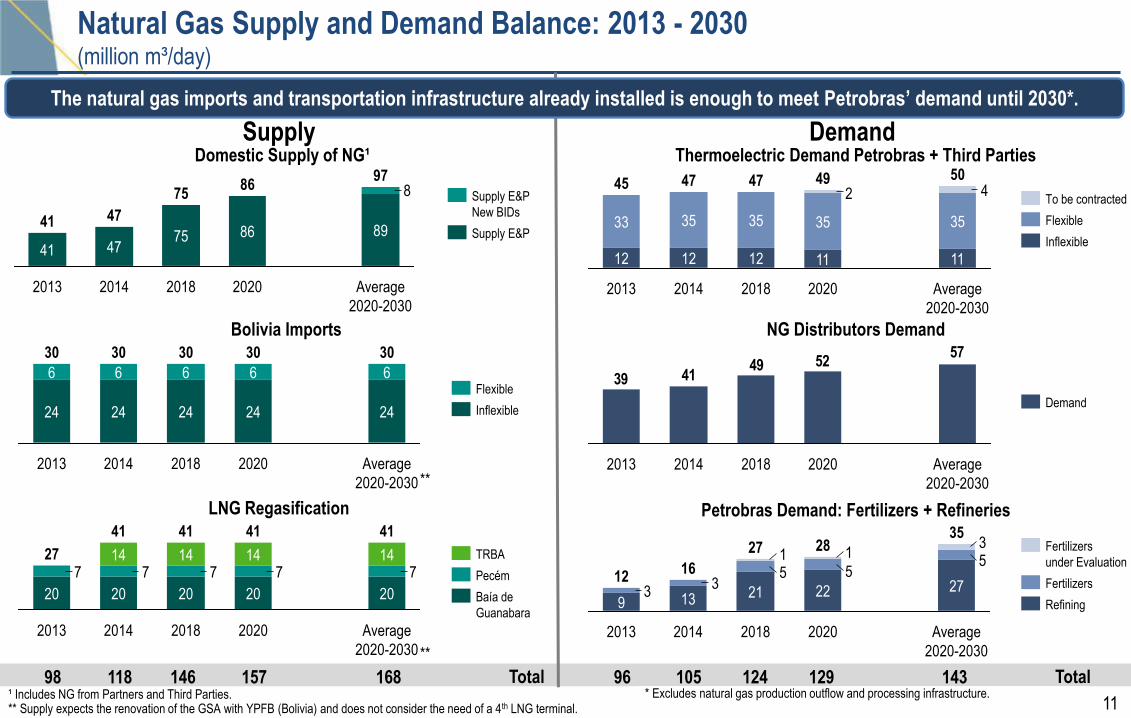
Natural Gas Supply and Demand Balance: 2013 - 2030 (million m³/day)
Supply Demand
LNG Regasification
Thermoelectric Demand Petrobras + Third Parties
42
12
35
2014
47
12
35
2013
45
12
33
Average
2020-2030
50
11
35
2020
49
11
35
2018
47
Inflexible
Flexible
To be contracted
NG Distributors Demand 57
52494139
2014 2013 Average
2020-2030
2020 2018
Demand
Petrobras Demand: Fertilizers + Refineries
555
33
31127
21
2014
16
13
2013
12
9
Average
2020-2030
35
27
2020
28
22
2018
Refining
Fertilizers
Fertilizers
under Evaluation
96 124 129 143 98 146 157 168 118 105 Total
77777
Average
2020-2030
41
20
14
2020
41
20
14
2018
41
20
14
2014
41
20
14
2013
27
20 Baía de
Guanabara
Pecém
TRBA
Bolivia Imports
2020
24
6
2013
30
24
6
Average
2020-2030
30
24
6
30
24
6
2018
30
24
6
2014
30
Inflexible
Flexible
Domestic Supply of NG¹
8
47
2013
41
41
Average
2020-2030
97
89
2020
86
86
2018
75
75
2014
47 Supply E&P
Supply E&P
New BIDs
Total ¹ Includes NG from Partners and Third Parties. ** Supply expects the renovation of the GSA with YPFB (Bolivia) and does not consider the need of a 4th LNG terminal.
**
**
The natural gas imports and transportation infrastructure already installed is enough to meet Petrobras’ demand until 2030*.
* Excludes natural gas production outflow and processing infrastructure.
12
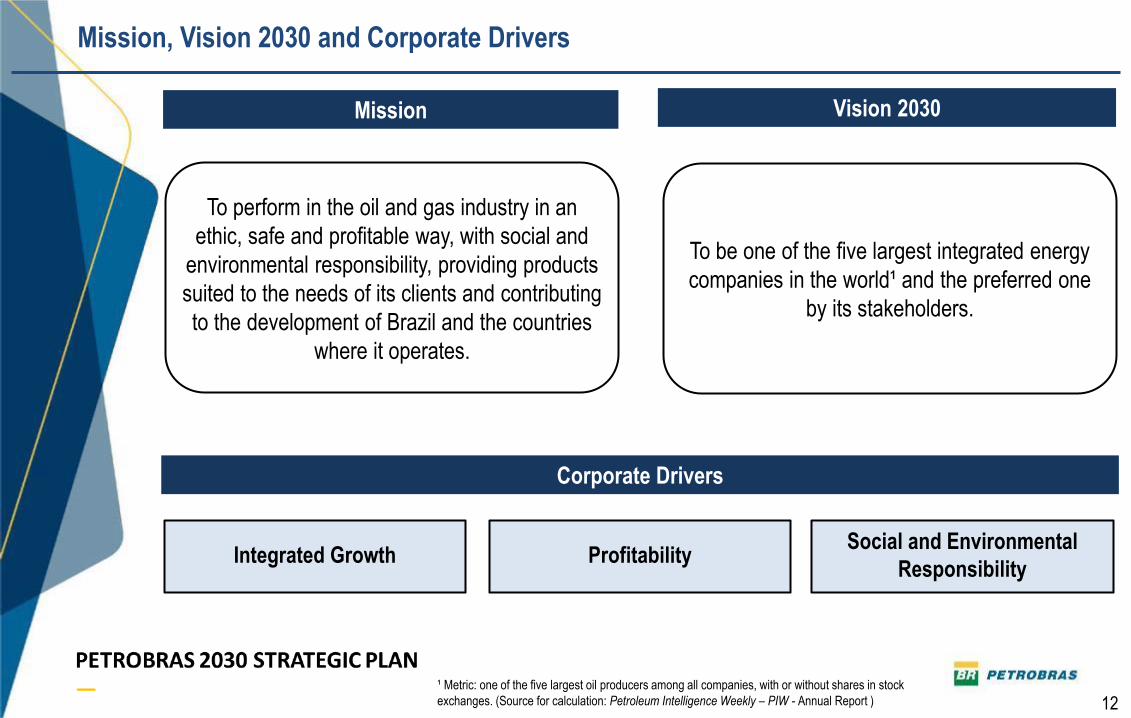
Mission, Vision 2030 and Corporate Drivers
To be one of the five largest integrated energy
companies in the world¹ and the preferred one
by its stakeholders.
¹ Metric: one of the five largest oil producers among all companies, with or without shares in stock
exchanges. (Source for calculation: Petroleum Intelligence Weekly – PIW - Annual Report )
Integrated Growth
Corporate Drivers
Profitability Social and Environmental
Responsibility
Mission
To perform in the oil and gas industry in an
ethic, safe and profitable way, with social and
environmental responsibility, providing products
suited to the needs of its clients and contributing
to the development of Brazil and the countries
where it operates.
Vision 2030
13
2014-2018 Business
and Management Plan
14
Exploratory Success and Reserves Increase
14
TANGO(CES-161) PITU(RNS-158)
PAD FARFAN-1(SES-176D PAD MURIÚ-1(SES-175D) PAD MOITA BONITA(SES-178)
SÃO BERNARDO(ESS-216)
ARJUNA(ESS-211)
RIO PURUS(CXR-1DA)
PAD TAMBUATÁ SANTONIANO(GLF-35)
EXT DE FORNO(AB-125)
EXT DE BRAVA (VD-19)
MANDARIM(MLS-105)
BENEDITO(BP-8)
FRANCO NORDESTE(RJS-724)
FRANCO LESTE(RJS-723)
FRANCO SUL(RJS-700)
FLORIM(RJS-704)
IARA ALTO ÂNGULO(RJS-715)
ENTORNO DE IARA-1(RJS-711)
PAD IARA EXT-4(RJS-706)
NE TUPI-2(RJS-721)
JÚPITER BRACUHI(RJS-713)
SUL DE TUPI(RJS-698))
SAGITÁRIO(SPS-98)
46 discoveries in the last 14 months (Jan/13 – Feb/14), of which 24 were offshore (14 in Pre-salt).
State Limit
Sedimentary Basin
100% Petrobras
Petrobras and Partners
¹ RRR: Reserves Replacement Ratio
² R/P: Reserve / Production
³ Proven Reserves in Brazil 4 Transfer of Right original contract of 5 billion boe, of which 0,7 billion boe were already incorporated to proven reserves 5 Potential recoverable volume in Pre-Salt: Lula, Lula/área de Iracema, Iara, Sapinhoá, Pq. das Baleias, Lapa and Campos Basin.
Brazil
Discoveries: 46
• Offshore: 24
• Onshore: 22
Exploratory Success Ratio: 75%
Reserves: 16.0 Billion boe
RRR¹: 131%
> 100% for the 22nd consecutive year
R/P²: 20.0 years
Potential Recoverable Volume:
• 16.0³ + 4.34 + 7.15 = 27.4 billion boe
Pre-Salt Discoveries: 14, of which 5 were pioneers wells
Exploratory Success Ratio: 100%
Reserves: 300 km of SE region, 55% of GDP
15
2014 Growth:
7.5% ± 1p.a.
2014-2018 BMP: Petrobras Oil, NGL and Natural Gas Production Curve in Brazil
16 16
• Norte Pq. Baleias
(P-58) 1st Quarter
Sapinhoá Pilot
(Cid. São Paulo)
Baúna
(Cid. Itajaí)
• Iracema Sul
(Cid. Mangaratiba)
• Roncador IV
(P-62) 2º Quarter
• Sapinhoá Norte
(Cid. Ilhabela)
• Papa-Terra
(P-61 + TAD ) 2nd Quarter
• Florim
• Júpiter • Lula Alto
• Lula Central
• Lula Sul
(P-66)
• Búzios I
(P-74)
• Lapa
• Lula Norte
(P-67)
• Búzios II
(P-75)
• Lula Ext. Sul
e ToR Sul de Lula
(P-68)
• Lula Oeste
(P-69)
• Búzios III
(P-76)
•Tartaruga Verde and
Mestiça
• Maromba I
• Iara Horst
(P-70)
• Búzios IV
(P-77)
• Entorno de Iara
(P-73)
• NE de Tupi
(P-72)
• Iara NW
(P-71)
• Sul Pq. Baleias
• Deep Water ES
• Carcará
• Búzios V
• Espadarte III
Production Units in operation
• Deep Water I
SE
• Marlim I
•Revitalization
• Deep Water II
SE
• Libra
• Marlim II
Revitalization Lula NE Pilot
(Cid. Paraty)
Papa-Terra
(P-63)
Roncador III
(P-55)
--- Production Units not bid as of Feb/2014
1st Oil Forecast
3rd Quarter
4th Quarter
• Iracema Norte
(Cid. Itaguaí)
3rd Quarter
1st Oil Forecast 9 Production Units
Concluded
• Norte Pq. Baleias
(P-58)
• Roncador IV
(P-62)
• Papa-Terra
(P-61)
• Papa-Terra
(TAD)
• Production Units Delivered in 2013
2014 Growth:
7.5% ± 1p.a.
2014-2018 BMP: Petrobras Oil and NGL Production Curve in Brazil Oi and NGL production (million bpd)
2014 - 2015 2016 - 2020
In the first quarter 2014 production growth will not be relevant, due to adjustment works on new platforms on location and well interconnections.
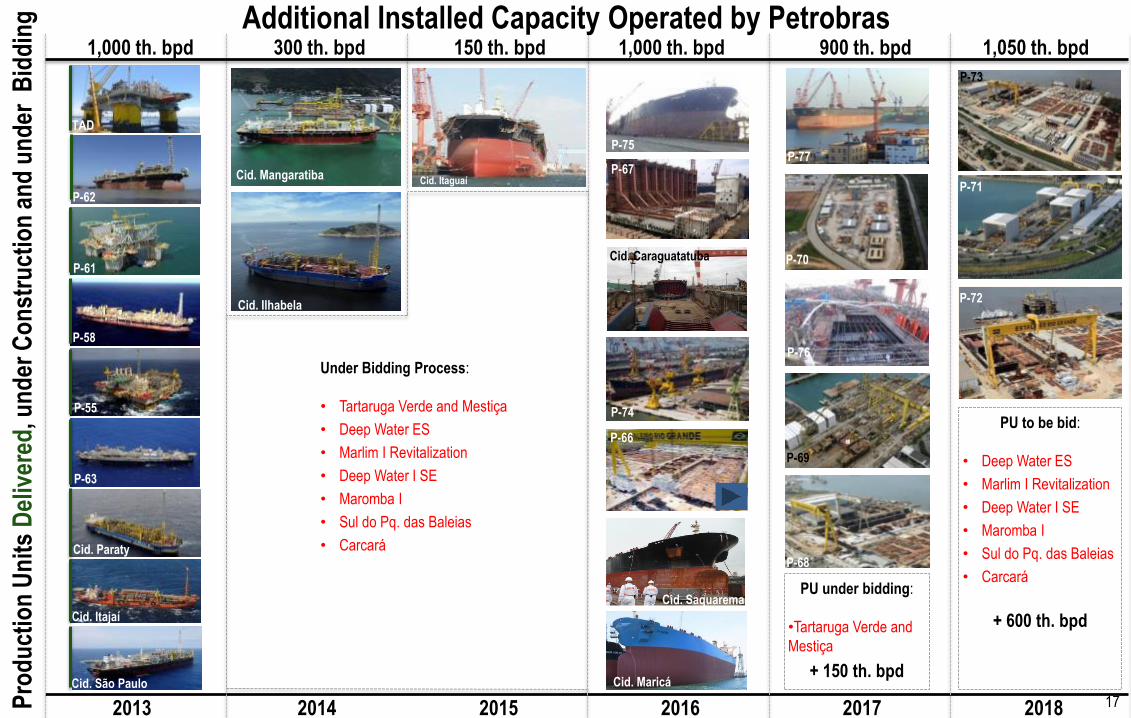
17 17 Pro
du
ctio
n U
nit
s D
eliv
ered
, un
der
Co
nst
ruct
ion
an
d u
nd
er B
idd
ing
2014 2015 2016 2017 2018 2013
1,000 th. bpd 300 th. bpd
Additional Installed Capacity Operated by Petrobras 150 th. bpd 1,000 th. bpd 900 th. bpd 1,050 th. bpd
Cid. Ilhabela
Cid. Mangaratiba
P-75
P-67
P-74
P-66
P-68
P-69
P-76
P-77
P-72
P-71
P-73
P-67 Cid. Itaguaí
Cid. Maricá
Cid. Saquarema
Cid. Caraguatatuba
Cid. São Paulo
Cid. Itajaí
Cid. Paraty
P-63
P-55
P-61
P-58
P-62
TAD
PU to be bid:
• Deep Water ES
• Marlim I Revitalization
• Deep Water I SE
• Maromba I
• Sul do Pq. das Baleias
• Carcará
+ 600 th. bpd
PU under bidding:
•Tartaruga Verde and
Mestiça
+ 150 th. bpd
P-70
Under Bidding Process:
• Tartaruga Verde and Mestiça
• Deep Water ES
• Marlim I Revitalization
• Deep Water I SE
• Maromba I
• Sul do Pq. das Baleias
• Carcará
18 18
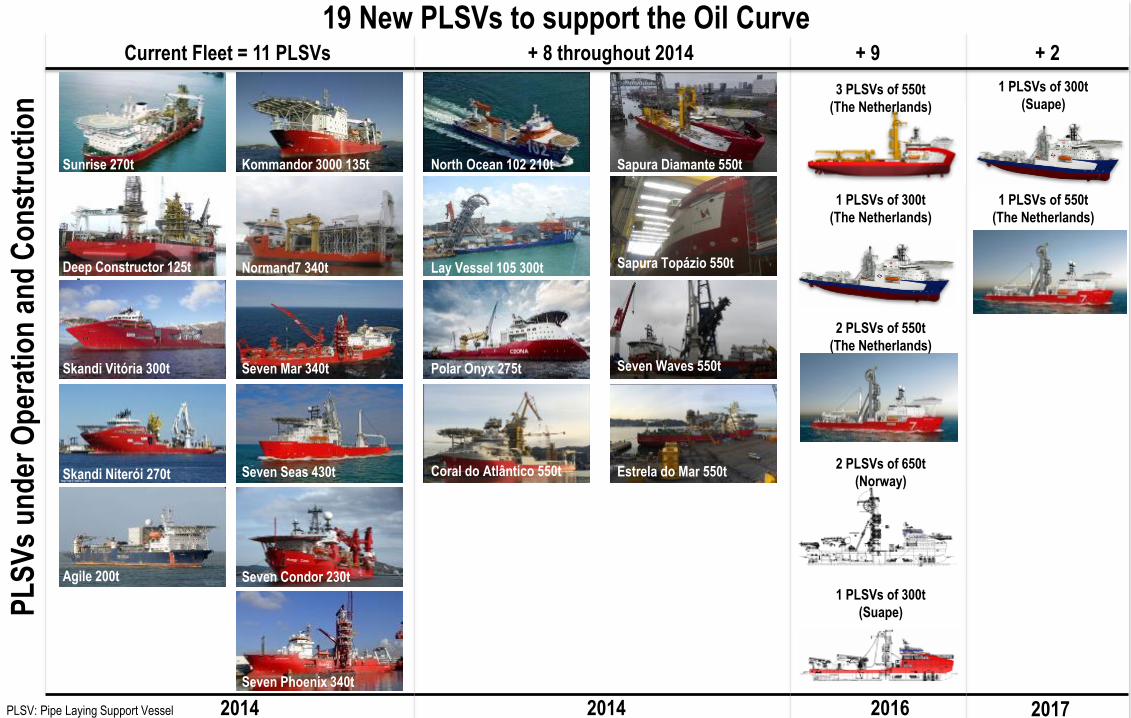
PL
SV
s u
nd
er O
per
atio
n a
nd
Co
nst
ruct
ion
2014 2016 2014
Current Fleet = 11 PLSVs + 2
19 New PLSVs to support the Oil Curve + 8 throughout 2014 + 9
P-58
2017
Sunrise 270t
Deep Constructor 125t
Skandi Vitória 300t
Skandi Niterói 270t
Kommandor 3000 135t
Normand7 340t
Seven Mar 340t
Seven Seas 430t
Seven Condor 230t
Seven Phoenix 340t
McDermott
Agile 200t
North Ocean 102 210t
Polar Onyx 275t
Coral do Atlântico 550t Estrela do Mar 550t
Lay Vessel 105 300t
Seven Waves 550t
1 PLSVs of 300t
(The Netherlands)
Sapura Diamante 550t
Sapura Topázio 550t
3 PLSVs of 550t
(The Netherlands)
2 PLSVs of 650t
(Norway)
1 PLSVs of 300t
(Suape)
1 PLSVs of 550t
(The Netherlands)
1 PLSVs of 300t
(Suape)
2 PLSVs of 550t
(The Netherlands)
PLSV: Pipe Laying Support Vessel
19 19
Brazil: Oil and NGL Production x Oil Products Demand
Refining Expansion Aligned with Domestic Market Growth
RNEST
1st Phase
4th Quarter
RNEST
2nd Phase
2nd Quarter
Comperj
1st Phase
Premium I
1st Phase Premium II
OBS: PROMEGA additional refining capacity (by Dec/2016): +165 thousand bpd (current refineries) + 30 thousand bpd (RNEST).
PROMEGA targets are to increase diesel, jet fuel and gasoline production of our refineries, based on capacity and efficiency increase of processing units.
Mill
ion
bp
d
PROMEGA
Capacity Expansion of 195 thousand bpd
Petrobras’ refining capacity should reach 3.3 million bpd in 2020, aligned with domestic market growth.
20
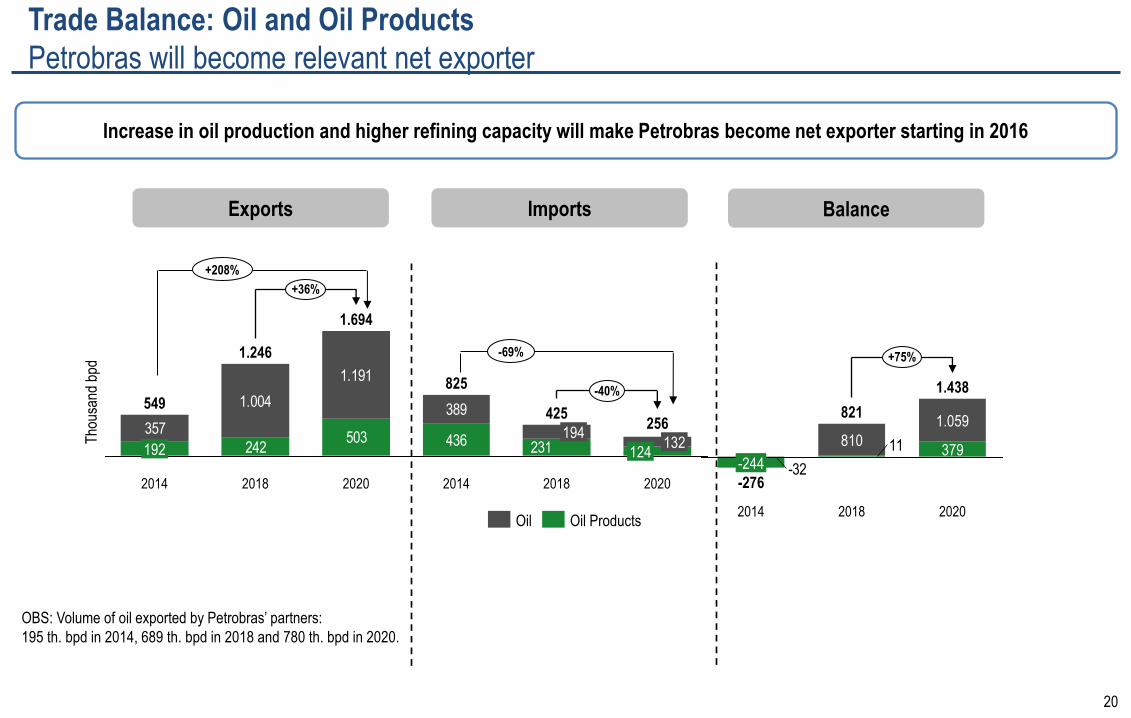
Trade Balance: Oil and Oil Products
Petrobras will become relevant net exporter
Exports Imports Balance
Tho
usan
d bp
d
242503 436
357
1.004
1.191
389
231
-40%
+36%
2020
256
124 132
2018
425
194
2014
825
2020
1.694
2018
1.246
2014
549
192
Oil Products Oil
+208%
11
-32
+75%
2020
1.438
379
1.059
2018
821
810
2014
-276
-244
-69%
Increase in oil production and higher refining capacity will make Petrobras become net exporter starting in 2016
OBS: Volume of oil exported by Petrobras’ partners:
195 th. bpd in 2014, 689 th. bpd in 2018 and 780 th. bpd in 2020.
21 21
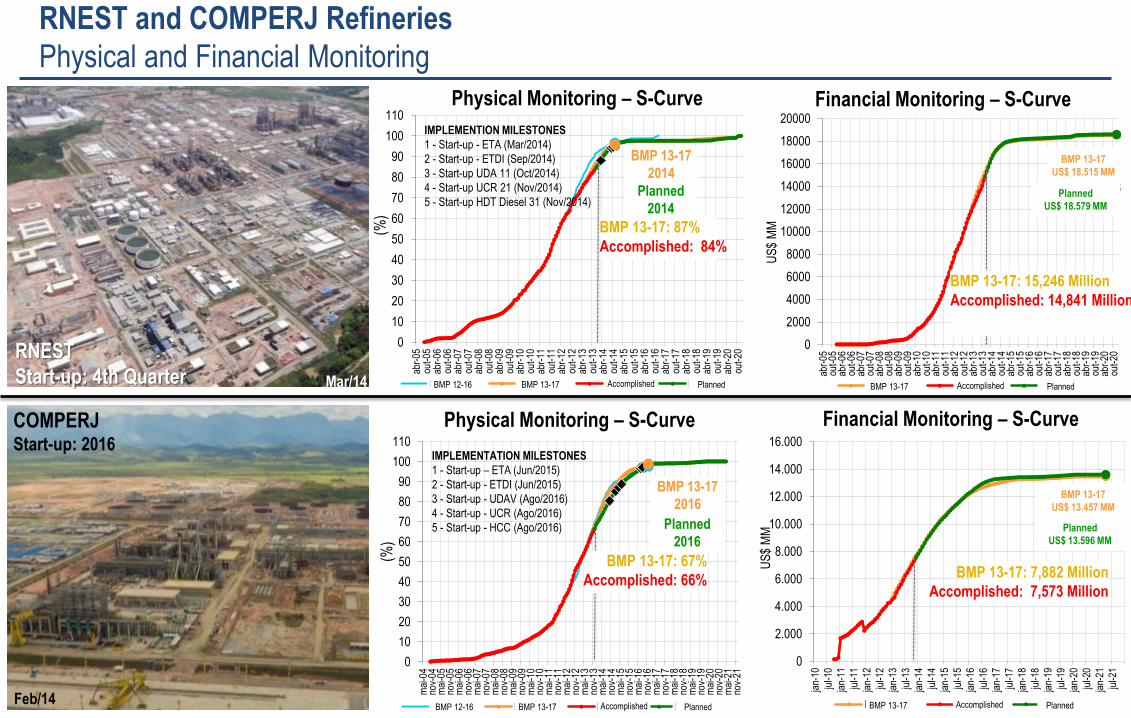
RNEST and COMPERJ Refineries
Physical and Financial Monitoring
PNG 13-17 2016
Projetado 2016
0
10
20
30
40
50
60
70
80
90
100
110
mai
-04
nov-
04m
ai-0
5no
v-05
mai
-06
nov-
06m
ai-0
7no
v-07
mai
-08
nov-
08m
ai-0
9no
v-09
mai
-10
nov-
10m
ai-1
1no
v-11
mai
-12
nov-
12m
ai-1
3no
v-13
mai
-14
nov-
14m
ai-1
5no
v-15
mai
-16
nov-
16m
ai-1
7no
v-17
mai
-18
nov-
18m
ai-1
9no
v-19
mai
-20
nov-
20m
ai-2
1no
v-21
PNG 12-16 PNG 13-17 Realizado Projetado
Physical Monitoring – S-Curve
(%)
PNG 13-17 2014
Projetado 2014
0
10
20
30
40
50
60
70
80
90
100
110
abr-
05ou
t-05
abr-
06ou
t-06
abr-
07ou
t-07
abr-
08ou
t-08
abr-
09ou
t-09
abr-
10ou
t-10
abr-
11ou
t-11
abr-
12ou
t-12
abr-
13ou
t-13
abr-
14ou
t-14
abr-
15ou
t-15
abr-
16ou
t-16
abr-
17ou
t-17
abr-
18ou
t-18
abr-
19ou
t-19
abr-
20ou
t-20
PNG 12-16 PNG 13-17 Realizado Projetado
Physical Monitoring – S-Curve
BMP 13-17: 87%
Accomplished: 84%
PNG 13-17: US$ 13.457 MM
Projetado: US$ 13.596 MM
0
2.000
4.000
6.000
8.000
10.000
12.000
14.000
16.000
jan-
10
jul-1
0
jan-
11
jul-1
1
jan-
12
jul-1
2
jan-
13
jul-1
3
jan-
14
jul-1
4
jan-
15
jul-1
5
jan-
16
jul-1
6
jan-
17
jul-1
7
jan-
18
jul-1
8
jan-
19
jul-1
9
jan-
20
jul-2
0
jan-
21
jul-2
1
US
$ M
M
PNG 13-17 Realizado Projetado
(%)
Financial Monitoring – S-Curve
Financial Monitoring – S-Curve
BMP 13-17: 7,882 Million
Accomplished: 7,573 Million
PNG 13-17: US$ 18.515 MM
Projetado: US$ 18.579 MM
0
2000
4000
6000
8000
10000
12000
14000
16000
18000
20000
abr-
05ou
t-05
abr-
06ou
t-06
abr-
07ou
t-07
abr-
08ou
t-08
abr-
09ou
t-09
abr-
10ou
t-10
abr-
11ou
t-11
abr-
12ou
t-12
abr-
13ou
t-13
abr-
14ou
t-14
abr-
15ou
t-15
abr-
16ou
t-16
abr-
17ou
t-17
abr-
18ou
t-18
abr-
19ou
t-19
abr-
20ou
t-20
US
$ M
M
PNG 13-17 Realizado Projetado
IMPLEMENTION MILESTONES
1 - Start-up - ETA (Mar/2014)
2 - Start-up - ETDI (Sep/2014)
3 - Start-up UDA 11 (Oct/2014)
4 - Start-up UCR 21 (Nov/2014)
5 - Start-up HDT Diesel 31 (Nov/2014)
IMPLEMENTATION MILESTONES
1 - Start-up – ETA (Jun/2015)
2 - Start-up - ETDI (Jun/2015)
3 - Start-up - UDAV (Ago/2016)
4 - Start-up - UCR (Ago/2016)
5 - Start-up - HCC (Ago/2016)
BMP 13-17: 15,246 Million
Accomplished: 14,841 Million
BMP 13-17: 67%
Accomplished: 66%
COMPERJ Start-up: 2016
Feb/14
BMP 13-17 Accomplished Planned BMP 13-17 Accomplished Planned
BMP 12-16 BMP 13-17 Accomplished Planned BMP 13-17 Accomplished Planned
BMP 13-17
2016
Planned
2016
Planned
2014
BMP 13-17
2014 BMP 13-17
US$ 18.515 MM
Planned
US$ 13.596 MM
BMP 13-17
US$ 13.457 MM
Planned
US$ 18.579 MM
RNEST
Start-up: 4th Quarter BMP 12-16 Mar/14
22
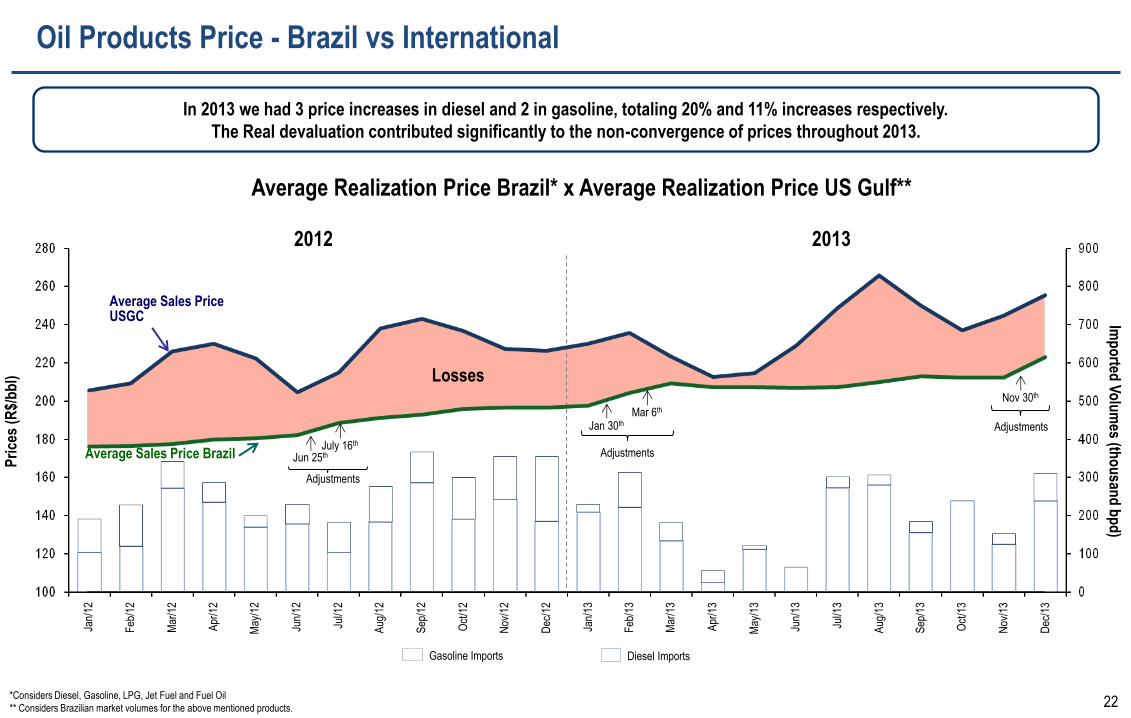
Average Realization Price Brazil* x Average Realization Price US Gulf**
*Considers Diesel, Gasoline, LPG, Jet Fuel and Fuel Oil
** Considers Brazilian market volumes for the above mentioned products.
In 2013 we had 3 price increases in diesel and 2 in gasoline, totaling 20% and 11% increases respectively.
The Real devaluation contributed significantly to the non-convergence of prices throughout 2013.
Oil Products Price - Brazil vs International
Dec
/13
Nov
/13
Oct
/13
Sep
/13
Aug
/13
Jul/1
3
Jun/
13
May
/13
Apr
/13
Mar
/13
Feb
/13
Jan/
13
Dec
/12
Nov
/12
Oct
/12
Sep
/12
Aug
/12
Jul/1
2
Jun/
12
May
/12
Apr
/12
Mar
/12
Feb
/12
Jan/
12
Pri
ces
(R$/
bb
l)
2012 2013
Average Sales Price USGC
Jun 25th
Adjustments
July 16th Average Sales Price Brazil Adjustments
Jan 30th Mar 6th
Nov 30th
Adjustments
Losses
Gasoline Imports Diesel Imports
Imp
orted
Vo
lum
es (tho
usan
d b
pd
)
23 23
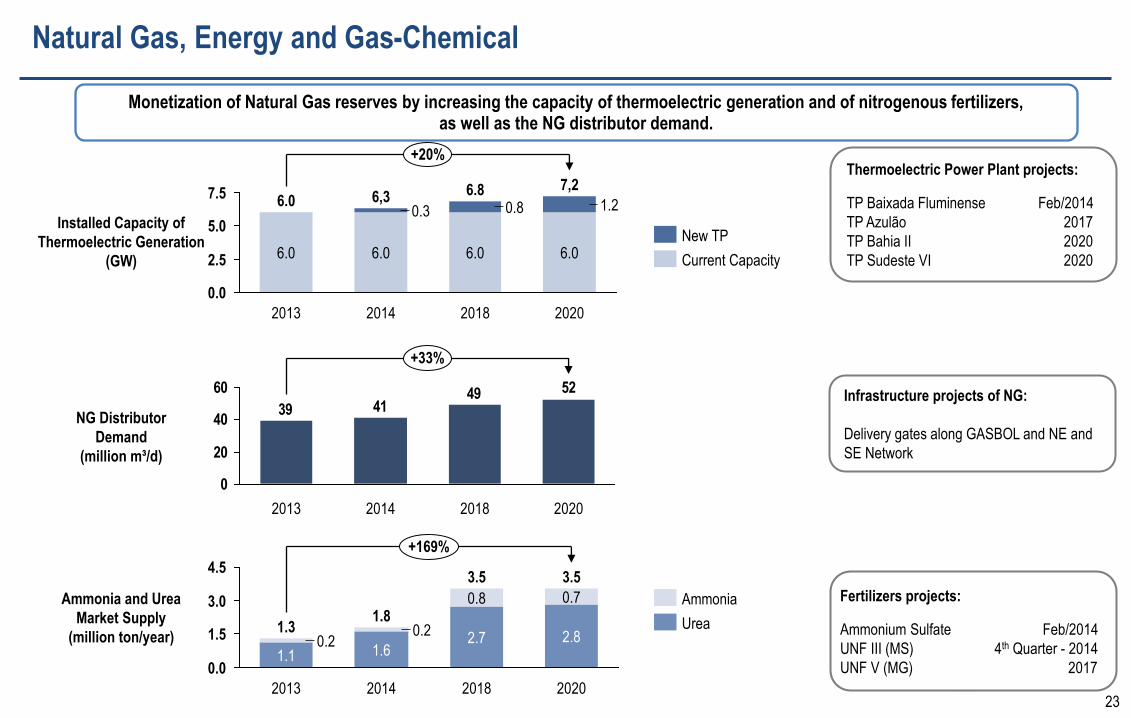
Natural Gas, Energy and Gas-Chemical
7.5
5.0
2.5
0.0
+20%
2020
7,2
6.0
1.2
2018
6.8
6.0
0.8
2014
6,3
6.0
0.3
2013
6.0
6.0
Installed Capacity of
Thermoelectric Generation
(GW) Current Capacity
New TP
52494139
0
20
40
60
+33%
2020 2018 2014 2013
NG Distributor
Demand
(million m³/d)
0.7
2018
4.5
3.0
1.5
0.0
+169%
2020
3.5
2.8
1.8
1.6
3.5
2.7
0.8
2014
0.2
2013
1.3
1.1 0.2
Ammonia and Urea
Market Supply
(million ton/year)
Ammonia
Urea
Thermoelectric Power Plant projects:
TP Baixada Fluminense Feb/2014
TP Azulão 2017
TP Bahia II 2020
TP Sudeste VI 2020
Fertilizers projects:
Ammonium Sulfate Feb/2014
UNF III (MS) 4th Quarter - 2014
UNF V (MG) 2017
Infrastructure projects of NG:
Delivery gates along GASBOL and NE and
SE Network
Monetization of Natural Gas reserves by increasing the capacity of thermoelectric generation and of nitrogenous fertilizers, as well as the NG distributor demand.
24 24
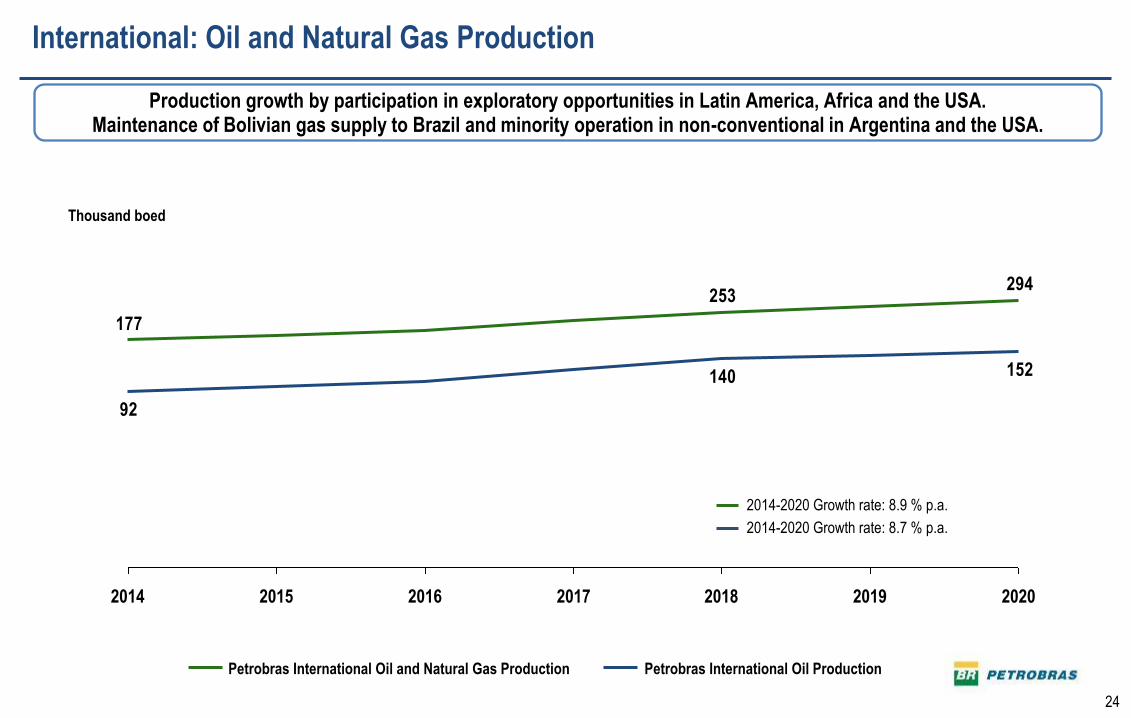
International: Oil and Natural Gas Production
Production growth by participation in exploratory opportunities in Latin America, Africa and the USA. Maintenance of Bolivian gas supply to Brazil and minority operation in non-conventional in Argentina and the USA.
294253
177
152140
92
2020 2019 2017 2018 2016 2014 2015
Petrobras International Oil and Natural Gas Production Petrobras International Oil Production
Thousand boed
2014-2020 Growth rate: 8.9 % p.a.
2014-2020 Growth rate: 8.7 % p.a.
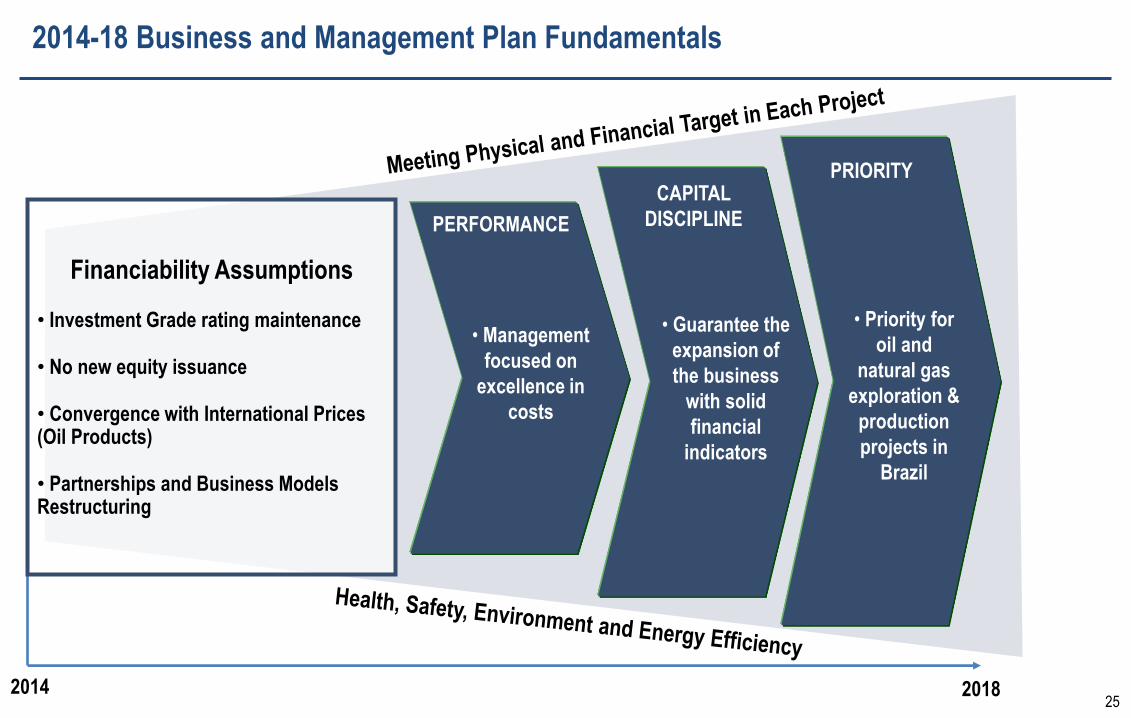
25 25
• Management
focused on
excellence in
costs
PERFORMANCE
• Guarantee the
expansion of
the business
with solid
financial
indicators
CAPITAL
DISCIPLINE
• Priority for
oil and
natural gas
exploration &
production
projects in
Brazil
PRIORITY
2014 2018
Financiability Assumptions
• Investment Grade rating maintenance
• No new equity issuance
• Convergence with International Prices (Oil Products)
• Partnerships and Business Models Restructuring
2014-18 Business and Management Plan Fundamentals
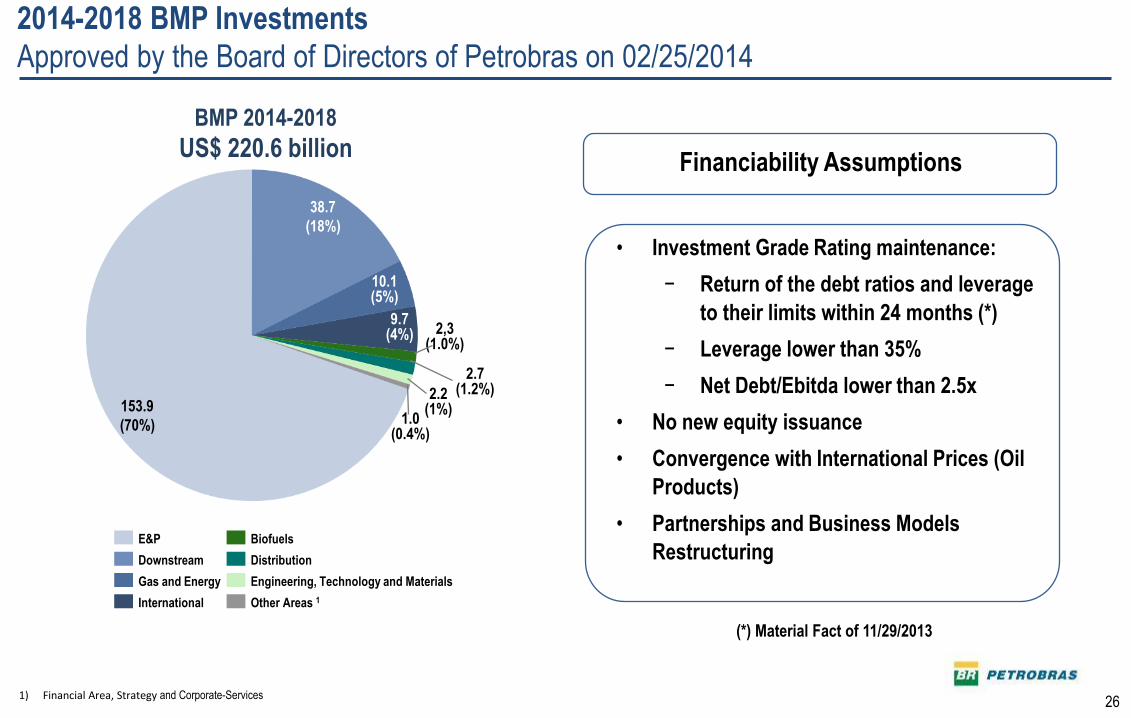
26 26
BMP 2014-2018
US$ 220.6 billion
2014-2018 BMP Investments
Approved by the Board of Directors of Petrobras on 02/25/2014
• Investment Grade Rating maintenance:
− Return of the debt ratios and leverage
to their limits within 24 months (*)
− Leverage lower than 35%
− Net Debt/Ebitda lower than 2.5x
• No new equity issuance
• Convergence with International Prices (Oil
Products)
• Partnerships and Business Models
Restructuring
Financiability Assumptions
38.7
(18%)
153.9
(70%)
Distribution
Biofuels
Downstream
Other Areas 1 International
Gas and Energy Engineering, Technology and Materials
E&P
2.2 (1%)
1.0 (0.4%)
2.7 (1.2%)
2,3 (1.0%)
9.7 (4%)
10.1 (5%)
1) Financial Area, Strategy and Corporate-Services
(*) Material Fact of 11/29/2013
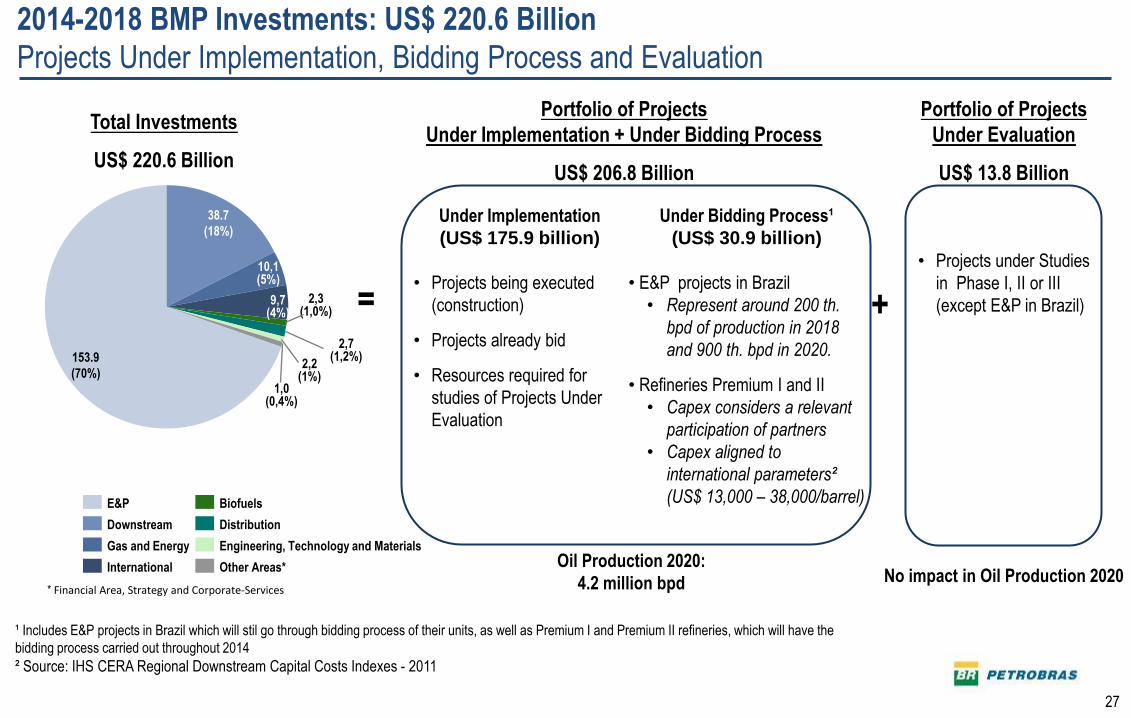
27 27
2014-2018 BMP Investments: US$ 220.6 Billion
Projects Under Implementation, Bidding Process and Evaluation
Under Implementation
(US$ 175.9 billion)
• Projects being executed
(construction)
• Projects already bid
• Resources required for
studies of Projects Under
Evaluation
=
38.7
(18%)
153.9
(70%) 2,2
(1%) 1,0
(0,4%)
2,7 (1,2%)
2,3 (1,0%)
9,7 (4%)
10,1 (5%)
Total Investments
US$ 220.6 Billion
Portfolio of Projects
Under Evaluation
US$ 13.8 Billion
Under Bidding Process¹
(US$ 30.9 billion)
• E&P projects in Brazil
• Represent around 200 th.
bpd of production in 2018
and 900 th. bpd in 2020.
• Refineries Premium I and II
• Capex considers a relevant
participation of partners
• Capex aligned to
international parameters²
(US$ 13,000 – 38,000/barrel)
• Projects under Studies
in Phase I, II or III
(except E&P in Brazil)
Oil Production 2020:
4.2 million bpd No impact in Oil Production 2020
+
Portfolio of Projects
Under Implementation + Under Bidding Process
US$ 206.8 Billion
* Financial Area, Strategy and Corporate-Services
Distribution
Biofuels
Downstream
Other Areas* International
Gas and Energy Engineering, Technology and Materials
E&P
¹ Includes E&P projects in Brazil which will stil go through bidding process of their units, as well as Premium I and Premium II refineries, which will have the
bidding process carried out throughout 2014
² Source: IHS CERA Regional Downstream Capital Costs Indexes - 2011
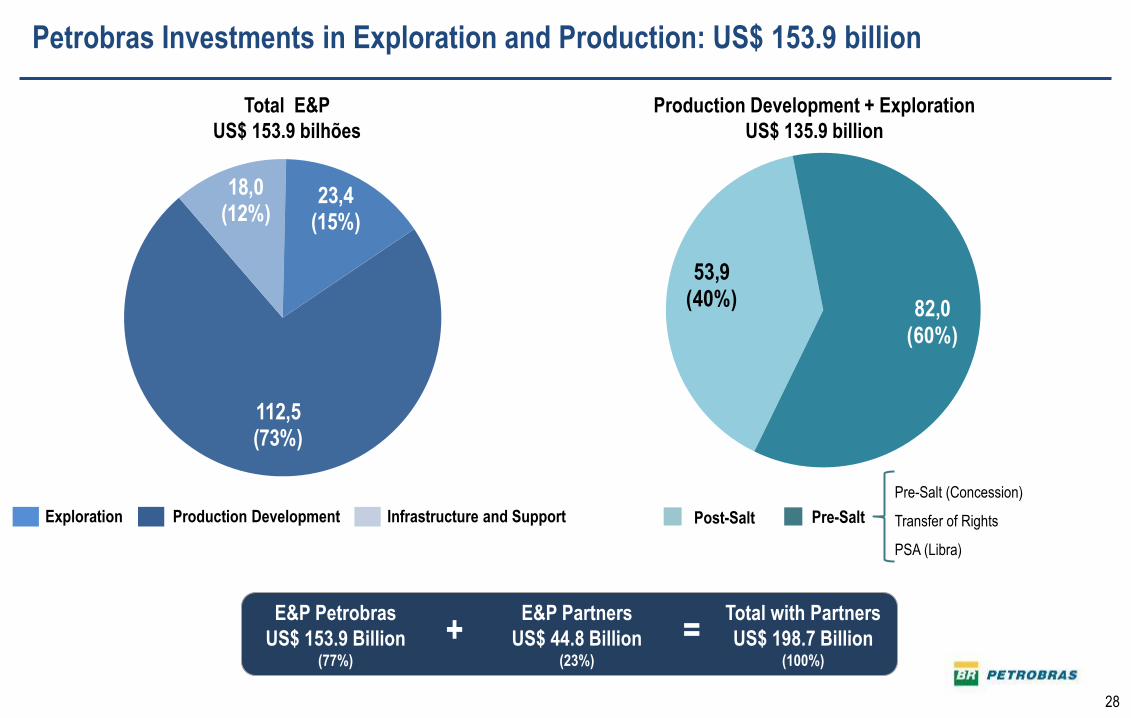
28 28
112,5(73%)
18,0(12%)
23,4(15%)
Petrobras Investments in Exploration and Production: US$ 153.9 billion
Total E&P
US$ 153.9 bilhões
Production Development Exploration Infrastructure and Support
E&P Petrobras
US$ 153.9 Billion (77%)
= + E&P Partners
US$ 44.8 Billion (23%)
Total with Partners
US$ 198.7 Billion (100%)
Pre-Salt Post-Salt
Production Development + Exploration
US$ 135.9 billion
Pre-Salt (Concession)
Transfer of Rights
PSA (Libra)
53,9(40%) 82,0
(60%)
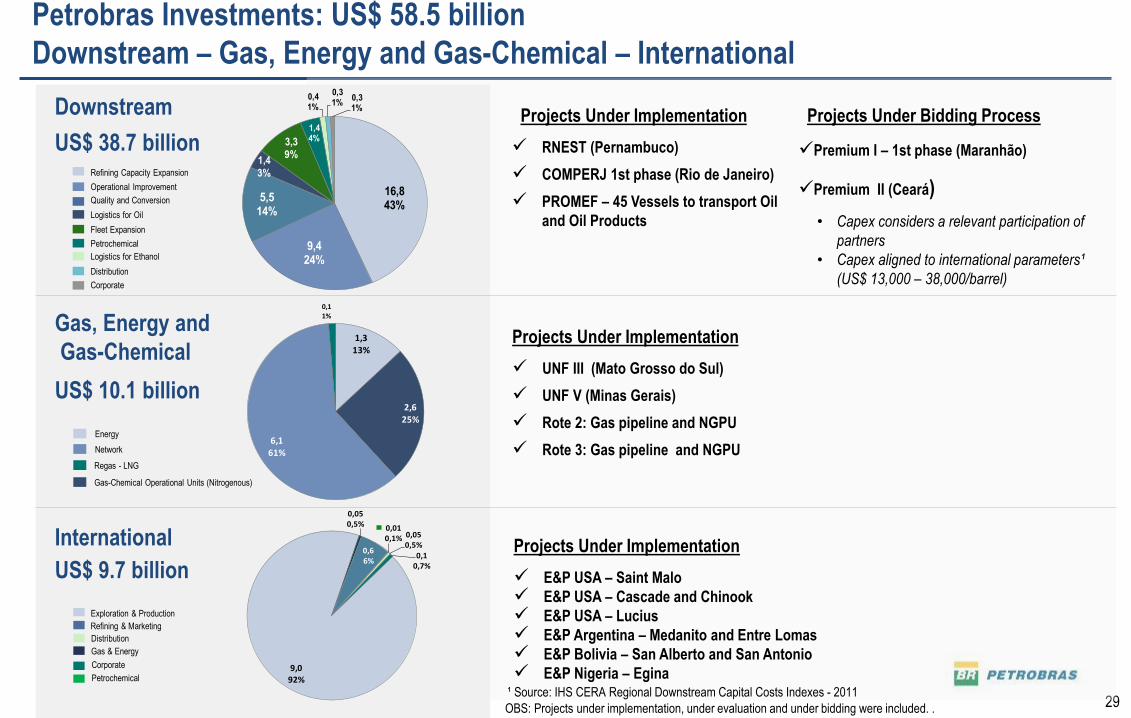
29 29
9,092%
0,050,5%
0,66%
0,010,1% 0,05
0,5%0,1
0,7%
Projects Under Implementation
RNEST (Pernambuco)
COMPERJ 1st phase (Rio de Janeiro)
PROMEF – 45 Vessels to transport Oil
and Oil Products
Projects Under Bidding Process
Premium I – 1st phase (Maranhão)
Premium II (Ceará)
• Capex considers a relevant participation of
partners
• Capex aligned to international parameters¹
(US$ 13,000 – 38,000/barrel)
Projects Under Implementation
UNF III (Mato Grosso do Sul)
UNF V (Minas Gerais)
Rote 2: Gas pipeline and NGPU
Rote 3: Gas pipeline and NGPU
Downstream
Gas, Energy and
Gas-Chemical
International Projects Under Implementation
E&P USA – Saint Malo
E&P USA – Cascade and Chinook
E&P USA – Lucius
E&P Argentina – Medanito and Entre Lomas
E&P Bolivia – San Alberto and San Antonio
E&P Nigeria – Egina
US$ 38.7 billion
US$ 10.1 billion
US$ 9.7 billion
Petrobras Investments: US$ 58.5 billion
Downstream – Gas, Energy and Gas-Chemical – International
Logistics for Ethanol
Corporate
Petrochemical
Fleet Expansion
Logistics for Oil
Quality and Conversion
Operational Improvement
Refining Capacity Expansion
Distribution
Gas-Chemical Operational Units (Nitrogenous)
Regas - LNG
Network
Energy
Distribution
Corporate
Gas & Energy
Refining & Marketing
Exploration & Production
Petrochemical
1,313%
2,625%
6,161%
0,11%
16,843%
9,424%
5,514%
1,43%
3,39%
1,44%
0,41%
0,31%
0,31%
OBS: Projects under implementation, under evaluation and under bidding were included. .
¹ Source: IHS CERA Regional Downstream Capital Costs Indexes - 2011
30
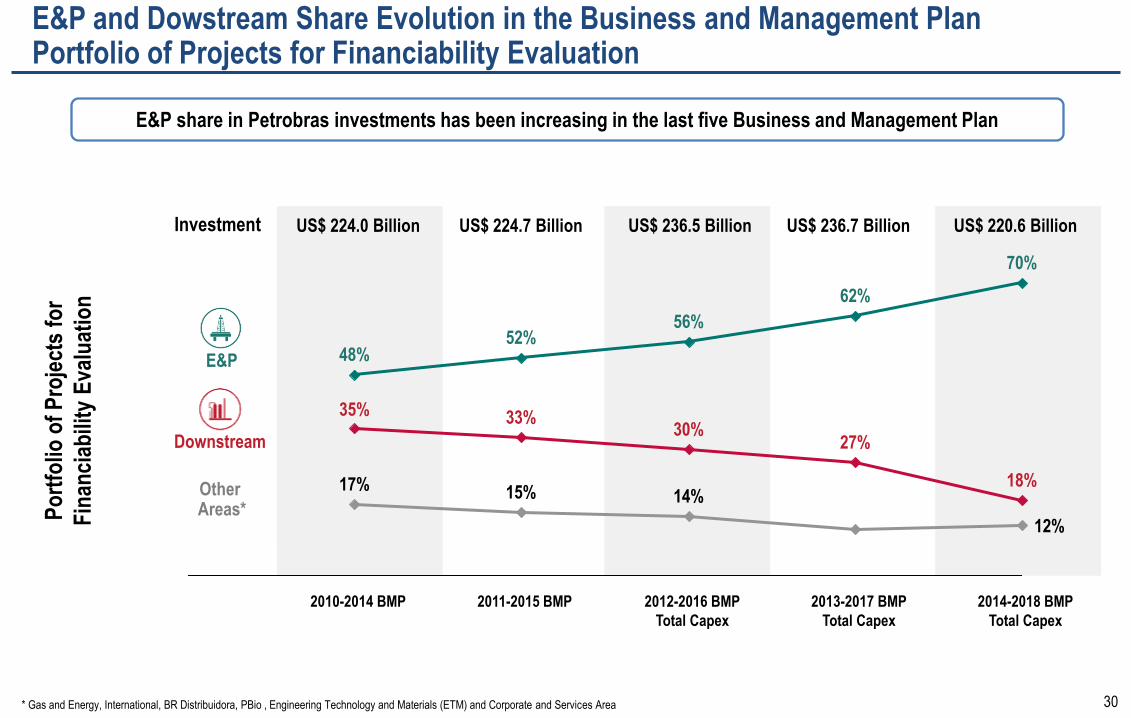
E&P and Dowstream Share Evolution in the Business and Management Plan Portfolio of Projects for Financiability Evaluation
* Gas and Energy, International, BR Distribuidora, PBio , Engineering Technology and Materials (ETM) and Corporate and Services Area
2014-2018 BMP
Total Capex
2012-2016 BMP
Total Capex
2013-2017 BMP
Total Capex
2010-2014 BMP 2011-2015 BMP
E&P
Downstream
Other Areas* P
ort
folio
of
Pro
ject
s fo
r
Fin
anci
abili
ty E
valu
atio
n
US$ 224.0 Billion Investment US$ 224.7 Billion US$ 236.5 Billion US$ 236.7 Billion US$ 220.6 Billion
E&P share in Petrobras investments has been increasing in the last five Business and Management Plan
48%
35%
17%
52%
33%
11% 15%
18%
27%
62%
14%
30%
56%
70%
12%
31 31
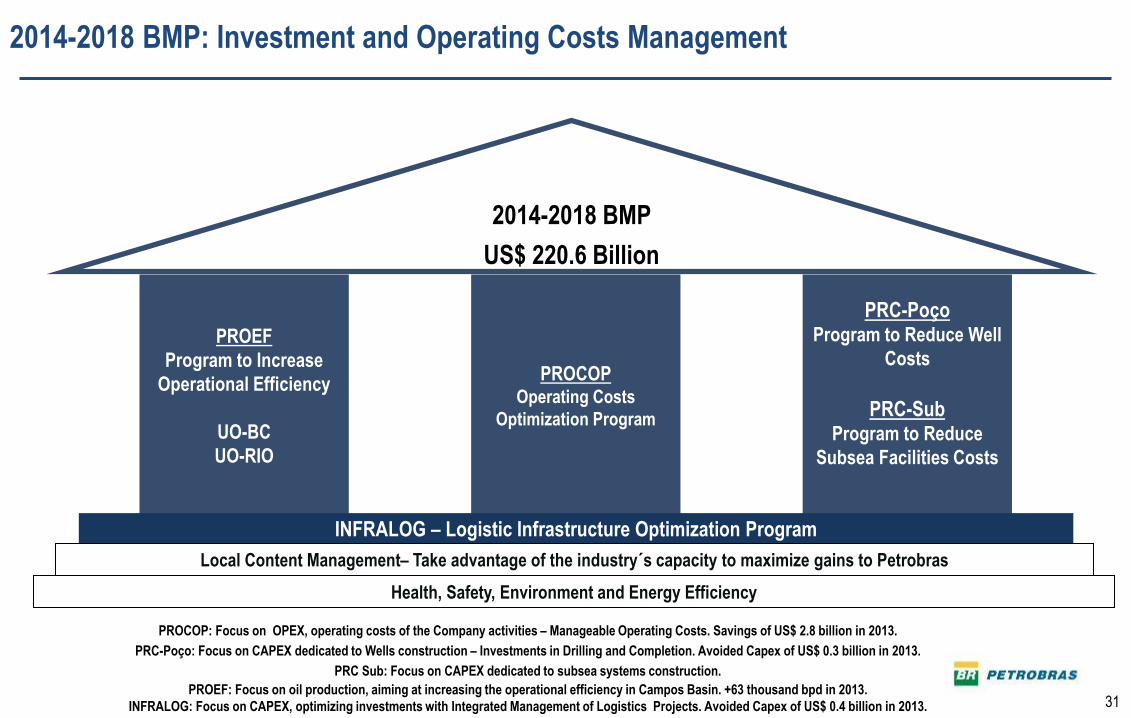
2014-2018 BMP: Investment and Operating Costs Management
2014-2018 BMP
US$ 220.6 Billion
PRC-Poço Program to Reduce Well
Costs
PRC-Sub Program to Reduce
Subsea Facilities Costs
PROEF
Program to Increase
Operational Efficiency
UO-BC
UO-RIO
PROCOP Operating Costs
Optimization Program
INFRALOG – Logistic Infrastructure Optimization Program
Local Content Management– Take advantage of the industry´s capacity to maximize gains to Petrobras
Health, Safety, Environment and Energy Efficiency
PROCOP: Focus on OPEX, operating costs of the Company activities – Manageable Operating Costs. Savings of US$ 2.8 billion in 2013.
PRC-Poço: Focus on CAPEX dedicated to Wells construction – Investments in Drilling and Completion. Avoided Capex of US$ 0.3 billion in 2013.
PRC Sub: Focus on CAPEX dedicated to subsea systems construction.
PROEF: Focus on oil production, aiming at increasing the operational efficiency in Campos Basin. +63 thousand bpd in 2013.
INFRALOG: Focus on CAPEX, optimizing investments with Integrated Management of Logistics Projects. Avoided Capex of US$ 0.4 billion in 2013.
32 32
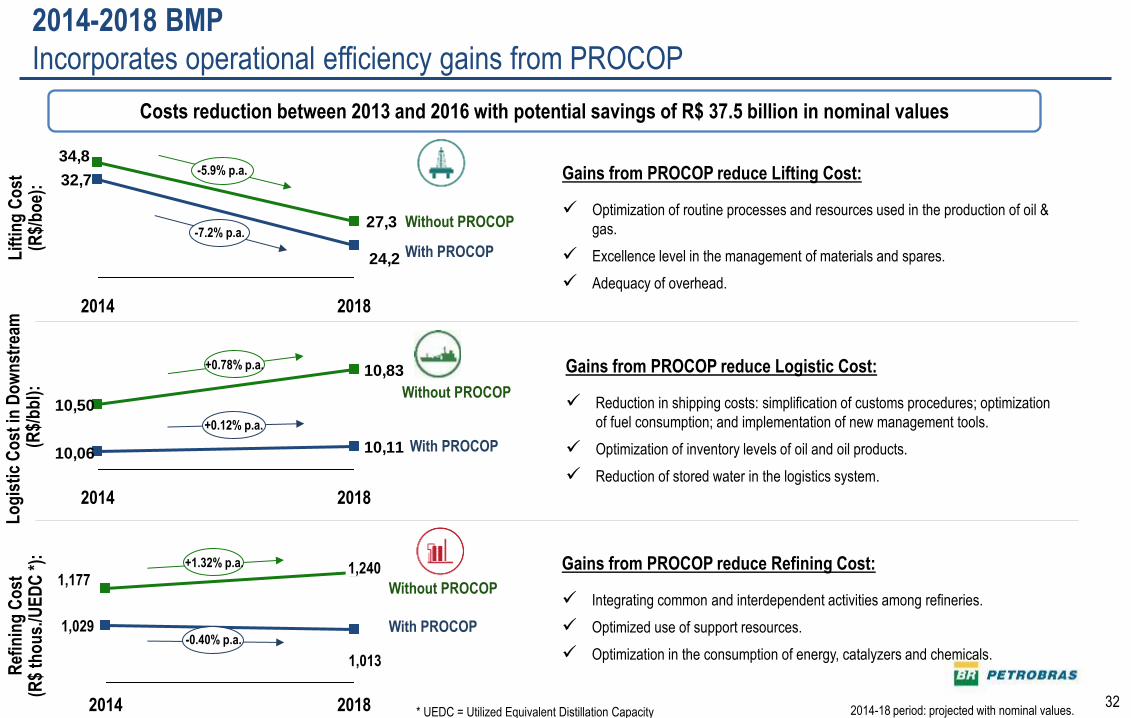
2014-2018 BMP
Incorporates operational efficiency gains from PROCOP
* UEDC = Utilized Equivalent Distillation Capacity 2014-18 period: projected with nominal values.
Lif
tin
g C
ost
(R
$/b
oe)
:
27,3
34,8
24,2
32,7
2018 2014
-7.2% p.a.
-5.9% p.a.
10,83
10,11
10,50
10,06
2018 2014
+0.12% p.a.
+0.78% p.a.
1,177
2018
1,013
1,240
2014
1,029 -0.40% p.a.
+1.32% p.a.
Costs reduction between 2013 and 2016 with potential savings of R$ 37.5 billion in nominal values
Lo
gis
tic
Co
st in
Do
wn
stre
am
(R
$/b
bl)
: R
efin
ing
Co
st
(R$
tho
us.
/UE
DC
*):
Without PROCOP
With PROCOP
Without PROCOP
With PROCOP
Without PROCOP
With PROCOP
Gains from PROCOP reduce Logistic Cost:
Reduction in shipping costs: simplification of customs procedures; optimization
of fuel consumption; and implementation of new management tools.
Optimization of inventory levels of oil and oil products.
Reduction of stored water in the logistics system.
Gains from PROCOP reduce Lifting Cost:
Optimization of routine processes and resources used in the production of oil &
gas.
Excellence level in the management of materials and spares.
Adequacy of overhead.
Gains from PROCOP reduce Refining Cost:
Integrating common and interdependent activities among refineries.
Optimized use of support resources.
Optimization in the consumption of energy, catalyzers and chemicals.
33 33
*Financial Area, Strategy and Corporate-Services
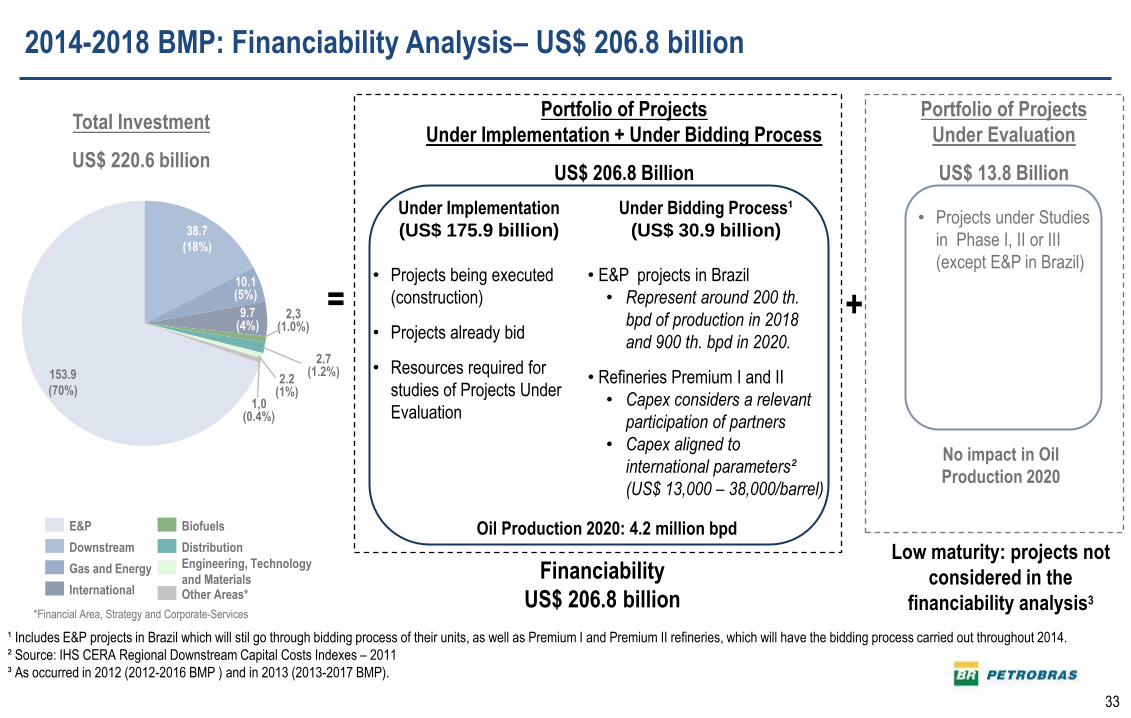
No impact in Oil
Production 2020
2014-2018 BMP: Financiability Analysis– US$ 206.8 billion
Total Investment
US$ 220.6 billion
• Projects under Studies
in Phase I, II or III
(except E&P in Brazil)
+
Financiability
US$ 206.8 billion
Low maturity: projects not
considered in the
financiability analysis3
38.7
(18%)
153.9
(70%) 2.2
(1%) 1,0
(0.4%)
2.7 (1.2%)
2,3 (1.0%)
9.7 (4%)
10.1 (5%)
Distribution
Biofuels
Downstream
Other Areas* International
Gas and Energy Engineering, Technology
and Materials
E&P
¹ Includes E&P projects in Brazil which will stil go through bidding process of their units, as well as Premium I and Premium II refineries, which will have the bidding process carried out throughout 2014.
² Source: IHS CERA Regional Downstream Capital Costs Indexes – 2011
³ As occurred in 2012 (2012-2016 BMP ) and in 2013 (2013-2017 BMP).
Portfolio of Projects
Under Evaluation
US$ 13.8 Billion
Portfolio of Projects
Under Implementation + Under Bidding Process
US$ 206.8 Billion
• Projects under Studies
in Phase I, II or III
(except E&P in Brazil)
Oil Production 2020: 4.2 million bpd
Under Implementation
(US$ 175.9 billion)
• Projects being executed
(construction)
• Projects already bid
• Resources required for
studies of Projects Under
Evaluation
Under Bidding Process¹
(US$ 30.9 billion)
• E&P projects in Brazil
• Represent around 200 th.
bpd of production in 2018
and 900 th. bpd in 2020.
• Refineries Premium I and II
• Capex considers a relevant
participation of partners
• Capex aligned to
international parameters²
(US$ 13,000 – 38,000/barrel)
=
34 34
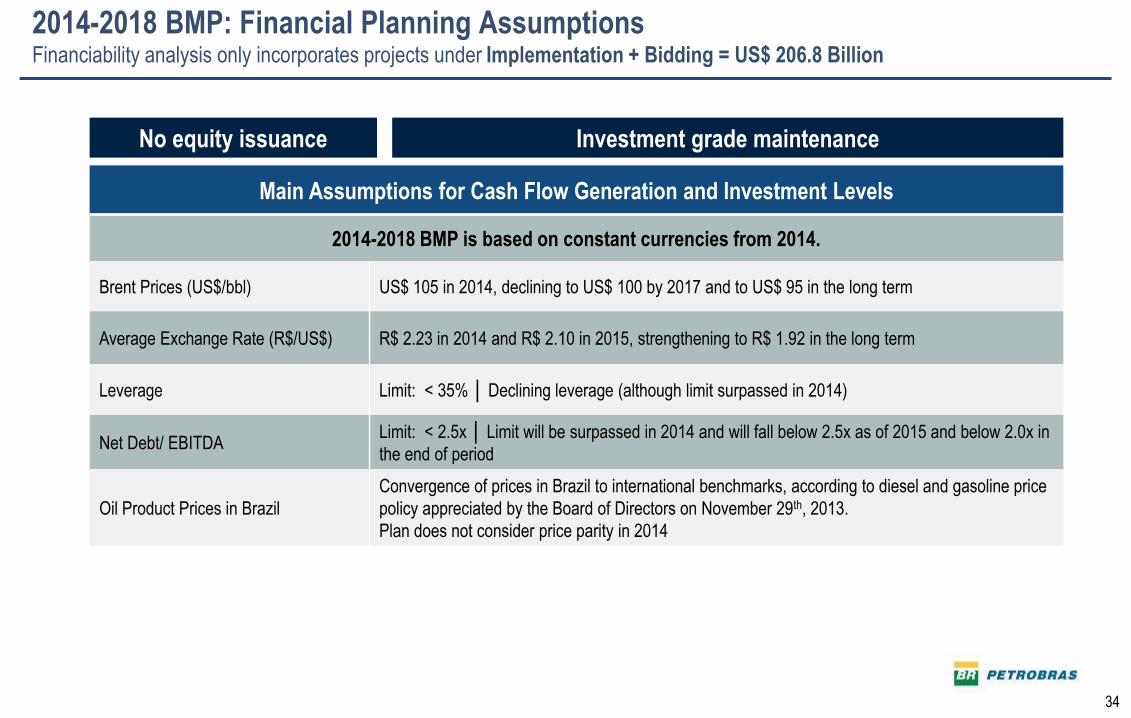
2014-2018 BMP: Financial Planning Assumptions Financiability analysis only incorporates projects under Implementation + Bidding = US$ 206.8 Billion
Main Assumptions for Cash Flow Generation and Investment Levels
2014-2018 BMP is based on constant currencies from 2014.
Brent Prices (US$/bbl) US$ 105 in 2014, declining to US$ 100 by 2017 and to US$ 95 in the long term
Average Exchange Rate (R$/US$) R$ 2.23 in 2014 and R$ 2.10 in 2015, strengthening to R$ 1.92 in the long term
Leverage Limit: < 35% │ Declining leverage (although limit surpassed in 2014)
Net Debt/ EBITDA Limit: < 2.5x │ Limit will be surpassed in 2014 and will fall below 2.5x as of 2015 and below 2.0x in
the end of period
Oil Product Prices in Brazil
Convergence of prices in Brazil to international benchmarks, according to diesel and gasoline price
policy appreciated by the Board of Directors on November 29th, 2013.
Plan does not consider price parity in 2014
No equity issuance Investment grade maintenance
35 35
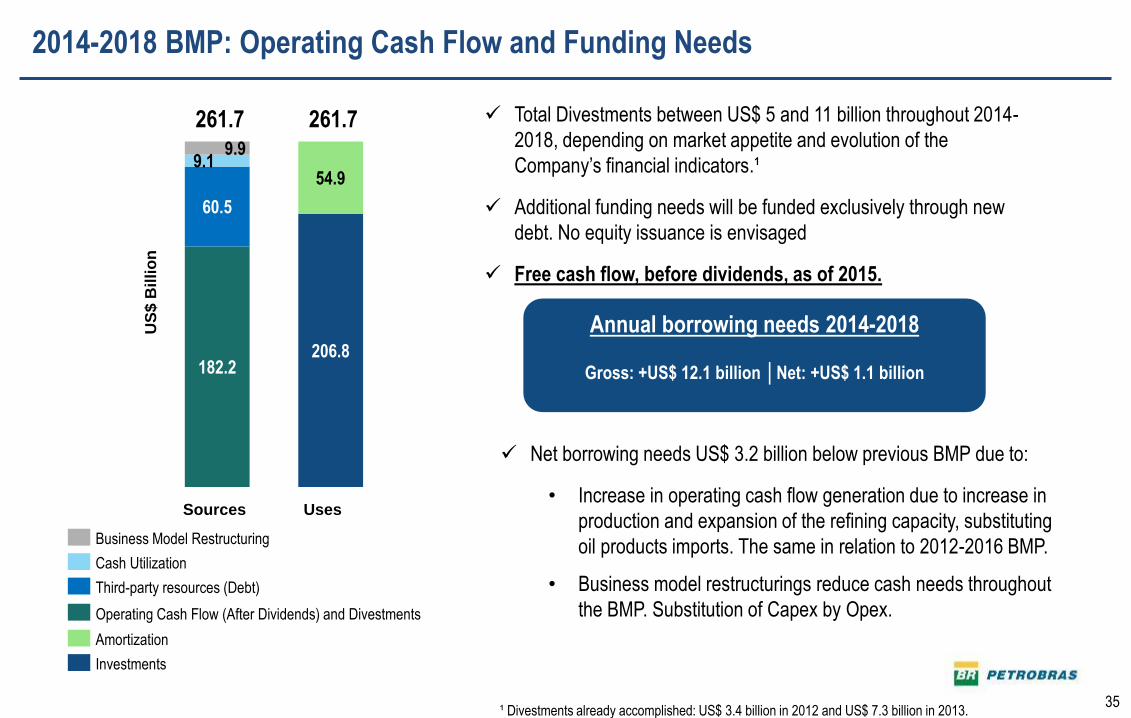
2014-2018 BMP: Operating Cash Flow and Funding Needs
61,3
165,0
Operating Cash Flow (After Dividends) and Divestments
Third-party resources (Debt)
Cash Utilization
Business Model Restructuring
207,1
39,8
Amortization
Investments
Annual borrowing needs 2014-2018
Gross: +US$ 12.1 billion │Net: +US$ 1.1 billion
Total Divestments between US$ 5 and 11 billion throughout 2014-
2018, depending on market appetite and evolution of the
Company’s financial indicators.¹
Additional funding needs will be funded exclusively through new
debt. No equity issuance is envisaged
Free cash flow, before dividends, as of 2015.
Net borrowing needs US$ 3.2 billion below previous BMP due to:
• Increase in operating cash flow generation due to increase in
production and expansion of the refining capacity, substituting
oil products imports. The same in relation to 2012-2016 BMP.
• Business model restructurings reduce cash needs throughout
the BMP. Substitution of Capex by Opex.
182.2
60.5
9.1 9.9
206.8
54.9
261.7 261.7
Fontes Usos
US
$ b
ilhão
Sources Uses
US
$ B
illi
on
¹ Divestments already accomplished: US$ 3.4 billion in 2012 and US$ 7.3 billion in 2013.
36 36
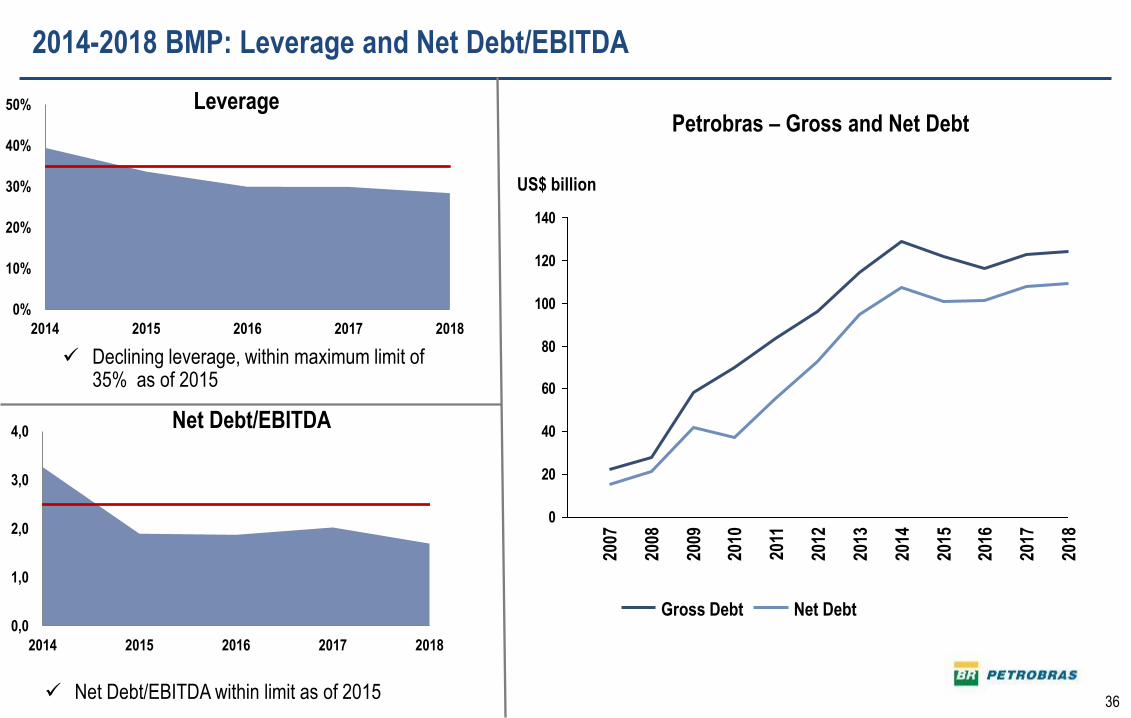
2014-2018 BMP: Leverage and Net Debt/EBITDA
Net Debt/EBITDA within limit as of 2015
Leverage
Net Debt/EBITDA
Declining leverage, within maximum limit of 35% as of 2015
0
20
40
60
80
100
120
140
2008
2009
2010
2011
2012
2018
2013
2014
2015
2016
2017
2007
Net Debt Gross Debt
US$ billion
Petrobras – Gross and Net Debt
0%
10%
20%
30%
40%
50%
2014 2015 2016 2017 2018
0,0
1,0
2,0
3,0
4,0
2014 2015 2016 2017 2018
37
FX Rate Sensitivity
38
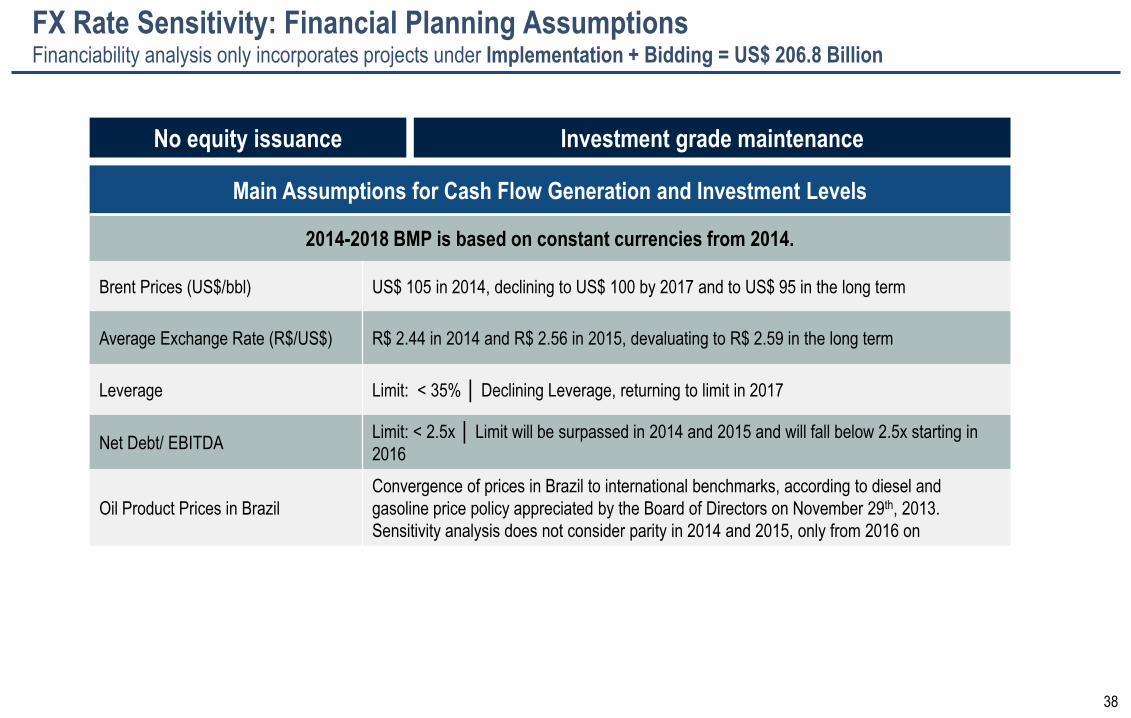
FX Rate Sensitivity: Financial Planning Assumptions Financiability analysis only incorporates projects under Implementation + Bidding = US$ 206.8 Billion
Main Assumptions for Cash Flow Generation and Investment Levels
2014-2018 BMP is based on constant currencies from 2014.
Brent Prices (US$/bbl) US$ 105 in 2014, declining to US$ 100 by 2017 and to US$ 95 in the long term
Average Exchange Rate (R$/US$) R$ 2.44 in 2014 and R$ 2.56 in 2015, devaluating to R$ 2.59 in the long term
Leverage Limit: < 35% │ Declining Leverage, returning to limit in 2017
Net Debt/ EBITDA Limit: < 2.5x │ Limit will be surpassed in 2014 and 2015 and will fall below 2.5x starting in
2016
Oil Product Prices in Brazil
Convergence of prices in Brazil to international benchmarks, according to diesel and
gasoline price policy appreciated by the Board of Directors on November 29th, 2013.
Sensitivity analysis does not consider parity in 2014 and 2015, only from 2016 on
No equity issuance Investment grade maintenance
39
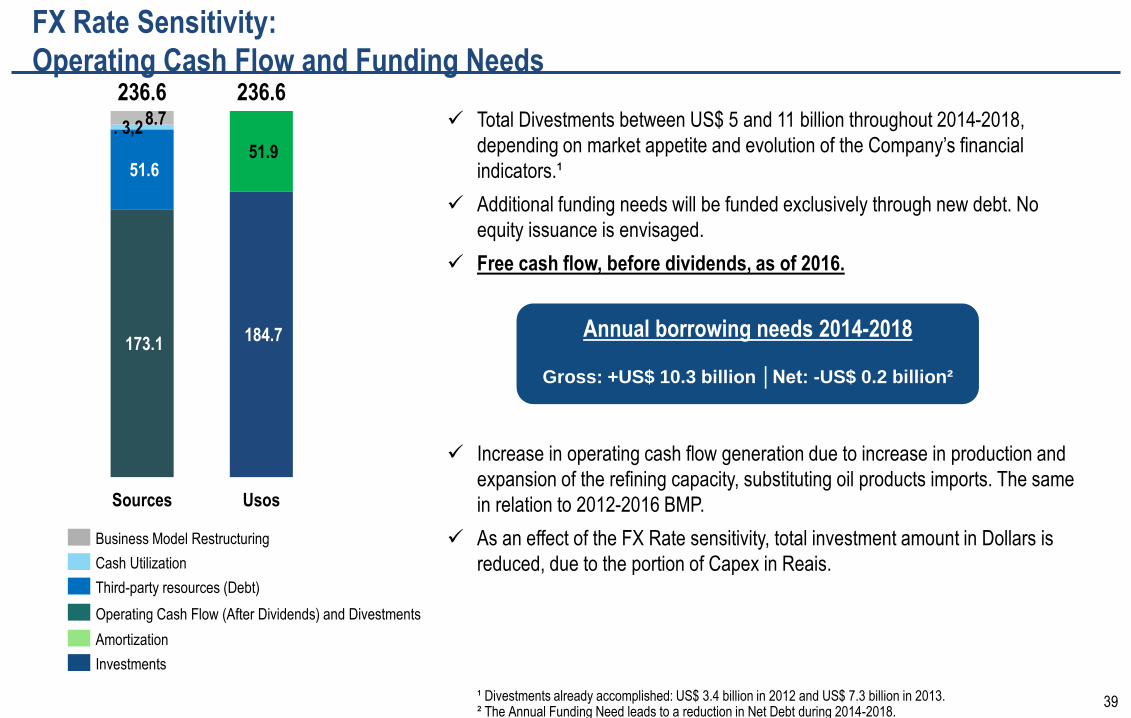
FX Rate Sensitivity:
Operating Cash Flow and Funding Needs
61,3
165,0
207,1
39,8
Annual borrowing needs 2014-2018
Gross: +US$ 10.3 billion │Net: -US$ 0.2 billion²
Total Divestments between US$ 5 and 11 billion throughout 2014-2018,
depending on market appetite and evolution of the Company’s financial
indicators.¹
Additional funding needs will be funded exclusively through new debt. No
equity issuance is envisaged.
Free cash flow, before dividends, as of 2016.
Increase in operating cash flow generation due to increase in production and
expansion of the refining capacity, substituting oil products imports. The same
in relation to 2012-2016 BMP.
As an effect of the FX Rate sensitivity, total investment amount in Dollars is
reduced, due to the portion of Capex in Reais.
173.1
51.6
. 3,2 8.7
184.7
51.9
236.6 236.6
Sources Usos
¹ Divestments already accomplished: US$ 3.4 billion in 2012 and US$ 7.3 billion in 2013. ² The Annual Funding Need leads to a reduction in Net Debt during 2014-2018.
Operating Cash Flow (After Dividends) and Divestments
Third-party resources (Debt)
Cash Utilization
Business Model Restructuring
Amortization
Investments
40
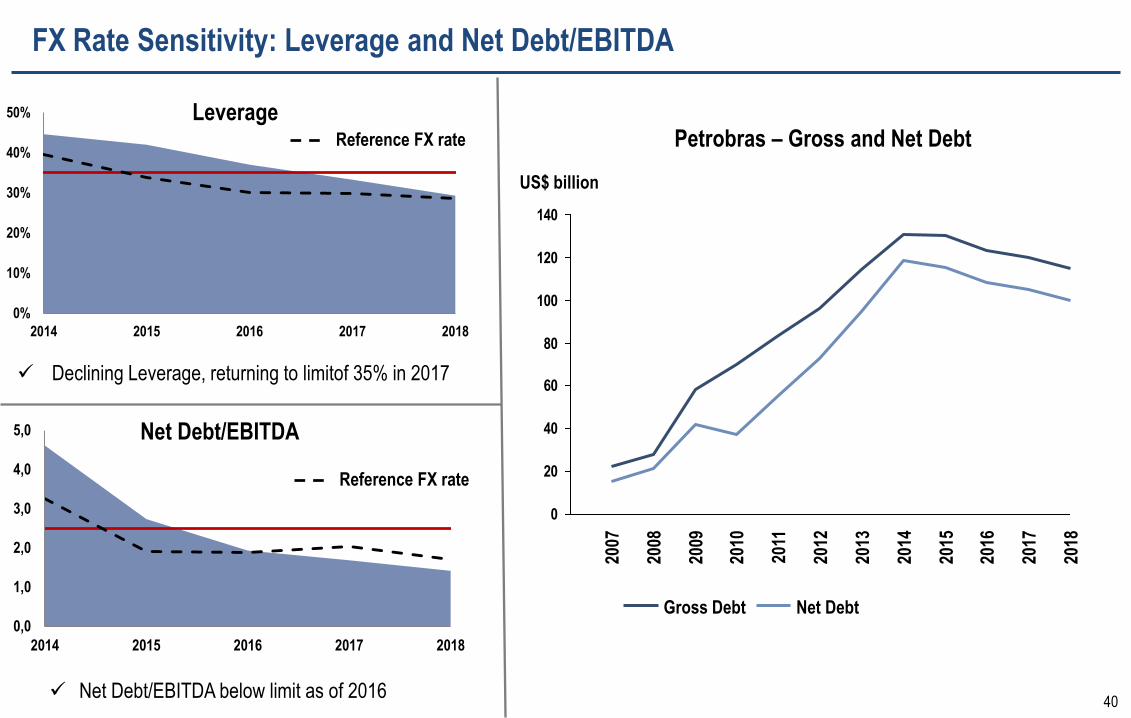
FX Rate Sensitivity: Leverage and Net Debt/EBITDA
Declining Leverage, returning to limitof 35% in 2017
Leverage
Net Debt/EBITDA
Net Debt/EBITDA below limit as of 2016
0
20
40
60
80
100
120
140
2016
2015
2008
2007
2010
2009
2018
2017
2014
2013
2012
2011
Net Debt Gross Debt
US$ billion
Petrobras – Gross and Net Debt
0%
10%
20%
30%
40%
50%
2014 2015 2016 2017 2018
0,0
1,0
2,0
3,0
4,0
5,0
2014 2015 2016 2017 2018
Reference FX rate
Reference FX rate
41
Investment Sensitivity
(Portfolio Under Implementation
= US$175.9 billion)
42
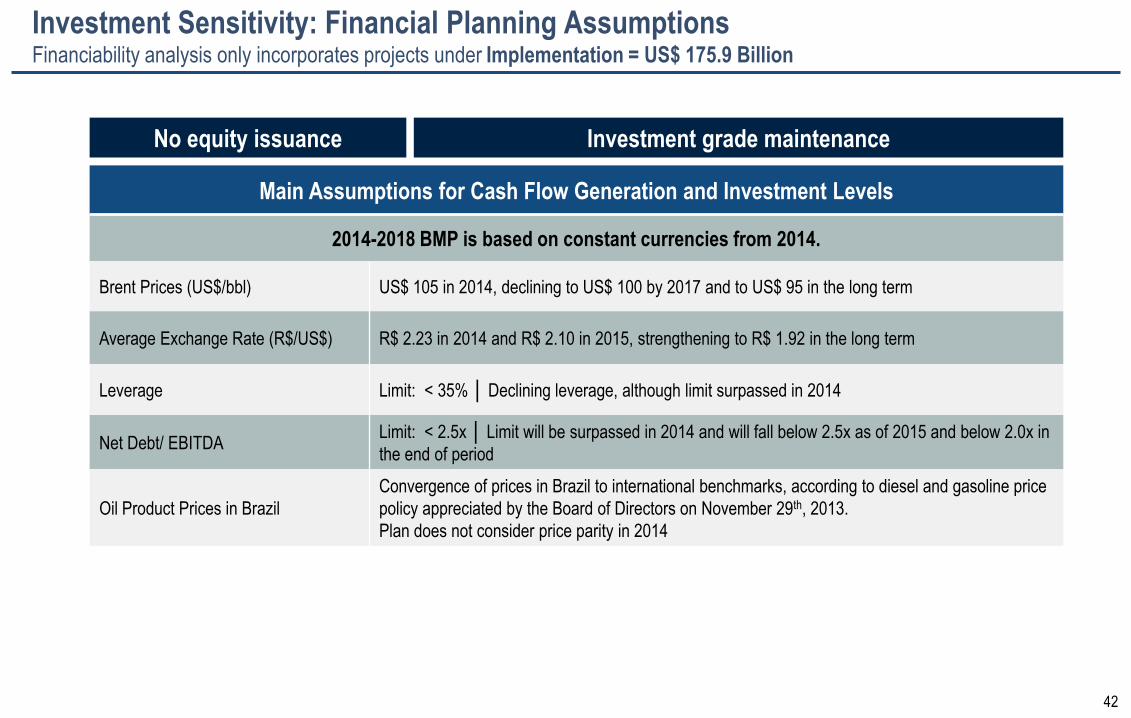
Investment Sensitivity: Financial Planning Assumptions Financiability analysis only incorporates projects under Implementation = US$ 175.9 Billion
Main Assumptions for Cash Flow Generation and Investment Levels
2014-2018 BMP is based on constant currencies from 2014.
Brent Prices (US$/bbl) US$ 105 in 2014, declining to US$ 100 by 2017 and to US$ 95 in the long term
Average Exchange Rate (R$/US$) R$ 2.23 in 2014 and R$ 2.10 in 2015, strengthening to R$ 1.92 in the long term
Leverage Limit: < 35% │ Declining leverage, although limit surpassed in 2014
Net Debt/ EBITDA Limit: < 2.5x │ Limit will be surpassed in 2014 and will fall below 2.5x as of 2015 and below 2.0x in
the end of period
Oil Product Prices in Brazil
Convergence of prices in Brazil to international benchmarks, according to diesel and gasoline price
policy appreciated by the Board of Directors on November 29th, 2013.
Plan does not consider price parity in 2014
No equity issuance Investment grade maintenance
43
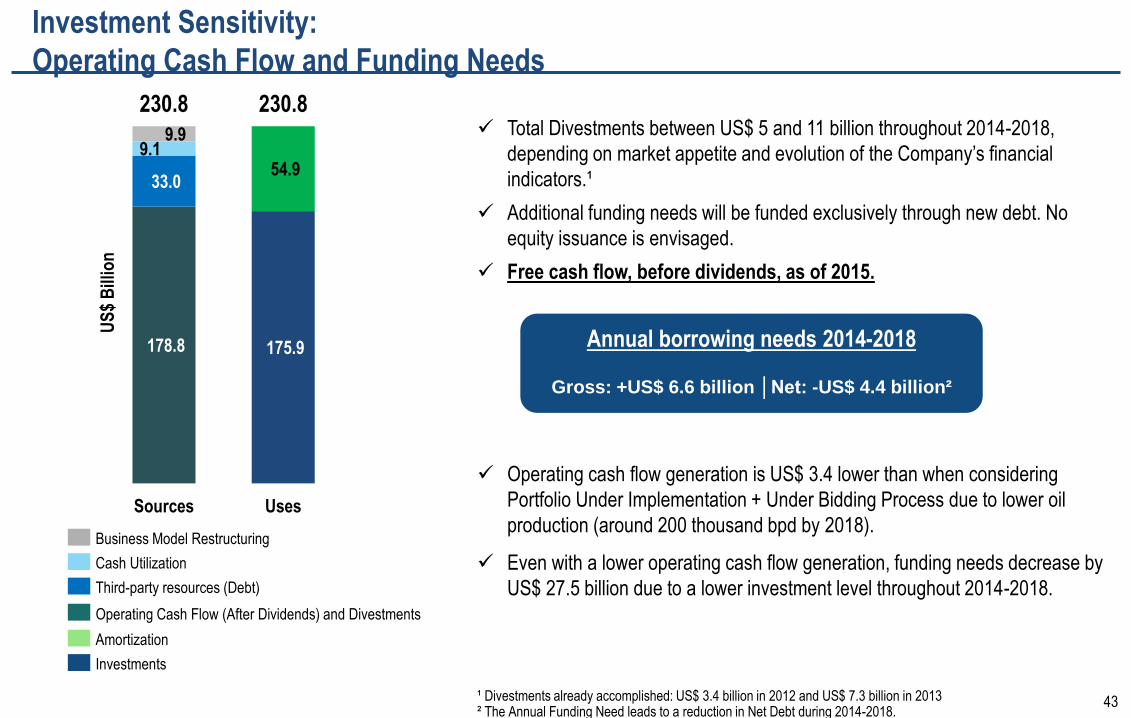
Investment Sensitivity:
Operating Cash Flow and Funding Needs
61,3
165,0
207,1
39,8 Total Divestments between US$ 5 and 11 billion throughout 2014-2018,
depending on market appetite and evolution of the Company’s financial
indicators.¹
Additional funding needs will be funded exclusively through new debt. No
equity issuance is envisaged.
Free cash flow, before dividends, as of 2015.
Operating cash flow generation is US$ 3.4 lower than when considering
Portfolio Under Implementation + Under Bidding Process due to lower oil
production (around 200 thousand bpd by 2018).
Even with a lower operating cash flow generation, funding needs decrease by
US$ 27.5 billion due to a lower investment level throughout 2014-2018.
178.8
33.0
9.1 9.9
175.9
54.9
230.8 230.8
Sources Uses
US
$ B
illio
n
¹ Divestments already accomplished: US$ 3.4 billion in 2012 and US$ 7.3 billion in 2013 ² The Annual Funding Need leads to a reduction in Net Debt during 2014-2018.
Annual borrowing needs 2014-2018
Gross: +US$ 6.6 billion │Net: -US$ 4.4 billion²
Third-party resources (Debt)
Cash Utilization
Business Model Restructuring
Amortization
Investments
Operating Cash Flow (After Dividends) and Divestments
44
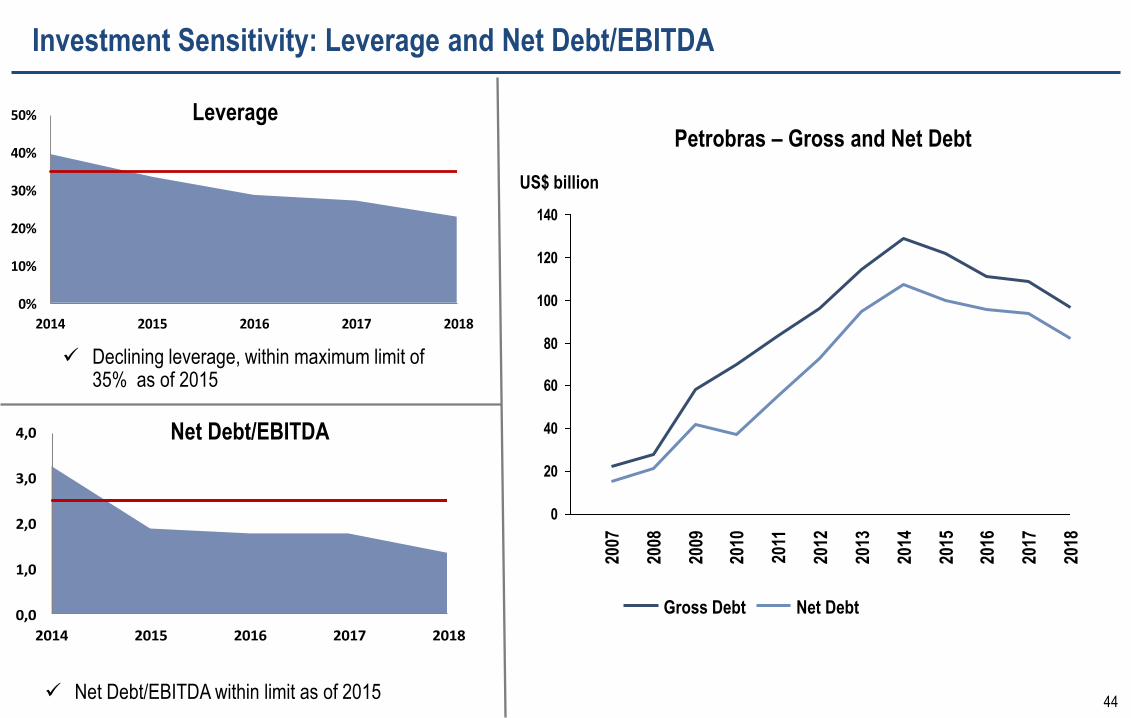
Investment Sensitivity: Leverage and Net Debt/EBITDA
Leverage
Net Debt/EBITDA
0
20
40
60
80
100
120
140
2008
2007
2012
2011
2018
2016
2017
2015
2014
2013
2010
2009
Gross Debt Net Debt
US$ billion
Petrobras – Gross and Net Debt
Declining leverage, within maximum limit of 35% as of 2015
Net Debt/EBITDA within limit as of 2015
0%
10%
20%
30%
40%
50%
2014 2015 2016 2017 2018
0,0
1,0
2,0
3,0
4,0
2014 2015 2016 2017 2018
45
Investment (Portfolio Under
Implementation = US$175.9 billion)
and FX Rate Sensitivity
46
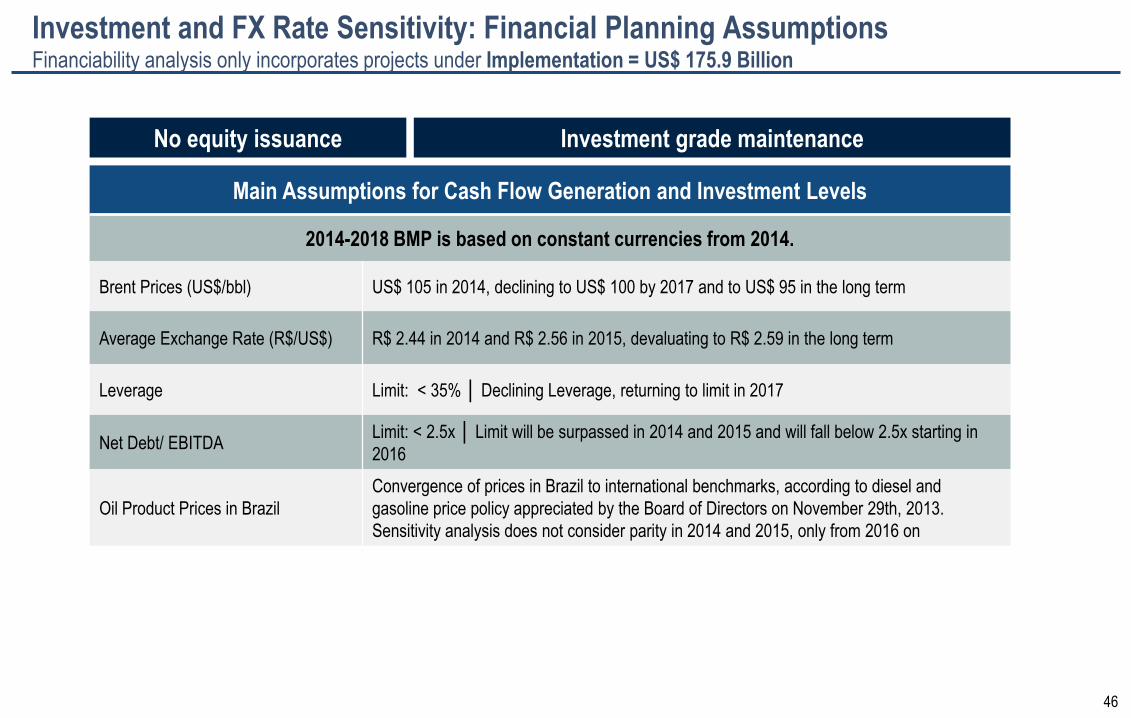
Investment and FX Rate Sensitivity: Financial Planning Assumptions Financiability analysis only incorporates projects under Implementation = US$ 175.9 Billion
Main Assumptions for Cash Flow Generation and Investment Levels
2014-2018 BMP is based on constant currencies from 2014.
Brent Prices (US$/bbl) US$ 105 in 2014, declining to US$ 100 by 2017 and to US$ 95 in the long term
Average Exchange Rate (R$/US$) R$ 2.44 in 2014 and R$ 2.56 in 2015, devaluating to R$ 2.59 in the long term
Leverage Limit: < 35% │ Declining Leverage, returning to limit in 2017
Net Debt/ EBITDA Limit: < 2.5x │ Limit will be surpassed in 2014 and 2015 and will fall below 2.5x starting in
2016
Oil Product Prices in Brazil
Convergence of prices in Brazil to international benchmarks, according to diesel and
gasoline price policy appreciated by the Board of Directors on November 29th, 2013.
Sensitivity analysis does not consider parity in 2014 and 2015, only from 2016 on
No equity issuance Investment grade maintenance
47
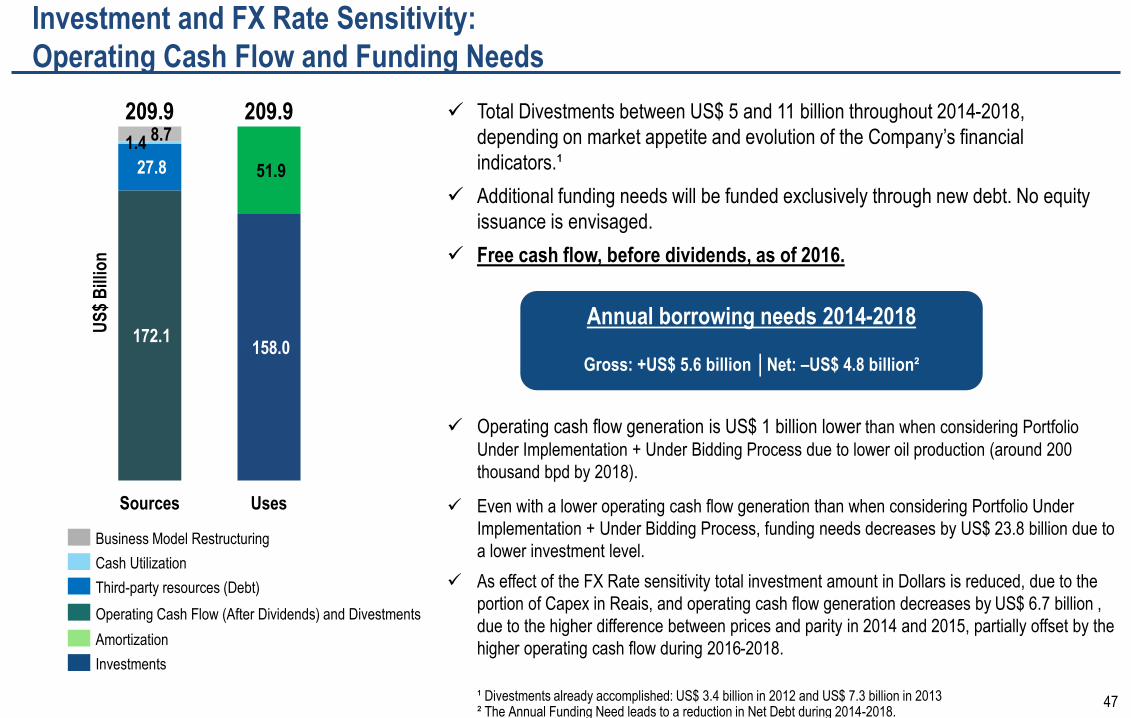
Investment and FX Rate Sensitivity:
Operating Cash Flow and Funding Needs
61,3
165,0
207,1
Total Divestments between US$ 5 and 11 billion throughout 2014-2018,
depending on market appetite and evolution of the Company’s financial
indicators.¹
Additional funding needs will be funded exclusively through new debt. No equity
issuance is envisaged.
Free cash flow, before dividends, as of 2016.
Operating cash flow generation is US$ 1 billion lower than when considering Portfolio
Under Implementation + Under Bidding Process due to lower oil production (around 200
thousand bpd by 2018).
Even with a lower operating cash flow generation than when considering Portfolio Under
Implementation + Under Bidding Process, funding needs decreases by US$ 23.8 billion due to
a lower investment level.
As effect of the FX Rate sensitivity total investment amount in Dollars is reduced, due to the
portion of Capex in Reais, and operating cash flow generation decreases by US$ 6.7 billion ,
due to the higher difference between prices and parity in 2014 and 2015, partially offset by the
higher operating cash flow during 2016-2018.
172.1
27.8
1.4 8.7
158.0
51.9
209.9 209.9
Sources Uses
US
$ B
illio
n
Annual borrowing needs 2014-2018
Gross: +US$ 5.6 billion │Net: –US$ 4.8 billion²
Operating Cash Flow (After Dividends) and Divestments
Third-party resources (Debt)
Cash Utilization
Business Model Restructuring
Amortization
Investments
¹ Divestments already accomplished: US$ 3.4 billion in 2012 and US$ 7.3 billion in 2013 ² The Annual Funding Need leads to a reduction in Net Debt during 2014-2018.
48
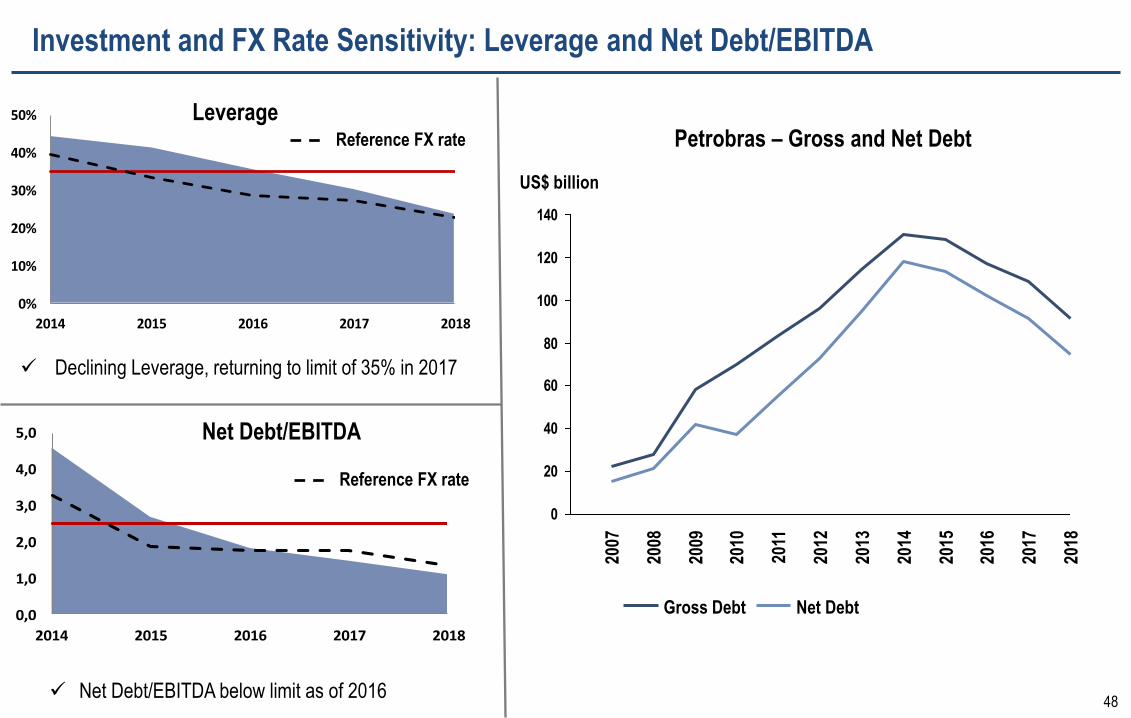
Investment and FX Rate Sensitivity: Leverage and Net Debt/EBITDA
Leverage
Net Debt/EBITDA
0
20
40
60
80
100
120
140
2018
2009
2008
2007
2016
2017
2015
2014
2013
2012
2011
2010
Gross Debt Net Debt
US$ billion
Petrobras – Gross and Net Debt
Declining Leverage, returning to limit of 35% in 2017
Net Debt/EBITDA below limit as of 2016
0%
10%
20%
30%
40%
50%
2014 2015 2016 2017 2018
0,0
1,0
2,0
3,0
4,0
5,0
2014 2015 2016 2017 2018
Reference FX rate
Reference FX rate
49
2014 – 2018
Business and Management Plan
The End