Embed Size (px)
Citation preview
1Moscow, 11 November 2014
Q3 AND 9M’14 US GAAP CONSOLIDATED FINANCIAL RESULTS
This document is confidential and has been prepared by NLMK (the “Company”) solely for use at the presentation of the Company and may not be reproduced, retransmitted or further distributed to any other person or published, in whole or in part, for any other purpose.
This document does not constitute or form part of any advertisement of securities, any offer or invitation to sell or issue or any solicitation of any offer to purchase or subscribe for, any shares in the Company or Global Depositary Shares (GDSs), nor shall it or any part of it nor the fact of its presentation or distribution form the basis of, or be relied on in connection with, any contract or investment decision.
No reliance may be placed for any purpose whatsoever on the information contained in this document or on assumptions made as to its completeness. No representation or warranty, express or implied, is given by the Company, its subsidiaries or any of their respective advisers, officers, employees or agents, as to the accuracy of the information or opinions or for any loss howsoever arising, directly or indirectly, from any use of this presentation or its contents.
The distribution of this document in other jurisdictions may be restricted by law and any person into whose possession this document comes should inform themselves about, and observe, any such restrictions.
This document may include forward-looking statements. These forward-looking statements include matters that are not historical facts or statements regarding the Company’s intentions, beliefs or current expectations concerning, among other things, the Company’s results of operations, financial condition, liquidity, prospects, growth, strategies, and the industry in which the Company operates. By their nature, forwarding-looking statements involve risks and uncertainties because they relate to events and depend on circumstances that may or may not occur in the future. The Company cautions you that forward-looking statements are not guarantees of future performance and that the Company’s actual results of operations, financial condition and liquidity and the development of the industry in which the Company operates may differ materially from those made in or suggested by the forward-looking statements contained in this document. In addition, even if the Company’s results of operations, financial condition and liquidity and the development of the industry in which the Company operates areconsistent with the forward-looking statements contained in this document, those results or developments may not be indicative of results or developments in future periods. The Company does not undertake any obligation to review or confirm analysts’ expectations or estimates or to update any forward-looking statements to reflect events that occur or circumstances that arise after the date of this presentation.
By attending this presentation you agree to be bound by the foregoing terms.
2
DISCLAIMER
CONTENT
1. Key results
2. Financial highlights
3. Segment results
3
OPERATING RESULTS
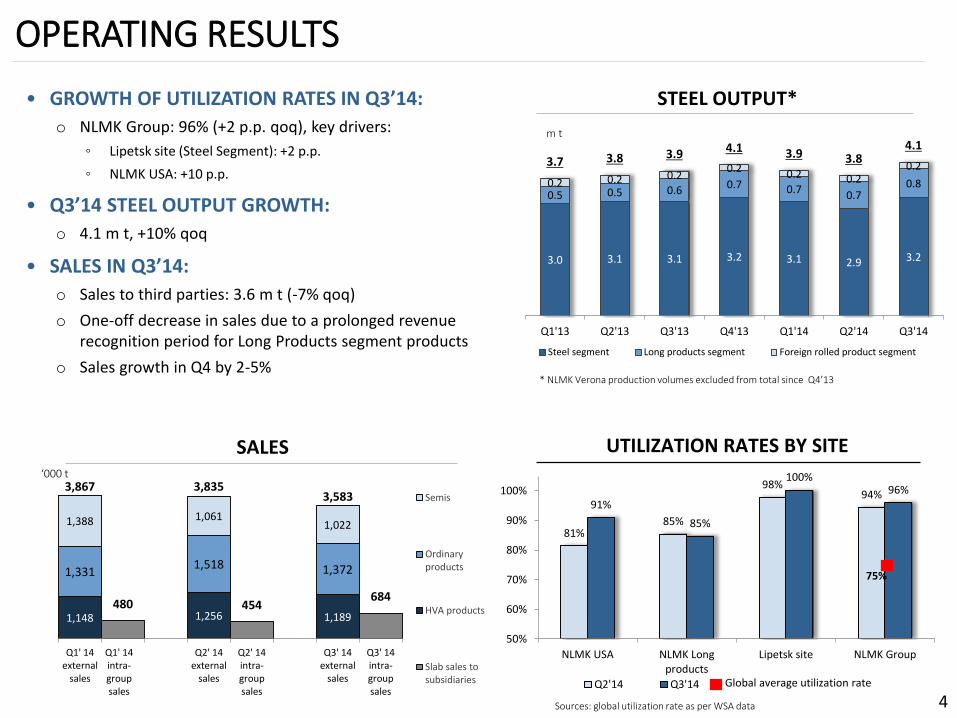
• GROWTH OF UTILIZATION RATES IN Q3’14:
o NLMK Group: 96% (+2 p.p. qoq), key drivers:
◦ Lipetsk site (Steel Segment): +2 p.p.
◦ NLMK USA: +10 p.p.
• Q3’14 STEEL OUTPUT GROWTH:
o 4.1 m t, +10% qoq
• SALES IN Q3’14:
o Sales to third parties: 3.6 m t (-7% qoq)
o One-off decrease in sales due to a prolonged revenue recognition period for Long Products segment products
o Sales growth in Q4 by 2-5%
4
3.0 3.1 3.1 3.2 3.1 2.9 3.2
0.5 0.5 0.6 0.7 0.7 0.70.80.2 0.2 0.2
0.2 0.2 0.20.23.7 3.8 3.9 4.1 3.9 3.84.1
Q1'13 Q2'13 Q3'13 Q4'13 Q1'14 Q2'14 Q3'14
Steel segment Long products segment Foreign rolled product segment
* NLMK Verona production volumes excluded from total since Q4’13
STEEL OUTPUT*
m t
81%85%
98%94%
91%
85%
100%96%
50%
60%
70%
80%
90%
100%
NLMK USA NLMK Longproducts
Lipetsk site NLMK Group
Q2'14 Q3'14 Global average utilization rate
75%
UTILIZATION RATES BY SITE
Sources: global utilization rate as per WSA data
SALES
1,148 1,256 1,189
1,3311,518 1,372
1,388 1,0611,022
3,867
480
3,835
454
3,583
684
Q1' 14external
sales
Q1' 14intra-groupsales
Q2' 14external
sales
Q2' 14intra-groupsales
Q3' 14external
sales
Q3' 14intra-groupsales
Semis
Ordinaryproducts
HVA products
Slab sales tosubsidiaries
‘000 t
0.74 0.74 0.81 0.84 0.74 0.77 0.90 0.77 0.77 0.87 0.940.36 0.45 0.43 0.39 0.42 0.45
0.520.52 0.52
0.62 0.521.10 1.20 1.26 1.32 1.32 1.411.60
1.46 1.551.74 1.69
0%
10%
20%
30%
40%
50%
0.0
0.5
1.0
1.5
2.0
2.5
3.0
Q1'12 Q2'12 Q3'12 Q4'12 Q1'13 Q2'13 Q3'13 Q4'13 Q1'14 Q2'14 Q3'14
Semi-finished products Flat products
Long products TOTAL
Russian market share (r.h.)
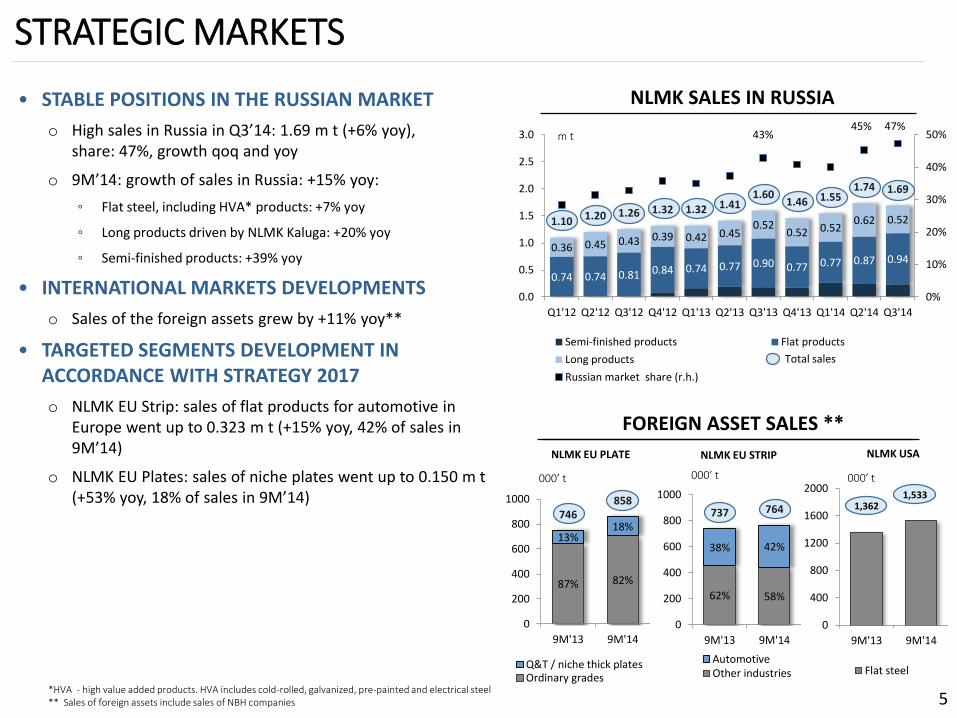
• STABLE POSITIONS IN THE RUSSIAN MARKET
o High sales in Russia in Q3’14: 1.69 m t (+6% yoy), share: 47%, growth qoq and yoy
o 9M’14: growth of sales in Russia: +15% yoy:
◦ Flat steel, including HVA* products: +7% yoy
◦ Long products driven by NLMK Kaluga: +20% yoy
◦ Semi-finished products: +39% yoy
• INTERNATIONAL MARKETS DEVELOPMENTS
o Sales of the foreign assets grew by +11% yoy**
• TARGETED SEGMENTS DEVELOPMENT IN ACCORDANCE WITH STRATEGY 2017
o NLMK EU Strip: sales of flat products for automotive in Europe went up to 0.323 m t (+15% yoy, 42% of sales in 9M’14)
o NLMK EU Plates: sales of niche plates went up to 0.150 m t (+53% yoy, 18% of sales in 9M’14)
5
STRATEGIC MARKETS
FOREIGN ASSET SALES **
m t
NLMK SALES IN RUSSIA
Total sales
43%47%
*HVA - high value added products. HVA includes cold-rolled, galvanized, pre-painted and electrical steel** Sales of foreign assets include sales of NBH companies
62% 58%
38% 42%
737 764
0
200
400
600
800
1000
9M'13 9M'14
AutomotiveOther industries
NLMK EU STRIP
000’ t
NLMK USA
000’ t
87% 82%
13%18%
746858
0
200
400
600
800
1000
9M'13 9M'14
Q&T / niche thick platesOrdinary gradesИтого
NLMK EU PLATE
000’ t
1,3621,533
0
400
800
1200
1600
2000
9M'13 9M'14
Flat steel
45%
FINANCIAL HIGHLIGHTS
6
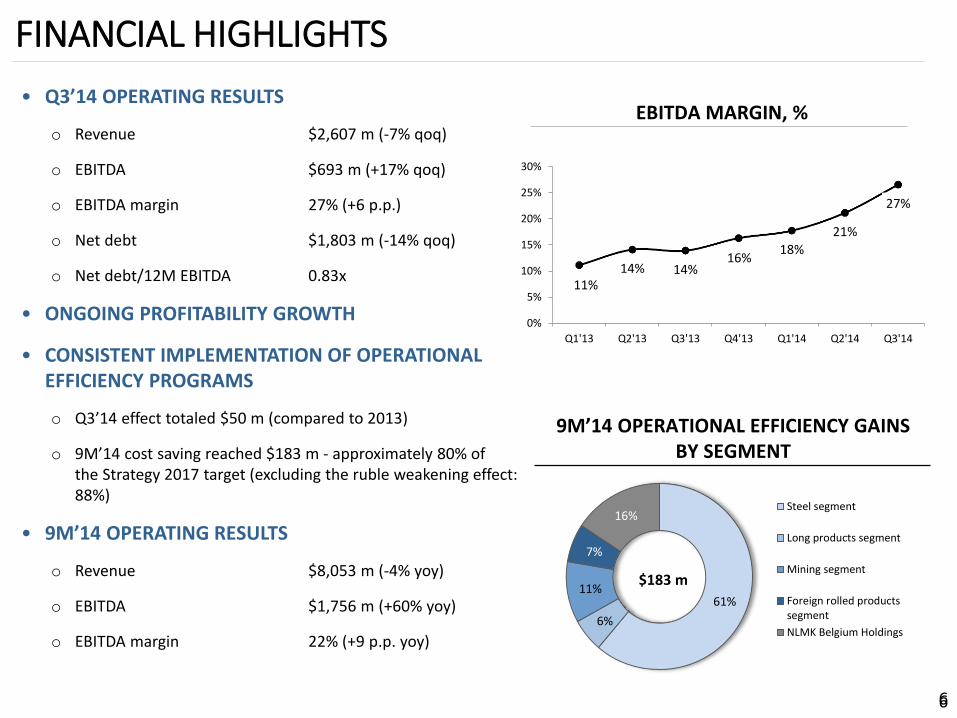
• Q3’14 OPERATING RESULTS
o Revenue $2,607 m (-7% qoq)
o EBITDA $693 m (+17% qoq)
o EBITDA margin 27% (+6 p.p.)
o Net debt $1,803 m (-14% qoq)
o Net debt/12M EBITDA 0.83х
• ONGOING PROFITABILITY GROWTH
• CONSISTENT IMPLEMENTATION OF OPERATIONAL EFFICIENCY PROGRAMS
o Q3’14 effect totaled $50 m (compared to 2013)
o 9M’14 cost saving reached $183 m - approximately 80% of the Strategy 2017 target (excluding the ruble weakening effect: 88%)
• 9M’14 OPERATING RESULTS
o Revenue $8,053 m (-4% yoy)
o EBITDA $1,756 m (+60% yoy)
o EBITDA margin 22% (+9 p.p. yoy)
EBITDA MARGIN, %
11%14% 14%
16%18%
21%
27%
0%
5%
10%
15%
20%
25%
30%
Q1'13 Q2'13 Q3'13 Q4'13 Q1'14 Q2'14 Q3'14
6
9M’14 OPERATIONAL EFFICIENCY GAINS BY SEGMENT
61%
6%
11%
7%
16%Steel segment
Long products segment
Mining segment
Foreign rolled productssegment
NLMK Belgium Holdings
$183 m
CONTENT
1. Key results
2. Financial highlights
3. Segment results
7
PROFITABILITY
8
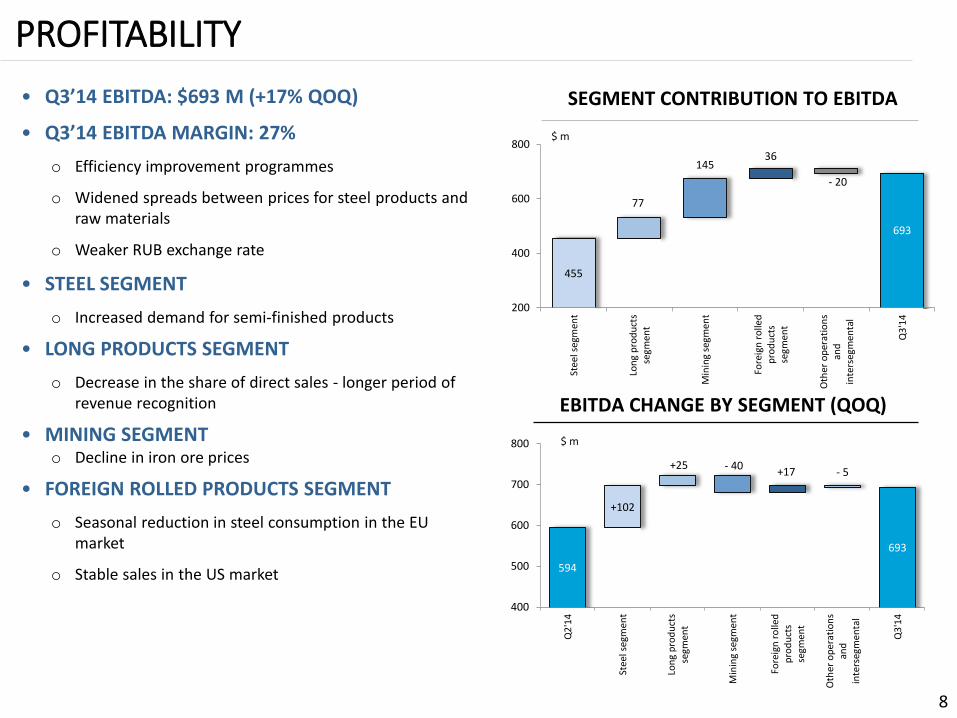
• Q3’14 EBITDA: $693 M (+17% QOQ)
• Q3’14 EBITDA MARGIN: 27%
o Efficiency improvement programmes
o Widened spreads between prices for steel products and raw materials
o Weaker RUB exchange rate
• STEEL SEGMENT
o Increased demand for semi-finished products
• LONG PRODUCTS SEGMENT
o Decrease in the share of direct sales - longer period of revenue recognition
• MINING SEGMENTo Decline in iron ore prices
• FOREIGN ROLLED PRODUCTS SEGMENT
o Seasonal reduction in steel consumption in the EU market
o Stable sales in the US market
EBITDA CHANGE BY SEGMENT (QOQ)
594
+102
+25 - 40+17 - 5
693
400
500
600
700
800
Q2
'14
Stee
l seg
men
t
Lon
g p
rod
uct
sse
gmen
t
Min
ing
segm
ent
Fore
ign
ro
lled
pro
du
cts
segm
ent
Oth
er o
per
atio
ns
and
inte
rseg
men
tal
Q3
'14
$ m
SEGMENT CONTRIBUTION TO EBITDA
455
77
14536
- 20
693
200
400
600
800
Stee
l seg
men
t
Lon
g p
rod
uct
sse
gmen
t
Min
ing
segm
ent
Fore
ign
ro
lled
pro
du
cts
segm
ent
Oth
er o
per
atio
ns
and
inte
rseg
men
tal
Q3
'14
$ m
EBITDA
Working capital changes
Other non-cash operations
Income tax
Net interest *
NET OPERATING CASH FLOW
Capital expenditures **
FREE CASH FLOW TO THE FIRM
Net repayments of borrowings/attraction of funds
FREE CASH FLOW TO EQUITY
Change in deposits and financial investment
FX rate change
CHANGE IN CASH
CASH FLOW IN Q3’14
9
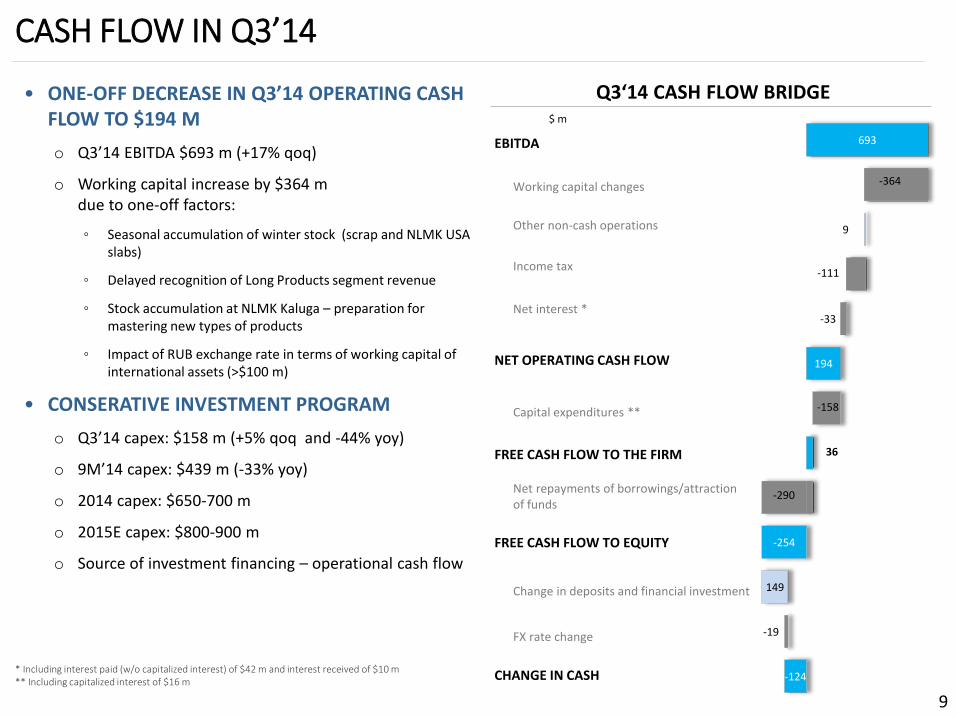
Q3‘14 CASH FLOW BRIDGE• ONE-OFF DECREASE IN Q3’14 OPERATING CASH FLOW TO $194 M
o Q3’14 EBITDA $693 m (+17% qoq)
o Working capital increase by $364 m due to one-off factors:
◦ Seasonal accumulation of winter stock (scrap and NLMK USA slabs)
◦ Delayed recognition of Long Products segment revenue
◦ Stock accumulation at NLMK Kaluga – preparation for mastering new types of products
◦ Impact of RUB exchange rate in terms of working capital of international assets (>$100 m)
• CONSERATIVE INVESTMENT PROGRAM
o Q3’14 capex: $158 m (+5% qoq and -44% yoy)
o 9M’14 capex: $439 m (-33% yoy)
o 2014 capex: $650-700 m
o 2015E capex: $800-900 m
o Source of investment financing – operational cash flow
$ m
-124
-19
149
-254
-290
36
-158
194
-33
-111
9
-364
693
* Including interest paid (w/o capitalized interest) of $42 m and interest received of $10 m** Including capitalized interest of $16 m
FREE CASH FLOW GROWTH
10
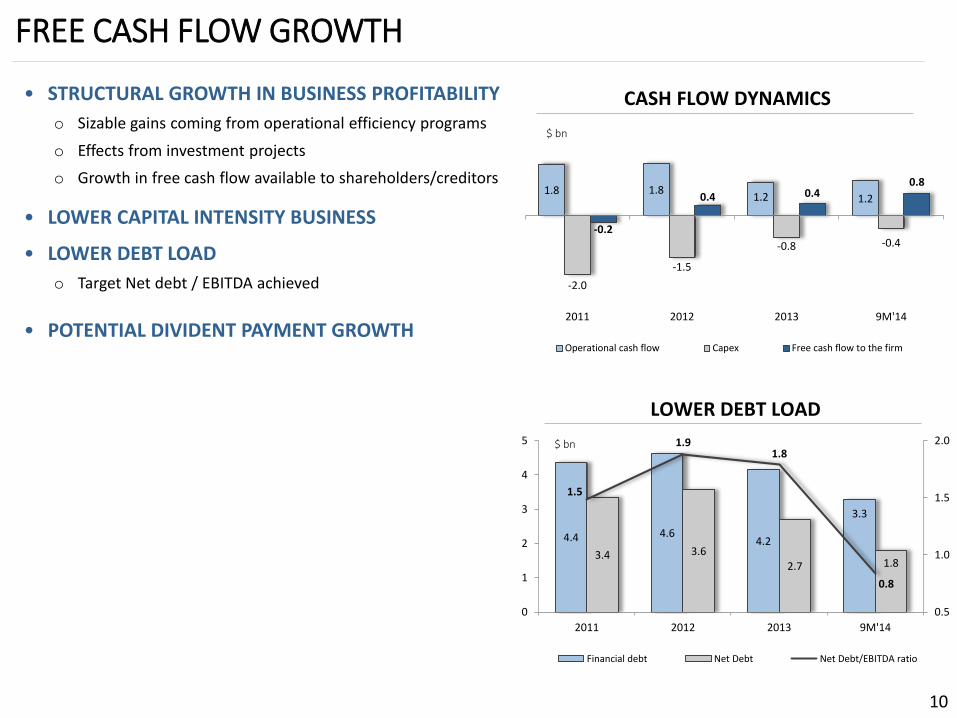
• STRUCTURAL GROWTH IN BUSINESS PROFITABILITY
o Sizable gains coming from operational efficiency programs
o Effects from investment projects
o Growth in free cash flow available to shareholders/creditors
• LOWER CAPITAL INTENSITY BUSINESS
• LOWER DEBT LOAD
o Target Net debt / EBITDA achieved
• POTENTIAL DIVIDENT PAYMENT GROWTH
1.8 1.81.2 1.2
-2.0
-1.5
-0.8 -0.4-0.2
0.4 0.40.8
2011 2012 2013 9М'14
Operational cash flow Capex Free cash flow to the firm
CASH FLOW DYNAMICS
$ bn
4.4 4.64.2
3.3
3.4 3.62.7 1.8
1.5
1.91.8
0.8
0.5
1.0
1.5
2.0
0
1
2
3
4
5
2011 2012 2013 9М'14
Financial debt Net Debt Net Debt/EBITDA ratio
LOWER DEBT LOAD
$ bn
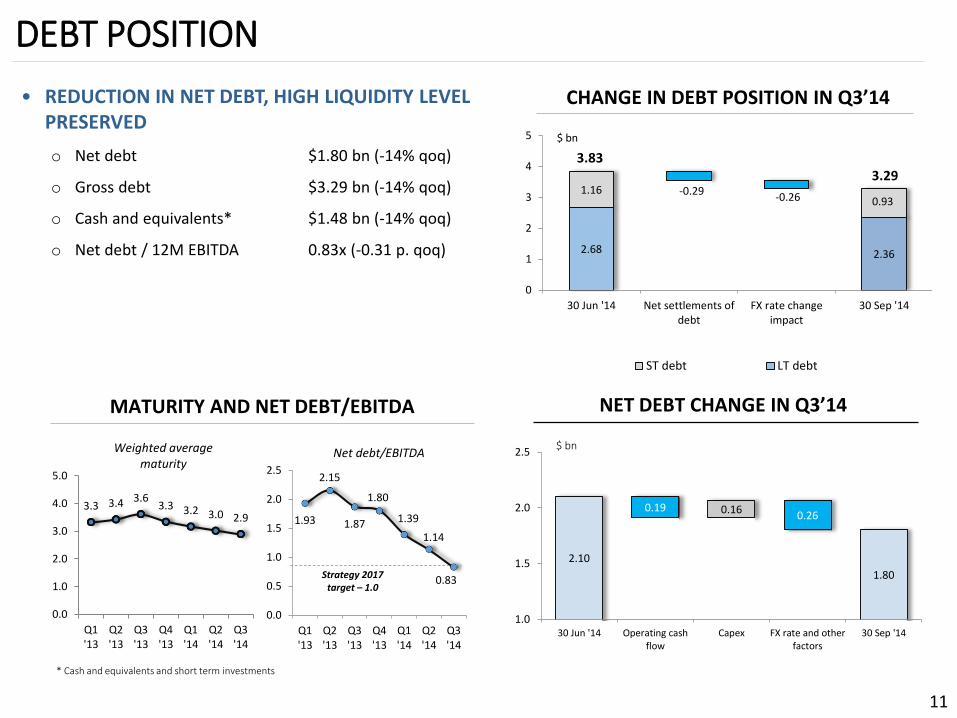
2.68 2.36
1.16 -0.29-0.26 0.93
0
1
2
3
4
5
30 Jun '14 Net settlements ofdebt
FX rate changeimpact
30 Sep '14
ST debt LT debt
DEBT POSITION
11
• REDUCTION IN NET DEBT, HIGH LIQUIDITY LEVEL PRESERVED
o Net debt $1.80 bn (-14% qoq)
o Gross debt $3.29 bn (-14% qoq)
o Cash and equivalents* $1.48 bn (-14% qoq)
o Net debt / 12M EBITDA 0.83х (-0.31 p. qoq)
CHANGE IN DEBT POSITION IN Q3’14
NET DEBT CHANGE IN Q3’14MATURITY AND NET DEBT/EBITDA
$ bn
Weighted average maturity
1.93
2.15
1.87
1.80
1.39
1.14
0.83
0.0
0.5
1.0
1.5
2.0
2.5
Q1'13
Q2'13
Q3'13
Q4'13
Q1'14
Q2'14
Q3'14
Strategy 2017 target – 1.0
Net debt/EBITDA
3.3 3.4 3.63.3 3.2 3.0 2.9
0.0
1.0
2.0
3.0
4.0
5.0
Q1'13
Q2'13
Q3'13
Q4'13
Q1'14
Q2'14
Q3'14
* Cash and equivalents and short term investments
2.10
0.19 0.16 0.26
1.80
1.0
1.5
2.0
2.5
30 Jun '14 Operating cashflow
Capex FX rate and otherfactors
30 Sep '14
$ bn
3.833.29
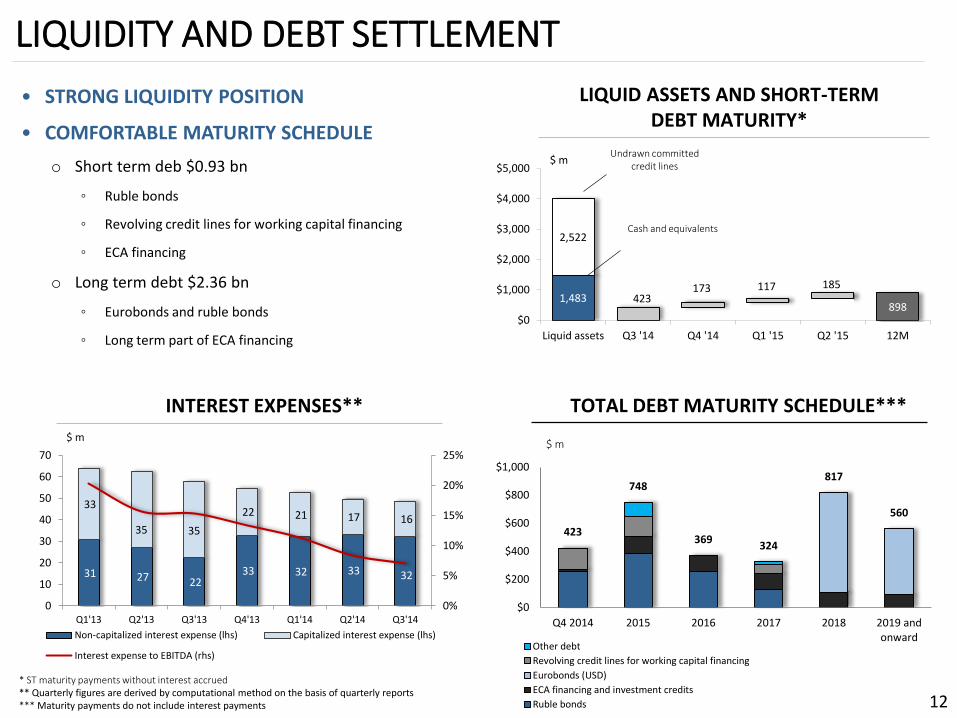
423
748
369324
817
560
$0
$200
$400
$600
$800
$1,000
Q4 2014 2015 2016 2017 2018 2019 andonward
Other debt
Revolving credit lines for working capital financing
Eurobonds (USD)
ECA financing and investment credits
Ruble bonds
LIQUIDITY AND DEBT SETTLEMENT
12
• STRONG LIQUIDITY POSITION
• COMFORTABLE MATURITY SCHEDULE
o Short term deb $0.93 bn
◦ Ruble bonds
◦ Revolving credit lines for working capital financing
◦ ECA financing
o Long term debt $2.36 bn
◦ Eurobonds and ruble bonds
◦ Long term part of ECA financing
TOTAL DEBT MATURITY SCHEDULE***INTEREST EXPENSES**
$ m
1,483898
2,522
423173 117 185
$0
$1,000
$2,000
$3,000
$4,000
$5,000
Liquid assets Q3 '14 Q4 '14 Q1 '15 Q2 '15 12M
$ mUndrawn committed
credit lines
Cash and equivalents
LIQUID ASSETS AND SHORT-TERM DEBT MATURITY*
31 27 22 33 32 33 32
33
35 35
22 21 17 16
0%
5%
10%
15%
20%
25%
0
10
20
30
40
50
60
70
Q1'13 Q2'13 Q3'13 Q4'13 Q1'14 Q2'14 Q3'14
Non-capitalized interest expense (lhs) Capitalized interest expense (lhs)
Interest expense to EBITDA (rhs)
* ST maturity payments without interest accrued** Quarterly figures are derived by computational method on the basis of quarterly reports*** Maturity payments do not include interest payments
$ m
Q4’14 OUTLOOK
• MARKET
o Russia – seasonal slowdown in the construction sector
o Europe – seasonal recovery in demand
o USA – stable market situation
• OPERATIONAL RESULTS
o Expected Group crude steel production: 4.0 m t
o Sales volumes will increase by 2-5%
13
CONTENT
1. Key results
2. Financial highlights
3. Segment results
14
1.66 1.68
1.53 1.60 1.74 1.73
1.64
0.35 0.37 0.47 0.21
0.30 0.27 0.37
0.080.21 0.19 0.15
0.26 0.350.45
0.0
0.5
1.0
1.5
2.0
2.5
Q1'13 Q2'13 Q3'13 Q4'13 Q1'14 Q2'14 Q3'14
Revenue from intercompany sales Revenue from sales to third parties
EBITDA
4%
10% 9%8%
13%18%
23%
EBITDA margin
24%
18%
6%5%6%5%
5%
9%
12%
9%
Iron ore materials
Coke and coal
Scrap
Ferroalloys
Other raw materials
Electricity
Natural gas
Other energy resources
Personnel costs
Other expenses and changes in inventories
Depreciation
STEEL SEGMENT
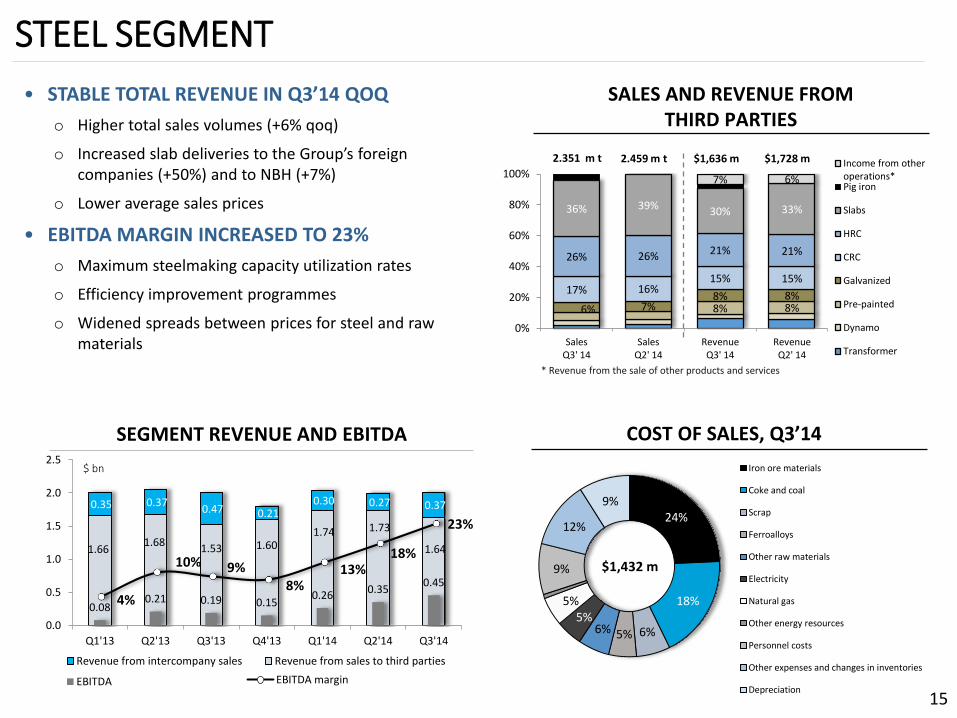
• STABLE TOTAL REVENUE IN Q3’14 QOQ
o Higher total sales volumes (+6% qoq)
o Increased slab deliveries to the Group’s foreign companies (+50%) and to NBH (+7%)
o Lower average sales prices
• EBITDA MARGIN INCREASED TO 23%
o Maximum steelmaking capacity utilization rates
o Efficiency improvement programmes
o Widened spreads between prices for steel and raw materials
COST OF SALES, Q3’14SEGMENT REVENUE AND EBITDA
SALES AND REVENUE FROM THIRD PARTIES
$ bn
15
8% 8%6% 7%8% 8%17% 16%
15% 15%
26% 26% 21% 21%
36% 39% 30% 33%
7% 6%
0%
20%
40%
60%
80%
100%
SalesQ3' 14
SalesQ2' 14
RevenueQ3' 14
RevenueQ2' 14
Income from otheroperations*Pig iron
Slabs
HRC
CRC
Galvanized
Pre-painted
Dynamo
Transformer
2.351 m t $1,636 m
* Revenue from the sale of other products and services
2.459 m t $1,728 m
$1,432 m
288 314355 371 337
430 378
59
113 114102
57
101
115
20 2340
12 752
77
0
70
140
210
280
350
420
490
560
Q1'13 Q2'13 Q3'13 Q4'13 Q1'14 Q2'14 Q3'14
Revenue from intra-group sales Revenue from third parties EBITDA
6%5%
8%
3% 2%
10%
16%
EBITDA margin
67%3%
1%
8%
9%
5%7%
Scrap
Ferroalloys
Other raw materials
Electricity
Personnel
Other expenses
Depreciation
$396 m
LONG PRODUCTS SEGMENT
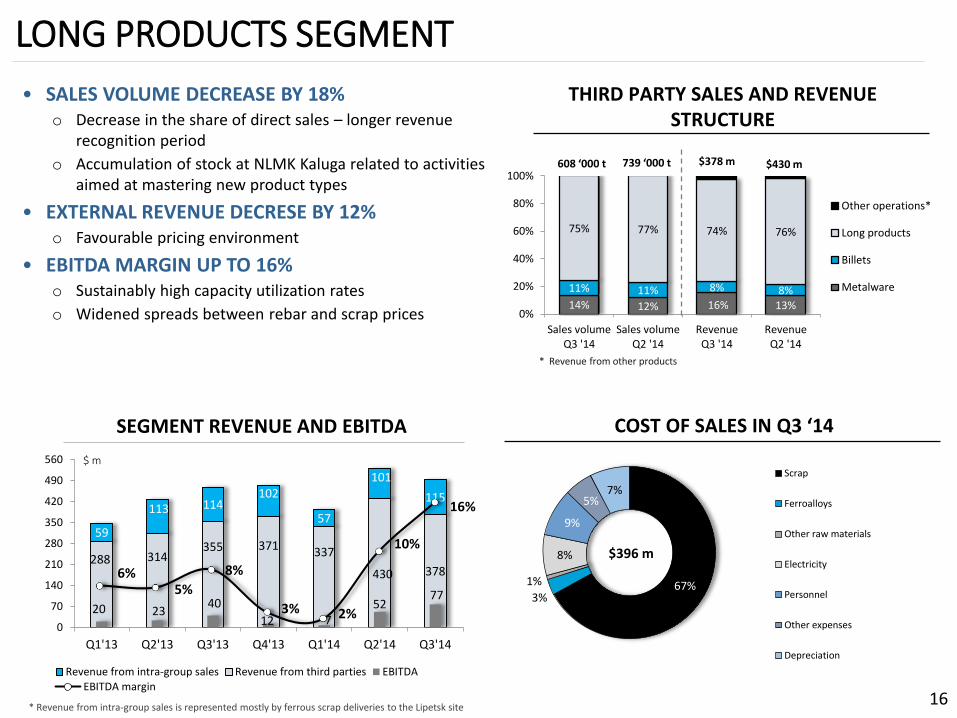
• SALES VOLUME DECREASE BY 18%o Decrease in the share of direct sales – longer revenue
recognition period
o Accumulation of stock at NLMK Kaluga related to activities aimed at mastering new product types
• EXTERNAL REVENUE DECRESE BY 12%o Favourable pricing environment
• EBITDA MARGIN UP TO 16%o Sustainably high capacity utilization rates
o Widened spreads between rebar and scrap prices
SEGMENT REVENUE AND EBITDA
THIRD PARTY SALES AND REVENUE STRUCTURE
$ m
16
COST OF SALES IN Q3 ‘14
* Revenue from intra-group sales is represented mostly by ferrous scrap deliveries to the Lipetsk site
14% 12% 16% 13%
11% 11% 8% 8%
75% 77% 74% 76%
0%
20%
40%
60%
80%
100%
Sales volumeQ3 '14
Sales volumeQ2 '14
RevenueQ3 '14
RevenueQ2 '14
Other operations*
Long products
Billets
Metalware
739 ‘000 t $430 m
* Revenue from other products
$378 m608 ‘000 t
92 100 86 94 88 117
70
245 249 226
259 229 189
178 215 227
190228 209
185145
0
100
200
300
400
500
Q1 '13 Q2 '13 Q3 '13 Q4 '13 Q1 '14 Q2 '14 Q3 '14Revenue from intersegmental salesRevenue from third partiesEBITDA
64%65%
61%65%
66%
60%58%
EBITDA margin
7%
23%
6%
23%
21%
19%
Raw materials
Electricity
Natural gas
Other energy resources
Personnel
Other expenses
Depreciation
MINING SEGMENT
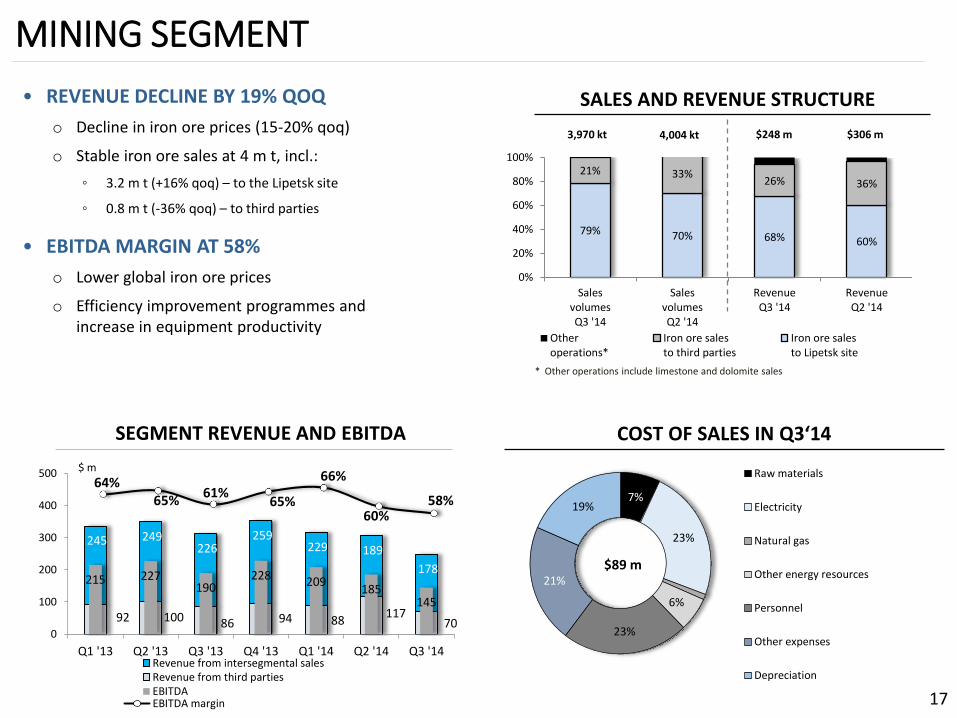
• REVENUE DECLINE BY 19% QOQ
o Decline in iron ore prices (15-20% qoq)
o Stable iron ore sales at 4 m t, incl.:
◦ 3.2 m t (+16% qoq) – to the Lipetsk site
◦ 0.8 m t (-36% qoq) – to third parties
• EBITDA MARGIN AT 58%
o Lower global iron ore prices
o Efficiency improvement programmes and increase in equipment productivity
SALES AND REVENUE STRUCTURE
17
COST OF SALES IN Q3‘14
79% 70% 68% 60%
21% 33%26% 36%
0%
20%
40%
60%
80%
100%
SalesvolumesQ3 '14
SalesvolumesQ2 '14
RevenueQ3 '14
RevenueQ2 '14
Otheroperations*
Iron ore salesto third parties
Iron ore salesto Lipetsk site
4,004 kt $306 m$248 m3,970 kt
* Other operations include limestone and dolomite sales
SEGMENT REVENUE AND EBITDA
$ m
$89 m
817730 750
445 471533 523
-26 -62 -35 30 23 19 36
-3%
-9%
-5%
7%5%
4%
7%
-10%
-8%
-6%
-4%
-2%
0%
2%
4%
6%
8%
10%
-200
0
200
400
600
800
1,000
Q1 '13 Q2 '13 Q3 '13 Q4 '13 Q1 '14 Q2 '14 Q3 '14
Revenue EBITDA EBITDA margin (r.h.)
FOREIGN ROLLED PRODUCTS SEGMENT
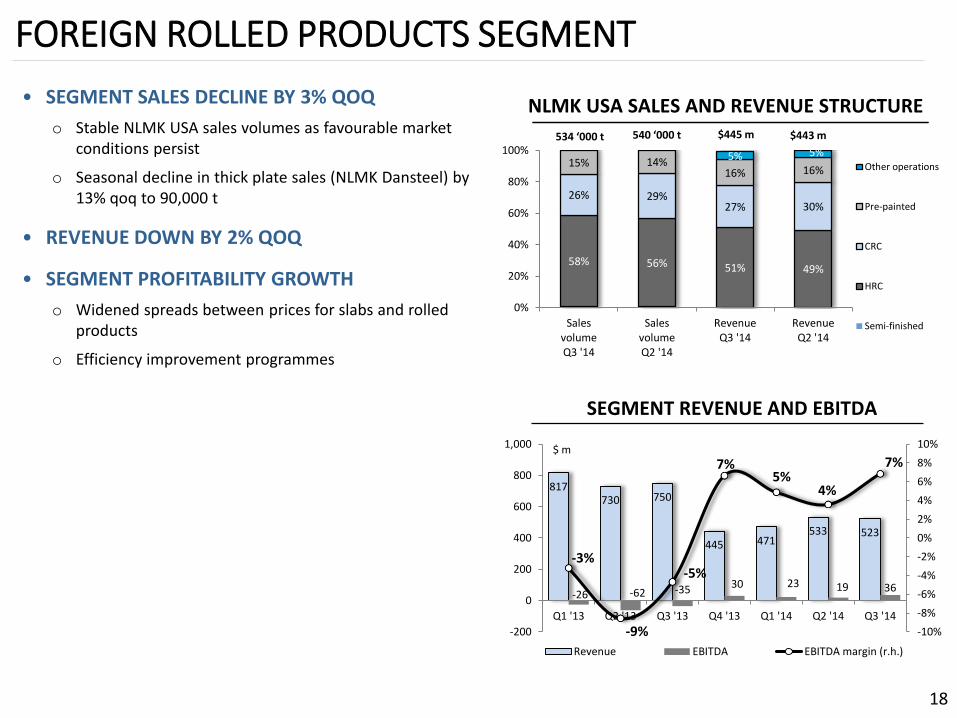
• SEGMENT SALES DECLINE BY 3% QOQ
o Stable NLMK USA sales volumes as favourable market conditions persist
o Seasonal decline in thick plate sales (NLMK Dansteel) by 13% qoq to 90,000 t
• REVENUE DOWN BY 2% QOQ
• SEGMENT PROFITABILITY GROWTH
o Widened spreads between prices for slabs and rolled products
o Efficiency improvement programmes
NLMK USA SALES AND REVENUE STRUCTURE
18
$ m
SEGMENT REVENUE AND EBITDA
58% 56% 51% 49%
26% 29%27% 30%
15% 14%16% 16%5% 5%
0%
20%
40%
60%
80%
100%
SalesvolumeQ3 '14
SalesvolumeQ2 '14
RevenueQ3 '14
RevenueQ2 '14
Other operations
Pre-painted
CRC
HRC
Semi-finished
540 ‘000 t $443 m$445 m534 ‘000 t

APPENDICES
19
SALES STRUCTURE
20
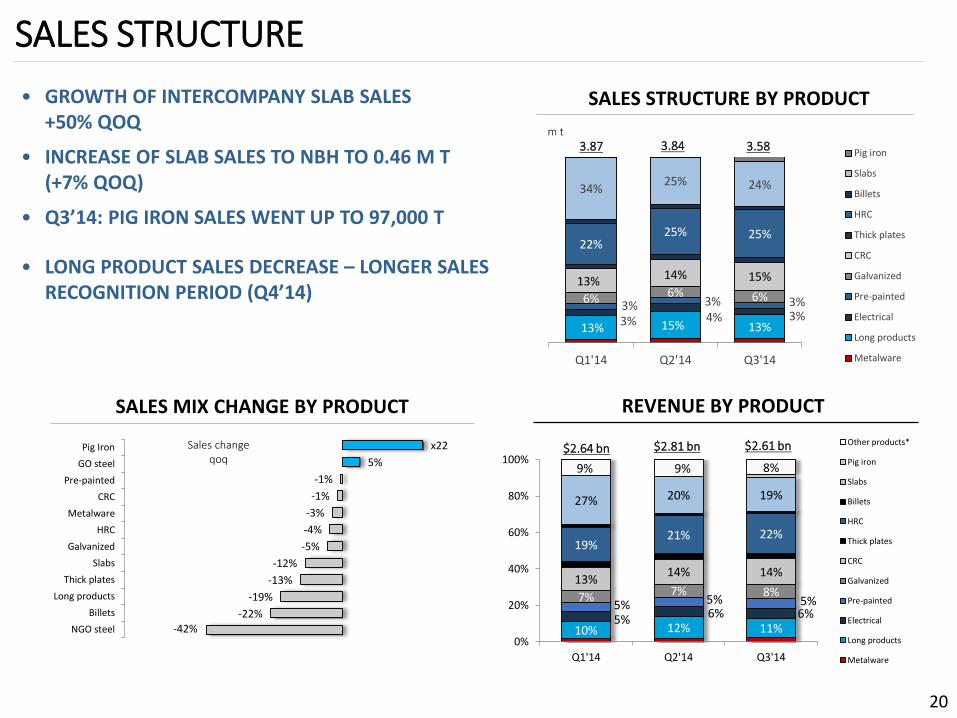
• GROWTH OF INTERCOMPANY SLAB SALES +50% QOQ
• INCREASE OF SLAB SALES TO NBH TO 0.46 M T (+7% QOQ)
• Q3’14: PIG IRON SALES WENT UP TO 97,000 T
• LONG PRODUCT SALES DECREASE – LONGER SALES RECOGNITION PERIOD (Q4’14)
SALES STRUCTURE BY PRODUCT
REVENUE BY PRODUCTSALES MIX CHANGE BY PRODUCT
13% 15% 13%3% 4% 3%3% 3% 3%6% 6% 6%
13% 14% 15%
22%25% 25%
34%25% 24%
Q1'14 Q2'14 Q3'14
Pig iron
Slabs
Billets
HRC
Thick plates
CRC
Galvanized
Pre-painted
Electrical
Long products
Metalware
3.87 3.84m t
3.58
10% 12% 11%5% 6% 6%5% 5% 5%7% 7% 8%
13%14% 14%
19%21% 22%
27% 20% 19%
9% 9% 8%
Q1'14 Q2'14 Q3'14
0%
20%
40%
60%
80%
100%
Other products*
Pig iron
Slabs
Billets
HRC
Thick plates
CRC
Galvanized
Pre-painted
Electrical
Long products
Metalware
$2.81 bn$2.64 bn $2.61 bn
-42%
-22%
-19%
-13%
-12%
-5%
-4%
-3%
-1%
-1%
5%
x22
NGO steel
Billets
Long products
Thick plates
Slabs
Galvanized
HRC
Metalware
CRC
Pre-painted
GO steel
Pig Iron Sales changeqoq
SALES GEOGRAPHY
21
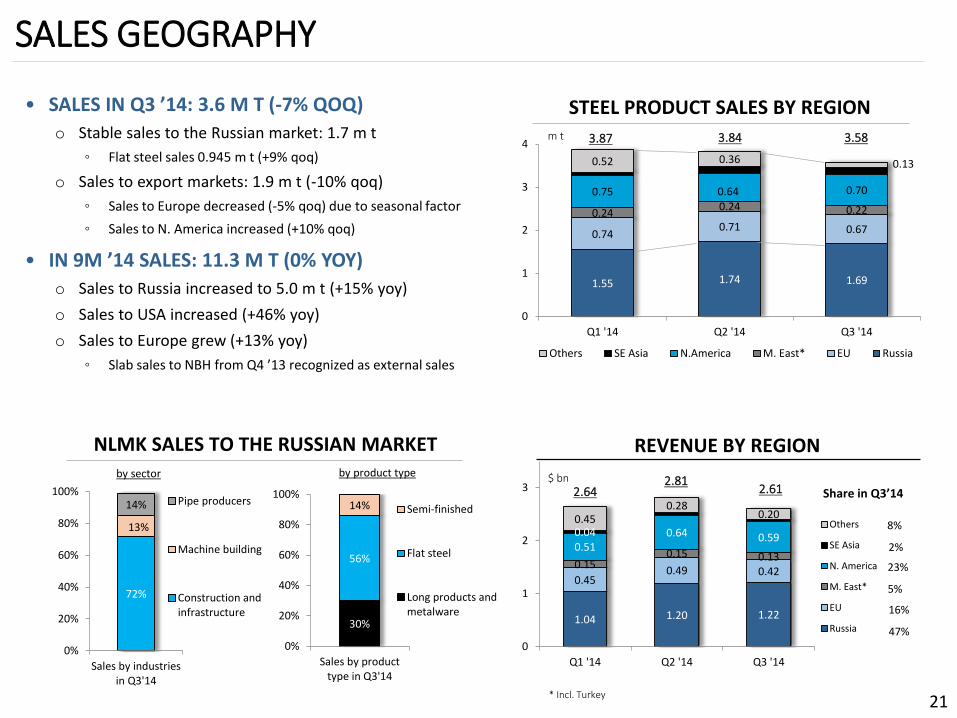
• SALES IN Q3 ’14: 3.6 M T (-7% QOQ)
o Stable sales to the Russian market: 1.7 m t
◦ Flat steel sales 0.945 m t (+9% qoq)
o Sales to export markets: 1.9 m t (-10% qoq)
◦ Sales to Europe decreased (-5% qoq) due to seasonal factor
◦ Sales to N. America increased (+10% qoq)
• IN 9M ’14 SALES: 11.3 M T (0% YOY)
o Sales to Russia increased to 5.0 m t (+15% yoy)
o Sales to USA increased (+46% yoy)
o Sales to Europe grew (+13% yoy)
◦ Slab sales to NBH from Q4 ’13 recognized as external sales
1.55 1.74 1.69
0.740.71 0.67
0.240.24 0.22
0.75 0.64 0.70
0.52 0.36 0.13
0
1
2
3
4
Q1 '14 Q2 '14 Q3 '14
Others SE Asia N.America M. East* EU Russia
1.04 1.20 1.22
0.450.49 0.42
0.150.15 0.13
0.510.64 0.590.04
0.450.28
0.20
0
1
2
3
Q1 '14 Q2 '14 Q3 '14
Others
SE Asia
N. America
M. East*
EU
Russia
2.64$ bn 2.81
2.61
m t 3.87 3.84
Share in Q3’14
8%
2%
23%
5%
16%
47%
* Incl. Turkey
3.58
STEEL PRODUCT SALES BY REGION
REVENUE BY REGIONNLMK SALES TO THE RUSSIAN MARKET
72%
13%
14%
0%
20%
40%
60%
80%
100%
Sales by industriesin Q3'14
Pipe producers
Machine building
Construction andinfrastructure
30%
56%
14%
0%
20%
40%
60%
80%
100%
Sales by producttype in Q3'14
Semi-finished
Flat steel
Long products andmetalware
by sector by product type
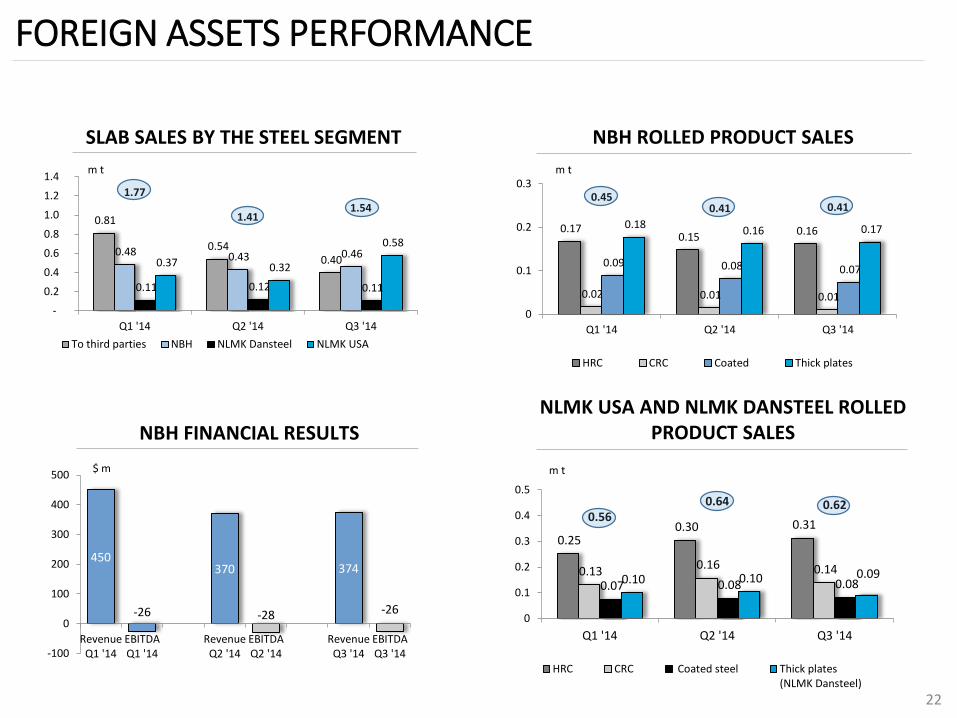
450
-26
370
-28
374
-26
-100
0
100
200
300
400
500
RevenueQ1 '14
EBITDAQ1 '14
RevenueQ2 '14
EBITDAQ2 '14
RevenueQ3 '14
EBITDAQ3 '14
FOREIGN ASSETS PERFORMANCE
22
NBH FINANCIAL RESULTS
$ m
NLMK USA AND NLMK DANSTEEL ROLLED PRODUCT SALES
0.25 0.30 0.31
0.13 0.16 0.14
0.07 0.08 0.08 0.10 0.10 0.09
0.560.64 0.62
0.00
0.10
0.20
0.30
0.40
0.50
0.60
0.70
0
0.1
0.2
0.3
0.4
0.5
Q1 '14 Q2 '14 Q3 '14
HRC CRC Coated steel Thick plates(NLMK Dansteel)
NBH ROLLED PRODUCT SALES
0.17 0.15
0.16
0.02 0.01 0.01
0.09 0.08 0.07
0.18 0.16 0.17
0.450.41 0.41
0.00
0.10
0.20
0.30
0.40
0.50
0
0.1
0.2
0.3
Q1 '14 Q2 '14 Q3 '14
HRC CRC Coated Thick plates
m t
SLAB SALES BY THE STEEL SEGMENT
0.81
0.54 0.40
0.48 0.43 0.46
0.11 0.12 0.11
0.37 0.32
0.58
1.77
1.411.54
0.00
0.50
1.00
1.50
2.00
-
0.2
0.4
0.6
0.8
1.0
1.2
1.4
Q1 '14 Q2 '14 Q3 '14
To third parties NBH NLMK Dansteel NLMK USA
m t
m t
SEGMENT RESULTS OVERVIEW
23
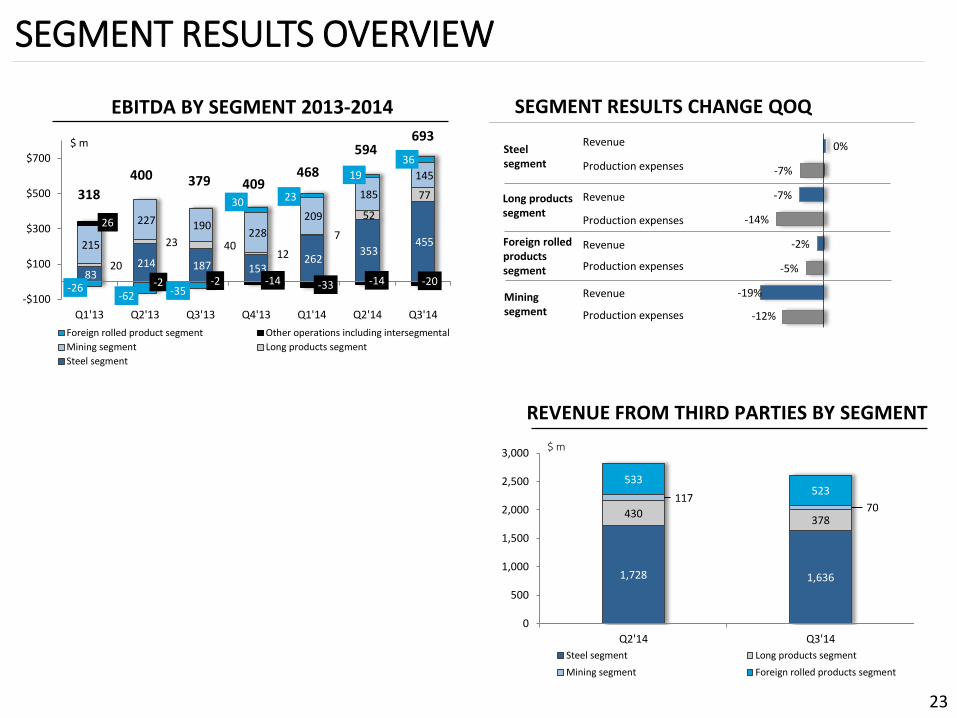
REVENUE FROM THIRD PARTIES BY SEGMENT
SEGMENT RESULTS CHANGE QOQ
$ m
1,728 1,636
430378
11770
533523
0
500
1,000
1,500
2,000
2,500
3,000
Q2'14 Q3'14
Steel segment Long products segment
Mining segment Foreign rolled products segment
-12%
-19%
-5%
-2%
-14%
-7%
-7%
0%Steel segment
Mining segment
Revenue
Production expenses
Revenue
Revenue
Revenue
Production expenses
Production expenses
Production expenses
Long productssegment
Foreign rolled products segment83
214 187 153 262
353 455
20
23 40 12
7
52
77
215
227 190 228
209
185
145
26
-2 -2 -14 -33 -14 -20-26
-62 -35
30 23
19
36
-$100
$100
$300
$500
$700
Q1'13 Q2'13 Q3'13 Q4'13 Q1'14 Q2'14 Q3'14
Foreign rolled product segment Other operations including intersegmental
Mining segment Long products segment
Steel segment
$ m
409379400
318
594
468
EBITDA BY SEGMENT 2013-2014
693
24
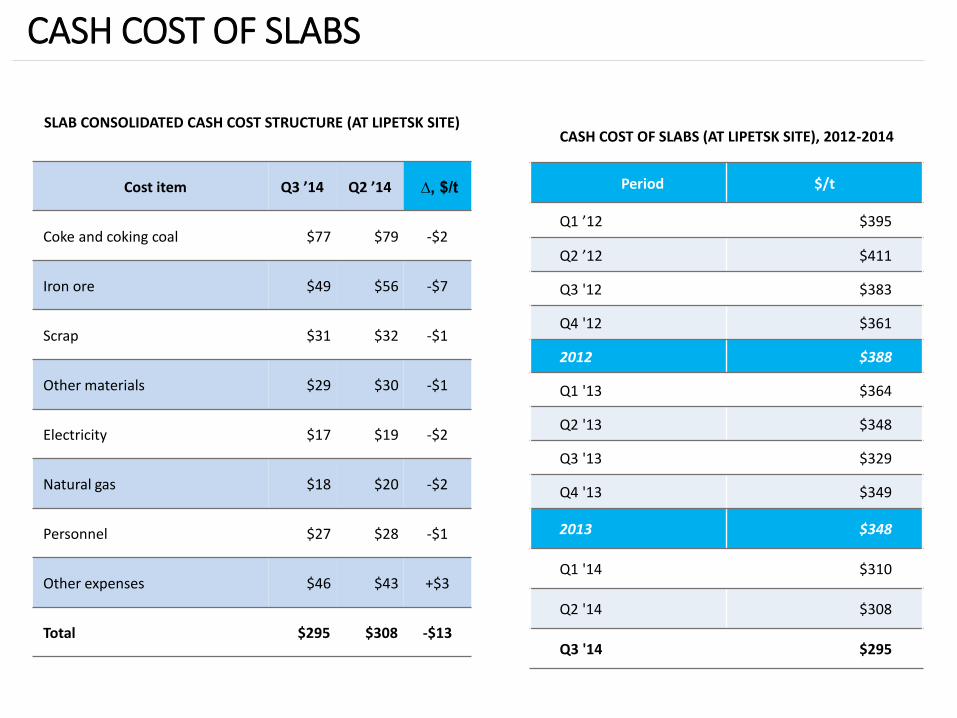
CASH COST OF SLABS
SLAB CONSOLIDATED CASH COST STRUCTURE (AT LIPETSK SITE)
Cost item Q3 ’14 Q2 ’14 ∆, $/t
Coke and coking coal $77 $79 -$2
Iron ore $49 $56 -$7
Scrap $31 $32 -$1
Other materials $29 $30 -$1
Electricity $17 $19 -$2
Natural gas $18 $20 -$2
Personnel $27 $28 -$1
Other expenses $46 $43 +$3
Total $295 $308 -$13
CASH COST OF SLABS (AT LIPETSK SITE), 2012-2014
Period $/t
Q1 ’12 $395
Q2 ’12 $411
Q3 '12 $383
Q4 '12 $361
2012 $388
Q1 '13 $364
Q2 '13 $348
Q3 '13 $329
Q4 '13 $349
2013 $348
Q1 '14 $310
Q2 '14 $308
Q3 '14 $295
251 as of 30.09.2014
2 as of 30.06.2014
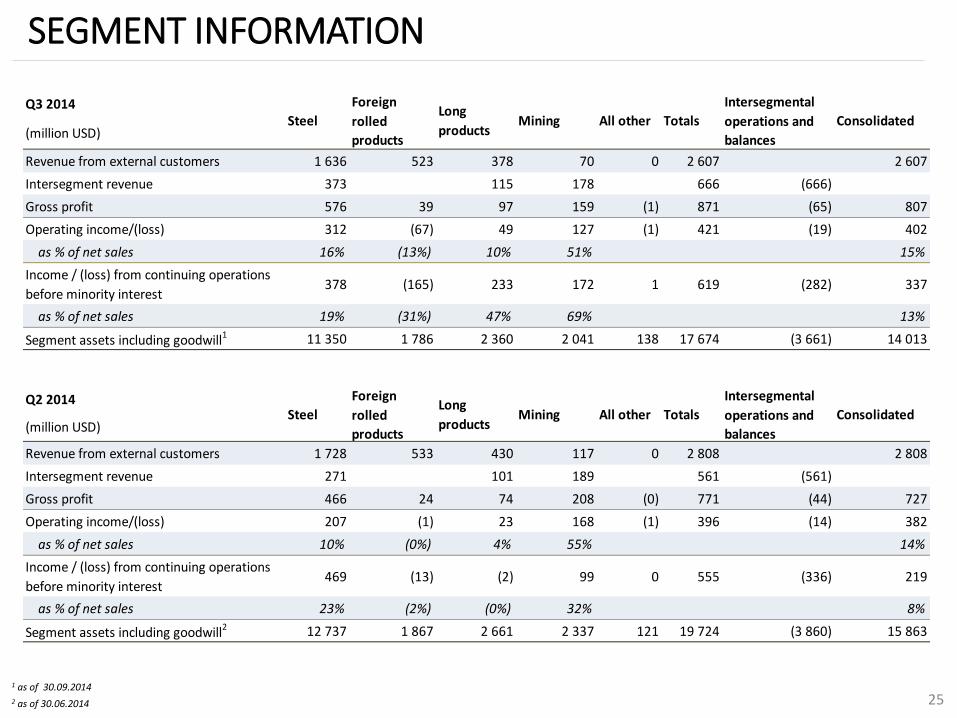
SEGMENT INFORMATION
Q3 2014
(million USD)
Revenue from external customers 1 636 523 378 70 0 2 607 2 607
Intersegment revenue 373 115 178 666 (666)
Gross profit 576 39 97 159 (1) 871 (65) 807
Operating income/(loss) 312 (67) 49 127 (1) 421 (19) 402
as % of net sales 16% (13%) 10% 51% 15%
Income / (loss) from continuing operations
before minority interest378 (165) 233 172 1 619 (282) 337
as % of net sales 19% (31%) 47% 69% 13%
Segment assets including goodwill1 11 350 1 786 2 360 2 041 138 17 674 (3 661) 14 013
Q2 2014
(million USD)
Revenue from external customers 1 728 533 430 117 0 2 808 2 808
Intersegment revenue 271 101 189 561 (561)
Gross profit 466 24 74 208 (0) 771 (44) 727
Operating income/(loss) 207 (1) 23 168 (1) 396 (14) 382
as % of net sales 10% (0%) 4% 55% 14%
Income / (loss) from continuing operations
before minority interest469 (13) (2) 99 0 555 (336) 219
as % of net sales 23% (2%) (0%) 32% 8%
Segment assets including goodwill2 12 737 1 867 2 661 2 337 121 19 724 (3 860) 15 863
Totals
Intersegmental
operations and
balances
Consolidated
Steel
Foreign
rolled
products
Long
productsMining All other Totals
Intersegmental
operations and
balances
Consolidated
Steel
Foreign
rolled
products
Long
productsMining All other
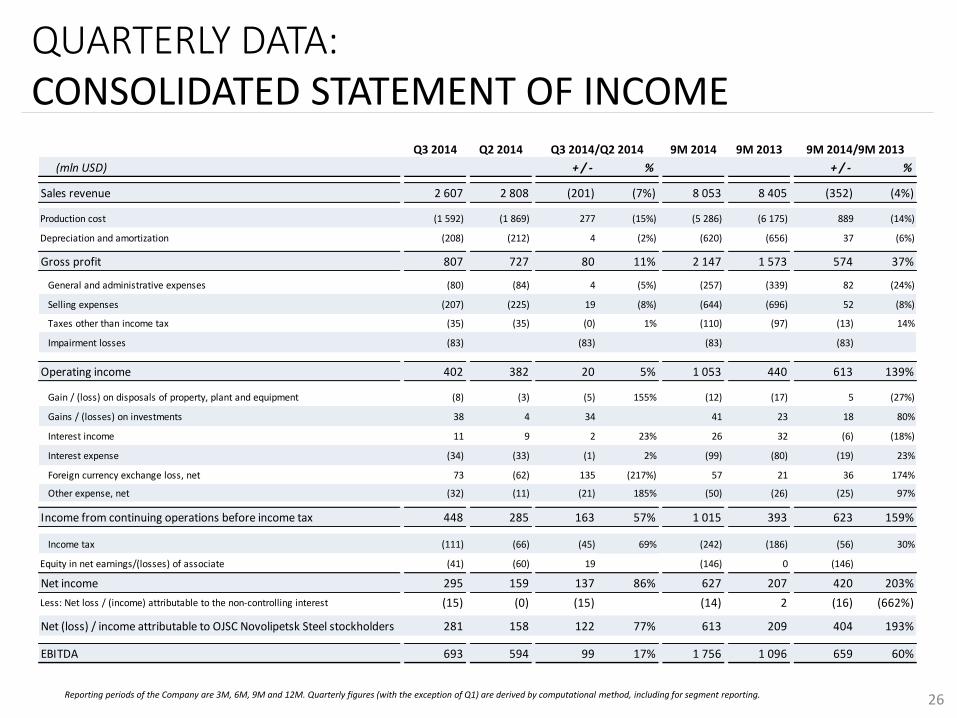
QUARTERLY DATA: CONSOLIDATED STATEMENT OF INCOME
26Reporting periods of the Company are 3M, 6M, 9M and 12M. Quarterly figures (with the exception of Q1) are derived by computational method, including for segment reporting.
Q3 2014 Q2 2014 9M 2014 9M 2013
(mln USD) + / - % + / - %
Sales revenue 2 607 2 808 (201) (7%) 8 053 8 405 (352) (4%)
Production cost (1 592) (1 869) 277 (15%) (5 286) (6 175) 889 (14%)
Depreciation and amortization (208) (212) 4 (2%) (620) (656) 37 (6%)
Gross profit 807 727 80 11% 2 147 1 573 574 37%
General and administrative expenses (80) (84) 4 (5%) (257) (339) 82 (24%)
Selling expenses (207) (225) 19 (8%) (644) (696) 52 (8%)
Taxes other than income tax (35) (35) (0) 1% (110) (97) (13) 14%
Impairment losses (83) (83) (83) (83)
Operating income 402 382 20 5% 1 053 440 613 139%
Gain / (loss) on disposals of property, plant and equipment (8) (3) (5) 155% (12) (17) 5 (27%)
Gains / (losses) on investments 38 4 34 41 23 18 80%
Interest income 11 9 2 23% 26 32 (6) (18%)
Interest expense (34) (33) (1) 2% (99) (80) (19) 23%
Foreign currency exchange loss, net 73 (62) 135 (217%) 57 21 36 174%
Other expense, net (32) (11) (21) 185% (50) (26) (25) 97%
Income from continuing operations before income tax 448 285 163 57% 1 015 393 623 159%
Income tax (111) (66) (45) 69% (242) (186) (56) 30%
Equity in net earnings/(losses) of associate (41) (60) 19 (146) 0 (146)
Net income 295 159 137 86% 627 207 420 203%
Less: Net loss / (income) attributable to the non-controlling interest (15) (0) (15) (14) 2 (16) (662%)
Net (loss) / income attributable to OJSC Novolipetsk Steel stockholders 281 158 122 77% 613 209 404 193%
EBITDA 693 594 99 17% 1 756 1 096 659 60%
Q3 2014/Q2 2014 9M 2014/9M 2013
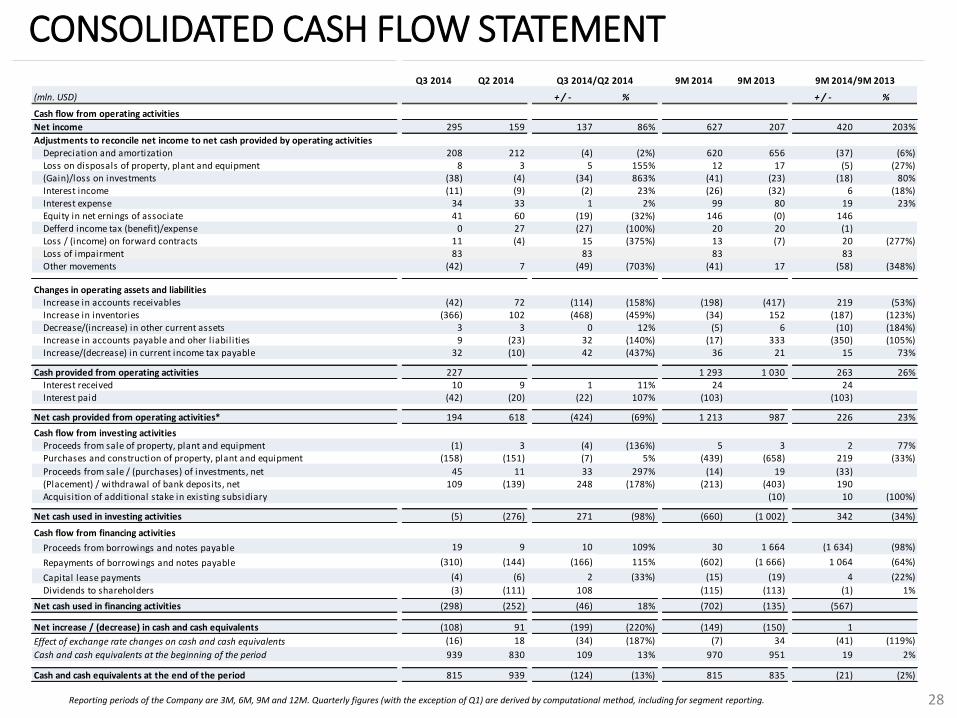
CONSOLIDATED CASH FLOW STATEMENT
Reporting periods of the Company are 3M, 6M, 9M and 12M. Quarterly figures (with the exception of Q1) are derived by computational method, including for segment reporting. 28
Q3 2014 Q2 2014 9M 2014 9M 2013
(mln. USD) + / - % + / - %
Cash flow from operating activities
Net income 295 159 137 86% 627 207 420 203%
Adjustments to reconcile net income to net cash provided by operating activitiesDepreciation and amortization 208 212 (4) (2%) 620 656 (37) (6%)Loss on disposals of property, plant and equipment 8 3 5 155% 12 17 (5) (27%)(Gain)/loss on investments (38) (4) (34) 863% (41) (23) (18) 80%Interest income (11) (9) (2) 23% (26) (32) 6 (18%)Interest expense 34 33 1 2% 99 80 19 23%Equity in net ernings of associate 41 60 (19) (32%) 146 (0) 146Defferd income tax (benefit)/expense 0 27 (27) (100%) 20 20 (1)Loss / (income) on forward contracts 11 (4) 15 (375%) 13 (7) 20 (277%)Loss of impairment 83 83 83 83Other movements (42) 7 (49) (703%) (41) 17 (58) (348%)
Changes in operating assets and liabilitiesIncrease in accounts receivables (42) 72 (114) (158%) (198) (417) 219 (53%)Increase in inventories (366) 102 (468) (459%) (34) 152 (187) (123%)Decrease/(increase) in other current assets 3 3 0 12% (5) 6 (10) (184%)Increase in accounts payable and oher l iabilities 9 (23) 32 (140%) (17) 333 (350) (105%)Increase/(decrease) in current income tax payable 32 (10) 42 (437%) 36 21 15 73%
Cash provided from operating activities 227 1 293 1 030 263 26%Interest received 10 9 1 11% 24 24Interest paid (42) (20) (22) 107% (103) (103)
Net cash provided from operating activities* 194 618 (424) (69%) 1 213 987 226 23%
Cash flow from investing activities Proceeds from sale of property, plant and equipment (1) 3 (4) (136%) 5 3 2 77%Purchases and construction of property, plant and equipment (158) (151) (7) 5% (439) (658) 219 (33%)
Proceeds from sale / (purchases) of investments, net 45 11 33 297% (14) 19 (33)(Placement) / withdrawal of bank deposits, net 109 (139) 248 (178%) (213) (403) 190Acquisition of additional stake in existing subsidiary (10) 10 (100%)
Net cash used in investing activities (5) (276) 271 (98%) (660) (1 002) 342 (34%)0
Cash flow from financing activities
Proceeds from borrowings and notes payable 19 9 10 109% 30 1 664 (1 634) (98%)
Repayments of borrowings and notes payable (310) (144) (166) 115% (602) (1 666) 1 064 (64%)
Capital lease payments (4) (6) 2 (33%) (15) (19) 4 (22%)
Dividends to shareholders (3) (111) 108 (115) (113) (1) 1%
Net cash used in financing activities (298) (252) (46) 18% (702) (135) (567)
Net increase / (decrease) in cash and cash equivalents (108) 91 (199) (220%) (149) (150) 1
Effect of exchange rate changes on cash and cash equivalents (16) 18 (34) (187%) (7) 34 (41) (119%)
Cash and cash equivalents at the beginning of the period 939 830 109 13% 970 951 19 2%
Cash and cash equivalents at the end of the period 815 939 (124) (13%) 815 835 (21) (2%)
Q3 2014/Q2 2014 9M 2014/9M 2013
28
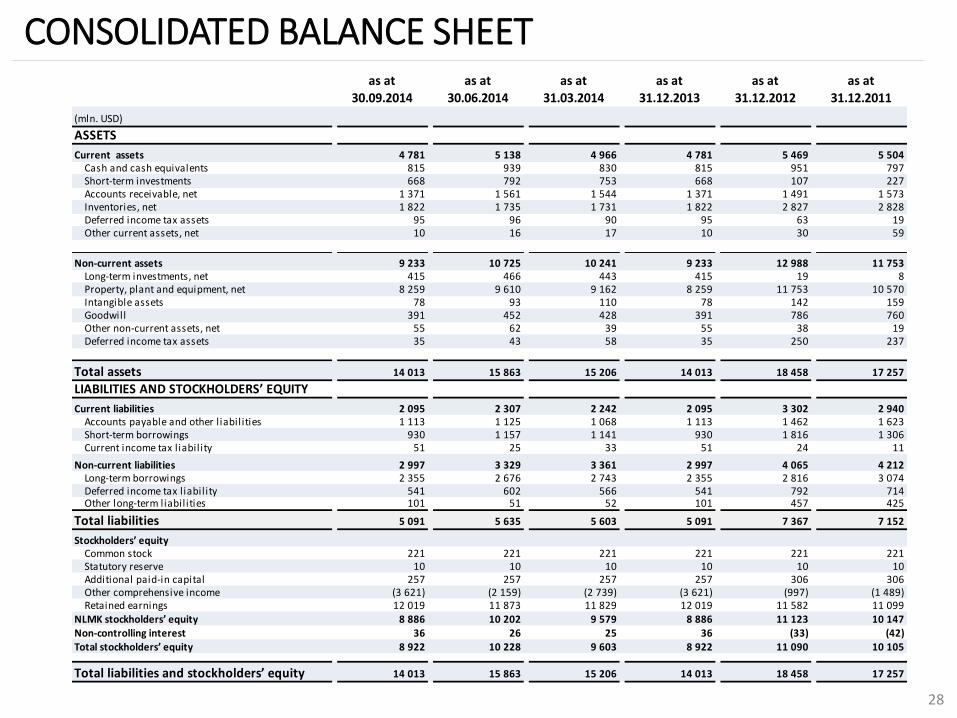
CONSOLIDATED BALANCE SHEETas at
30.09.2014as at
30.06.2014as at
31.03.2014as at
31.12.2013as at
31.12.2012as at
31.12.2011
(mln. USD)
ASSETS
Current assets 4 781 5 138 4 966 4 781 5 469 5 504Cash and cash equivalents 815 939 830 815 951 797Short-term investments 668 792 753 668 107 227Accounts receivable, net 1 371 1 561 1 544 1 371 1 491 1 573Inventories, net 1 822 1 735 1 731 1 822 2 827 2 828Deferred income tax assets 95 96 90 95 63 19Other current assets, net 10 16 17 10 30 59
Non-current assets 9 233 10 725 10 241 9 233 12 988 11 753Long-term investments, net 415 466 443 415 19 8Property, plant and equipment, net 8 259 9 610 9 162 8 259 11 753 10 570Intangible assets 78 93 110 78 142 159Goodwill 391 452 428 391 786 760Other non-current assets, net 55 62 39 55 38 19Deferred income tax assets 35 43 58 35 250 237
Total assets 14 013 15 863 15 206 14 013 18 458 17 257
LIABILITIES AND STOCKHOLDERS’ EQUITY
Current liabilities 2 095 2 307 2 242 2 095 3 302 2 940Accounts payable and other l iabilities 1 113 1 125 1 068 1 113 1 462 1 623Short-term borrowings 930 1 157 1 141 930 1 816 1 306Current income tax liability 51 25 33 51 24 11
Non-current liabilities 2 997 3 329 3 361 2 997 4 065 4 212Long-term borrowings 2 355 2 676 2 743 2 355 2 816 3 074Deferred income tax liability 541 602 566 541 792 714Other long-term liabilities 101 51 52 101 457 425
Total liabilities 5 091 5 635 5 603 5 091 7 367 7 152
Stockholders’ equityCommon stock 221 221 221 221 221 221Statutory reserve 10 10 10 10 10 10Additional paid-in capital 257 257 257 257 306 306Other comprehensive income (3 621) (2 159) (2 739) (3 621) (997) (1 489)Retained earnings 12 019 11 873 11 829 12 019 11 582 11 099
NLMK stockholders’ equity 8 886 10 202 9 579 8 886 11 123 10 147Non-controlling interest 36 26 25 36 (33) (42)Total stockholders’ equity 8 922 10 228 9 603 8 922 11 090 10 105
Total liabilities and stockholders’ equity 14 013 15 863 15 206 14 013 18 458 17 257
www.nlmk.com
NLMK
Investor Relations
Russia, 115054, Moscow
18, Bakhrushina str, bldg 1
t. +7 495 915 15 75
f. +7 495 915 79 04