Embed Size (px)
Citation preview

Press conference
26 February 2015
Annual figures 2014

Annual figures 2014Wiebe Draijer, Chairman of the Executive Board

Annual figures 2014 – analysisBert Bruggink, CFRO

Balance sheet
In billions of euros 31-Dec-14 31-Dec-13 31-Dec-14 31-Dec-13
Cash and cash Due to
equivalents 43 43 customers 326 326
Loans to customers 462 456 Debt securities in issue 189 195
Financial assets 48 57 Due to other banks 18 15
Due from other Derivative financial instruments
banks 45 41 and other trade liabilities 68 50
Derivative financial instruments 56 40 Other liabilities 41 44
Other assets 27 32 Equity 39 39
Total assets 681 669 Total liabilities 681 669

Lending
420
425
430
435
440
31-Dec-13 Private individuals TIS Food and agri 31-Dec-14
Private sector loan portfolio in billions of euros
Loan portfolio EUR 430 billion; -1%• Declines at local Rabobanks, Obvion and FGH Bank• Increases at Wholesale, Rural & Retail and DLL, partly due to currency effects
-3% -3% +6%

Funding (1)Amounts due to customers and liquidity ratios
300305310315320325330
31-Dec-13 Savings Other 31-Dec-14
Amounts due to customers, in billions of euros
-6% +5%
Amounts due to customers EUR 326 billion; 0%• Customer savings deposits EUR 143 billion; -6%• Loan-to-deposit ratio of 1.33 (1.35)• Liquidity coverage ratio; LCR 144% (126%)• Net stable funding ratio; NSFR 115% (114%)

Funding (2)Liquidity buffer at a comfortable level
In billions of euros 31-Dec-14 31-Dec-13 ChangeDomestic retail banking 209 216 -7Wholesale and international retail banking 116 109 +7Other entities 1 2 -1
Amounts due to customers 326 326 0
Wholesale funding 216 219 -3
Liquidity buffer (HQLA) 80 84 -4

Equity
In billions of eurosEquity as at 31-Dec-13 38.5
Net profit +1.8Payments on certificates, hybrid capital and other non-controlling interests -1.2
Reserve capacity +0.6Issued Rabobank Certificates +0.1Repayment of Capital Securities and Trust Preferred Securities -1.3Foreign currency translation reserves +0.5Other changes +0.5Equity as at 31-Dec-14 38.9

CapitalStrategy
10.7% 10.0% 10.8% 12.2%
2.8% 2.8% 2.8% 2.8%3.1% 2.5% 2.4%3.5%3.2% 3.5%
5.3%3.5%4.0%
0%
4%
8%
12%
16%
20%
24%
28%
31-dec-13 1-Jan-14(CRD IV)
31-Dec-14(CRD IV)
Target 2016 TLAC
In percent of RWA
CET1 excluding certificates Rabobank CertificatesAdditional tier 1 Tier 2Subordinated debt
• Target capital ratio >20%; 2014: 21.3%
• Target CET1 ratio 14%; 2014: 13.6%

Development of capital ratiosImprovement of ratios in 2014
0
4
8
12
16
20
24
2005 2006 2007 2008 2009 2010 2011 2012 2013 1-Jan-14(CRD IV)
31-Dec-14(CRD IV)
Capital ratios in percent
Common equity tier 1 ratio Tier 1 ratio Capital ratio

Financial resultsRabobank Group
In millions of euros 31-Dec-14 31-Dec-13 ChangeInterest 9,118 9,095Commission 1,879 2,001 -6%Other results 1,860 1,934 -4%Total income 12,857 13,030 -1%Operating expenses 8,055 9,760 -17%Bad debt costs 2,633 2,643Bank tax expense and resolution levy 488 197Operating profit before taxation 1,681 430Taxation -161 88Net profit from continued operations 1,842 342Net profit from discontinued operations - 1,665Net profit 1,842 2,007 -8%
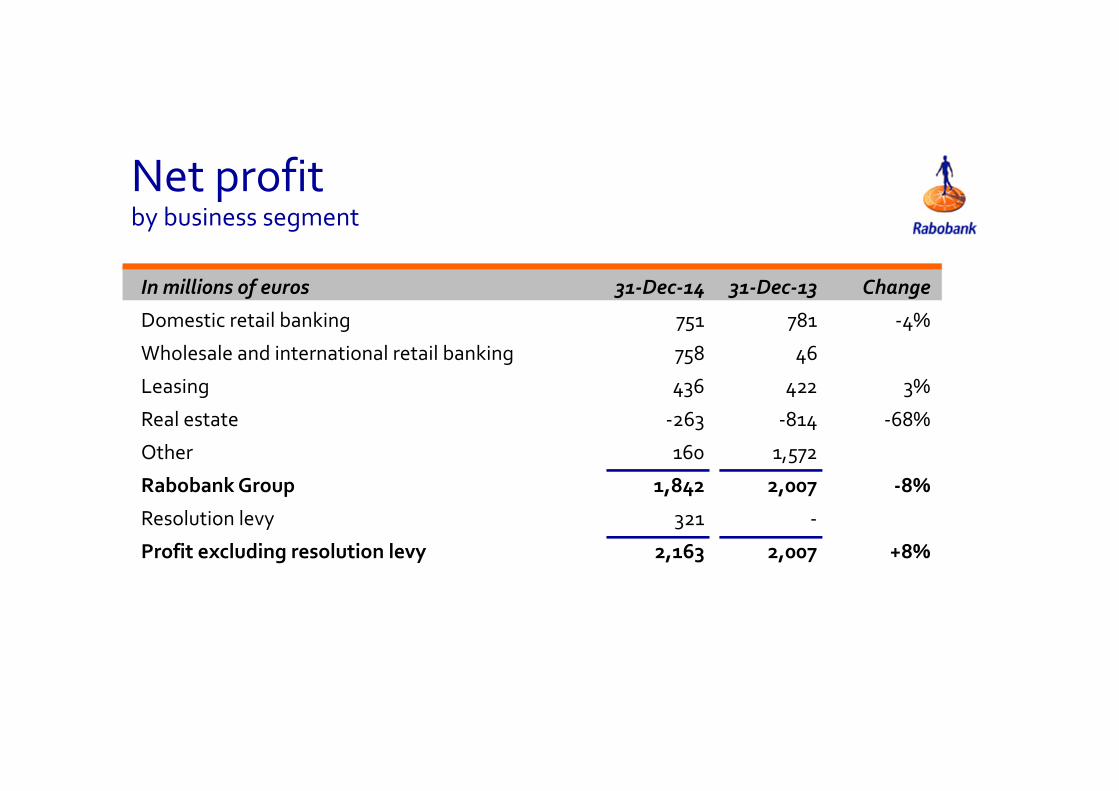
Net profit by business segment
In millions of euros 31-Dec-14 31-Dec-13 Change
Domestic retail banking 751 781 -4%
Wholesale and international retail banking 758 46
Leasing 436 422 3%
Real estate -263 -814 -68%
Other 160 1,572
Rabobank Group 1,842 2,007 -8%
Resolution levy 321 -
Profit excluding resolution levy 2,163 2,007 +8%

Operating expensesSharp fall in operating expenses (-17%)
0100020003000400050006000700080009000
10000
2005 2006 2007 2008 2009 2010 2011 2012 2013 2014
In millions of euros
• Efficiency ratio up 12.2 percentage points to 62.7%• Operating expenses at domestic retail banking down EUR 353 million on 2013• Settlement for the Libor affair recognised in the operating expenses of wholesale and
international retail in 2013
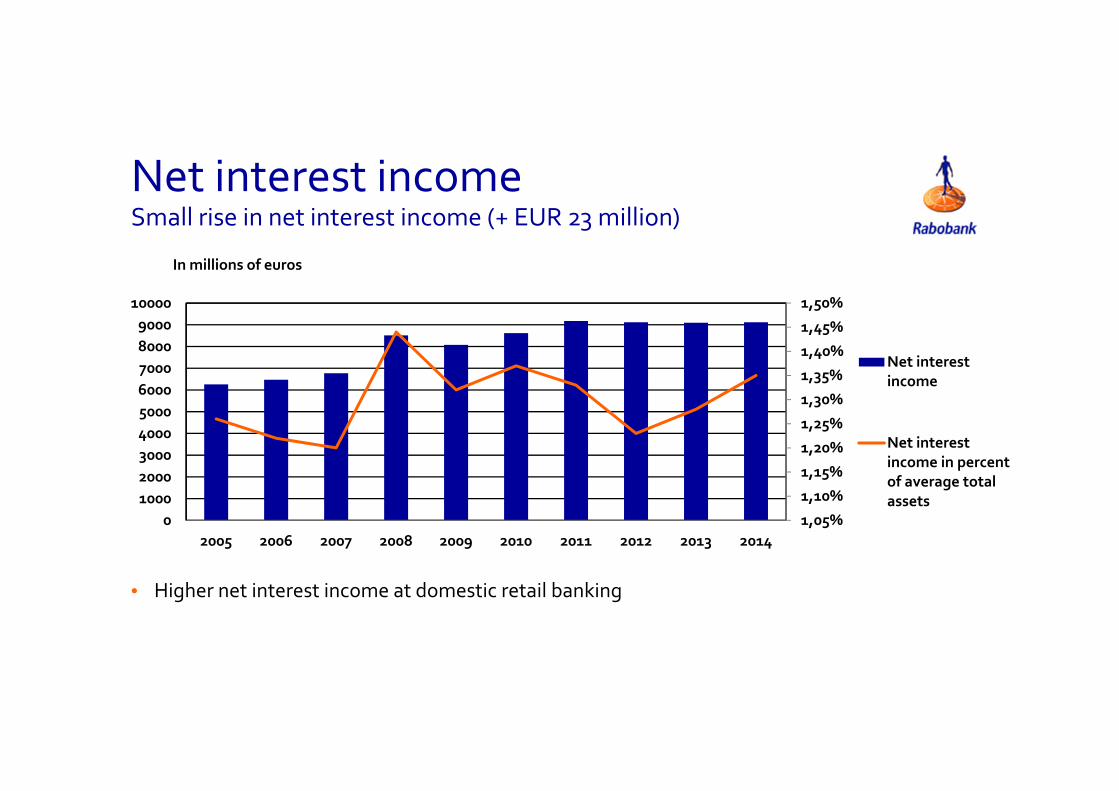
Net interest incomeSmall rise in net interest income (+ EUR 23 million)
1,05%
1,10%
1,15%
1,20%
1,25%
1,30%
1,35%
1,40%
1,45%
1,50%
0100020003000400050006000700080009000
10000
2005 2006 2007 2008 2009 2010 2011 2012 2013 2014
In millions of euros
Net interestincome
Net interestincome in percentof average totalassets
• Higher net interest income at domestic retail banking
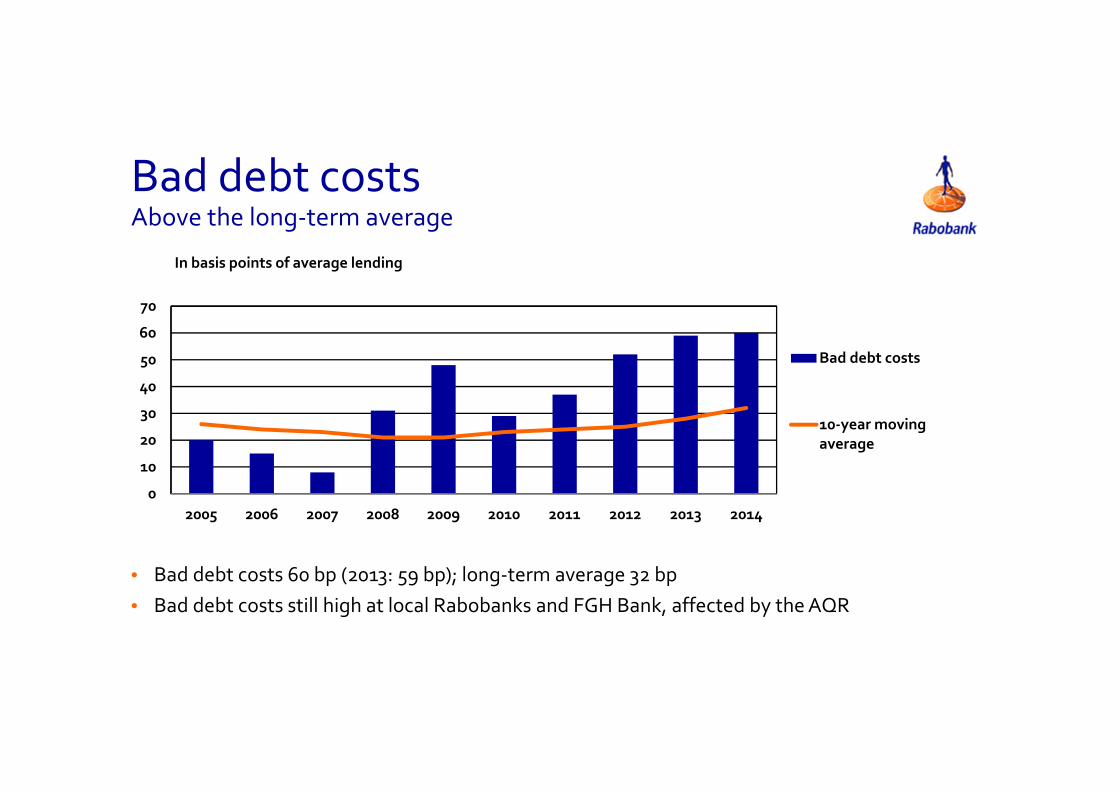
Bad debt costsAbove the long-term average
0
10
20
30
40
50
60
70
2005 2006 2007 2008 2009 2010 2011 2012 2013 2014
In basis points of average lending
Bad debt costs
10-year movingaverage
• Bad debt costs 60 bp (2013: 59 bp); long-term average 32 bp• Bad debt costs still high at local Rabobanks and FGH Bank, affected by the AQR

Residential mortgages in the Netherlands48% of lending; 5% of bad debt costs
31-Dec-14
31-Dec-13
Residential mortgages in billions of euros
31-Dec-14
31-Dec-13
Bad debt costs in millions of euros
Residential mortgages EUR 205.0 (209.1) billion• Contraction due to additional repayments• 21% (20%) portfolio financed with NHG
mortgage guarantee scheme• Loan-to-value 78% (81)%
• Bad debt costs residential mortgages EUR 112 million; -12%
• Bad debt costs at 5 (6) basis points
209.1
127
112
205.0

Commercial real estate in the NetherlandsWrite-downs versus bad debt costs
0
100
200
300
400
500
600
700
800
900
2010 2011 2012 2013 2014
In millions of euros
Bad debt costs Write-downs

Domestic retail bankingNet profit EUR 751 million; -4%
31-Dec-14
31-Dec-13
Net profit in millions of euros
31-Dec-14
31-Dec-13
In billions of euros
Amounts due to customers Loan portfolio
• Result of domestic retail banking impacted by EUR 274 million resolution levy
781
215.7303.1
209.1290.5
751
• Loan portfolio EUR 290.5 billion; -4%• Amounts due to customers EUR 209.1 billion;
-3%
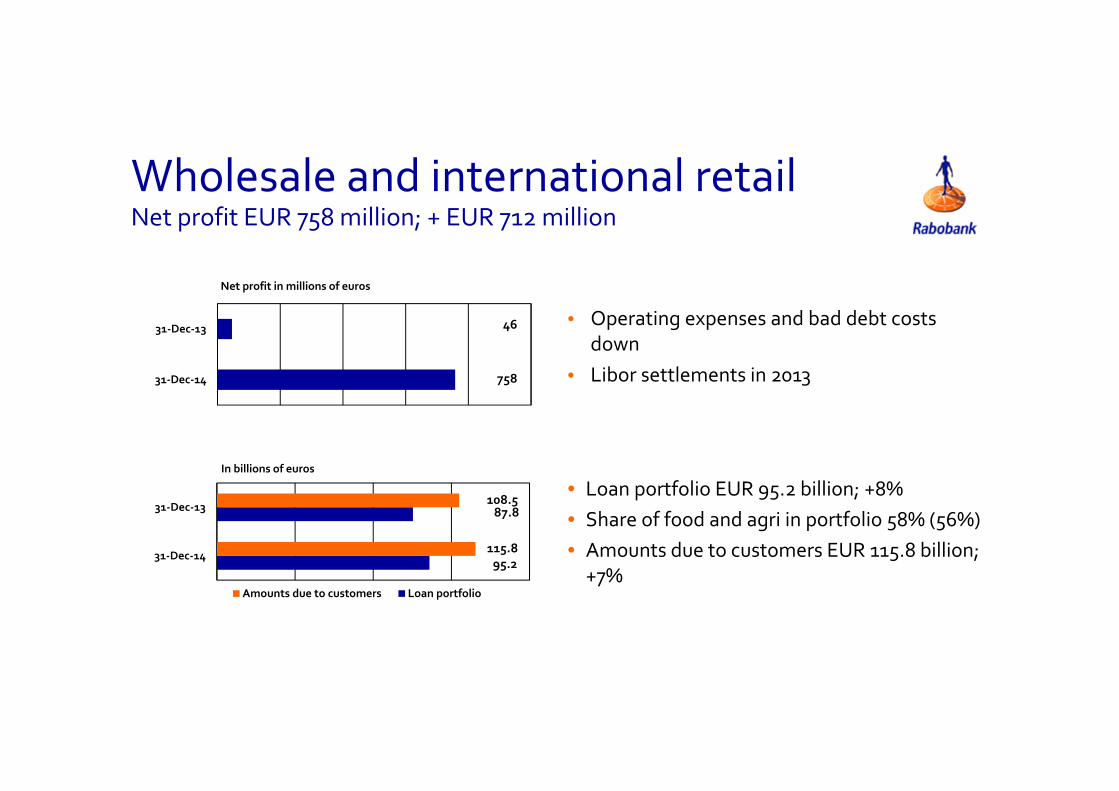
Wholesale and international retail Net profit EUR 758 million; + EUR 712 million
31-Dec-14
31-Dec-13
Net profit in millions of euros
31-Dec-14
31-Dec-13
In billions of euros
Amounts due to customers Loan portfolio
• Operating expenses and bad debt costs down
• Libor settlements in 2013
46
758
108.587.8
115.895.2
• Loan portfolio EUR 95.2 billion; +8%• Share of food and agri in portfolio 58% (56%)• Amounts due to customers EUR 115.8 billion;
+7%

LeasingNet profit EUR 436 million; +3%
31-Dec-14
31-Dec-13
Net profit in millions of euros
31-Dec-14
31-Dec-13
Lease portfolio in billions of euros
• Interest profit up• Bad debt costs down
422
436
30.2
33.0
• Lease portfolio EUR 33.0 billion; +9%• Share of food and agri in portfolio 32% (30%)

Real EstateNet loss of EUR 263 million
31-Dec-14
31-Dec-13
Net loss in millions of euros• No heavy impairments on land positions and
operations, unlike 2013 • Bad debt costs still high in 2014
-814
-263
7341
17200
8982
1780031-Dec-14
31-Dec-13
Loan portfolio in billions of euros
• Number of homes sold 7,064; +37%• Loan portfolio EUR 16.7 billion; -9%• Assets under management EUR 6.4 billion;
+8%
18.4
16.7

22
Thank you for your attention

Annual figures 2014Annual figures 2014