Embed Size (px)
Citation preview
Raymond James Institutional Investor Conference
Scott W. Wine, Chairman & CEOMarch 8, 2016
POLARIS INDUSTRIES INC.
Strategic Objectives
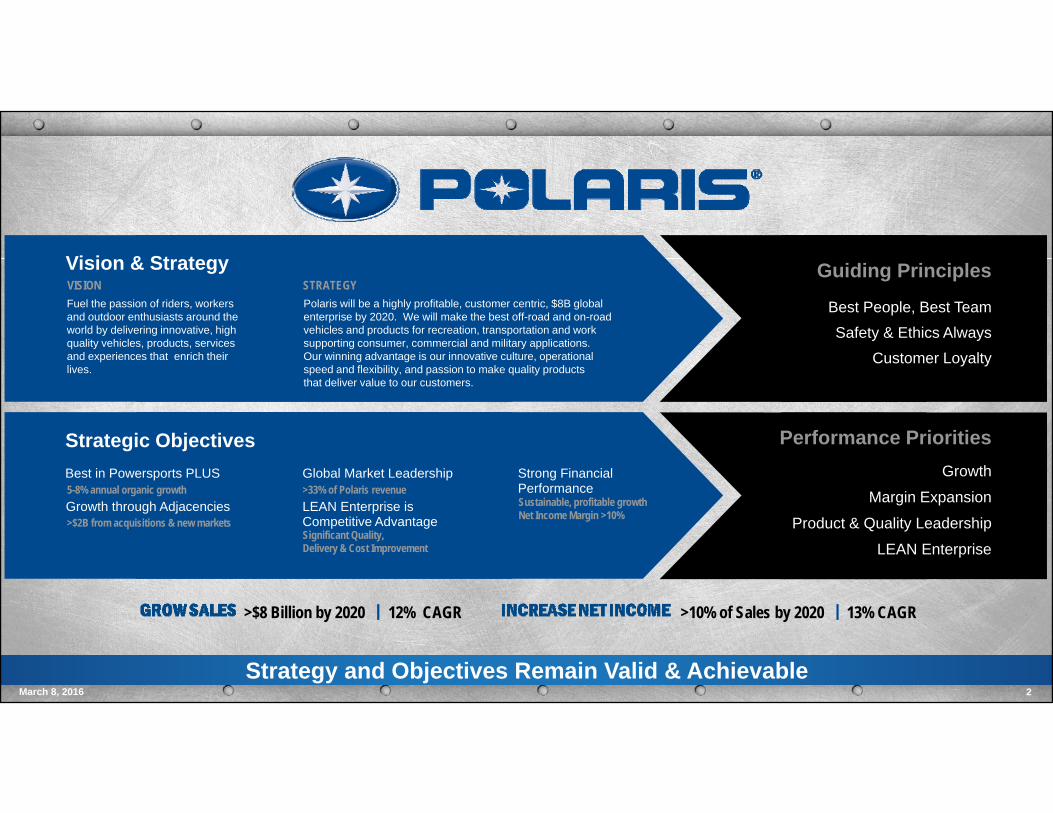
Vision & StrategyVISIONFuel the passion of riders, workers and outdoor enthusiasts around the world by delivering innovative, high quality vehicles, products, services and experiences that enrich their lives.
STRATEGYPolaris will be a highly profitable, customer centric, $8B global enterprise by 2020. We will make the best off-road and on-road vehicles and products for recreation, transportation and work supporting consumer, commercial and military applications. Our winning advantage is our innovative culture, operational speed and flexibility, and passion to make quality productsthat deliver value to our customers.
Best in Powersports PLUS
Growth through Adjacencies5-8% annual organic growth
>$2B from acquisitions & new markets
Global Market Leadership
LEAN Enterprise is Competitive Advantage
>33% of Polaris revenue
Significant Quality, Delivery & Cost Improvement
Strong Financial PerformanceSustainable, profitable growthNet Income Margin >10%
Guiding Principles
Best People, Best Team Safety & Ethics Always
Customer Loyalty
Performance PrioritiesGrowth
Margin Expansion
Product & Quality Leadership
LEAN Enterprise
>$8 Billion by 2020 12% CAGR >10% of Sales by 2020 13% CAGR
March 8, 2016 2Strategy and Objectives Remain Valid & Achievable

CORPORATE OVERVIEW – 20152015 Sales by Reporting Segments*1954 Year Polaris was Founded
~8,100 Employees Worldwide16 Manufacturing Locations
5 Research & Development Centers ~1,800 Dealers In North America~1,700 Dealers Outside North America
>390,000 Units Shipped Worldwide>100 Countries – Polaris Products Sold
Building a Highly Profitable Global EnterpriseMarch 8, 2016 3
78%15%
7%78%
14%
8%
Int’l
Canada
United States
Global AdjacentMarkets
Motorcycles
Off-RoadVehicles/
Snow
*PG&A included in respective segments
BILLION UP
2015 Sales by Geography

KEY FINANCIAL METRICS
33%$2,657
21%$3,210
18%$3,777
19%$4,480
5%$4,719 2% to 3%
$228
$312
$381
$454 $455
2011 2012 2013 2014 2015 2016Guidance
Sales Guidance Net Income
39% 40% 39% 38%
32%
12%
20%
26%
16%13%
9% 9% 9% 9% 8%
2011 2012 2013 2014 2015
Polaris Peer Average* S&P 500 Average
Return on Invested CapitalSales, Net Income* and EPS
March 8, 2016 4
History of Industry-Leading Returns* From Continuing Operations
5-Year CAGRSales 19%Net Income 25%
*ACAT, BC, DE, DOO, HOG, WGO, TTC
Constant CurrencyFlat to 5%
EPS* $6.75
2%$6.20 TO $6.80
8% TO 1%$3.20
50%$4.40
38%$5.40
23%$6.65
23%
Constant CurrencyFlat to 9%

2015 Key Challenges / 2016 Game Plan
InternalExpensive paint issues delayed Motorcycles
Poor inventory management
Inconsistent quality; recalls
Optimistic forecasting
ExternalStrengthening dollar
Oil & gas weakness
More / better competitive products
Weak snow / mild winter
All-Out Assault on Costs – Lean EnterpriseORV Execution (Matt Homan, Craig Scanlon)
VIP opportunities / factory inventory (Ken Pucel)
Enterprise cost down – indirect (Dave Longren)
Motorcycle Profitability (Steve Menneto)
Make Growth Happen – How We WinBold Innovation
RFM / SMART (PG&A)
Customer excellence / dealer profitability
M&A acceleration
2016 Game Plan2015 – What Happened?
March 8, 2016 5
Unwavering Resolve to Improve Performance

#1 in Powersports Extended Lead in 2015; Fastest Growing
N.A. POWERSPORTS MARKET SHARE
6March 8, 2016
2008 2009 2010 2011 2012 2013 2014 2015 2016
Consolidated Market Share in Units(Using Total Motorcycle Industry)
HondaHarley
Yamaha
Can AmKawasaki
Other
Polaris 2015MARKET SHARE POSITION
#1 ATVs
#1 Side-by-Sides
#2 Motorcycles
#2 Snowmobiles
Expectations

Global Adjacent MarketsMotorcycles
7March 8, 2016
ORV / Snowmobiles
2015(Reclassified)
2016Guidance
2015(Reclassified)
2016Guidance
2015(Reclassified)
2016Guidance
Remain Optimistic for Modest Sales Growth & Market Share Gains
2016 Sales Guidance by Reporting Segments
+67%$698.3
UpHigh-teens %
IndianVictory
Slingshot
IndianVictory
Slingshot
PG&A
PG&A
PG&A PG&A
Work & Transportation
Defense
Work & Transportation
Defense
Up mid-single digits %
Flat to down mid-single
digits %
ORV ORV
PG&A PG&A
Snowmobiles Snowmobiles
-1%$3,708.9
-3%$312.1
($ millions)

2008 2009 2010 2011 2012 2013 2014 2015
OFF-ROAD VEHICLES (ORV)
8March 8, 2016
Polaris N.A. ORV Market ShareWorldwide ORV Industry
2016 ObjectivesPolaris ORV Brand Reaching New Targets
Maintain #1 Market Share Position in More Competitive Environment
Leverage #1 Industry Position – scale
Eliminate waste, reduce costs – RFM
On-going innovation for global expansion
Expand market to new customers
New leadership: Matt Homan & Craig Scanlon
Twice the Nearest Competitor!
2015 TOTAL ORV INDUSTRY 2% (~851,000 Units)
4%2015 SXSINDUSTRY
2%2015 ATVINDUSTRY
2011 2012 2013 2014 2015 2016
Brand Message Retail Message
New media plan in 2016
Expectations

9March 8, 2016
MountainPerformance
Crossover
Utility
Other
SNOWMOBILES
10March 8, 2016
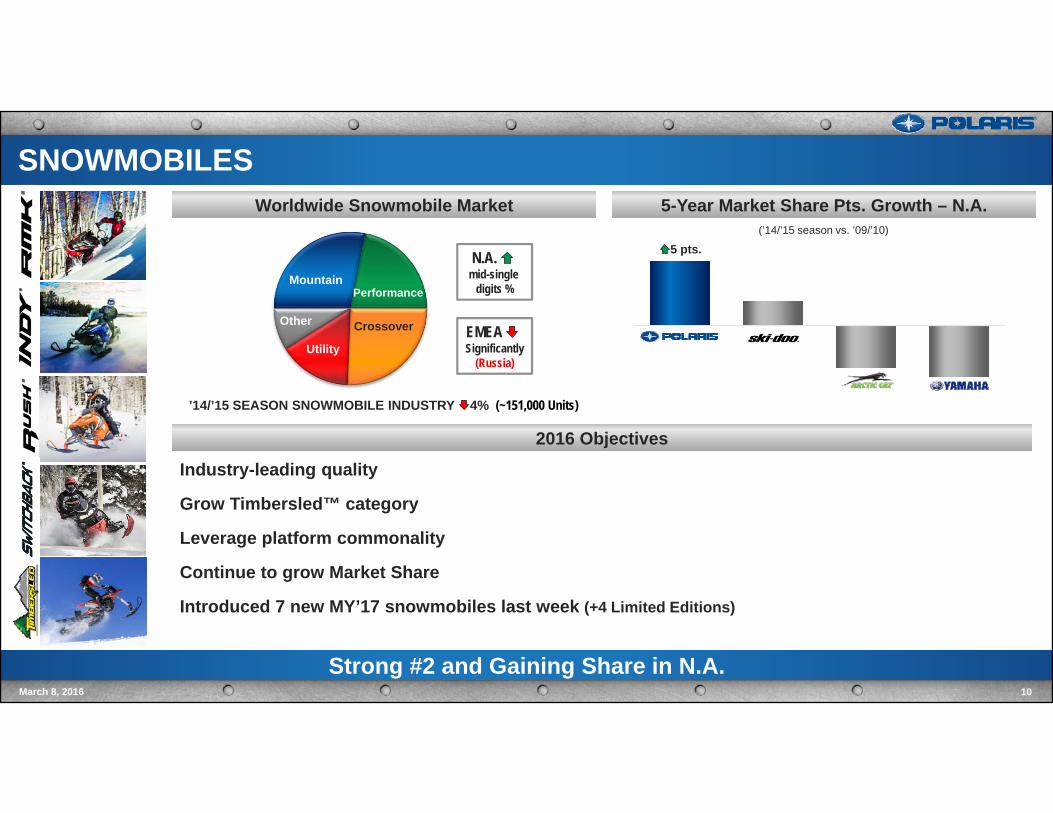
5-Year Market Share Pts. Growth – N.A.Worldwide Snowmobile Market
2016 Objectives
Strong #2 and Gaining Share in N.A.
(’14/’15 season vs. ’09/’10)
EMEA Significantly
(Russia)
N.A. mid-single
digits %
’14/’15 SEASON SNOWMOBILE INDUSTRY 4% (~151,000 Units)
5 pts.
Industry-leading quality
Grow Timbersled™ category
Leverage platform commonality
Continue to grow Market Share
Introduced 7 new MY’17 snowmobiles last week (+4 Limited Editions)

Cruisers
Touring
3-Wheel
MOTORCYCLES
11March 8, 2016
Polaris Motorcycle Market shareWorldwide Motorcycle Market
2016 ObjectivesTotal Motorcycle Market Share 2013 - 2015
Building a Global Motorcycle Business
Indian “Legendary” / Victory “Modern American Muscle”Expand dealer network Accelerate accessories growth
SlingshotBroaden consumer baseBuild upon first mover advantageGrow globallyEnhance dealer engagement
Acquired2011
Est. 2014
4PTSIN 2015
2015 MOTORCYCLE INDUSTRY ~ FLAT (~344,000 Units)(Cruiser / Touring / 3-Wheel: N.A. 900cc+ / EMEA 750cc+)
1998 2002 2006 2010 2011 2012 2013 2014 2015
2013 2014 2015 2013 2014 2015 2013 2014 2015
1.8PTS2013 to 2015
Indian MotorcycleHarley-Davidson Japanese Top 4
3.6PTS2013 to 2015
0.5PTS2013 to 2015

Motorcycle Product News
Leverage Derivatives to Grow Share & Enter New Markets – More to Come . . .12
MY’16 Springfield MSRP $21,499
March 2016
MY’17 OctaneMSRP $10,499
March 2016
MY’16 Magnum X1MSRP $23,499February 2016
MY’16 Empulse TT MSRP $19,999
December 2015
MY’16 Scout 60 MSRP $8,999
November 2016
March 8, 2016

13March 8, 2016

People Movers
Light Duty Haulers
Industrial
EQC
Golf
Wor
k &
Tra
nspo
rtat
ion
Mili
tary
GLOBAL ADJACENT MARKETS
14
Global Adjacent Market Vehicle SalesWork & Transportation Market
2016 ObjectivesMilitary ORV Market
Building Businesses for Future Growth / Profitability
Aixam grows #1 market share . . . AgainExpand commercial sales / improved executionLeverage installed baseAdd scale / capability through M&AObtain program of record (Military)MRZR & DAGOR customer expansion proceeding
$600+ Million Market
DAGOR™Sportsman
MV 850®
MRZR™ 4
$4+ Billion Market
$81 $110
$221 $270 $260
2011 2012 2013 2014 2015
($ millions)
Excludes PG&A
MARKET LEADERAixam
Quadricycles
Very-light Ultra-light
COTS(Commercial off the shelf)
March 8, 2016

Burden Carriers
Tow Tractors
Stock Chasers
Personal Carriers
Utility Vehicles
ACQUISITION: TAYLOR DUNN (3/7/16)
15March 8, 2016
Taylor Dunn Product LineTaylor Dunn OverviewLeader in light-industrial and commercial vehicles
2015 sales: ~1% of total Polaris (80% N.A.)~80 models, ~95% electric
~240 dealers worldwide
150+ Employees; HQ and manufacturing in Anaheim, CA
Customers: Industrial, warehouse, schools/universities
Business expected to be neutral to 2016 earnings
Established dealer network
Large installed base
Industrial market presence
Strong brand recognition
Strategic Fit with Work & Transportation (W&T)
Expands Products and Channel Access to Polaris W&T Business
MSRP – $5,500 to $48,500

PARTS, GARMENTS & ACCESSORIES (PG&A)PG&A Sales – All BusinessesCore Polaris PG&A
Accelerate Core Growth / Broaden Aftermarket Offerings
2016 ObjectivesAftermarket PG&A
Grow Core PG&A globally
Build aftermarket brands
Expand digital shopping experience
Refine retail transformation model (SMART)
$408 $461$611
$742 $781
2011 2012 2013 2014 2015
Motorcycles
Adjacent Markets
ORV/Snowmobiles
($ millions)
FY 2015
ORV / Snowmobiles
March 8, 2016 16

INTERNATIONAL
17March 8, 2016
Overcome Currency Challenges, Grow Share, Leverage Opole
$424 $461$593
$685 $652
2011 2012 2013 2014 2015
5%(cc +10%)
($ millions)
2016 Objectives
Drive motorcycle growth – midsize offerings catalysts
Effectively leverage Poland operations
Continue to build emerging market foundation
Improve execution
~1700 dealers
International Sales
Excludes PG&A
Opole, Poland Manufacturing Plant
Go-Kart/ORV Business in ChinaPolaris/Eicher JV - Multix
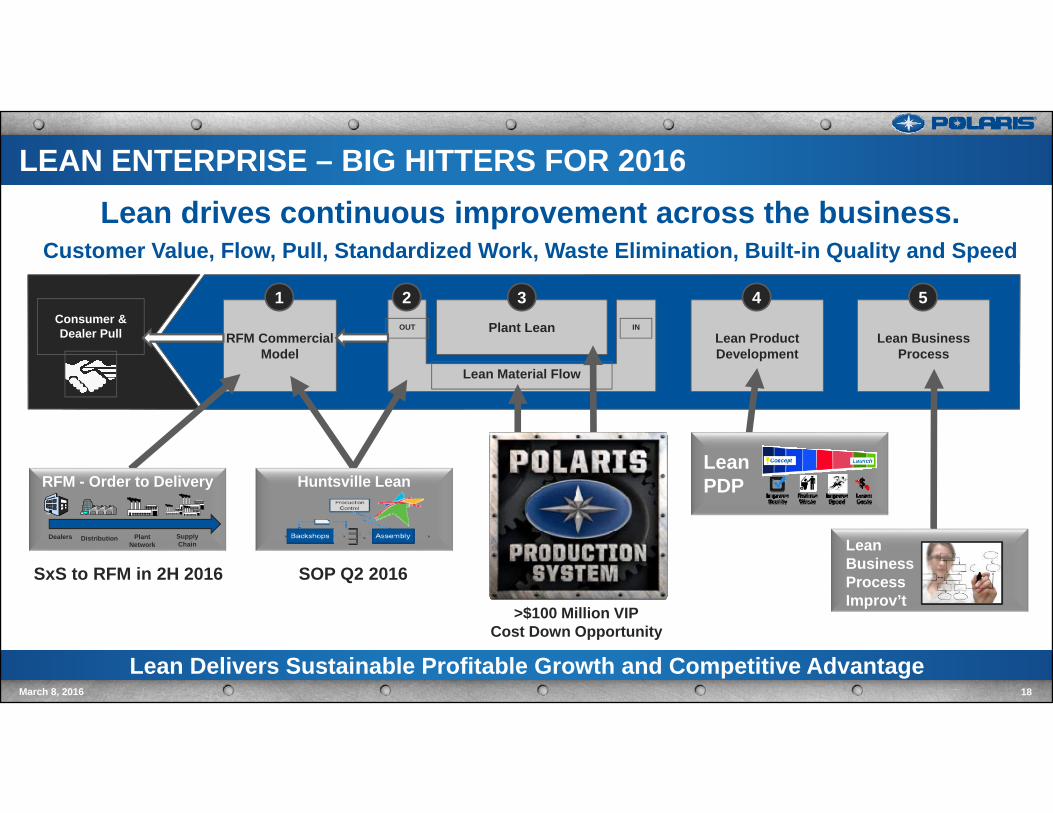
LEAN ENTERPRISE – BIG HITTERS FOR 2016
Lean Delivers Sustainable Profitable Growth and Competitive Advantage
RFM Commercial Model
Lean Product Development
Lean Business Process
Plant Lean
Lean Material Flow
OUT INConsumer & Dealer Pull
1 2 3 4 5
Lean drives continuous improvement across the business.Customer Value, Flow, Pull, Standardized Work, Waste Elimination, Built-in Quality and Speed
SxS to RFM in 2H 2016 SOP Q2 2016
>$100 Million VIPCost Down Opportunity
Lean Business ProcessImprov’t
Lean PDPRFM - Order to Delivery
Distribution Plant Network
Supply Chain
Dealers
Huntsville Lean
March 8, 2016 18

Dividends & Share RepurchaseCapEx vs. Depreciation & Amortization
FINANCIAL STRENGTH & FLEXIBILITYOperating Cash Flow & Net Income Margins
Strong Balance Sheet & Cash Flow Generation – Long History of Shareholder Value CreationMarch 8, 2016 19
Capital Deployment
1. Capital Expenditures – invest back into business
2. Consistent dividend policy (21 consecutive increases)
3. Viable M&A (>$350M invested 2011-2015)
4. Disciplined share repurchase (currently more aggressive)
$499 $529 $440
10.1% 10.1% 9.6%
2013 2014 2015 2016
Op Cash Flow NI Margin
$251$205
$250
$92 $128
$152
2013 2014 2015 2016
CapEx Deprec/Amort
$194
$230
$649
2013 2014 2015 2016
Dividends Repurchases
Expectations
Cash Flow Up
Significantly
Expectations
Slightly Higher than 2015 Dividend 4%
More AggressiveShare Buyback
Expectations
($ millions) ($ millions) ($ millions)


21
SAFE HARBOR
March 8, 2016
Except for historical information contained herein, the matters set forth in this document, including but not limited to management’s expectations regarding 2016 sales, shipments, margins, currencies, net income and cash flow, the opportunities for expansion anddiversification of the Company’s business and the Company’s guidance on earnings per share are forward-looking statements that involve certain risks and uncertainties that could cause actual results to differ materially from those forward-looking statements. Potential risks and uncertainties include such factors as product offerings, promotional activities and pricing strategies by competitors; manufacturing operation expansion initiatives; acquisition integration costs; warranty expenses; foreign currency exchange rate fluctuations; environmental and product safety regulatory activity; effects of weather; commodity costs; uninsuredproduct liability claims; uncertainty in the retail and wholesale credit markets; performance of affiliate partners; changes in tax policy and overall economic conditions, including inflation, consumer confidence and spending and relationships with dealers and suppliers. Investors are also directed to consider other risks and uncertainties discussed in our 2015 annual report and Form 10-K filed by the Company with the Securities and Exchange Commission. The Company does not undertake any duty to any person to provide updates to its forward-looking statements.
The data source for retail sales figures included in this presentation is registration information provided by Polaris dealers in North America and compiled by the Company or Company estimates. The Company must rely on information that its dealers supply concerning retail sales, and other retail sales data sources and this information is subject to revision.
Non-GAAP Measure - Constant Currency Reporting. This presentation includes information regarding the Company’s 2016 expectations on a constant currency basis, which is a non-GAAP measure, as well as on a GAAP basis. For purpose of comparison, the results on a constant currency basis uses the respective prior year exchange rates for the comparative period to enhance the visibility of the underlying business trends, excluding the impact of translation arising from foreign currency exchange rate fluctuations.
22
APPENDICES
March 8, 2016
2016 Full Year Guidance DetailPolaris Customer Usage ProfilesN.A. Retail Sales & Dealer InventoryConsistent Financial Performance2016 Full Year Gross Profit Margin GuidanceForeign Currencies Exposures for PolarisPolaris Financial PositionIncome from Financial Services – FY 2015Manufacturing LocationsSpirit Lake Motorcycle ProductionHuntsville UpdateInternational OverviewPolaris-Eicher JV Product - MULTIX

Earnings Per Share (diluted)Gross Profit Margin
23March 8, 2016
Total Company Sales
$4,719
2015 Actual FY 2016Guidance
28.4%
2015 Actual FY 2016Guidance
2016 Guidance Range Wider Signaling Currency/End-Markets Risk
$6.75
2015 Actual FY 2016Guidance
AssumptionsMaintain/grow market shareDealer inventory about flat
Segment ExpectationsORV/Snowmobiles
Flat to mid-single digits %Motorcycles
high-teens %Global Adjacent Markets
mid-single digits %
AssumptionsF/X = minus ~90 bpsHuntsville start-up Q2’16Commodities positive
AssumptionsF/X = minus ~55¢ per shareShare count down 1% to 2% (2.9M share repurchase
authorization remaining; +7.5M authorization in Jan. 2016)
Net income $ down 1% to 10%
2016 FULL YEAR GUIDANCE
2% to 3%
Constant CurrencyFlat to 5%
Constant CurrencyFlat to 50 bps
Constant CurrencyFlat to 9%
$6.75 to $7.35
8% to %$6.20 to $6.8090 to 140
bps
Other 2016 ExpectationsOperating expenses: Slight improvement as a % of salesIncome from financial services: In-line with total company salesIncome taxes: Approx. 35% of pre-tax incomeInternational sales: low to mid-single digits %PG&A sales: Grow faster than overall company

SnowmobilesMotorcycles
POLARIS CUSTOMER USAGE PROFILES
March 8, 2016
Off-Road Vehicles
24
Die-Hard "Biker"
Motorcycle Enthusiast
Show-off Rider
Commuter RiderWeekend
Rider
Trail/ Touring
Off-Trail/ Deep Snow
On/Off Trail Recreation/
Utility
AVERAGEAGE 50 43 44 43 47 52 56 42
INCOME ~$100k ~$100k -- ~$90k ~$90k ~$100k - $125k $160k ~$90k
MALEFEMALE
91%9%
91%9%
98%2%
87%13%
75%25%
90%10%
95%5%
90%10%
PRIMARYUSE
Work & PlayFarm/Ranch
Property Maint.Rec/Trail
Hunt
Mostly PlayRec/Trail
DunesProperty
Play & Work Rec/TrailProperty
Farm/Ranch
Work & PlayRec/Trail
Property Maint.Hunt
Rec/TrailHuntUtility
Cruising, Day tripsaround town
Commute
Cruising, Day trips,Commute
Recreationon & off trail
Trail Riding
Private Property Maintenance
Farm/Ranch
Hunt/Fish
Desert/Dunes
MY15, except GENERAL (MY16)

Polaris Industry
N.A. RETAIL SALES & DEALER INVENTORY – FY 2015
Polaris N.A. retail 5% for 2015; 2H trends weaker, but YoY
Industry retail flat for 2015; 2H trends weaker; low-single digits %Polaris year end 2015 N.A. dealer inventory 5% vs 2014
ORV mid-single digits, Snowmobiles over 25%, Motorcycles over 50%; Global Adjacent Markets ORV Q4 shipments reduced significantly
2010 2011 2012 2013 2014 20152014 2015
Market Share Growth Continued; Achieved Dealer Inventory Targets
N.A. Dealer InventoryN.A. Powersports Market Share & Retail Sales
March 8, 2016 25
-0%
5%
Consolidated Market Share in UnitsUsing Total Motorcycle Industry
FY Retail SalesMarket Share-5% Existing ORV Models
2% New ORV models
5% Snowmobiles
2% Slingshot/Indian
1% New Dealers
5% Total Increase
+5%Grew
Share in 2015

39% 40% 39% 38%32%
12%
20%26%
16% 13%
9% 9% 9% 9% 8%2011 2012 2013 2014 2015
163%
68% 69% 55% 59%
Polaris PeerAvg.
S&P500
S&PMidcap
400
DJIA
Return on Invested CapitalReturn on Assets
CONSISTENT FINANCIAL PERFORMANCE
26March 8, 2016
Sales & Net Income
+33%$2,657
+21%$3,210
+18%$3,777
+19%$4,480
+5%$4,719
$3.20+50%
$4.40+38%
$5.40+23%
$6.65+23%
$6.75+2%
2011 2012 2013 2014 2015Sales EPS
20%23% 23% 23%
21%
6%10%
13%9%
7%
3% 3% 3% 4% 3%
2011 2012 2013 2014 2015
Industry-Leading Returns
$0.90
$1.48$1.68
$1.92$2.12 $2.20
2011 2012 2013 2014 2015 2016
46% 45%
71%
53%46%
2011 2012 2013 2014 2015
Return on Shareholder EquityDividends (per share)5-Year Total Return
5-Year CAGRSales 19%Net Income* 25%
Polaris Peer Average (ACAT, BC, DE, DOO, HOG, WGO, TTC) S&P 500 Average
5-year (2011-2015) CAGR 22%March 2, 2011 – March 2, 2016(Including Dividend Yield)
* From Continuing Operations
Expectations

2016 GROSS PROFIT MARGIN GUIDANCE
27March 8, 2016
By Component FY 2015 Actual FY 2016 GuidancePrior period 29.4% 28.4%Production volume/capacity toProduct cost reduction effortsCommodity costsCurrency ratesHigher selling pricesProduct mixMotorcycle Production ConstraintsNew plant start-up costsWarranty costsDepreciation/Tooling amortizationSales promotional costsCurrent period 28.4% 27.0% to 27.5%Change -108 bps Down 90 to 140 bps
By Reporting Segments FY 2015 Actual FY 2016 GuidanceORV/Snowmobiles 32.1%Motorcycles 13.9%Global Adjacent Markets 27.0%Gross Profit Margin 28.4%
Improvement to gross profit margin % Headwind to gross profit margin % Neutral to gross profit margin %

Significant Impact in Q4 & Full Year 2015, Expected to Persist into 201628
FOREIGN CURRENCY EXPOSURE FOR POLARIS
March 8, 2016
Foreign Currency Hedging Contracts Currency Impact on Net IncomeNotional Avg. Exchange Compared to Prior Year Period
Foreign CurrencyCurrencyPosition
Cash FlowExposure Hedged
Amounts(US $ in Millions)
Rate of OpenContracts
FY 2016(Expectation)
Canadian Dollar (CAD) Long 30% $82 $0.77 to 1 CAD Negative
Australian Dollar (AUD) Long 60% $20 $0.71 to 1 AUD Negative
Euro (EUR) Long 0% - - Negative
Japanese Yen (JPY) Short 40% $10 120 Yen to $1 Positive
Mexican Peso (MXN) Short 80% $33 16 Peso to $1 Positive
F/X Impacts vs. Prior Year($ in millions)
ActualFY 2015
FY 2016 Expectations*
Sales ($160) ($80)
Gross Profit ($70) ($80)
Pretax Income ($70) ($55)
*Assumes exchange rates remain at approximately the rate at the end of 2015 and exchange rates remain unchanged at both upper and lower ends of guidance range.
Open 2016 F/X Hedging Contracts as of December 31, 2015

POLARIS FINANCIAL POSITION
29March 8, 2016
Capital Summary Dec. 2015Cash DriversFav/(Unfav)Dec. 2015
Cash $ 155.3 +13%Debt /Capital Lease Obligations $ 463.3 (105%)Shareholders’ Equity $ 981.5 14%Total Capital $1,444.8 33%
Debt to Total Capital 32% (11%)
2015
Operating cash flow 17%; factory inventory +144M vs. 2014
Increased share repurchases given current stock price
Cap Ex expected to be slightly higher than 2015Reflects Huntsville, Spirit Lake Investments
Cash Flow significantly due to factory inventory
Operating Cash Flow
Strong Balance Sheet and Cash Flow Generation
ROIC*
CashYE 2014
OperatingActivities
Dividends Capex NetBorrow-
ings
ShareRepur-chase
Other CashYE 2015
$138
$440 $139$249 $246 $294
$13 $155
$529$440
FY 2014 FY 2015 2016
38% 32%
FY 2014 FY 2015
*Defined as trailing 12 months net income divided by average total assets, minus average current liabilities
UpSignificantly
($ millions) ($ millions)
($ millions)
Expectations
17%
2015 Summary
2016 Expectations
Retail CreditWholesale Credit PA Receivables
30March 8, 2016
Income from Financial Services
Other Other
WholesaleCredit
WholesaleCredit
RetailFinancing
RetailFinancing
FY 2014 FY 2015 2016Expectations
FY 2014 FY 2015
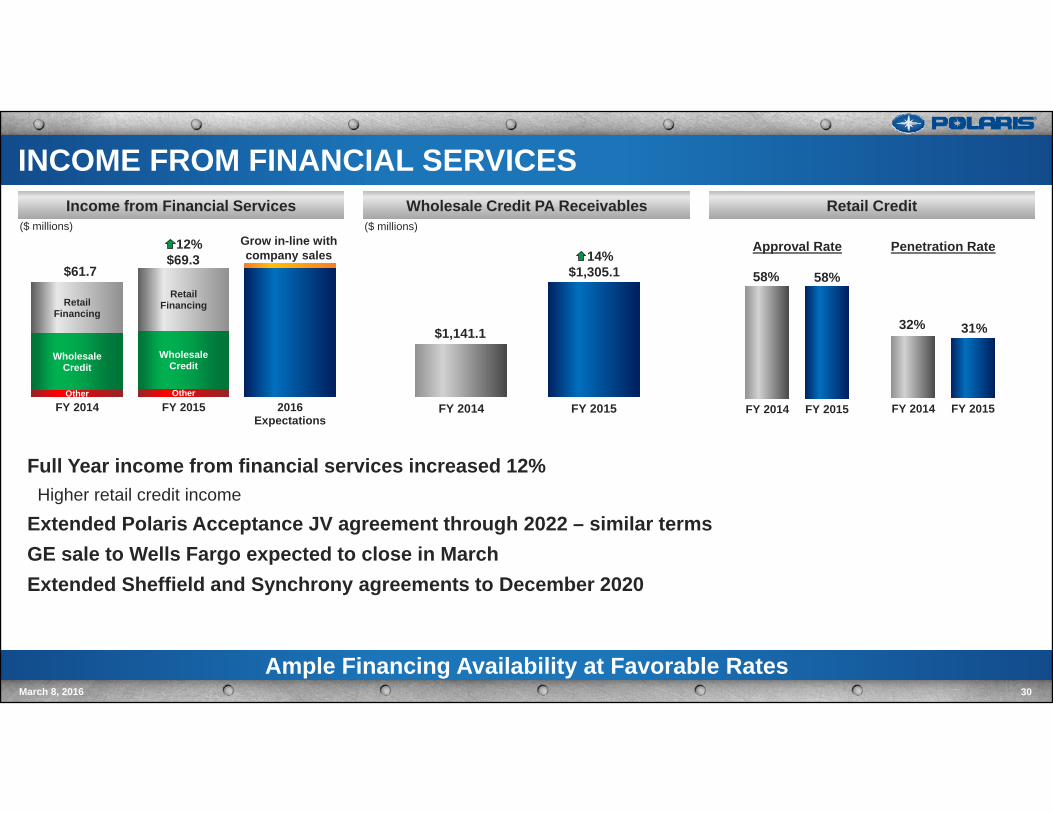
Ample Financing Availability at Favorable Rates
INCOME FROM FINANCIAL SERVICES
Full Year income from financial services increased 12%Higher retail credit income
Extended Polaris Acceptance JV agreement through 2022 – similar termsGE sale to Wells Fargo expected to close in MarchExtended Sheffield and Synchrony agreements to December 2020
Grow in-line with company sales
$61.7
12%$69.3 14%
$1,305.1
$1,141.1
($ millions) ($ millions)
32% 31%
FY 2014 FY 2015
Approval Rate Penetration Rate
58% 58%
FY 2014 FY 2015

MANUFACTURING LOCATIONS
31March 8, 2016
16 In-House Manufacturing Facilities Worldwide
Monterrey MEXICO
SxS, Engines
Spirit Lake & MilfordIOWA
Motorcycles,SxS, ACE, GEM
RoseauMINNESOTA
Snow, ATV, SxS
OsceolaWISCONSIN
Engines
BourranFRANCEGoupil
Chanas &Aix-les-Bains
FRANCEAixam Mega
Cuyahoga FallsOHIO
KolpinRiverside,
CALIFORNIA Pro Armor
Shanghai, CHINA
Hammerhead
HuntsvilleALABAMA
(2016)SxS, Slingshot
OpolePOLANDATV, SxS
JaipurINDIA
Eicher JV
SandpointIDAHO
Timbersled
SpearfishSOUTH DAKOTAMotorcycle Paint
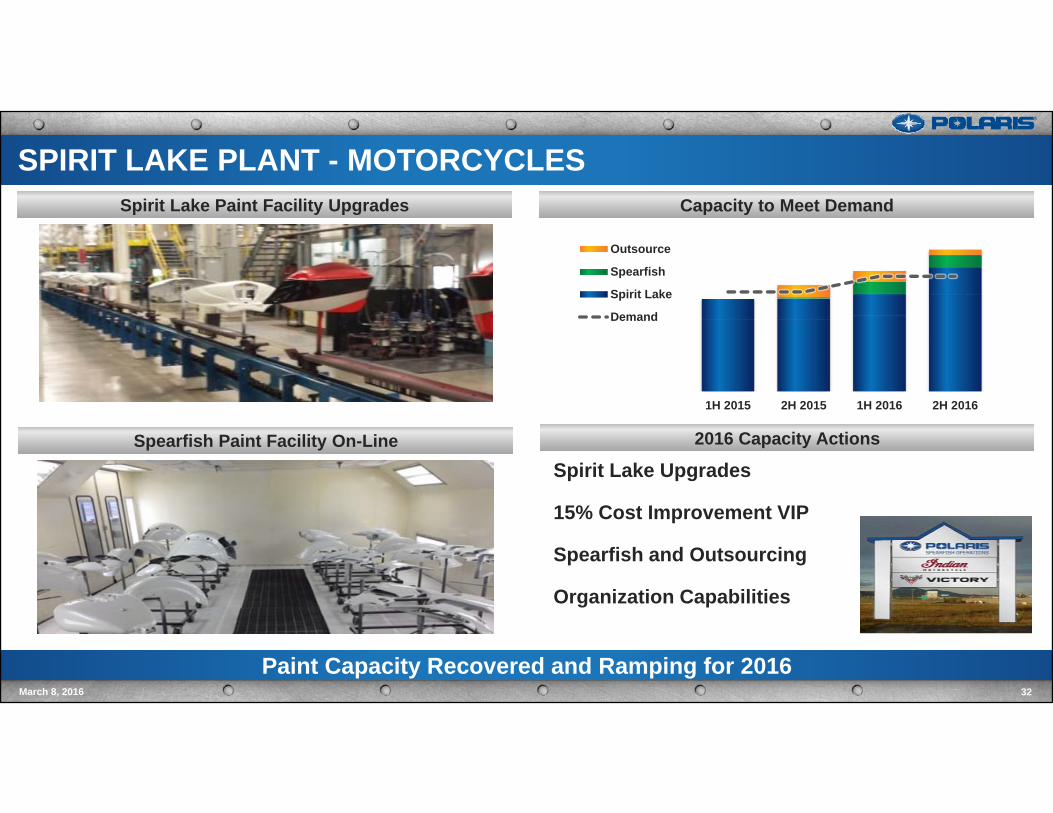
SPIRIT LAKE PLANT - MOTORCYCLES
32March 8, 2016
Capacity to Meet DemandSpirit Lake Paint Facility Upgrades
Spirit Lake Upgrades
15% Cost Improvement VIP
Spearfish and Outsourcing
Organization Capabilities
2016 Capacity Actions Spearfish Paint Facility On-Line
Paint Capacity Recovered and Ramping for 2016
1H 2015 2H 2015 1H 2016 2H 2016
Outsource
Spearfish
Spirit Lake
Demand
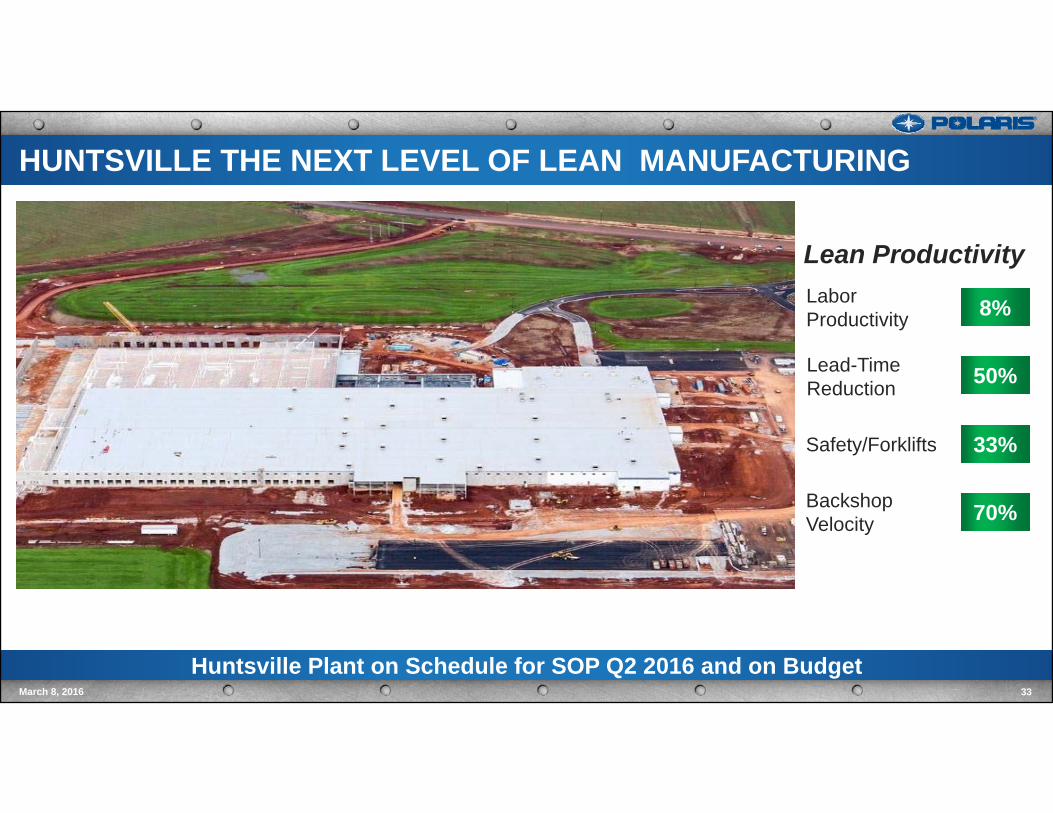
Huntsville Plant on Schedule for SOP Q2 2016 and on Budget
HUNTSVILLE THE NEXT LEVEL OF LEAN MANUFACTURING
33March 8, 2016
8%
50%
33%
70%
Labor Productivity
Lead-Time Reduction
Safety/Forklifts
Backshop Velocity
Lean Productivity

INTERNATIONAL
34March 8, 2016
Overcome Currency Challenges, Grow Share, Leverage Opole
($ millions)
Latin AmericaAsia Pacific
(includes Australia/New Zealand)
EMEA
$685 $652
FY 2014 FY 2015
5%(cc +10%) Motor-
cycles ORV / Snow Global
AdjacentMarkets
($ millions)
43%(cc +66%)
6%(cc +21%)
$526$466
2014 2015
12%(cc +2%)
$48$69
2014 2015
$111 $117
2014 2015
2016 Objectives
Drive motorcycle growth
Effectively leverage global operations
Continue to build emerging market foundation
Improve execution
International Sales
Includes PG&A
International Sales by Region

POLARIS - EICHER JV PRODUCT - MULTIX
March 8, 2016
MULTIXMulti-Role Personal Vehicle3 models to start; MSRP ~ $3,600 - $4,500
511cc diesel engine
Street legal in India
~30 dealers at launch >200 by 2020Started production July 2015; initial consumers satisfied; initial retail ramp slower than expectedTarget market potential >60 million people
Small/micro business owners in India
Signed July 2012; 50/50 Joint Venture in IndiaFactory in Jaipur, India – 200,000 sq. ft.JV expected to be profitable by 2018
JV Overview
Unique Vehicle Platform Designed Specifically for the Multi-Role Consumer
Replaces
35


![VED - Supreme Court of Ohio AFFIDAVIT BY;Raymond Dean Austin [SURETY] RAYMOND DEAN AUSTIN [DEBTOR] TO ALL AND SUNDRY TO WHOM THESE LETTERS/PRESENTS/PATENTS SHALL COME TO ANY/ALL MAGISTRATES](https://img.pdfslide.us/doc/110x75/606d6f01020c195d6f0644dd/ved-supreme-court-of-affidavit-byraymond-dean-austin-surety-raymond-dean-austin.jpg)


![Technical Bulletin - Polaris - Polaris 9300 Sport & Polaris 9300xi Sport[1]](https://img.pdfslide.us/doc/110x75/553b235d4a7959d8258b463f/technical-bulletin-polaris-polaris-9300-sport-polaris-9300xi-sport1.jpg)